Article

Module to Support Real-Time Microscopic Imaging of Living Organisms on Ground-Based Microgravity Analogs

1
ISS Utilization and Life Sciences, NASA John F. Kennedy Space Center, KSC, Merritt Island, FL 32899, USA
2
Universities Space Research Association, Columbia, MD 21046, USA
3
Department of Botany, University of Wisconsin Madison, Madison, MI 53706, USA
4
Department of Biomedical Engineering, Columbia University, New York, NY 10027, USA
5
Icahn School of Medicine at Mount Sinai, New York, NY 10029, USA
6
Prototype Development Laboratory, NASA John F. Kennedy Space Center, KSC, Merritt Island, FL 32899, USA
7
Department of Biomedical Engineering, Arizona State University, Tempe, AZ 85281, USA
*
Authors to whom correspondence should be addressed.
Appl. Sci. 2021, 11(7), 3122; https://doi.org/10.3390/app11073122
Submission received: 10 February 2021 / Revised: 24 March 2021 / Accepted: 27 March 2021 / Published: 1 April 2021
(This article belongs to the Special Issue Advances in Space Biology: Cell Behavior in Microgravity)

Abstract

:
Since opportunities for spaceflight experiments are scarce, ground-based microgravity simulation devices (MSDs) offer accessible and economical alternatives for gravitational biology studies. Among the MSDs, the random positioning machine (RPM) provides simulated microgravity conditions on the ground by randomizing rotating biological samples in two axes to distribute the Earth’s gravity vector in all directions over time. Real-time microscopy and image acquisition during microgravity simulation are of particular interest to enable the study of how basic cell functions, such as division, migration, and proliferation, progress under altered gravity conditions. However, these capabilities have been difficult to implement due to the constantly moving frames of the RPM as well as mechanical noise. Therefore, we developed an image acquisition module that can be mounted on an RPM to capture live images over time while the specimen is in the simulated microgravity (SMG) environment. This module integrates a digital microscope with a magnification range of 20× to 700×, a high-speed data transmission adaptor for the wireless streaming of time-lapse images, and a backlight illuminator to view the sample under brightfield and darkfield modes. With this module, we successfully demonstrated the real-time imaging of human cells cultured on an RPM in brightfield, lasting up to 80 h, and also visualized them in green fluorescent channel. This module was successful in monitoring cell morphology and in quantifying the rate of cell division, cell migration, and wound healing in SMG. It can be easily modified to study the response of other biological specimens to SMG.

1. Introduction

The spaceflight environment influences physiological changes in biological molecules, cells, tissues, and organs. Microgravity (10−3 to 10−6 of 1 g) is one of the most prominent stressors that organisms experience during spaceflight, and is known to induce epigenetic and structural changes in cells. In humans, long-term microgravity exposure has been associated with conditions such as delayed wound healing, muscle atrophy, bone density loss, cardiovascular deconditioning, immune dysregulation, and ocular changes, making it a serious challenge to extended human habitation in space [1]. As space exploration progresses toward long-duration crewed missions to the Moon and Mars, it is important to understand the mechanisms by which microgravity affects physiology in order to accurately assess health risks and to develop effective countermeasures.
The processes of gravity-sensing, signal transduction, and gravity-mediated cell adaptations are still not fully understood, primarily due to the limited spaceflight opportunities and the costs associated with them. Microgravity analogs for research on Earth include parabolic flights, high-altitude drops, and sounding rocket tests; however, these platforms offer only a few seconds to minutes of microgravity, require specialized hardware for travel and sustained functioning in the microgravity environment, and are often cost prohibitive. Microgravity simulation devices (MSDs) provide ground-based simulated microgravity (SMG) platforms that enable greater opportunities for gravitational biology research and provide an opportunity to test hypotheses, parameters, and experimental conditions, thereby providing preliminary data before venturing into the true microgravity of space [2,3,4].
MSDs function by averaging the gravity vector to zero over time and ensuring that gravity does not act in a constant direction for longer than a few seconds. The random positioning machine (RPM) is a type of MSD that randomizes the gravity vector in three-dimensional space through continuous random rotation along two axes. In many cases, the effects of SMG on samples may be functionally comparable to that of true microgravity if the gravity vector’s direction changes faster than the sample’s response time to the change [5]. Under these conditions, living objects such as mammalian cells and plants are suitable candidates for microgravity simulation studies [6].
Microscopy is widely used to analyze cellular structures and processes such as cell division, proliferation, cell cycle, and wound healing, and to measure various parameters of tissue growth and development in cells. Many studies on SMG-induced cellular changes require the extrapolation of data deduced from images that are acquired on a microscope in the 1g environment after the samples are exposed to SMG, which fails to completely capture the series of events and mechanisms that lead up to a response. The real-time microscopic monitoring of samples during SMG exposure is beneficial for studying rapid and choreographed cellular processes such as cytoskeleton reorganization and morphological changes [6,7].
Until recently, the continuous real-time imaging of living specimens was not routinely available on the RPM and other 3D clinostats, and the analysis of the effects of microgravity on biological samples in spaceflight and in SMG were routinely performed a posteriori the fixation of specimens. Microscopes used in the physical sciences for microgravity research can withstand the vibrations of microgravity analogs but have poor imaging performance and low numerical apertures that render them incapable of the high magnification needed for cellular imaging. Digital holographic microscopy (DHM) for full-scale RPMs was recently developed and has successfully detected cell morphology changes and cytoskeletal alterations in real-time for up to 1.5 h [8]. However, light microscopy modalities such as classical brightfield and fluorescence microscopy have not yet been implemented for live microscopy during SMG experiments, and no technology currently exists for microscopy on the desktop RPM.
We have successfully developed and demonstrated, for the first time, a novel module that is suitable for real-time brightfield and fluorescence microscopic imaging of living organisms undergoing microgravity simulation on a desktop RPM. Computer-aided design (CAD) and 3D-printing technology were used for the design and implementation of the module. The module was validated in microgravity simulation experiments with living mammalian cell samples, and time-lapse footage was obtained for experiments lasting up to 80 h. The stability of the system during mechanical disturbances was enhanced using post-processing algorithms. Our results highlight the potential application of real-time microscopic observation and imaging in microgravity simulation devices to study the impact of altered gravity on cellular and subcellular processes.

2. Materials and Methods

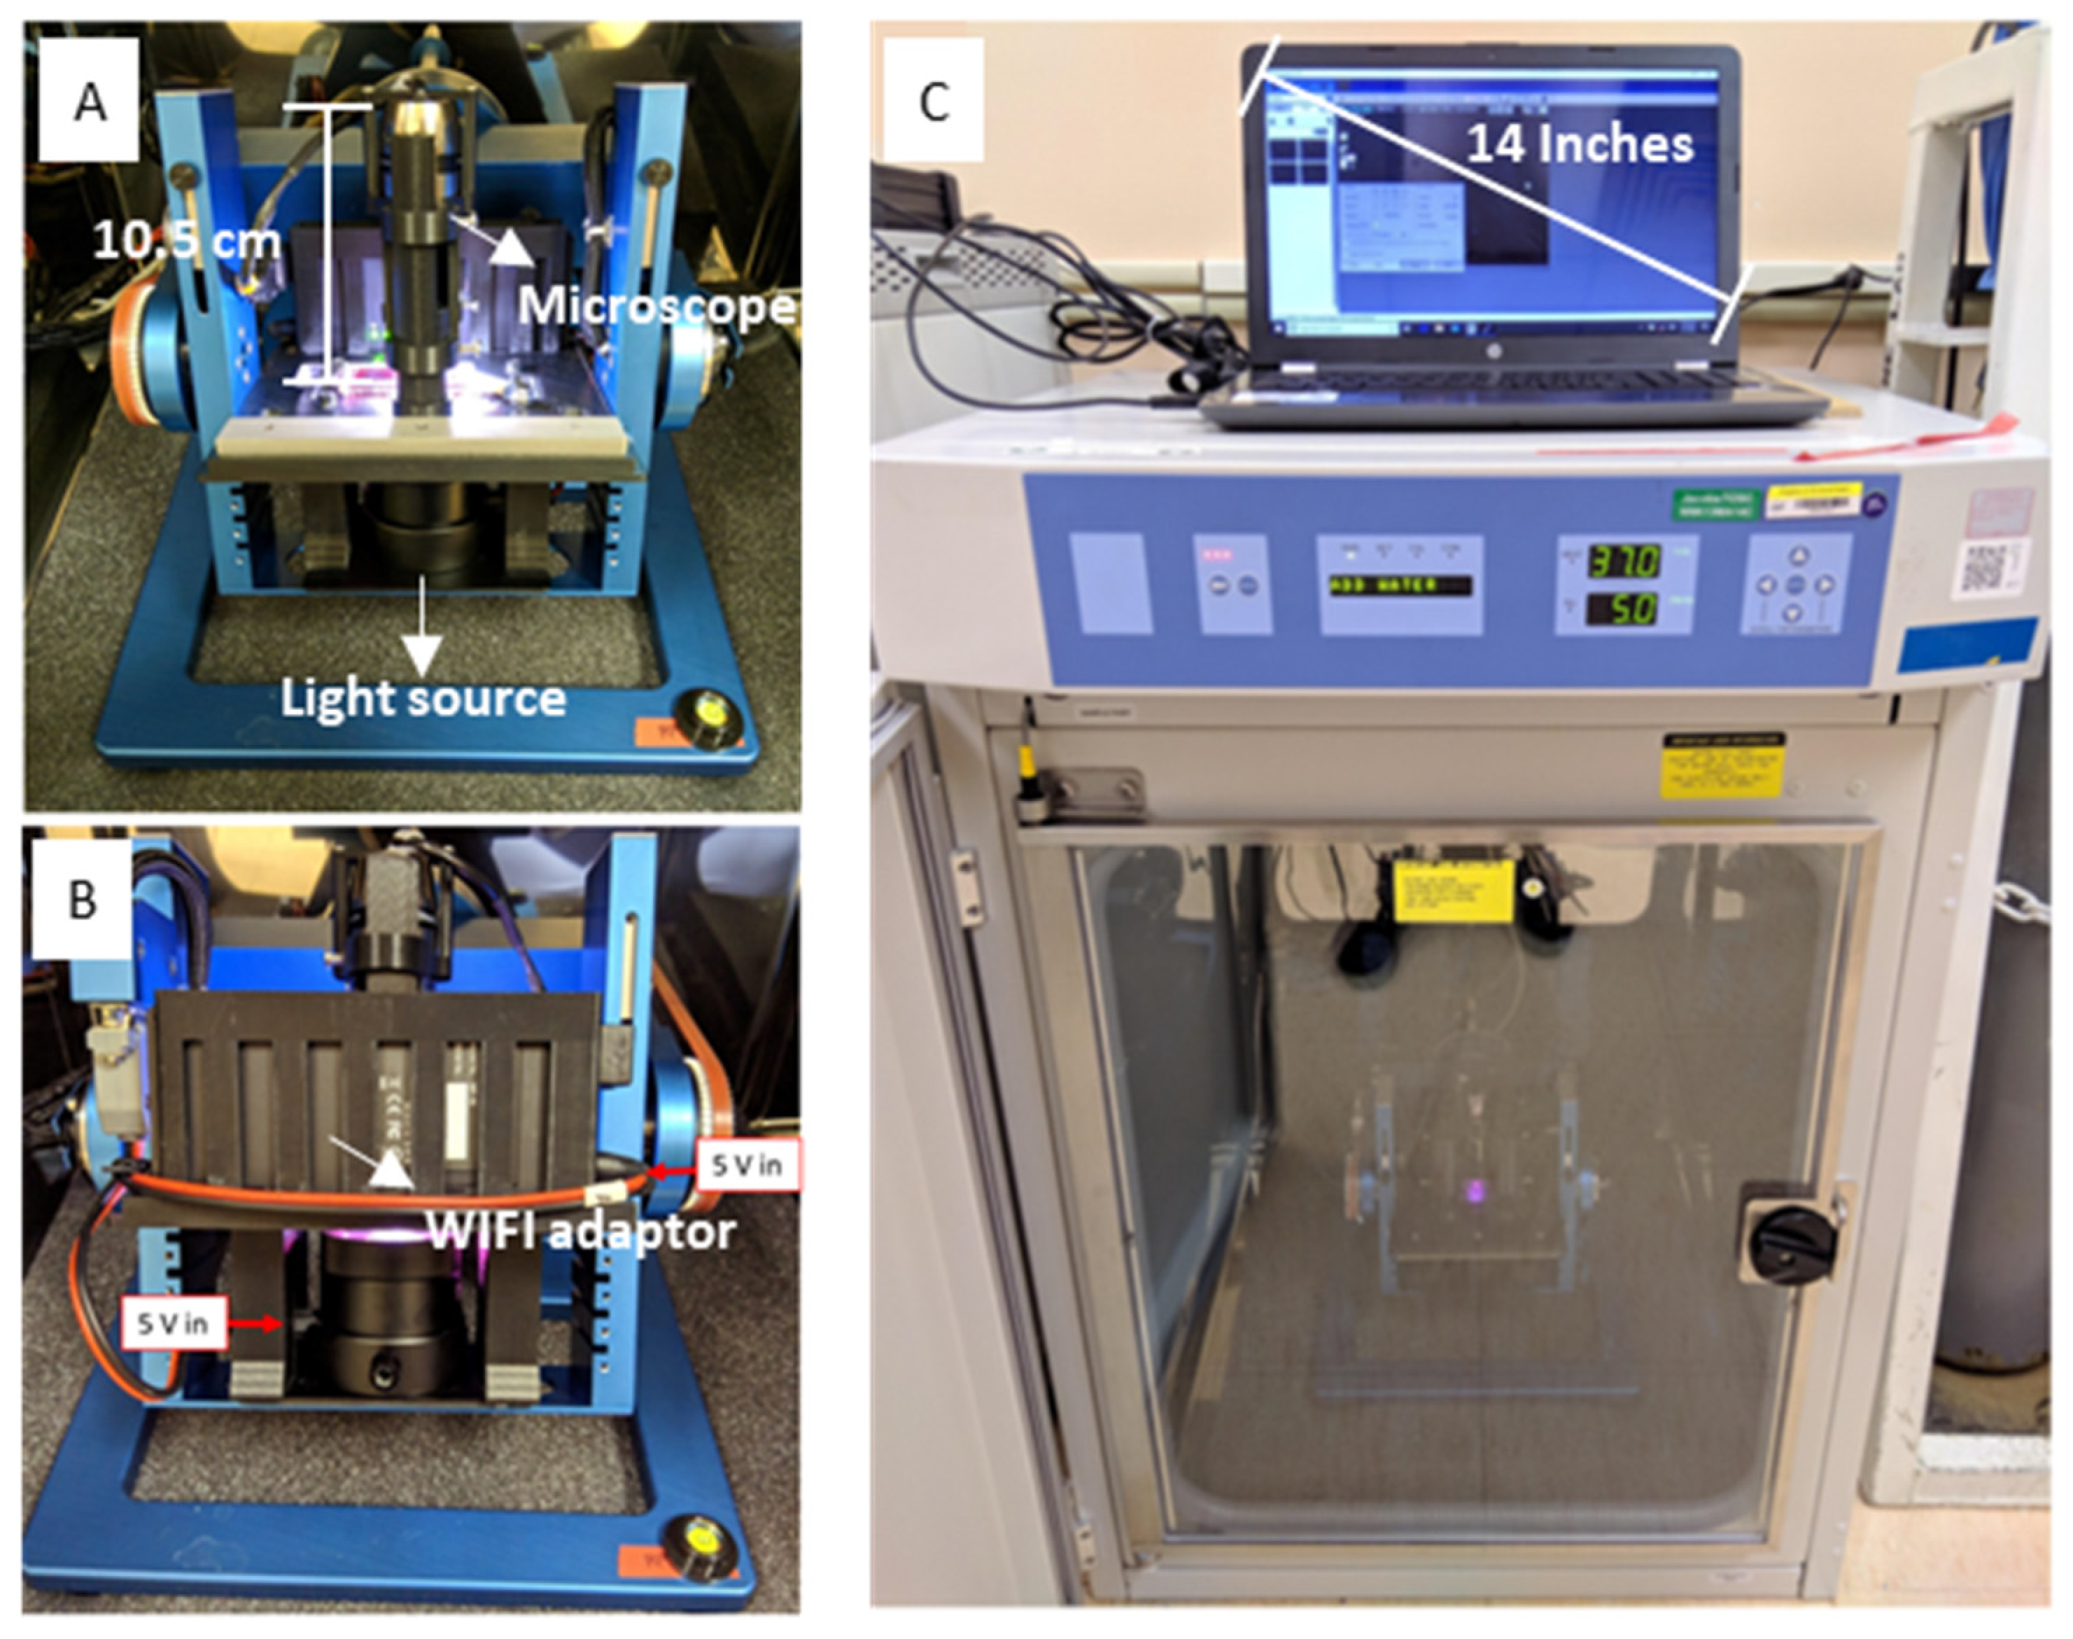
2.1. Microscopy Module Fabrication and Implementation

The CAD model of the microscopy module assembly is shown in Figure 1A. The model integrates (1) an AM7515MT8A brightfield/darkfield or AM7515MT8A-GFBW fluorescence 5 MP Dino-Lite Edge Series microscope [9] (AnMo Electronics Corporation, New Taipei City, Taiwan, ROC, through Dunwell Tech, Torrance, CA, USA) (or can accommodate any digital handheld microscope with a length <10.5 cm), (2) a WF-10 WiFi adaptor for live streaming, and (3) a BL-CDW Brightfield/Darkfield Backlight Illuminator (AnMo Electronics Corporation) that makes a collimated beam, which reduces scattered light. The pictured module is designed to accommodate biological cell and tissue culture samples contained in ibidi µ-Slide I0.8 Luer slides (ibidi GmbH, Gräfelfing, Germany, 80196) or within Thermo Scientific Nunc SlideFlasks (ThermoFisher, Waltham, MA, USA, 170920). The design of the module can be easily modified to accommodate other tissue culture holders within acceptable dimensions.
All CAD models were designed using either SolidWorks (Dassault Systèmes, Waltham, MA, USA, 2018) or DesignSpark Mechanical (RS Components Ltd., Fort Worth, TX, USA, 2019) software. The components were 3D-printed using ABS-M30 black thermoplastic material with soluble supports on a Stratasys Fortus 450 mc housed in the Prototype Development Lab at the NASA Kennedy Space Center. Compared to standard ABS, ABS-M30 is stronger and exhibits better layer bonding for the creation of a more durable part. The thermal properties of the material are also compatible for use in the 37 °C environment of the CO2 incubator, as the 99 °C Vicat softening temperature for ABS-M30 is considerably greater than the temperatures that the module will reach during experimentation within the incubator. The black opaque color of the material was selected to mitigate the effects of light refraction and reflection that may interfere with the microscopy image. Once printed, the components were treated in lye to remove the support material, rinsed with water, dried with compressed air, and air-dried overnight. The final 3D-printed pieces of the module were opaque, black, and rigid. We installed #6-32 steel helical threaded inserts on the attachment points of the microscope clamp and the stage legs. All other attachment points were tapped using a #35 drill bit to accommodate #6-32 screws. A 144 g steel block counterbalance was installed on the module to ensure that the field of view of the microscope was located at both the center of gravity and the center of axis of rotation. The overall weight of the system was 1.1 kg and the dimensions were approximately 14.7 cm × 15.9 cm × 15 cm. The final printed and assembled microscopy module is shown in Figure 1B. The system was designed with modular components to allow for greater versatility and customization of the platform and to be integrated with other microgravity simulation devices such as 2D and 3D clinostats.

2.2. Microscopy Module Experimental Setup

The brightfield/darkfield microscope was secured in the microscope clamp and connected to the WiFi streamer via USB 2.0 (Figure 2A). The built-in power supply provided a continuous 5 V to the WiFi streamer and the backlight illuminator, as shown in Figure 2B. The backlight illuminator propagated light through the specimen, which was collected by the microscope’s image sensor at a resolution of up to 2592 × 1944 pixels. The image was transmitted wirelessly to the computer via the WiFi streamer, where it was loaded onto the DinoCapture 2.0 software (AnMo Electronics Corporation, Taiwan, ROC, through a regional distributor, Dunwell Tech, Torrance, CA, USA) for real-time viewing and storage for offline analysis [9]. The DinoCapture 2.0 software can be used to determine the magnification of the image as well as to switch between the LED (light-emitting diode) light sources on the microscope. The software can also be used to adjust the acquisition speed of the images. Time-lapse images were acquired every 15 s during experimentation via the DinoCapture 2.0 software, and the playback was adjusted to 15 frames/s.
The same configuration was utilized for fluorescence microscopy. The backlight was manually switched off for image acquisition when using the fluorescence microscope. The LEDs built into the microscope served as the excitation source. In this instance, the sample was excited with 480 nm LEDs with a 510 nm emission filter, allowing for the visualization of the nuclei of cells treated with the SYTO 9 Green Fluorescent Nucleic Acid dye. Similar microscopes with other light-emitting diodes can be readily incorporated into the module and operated similarly to the microscope with the 480 nm LEDs reported here.

2.3. Microgravity Simulation Platform

Microgravity conditions are simulated by RPMs through the principle that the net gravity vector on the sample is averaged to zero over time. The random rotation of each frame of the RPM is regulated by separate motors, each controlled by the software. The microscopy module was installed onto the Desktop RPM 2.0 (Airbus Defense and Space Netherlands, Leiden, The Netherlands), as shown in Figure 2A. All experiments described here were conducted in the Microgravity Simulation Support Facility (MSSF) at the NASA Kennedy Space Center (KSC). The RPM was placed on a soft foam sheet to reduce vibrations introduced by the surroundings. The experimental setup was maintained in a Thermo Scientific Forma Steri-Cult incubator (ThermoFisher, 3310) at 37 °C and 5% (v/v) CO2, as shown in Figure 2C. The simulations lasted up to 80 h.

2.4. Cell Culture Preparation

Human skin fibroblast AG01522 cells (Coriell Institute, Camden, NJ, USA) were cultured in Invitrogen Minimum Essential Medium Eagle—alpha modification (Alpha MEM) (ThermoFisher, 11900-024) with 10% (w/v) heat-inactivated fetal bovine serum (ThermoFisher, 10082-147), 0.1% (w/v) penicillin-streptomycin (ThermoFisher, 15140-122), and 7.5% (w/v) Gibco sodium bicarbonate (ThermoFisher, 25080). The cells were maintained in an environmental chamber with the temperature set to 37 °C, the CO2 level at 5% (v/v), and the relative humidity controlled at 100%. Four hours prior to experiment initiation, the cells were seeded at 40% density in either µ-Slide I0.8 Luer channel slides covered by male Luer plugs (ibidi GmbH, 10822) or SlideFlasks tightened by rubber flask stoppers. Air bubbles were carefully removed using a micropipette or two 26 G syringes prior to securing the sample onto the stage of the microscopy module. For fluorescence microscopy, the cells were treated with a final concentration of 5–10 µM of Invitrogen SYTO 9 Green Fluorescent Nucleic Acid Stain (ThermoFisher, S34854) for 30 min prior to experimentation. The dye binds to the minor groove of the DNA, allowing the visualization of nuclei within living cells. Wound healing assay was tested using a confluent cell culture in a SlideFlask with a wound created by scraping across the monolayer using a 26 G needle before being placed on the RPM.

2.5. Image Stabilization Methods and Analysis

The changing angle of rotation and the speed of the RPM rotating frames introduced mechanical noise that resulted in cyclical axial and lateral drifts in the acquired images. The vibrations in the incubator and its surroundings also introduced perturbations in the data. While the design of the microscopy module accounts for the axial drift of the microscope and sample, there were still some small-scale vibrations (mainly in the lateral directions). The translational movements due to mechanical noise were corrected for using the ImageJ software program (U.S. National Institutes of Health). The raw time-lapse videos were converted to AVI format using FFmpeg. The converted video was then imported into ImageJ (version 1.52a) to be processed frame-by-frame. The translational movements in the images were removed using the Lucas–Kanade algorithm in the Image Stabilizer plugin (https://imagej.net/Image_Stabilizer, accessed on 30 March 2021).

3. Results and Discussion

The microscopy module was successfully fabricated and validated in the MSSF at KSC. Using the real-time imager module, we were able to acquire time-lapse images of AG01522 (human skin fibroblasts) in brightfield while the cells in SlideFlasks were being exposed to SMG on an RPM. The results presented here are mainly from experiments on an RPM using the brightfield microscopy module with the time-lapse image acquisition set at every 15 s over the duration of 24 h microgravity simulation. The maximum duration of brightfield image acquisition reached up to 80 h without interruptions. These tests focused on validating and demonstrating the performance of this live cell imaging module while rotating on an RPM.

3.1. Brightfield Images and Videos

Time-lapse movies were constructed from the stabilized time-series images. In the microgravity simulation movie, migrating cells, nuclei, nucleoli, and cellular structures are visible in a field of view of approximately 560 µm × 400 µm (Figure 3 and Supplementary Materials Video S1). The particles outside of the cells in the surrounding media are also visible passing through the field of view but have a negligible effect on the image quality and post-acquisition process. The movement of cell lamellipodia, the emergence of cell protrusions, and the dynamic cell-to-cell interactions can also be observed. From these acquired real-time images in SMG, we demonstrate here that multiple measurable endpoints can be quantified and analyzed to understand various cellular functions.

3.2. Cell Cycle

Rates of cell division and proliferation are known to be altered in response to microgravity in both human and plant cells [10,11,12,13,14]. Mitosis is a crucial phase in the cell cycle that determines the fate of the daughter cells. We know of no previous study that measured the dynamics of the cell cycle in SMG. With the live-imaging module, we captured real-time images of dividing cells in SMG. Figure 3A shows sequential images of an AG01522 cell dividing over a period of 60 min, which demonstrates the ability to capture the dynamics and delay occurring during mitosis in SMG. A total of fourteen complete cell divisions were recorded from the 24 h time-lapse images and movies. Using these brightfield images, we could measure the kinetics of the M phase of the cell cycle by measuring the time taken between the breakdown of the nuclear envelope and the formation of the two daughter cells. One of the measurements showed that the average time elapsed for the dividing cells to progress from anaphase to G1 on RPM was 31.3 ± 10.5 min, which demonstrates that quantitative measurements can be achieved using this module.
It is well established that cytoskeletal elements are disrupted in cells exposed to both SMG and true microgravity. Microtubules and the actomyosin network are required for positioning chromosomes during mitosis [15]. With this imaging capability, we will be able to investigate how the cytoskeletal disorganization may be affecting the cell-cycle dynamics.

3.3. Cell Migration

The typical features of migrating cells (e.g., endothelial, neuronal, immune, and epithelial cells) are the lamellipodia at the leading edge and trailing edges. These membrane protrusions consist of dense networks of actin filaments that generate active actomyosin contractile and tensile forces that are crucial for cell motility, migration, and nuclear positioning, which are known to be affected by microgravity [16]. With the live time-lapse images captured using this module, we were able to track the lamellipodial extensions in human skin fibroblasts in real-time under SMG conditions (Figure 3B), similar to the lamellipodial formations previously described and characterized in SMG [17]. Therefore, the distance moved by the leading edge from its initial position over time could be measured in a sample while rotating on the RPM.

3.4. Wound Healing

Several types of cells (e.g., platelets, neutrophils, macrophages, and fibroblasts) are involved in the complex process of wound healing in response to physical trauma. The analysis of the recovery dynamics of a wounded tissue can provide insight into normal cell function. Several cytokines, chemokines, and growth factors are known to be differentially expressed in cells exposed to microgravity, each of which play a crucial role in the process of wound healing [18,19]. Therefore, it can be hypothesized that the wound recovery process and its dynamics are impaired in the microgravity environment. Live imaging provides the opportunity to study the dynamics of a wound created in a cell culture. As an example, Figure 3C shows the brightfield images of a monolayer of fibroblast cells with a wound created by scraping across the monolayer using a 26 G needle. Time-lapse images were captured using the USB-microscope module for 10 h. As we can clearly visualize the migration of cells closing the freshly created wound, and measure the rate of wound healing in SMG.

3.5. Nuclear Position and Movement

Cell migration, mitosis, and cell differentiation are some of the basic cellular processes that depend on the position and translation of the nucleus in a living cell [15,16,20,21]. The shape of a nucleus and its positioning in a cell depend on various cytoskeletal elements (actin, microtubules, and intermediate filaments) and the motor proteins that generate active forces and are transmitted directly to the nuclear surface through the LINC complex proteins [22,23]. It is well known that the cytoskeleton is disrupted and disorganized in cells exposed to microgravity, which provides a strong basis to investigate how the positioning of the nucleus changes in cells over time. The live images captured over time in SMG allow us to trace the nuclear shape and therefore track its position over time by tracking its centroid, as illustrated in Figure 3D.
In addition to the nuclear position relative to a cell under SMG conditions, which can be analyzed using this module, substructures of a nucleus, such as two nucleoli in a living fibroblasts, can be also studied (Figure 3E). The ability to track the nucleoli gives us the opportunity to measure the angle at which the nucleus is rotating over time in SMG by using the mathematical derivation previously published by Wu et al. [17] that measures the slope of the line joining the two nucleoli. The rotation of the nucleus in a living cell may seem random, but it is a crucial process required for normal cell function. For example, during the development of an oocyte to produce a functional egg, the sequential differentiation of the cell depends on the rotation of the nucleus in the cells [24]. In addition, the rotation of the nucleus depends on the dynein motor proteins which walk on the microtubules [25]. As it is well-established that the microtubule network is disrupted in cells exposed to microgravity [26], it is possible that the nuclear rotation function may also be disrupted in SMG.

3.6. Fluorescence Imaging and Its Applications

With this live-imaging module, we were able to capture a fluorescent image of the nuclei stained with SYTO 9 Nucleic Acid dye. Figure 4 shows the SYTO-9-stained AG01522 cell nuclei, from which we can clearly visualize that the nuclei are smooth and oval-shaped. Nuclei within cells typically maintain a smooth surface and an oval shape. Any abnormality in the shape and position of the nucleus is an indication of disease progression. Zhao et al. previously reported rounded nuclei in cells exposed to SMG for 2 days as opposed to flat nuclei under 1g conditions [7]. This phenomenon was also reported by Neelam et al., showing an altered nuclear shape in epithelial cells at 2 h after SMG exposure [27]. Fluorescently labelled nuclei allow us to quantify various features, such as circularity, projected x-y area, and the major axes and minor axes of the nuclei.
The ability to study the changes in shape and position of the nucleus dynamically over time gives us an opportunity to better understand the cellular and molecular changes occurring in cells exposed to SMG. Furthermore, this fluorescence imaging capability can be utilized for other applications, such as transcription factor or gene expression analyses using reporter gene assays [28] and particle internalization assays [29].

3.7. Development and Optimization

There remain notable areas of improvement for the present design of the microscopy system and microgravity simulation experiments. A novel microscope clamp and stage design in a quadripod manner is currently under development to enable greater stability and support for the microscope during microgravity simulation. In addition, the current module is designed to accommodate adherent cell samples seeded in channel flasks and SlideFlasks; to allow for greater versatility of the module, the sample holder stage component will be modified to enable observation of other biological specimens, such as plant seed specimens, on MSDs. More cell types and analyses will be tested.

4. Conclusions

Capturing the dynamics of cells and their nuclei is critical to understanding normal cell function and fundamental cell biology, and to ultimately predict the response of living organisms to stimuli. Microgravity and hypergravity are two mechanical stimuli that humans and plants are exposed to on space missions. Several studies have been performed using live-cell imaging capability on the ISS and sounding rocket true microgravity platforms to understand the response of human cells to microgravity [30,31]. In order to provide a more cost-effective and easily accessible platform to researchers, we developed a live-imaging module to capture the dynamics of cells in SMG. A rotating machine provides a challenging environment for any optical-mechanical setup because loading levels continuously change. Accelerations and rotation direction changes dramatize the condition by introducing mechanical shocks. The module described herein successfully addresses these challenges and permits the live imaging of cells over prolonged intervals.

Supplementary Materials

The following are available online at https://www.mdpi.com/article/10.3390/app11073122/s1, Video S1.

Author Contributions

Conceptualization, S.N. and Y.Z.; methodology, S.N., A.L., C.U.; software, A.L., C.U. and M.A.L.; validation, S.N., A.L. and M.A.L.; formal analysis, S.N. and A.L.; investigation, S.N., A.L. and C.U.; resources, Y.Z. and H.G.L.; data curation, Y.Z. and H.G.L.; writing—original draft preparation, S.N. and A.L.; writing—review and editing, Y.Z., H.G.L. and S.N.; visualization, Y.Z., S.N. and A.L.; supervision, S.N. and Y.Z.; project administration, S.N. and Y.Z.; funding acquisition Y.Z. and H.G.L. All authors have read and agreed to the published version of the manuscript.

Funding

The MSSF and this development were funded by the NASA Space Biology Program. Srujana Neelam was supported by the NASA Post-doctoral (NPP) program (NNH15C048B) administered by Universities Space Research Association (USRA) for the whole development and manuscript writing, and her participation in editing and revision was supported by the NASA Space Biology program, Grant #80NSSC20K0423. Audrey Lee and Ceasar Udave were supported by the NASA Space Biology Program through the NASA internship program. This development was submitted in the NASA New Technology Reporting System as KSC-14221 on 28 September 2018, entitled “Modules to Support Live Microscopic Imaging and Samples on Ground-Based Microgravity Simulator Devices”.

Institutional Review Board Statement

Not applicable.

Informed Consent Statement

Not applicable.

Data Availability Statement

Not applicable.

Acknowledgments

We extend our sincere appreciation to Simon Gilroy, University of Wisconsin-Madison, for his administrative support. We would like to thank Jeffrey T. Richards, Stephanie Richards, Lawrence L. Koss, Jonathan R. Gleeson, and Jacob J. Torres for providing logistics and MSSF laboratory support.

Conflicts of Interest

There are no conflict to declare.

References

  1. Williams, D.; Kuipers, A.; Mukai, C.; Thirsk, R. Acclimation during space flight: Effects on human physiology. CMAJ 2009, 180, 1317–1323. [Google Scholar] [CrossRef] [Green Version]
  2. Herranz, R.; Anken, R.; Boonstra, J.; Braun, M.; Christianen, P.C.M.; de Geest, M.; Hauslage, J.; Hilbig, R.; Hill, R.J.A.; Lebert, M.; et al. Ground-based facilities for simulation of microgravity: Organism-specific recommendations for their use, and recommended terminology. Astrobiology 2013, 13, 1–17. [Google Scholar] [CrossRef] [Green Version]
  3. Beysens, D.A.A.; van Loon, J.J.W. Generation and Applications of Extra-Terrestrial Environments on Earth; River Publisher: Amsterdam, The Netherlands, 2015; Volume 1, pp. 1–318. [Google Scholar]
  4. Kiss, J.Z.; Wolverton, C.; Wyatt, S.E.; Hasenstein, K.H.; van Loon, J.J.W.A. Comparison of microgravity analogs to spaceflight in studies of plant growth and development. Front. Plant Sci. 2019, 10, 1577. [Google Scholar] [CrossRef] [PubMed] [Green Version]
  5. Wuest, S.L.; Richard, S.; Kopp, S.; Grimm, D.; Egli, M. Simulated microgravity: Critical review on the use of random positioning machines for mammalian cell culture. BioMed Res. Int. 2015, 2015, 971474. [Google Scholar] [CrossRef] [Green Version]
  6. Borst, A.G.; van Loon, J.J.W.A. Technology and developments for the random positioning machine, RPM. Microgravity Sci. Technol. 2009, 21, 287–292. [Google Scholar] [CrossRef]
  7. Zhao, T.; Li, R.; Tan, X.; Zhang, J.; Fan, C.; Zhao, Q.; Deng, Y.; Xu, A.; Lukong, K.E.; Genth, H.; et al. Simulated Microgravity Reduces Focal Adhesions and Alters Cytoskeleton and Nuclear Positioning Leading to Enhanced Apoptosis via Suppressing FAK/RhoA-Mediated mTORC1/NF-κB and ERK1/2 Pathways. Int. J. Mol. Sci. 2018, 19, 1994. [Google Scholar] [CrossRef] [PubMed] [Green Version]
  8. Pache, C.; Kühn, J.; Westphal, K.; Toy, M.F.; Parent, J.M.; Büchi, O.; Franco-Obregón, A.; Depeursinge, C.; Egli, M. Digital holographic microscopy real-time monitoring of cytoarchitectural alterations during simulated microgravity. J. Biomed. Opt. 2010, 15, 026021. [Google Scholar]
  9. Dino-Lite Digital Microscope. Available online: https://www.dino-lite.com/products_detail.php?index_m1_id=9&index_m2_id=19&index_id=70 (accessed on 7 March 2021).
  10. Kamal, K.Y.; Herranz, R.; van Loon, J.J.W.A.; Medina, F.J. Cell cycle acceleration and changes in essential nuclear functions induced by simulated microgravity in a synchronized Arabidopsis cell culture. Plant Cell Environ. 2019, 42, 480–494. [Google Scholar] [CrossRef]
  11. Kamal, K.Y.; Herranz, R.; van Loon, J.J.W.A.; Medina, F.J. Simulated microgravity, Mars gravity, and 2g hypergravity affect cell cycle regulation, ribosome biogenesis, and epigenetics in Arabidopsis cell cultures. Sci. Rep. 2018, 8, 6424. [Google Scholar] [CrossRef] [Green Version]
  12. Maier, J.A.M. Impact of simulated microgravity on cell cycle control and cytokine release by U937 cells. Int. J. Immunopathol. Pharmacol. 2006, 19, 279–286. [Google Scholar] [CrossRef] [Green Version]
  13. Jha, R.; Wu, Q.; Singh, M.; Preininger, M.K.; Han, P.; Ding, G.; Cho, H.C.; Jo, H.; Maher, K.O.; Wagner, M.B.; et al. Simulated Microgravity and 3D Culture Enhance Induction, Viability, Proliferation and Differentiation of Cardiac Progenitors from Human Pluripotent Stem Cells. Sci. Rep. 2016, 6, 30956. [Google Scholar] [CrossRef]
  14. Hughes-Fulford, M.; Chang, T.T.; Martinez, E.M.; Li, C.-F. Spaceflight alters expression of microRNA during T-cell activation. FASEB J. 2015, 29, 4893–4900. [Google Scholar] [CrossRef] [PubMed] [Green Version]
  15. Booth, A.J.; Yue, Z.; Eykelenboom, J.K.; Stiff, T.; Luxton, G.G.; Hochegger, H.; Tanaka, T.U. Contractile acto-myosin network on nuclear envelope remnants positions human chromosomes for mitosis. eLife 2019, 8, e46902. [Google Scholar] [CrossRef]
  16. Wu, J.; Kent, I.A.; Shekhar, N.; Chancellor, T.J.; Mendonca, A.; Dickinson, R.B.; Lele, T.P. Actomyosin pulls to advance the nucleus in a migrating tissue cell. Biophys. J. 2014, 106, 7–15. [Google Scholar] [CrossRef] [Green Version]
  17. Raucher, D.; Sheetz, M.P. Cell spreading and lamellipodial extension rate is regulated by membrane tension. J. Cell Biol. 2000, 148, 127–136. [Google Scholar] [CrossRef]
  18. Shah, J.M.Y.; Omar, E.; Pai, D.R.; Sood, S. Cellular events and biomarkers of wound healing. Indian J. Plast. Surg. 2012, 45, 220–228. [Google Scholar]
  19. Farahani, R.M.; DiPietro, L.A. Microgravity and the implications for wound healing. Int. Wound J. 2008, 5, 552–561. [Google Scholar] [CrossRef]
  20. Chancellor, T.J.; Lee, J.; Thodeti, C.K.; Lele, T. Actomyosin tension exerted on the nucleus through nesprin-1 connections influences endothelial cell adhesion, migration, and cyclic strain-induced reorientation. Biophys. J. 2010, 99, 115–123. [Google Scholar] [CrossRef] [PubMed] [Green Version]
  21. Wolf, K.; Te Lindert, M.; Krause, M.; Alexander, S.; Te Riet, J.; Willis, A.L.; Hoffman, R.M.; Figdor, C.G.; Weiss, S.J.; Friedl, P. Physical limits of cell migration: Control by ECM space and nuclear deformation and tuning by proteolysis and traction force. J. Cell Biol. 2013, 201, 1069–1084. [Google Scholar] [CrossRef] [Green Version]
  22. Neelam, S.; Chancellor, T.J.; Li, Y.; Nickerson, J.A.; Roux, K.J.; Dickinson, R.B.; Lele, T.P. Direct force probe reveals the mechanics of nuclear homeostasis in the mammalian cell. Proc. Natl. Acad. Sci. USA 2015, 112, 5720–5725. [Google Scholar] [CrossRef] [Green Version]
  23. Neelam, S.; Hayes, P.R.; Zhang, Q.; Dickinson, R.B.; Lele, T.P. Vertical uniformity of cells and nuclei in epithelial monolayers. Sci. Rep. 2016, 6, 19689. [Google Scholar] [CrossRef]
  24. Nagamatsu, G.; Shimamoto, S.; Hamazaki, N.; Nishimura, Y.; Hayashi, K. Mechanical stress accompanied with nuclear rotation is involved in the dormant state of mouse oocytes. Sci. Adv. 2019, 5, eaav9960. [Google Scholar] [CrossRef] [Green Version]
  25. Wu, J.; Lee, K.C.; Dickinson, R.B.; Lele, T.P. How dynein and microtubules rotate the nucleus. J. Cell. Physiol. 2011, 226, 2666–2674. [Google Scholar] [CrossRef]
  26. Nassef, M.Z.; Kopp, S.; Wehland, M.; Melnik, D.; Sahana, J.; Krüger, M.; Corydon, T.J.; Oltmann, H.; Schmitz, B.; Schütte, A.; et al. Real microgravity influences the cytoskeleton and focal adhesions in human breast cancer cells. Int. J. Mol. Sci. 2019, 20, 3156. [Google Scholar] [CrossRef] [Green Version]
  27. Neelam, S.; Richardson, B.; Barker, R.; Udave, C.; Gilroy, S.; Cameron, M.J.; Levine, H.G.; Zhang, Y. Changes in Nuclear Shape and Gene Expression in Response to Simulated Microgravity Are LINC Complex-Dependent. Int. J. Mol. Sci. 2020, 21, 6762. [Google Scholar] [CrossRef] [PubMed]
  28. Ishidome, T.; Yoshida, T.; Hanayama, R. Induction of live cell phagocytosis by a specific combination of inflammatory stimuli. EBioMedicine 2017, 22, 89–99. [Google Scholar] [CrossRef] [PubMed] [Green Version]
  29. Mullassery, D.; Horton, C.A.; Wood, C.D.; White, M.R.H. Single live-cell imaging for systems biology. Essays Biochem. 2008, 45, 121–133. [Google Scholar] [PubMed] [Green Version]
  30. Thiel, C.S.; Tauber, S.; Lauber, B.; Polzer, J.; Seebacher, C.; Uhl, R.; Neelam, S.; Zhang, Y.; Levine, H.; Ullrich, O. Rapid morphological and cytoskeletal response to microgravity in human primary macrophages. Int. J. Mol. Sci. 2019, 20, 2402. [Google Scholar] [CrossRef] [Green Version]
  31. Thiel, C.S.; Tauber, S.; Seebacher, C.; Schropp, M.; Uhl, R.; Lauber, B.; Polzer, J.; Neelam, S.; Zhang, Y.; Ullrich, O. Real-Time 3D High-Resolution Microscopy of Human Cells on the International Space Station. Int. J. Mol. Sci. 2019, 20, 2033. [Google Scholar] [CrossRef] [Green Version]
Figure 1. CAD rendering of the assembled module and microscopy system. (A) Components of the live microscopic imaging module for the desktop random positioning machine (RPM). The module is modified to accommodate samples contained in the µ-slides and SlideFlasks. (B) 3D-printed module integrated with the microscopy system.
Applsci 11 03122 g001
Figure 2. The live microscopic imaging module installed on the desktop RPM and housed in the CO2 incubator. (A) Front view of the RPM with the imaging module. (B) Back view of the installed module showing the WiFi adaptor. The 5 V power supply on board was utilized to power the WiFi streamer and the backlight illuminator, as indicated. (C) RPM and module housed within a standard cell culture CO2 incubator. The experimental computer receives data from the module in real-time and stores them for offline analysis.
Applsci 11 03122 g002
Figure 3. Brightfield images of AG01522 cells captured using the live-imaging module while experiencing simulated microgravity (SMG) on the RPM. (A) The images show a dividing cell over a period of 60 min. At T-30 min, the cell is spread out and we can see the nucleus intact. Starting from time T, which is the breakdown of the nuclear envelope, all the phases of cell division can be visualized clearly: the alignment of the chromosomes in the center of the cell, the sister chromatids being pulled in opposite directions, the cleavage furrow separating the daughter cells, and the formation of the daughter cells. (B) Images of lamellipodial formation in a cell. We can trace the leading edge of the cell, which is ruffling (outlined with a dotted black line) due to dense actin polymerization. The overlay of the white dotted line representing the lamellipodial boundary at T = 0 s and black dotted line at T = 12 min clearly show the extension of the lamellipodium. (C) Brightfield images of AG01522 cells at 0, 4, 8, and 10 h after wounding are shown. The edges of the wound are highlighted in black. (D) Images show the translation of the nucleus in a cell over time. The shapes and position of the nucleus could be traced, indicated in dashed outlines, and they are overlayed to track the path of the nucleus. (E) Captured images show nuclear rotation in the cell, as seen in the top row with the nuclear boundary marked with dashed black lines. The bottom row marks the two nucleoli with dashed black lines; their position can be used to accurately quantify the angle by which the nucleus has rotated over time.
Applsci 11 03122 g003
Figure 4. Fluorescently labelled nuclei of AG01522 cells in SMG. The image was captured using the live-imaging module with a AM7515MT8A-GFBW fluorescence 5MP Dino-Lite Edge Series microscope mounted on an RPM. The live cells pre-labeled with SYTO 9 Nucleic Acid dye were excited with 488 nm LEDs to acquire the green fluorescent image.
Applsci 11 03122 g004
Publisher’s Note: MDPI stays neutral with regard to jurisdictional claims in published maps and institutional affiliations.

