1. Introduction
The consequences of the crisis caused by COVID19 have been devastating from a sanitary point of view, but they will presumably be also devastating from an economic and social point of view. The COVID19 generated a situation never seen before and at the time of starting our research, in April 2020, we were convinced that new social needs would emerge, and it would be urgent to identify them as soon as possible to properly address them.
Most of the research done in the field of COVID19 is focusing on the prediction of the infection rates in the population, survival rates, propagation of the disease, or diagnosis, like in [
1]; indeed, most of the research in COVID19 topics is done under a health approach. However, the project INSESS-COVID19 was born with the aim to focus on Social Services, largely forgotten in the management of the pandemics, although being a field with a strong need of including data as an asset for management and improvement of the Social Services system itself as well as for improvement of services to citizens.
The INSESS-COVID19 project (namely Identification of Emerging Social Needs as a consequence of COVID19 and effect on the Social Services of the territory), is one of the 21 proposals funded by the Special Call on COVID19 Research launched in April 2020 by the Centre for Cooperation in Development of the Universitat Politècnica de Catalunya. INSESS-COVID19 is a prospective study to identify the social vulnerabilities of the Catalan population and to provide elements to support decision-making to the 107 Basic Areas of Social Services (BASS) of Catalonia and to the Social Services Department from the Catalan government. The BASS will have to face all these new vulnerabilities and require decision support tools to be able to manage the incoming overflow.
INSESS-COVID19 uses an innovative approach based on mechanisms for rapid data collection from an entire territory, based on participatory processes where citizens and experts in social services can contribute at different levels. The project uses a mixed methodology that combines data science techniques, knowledge management and artificial intelligence, which has allowed contributing to provide data/knowledge-driven outcomes useful to policymaking in the matter of Social Services in Catalonia [
2]. The technological tool developed in INSESS-COVID19 proves the feasibility of quickly getting data direct from citizens and making a rapid diagnosis of territory whenever needed. The methodology proposed in the project, and the technology developed to implement it is general, being as well valid, not only in Social Services, but in any governmental or business area. The INSESS-COVID19 proposal allows overcoming the limitations of the most classic information systems in relation to decision support [
3] need in front of an unexpected situation, as it allows to obtain direct information from the source (citizens in our case) whenever required, even if the ordinary information system do not contain it.
According to the GDPR (General Data Protection Regulation) [
4] GDPR law, privacy of citizens participating in the project must be guaranteed and is critical to create the trustworthy climate that allows citizens to openly confess their vulnerabilities in a protective way, with the certainty that disclosing vulnerabilities (like being illegally in the country for example) would not have any direct consequence for him/her. Provided that the data collection process regards a big number of variables (195), there are 945 BASS organized in eight administrative bigger areas (named Vegueries), and grouped by four provinces, the risk of getting very small groups of citizens following a certain pattern of vulnerability is high, this raising the risk of violation of the anonymization principle in the practical application of the proposal.
The main challenge is to extract as much relevant decisional information from the dataset by preserving overall the privacy of the participant citizens. Privacy and human rights oversight are two of the main principles recommended in the guidelines for Ethic in AI provided by the European Commission in May 2019. Thus, this paper provides a methodological proposal to guarantee the participant privacy in the publication of results. Considering that this project includes some vulnerable citizen’s profiles, like illegal foreigners, victims of domestic violence, or mental health patients, the preservation of privacy of all participants is crucial for their safety.
The project is a close collaboration between Intelligent Data Science and Artificial Intelligence research center at UPC and the iSocial Foundation, being Karina Gibert (IDEAI-UPC) and Toni Codina (iSocial) the main researchers of the project. When this study started by last May 2020, the general expectation was that pandemics lockdown would finish by July and de-escalation would start then, so that we could focus on analying the collected data and contributing to build this new normality mentioned everywhere. Nothing further from reality. The pandemic is still among us nowadays, as is the state of alarm, and the situation is still far from stabilizing. The new outbreaks from last July had a strong impact on the project work plan. The collapsed Social Services were not able to be involved in research projects, of course, and the organization of the face-to-face workshops originally planned in the project became unfeasible with the containment measures again enacted. The INSESS-COVID19 team put all their energy into rethinking the design of the data collection process, in order to enable citizen participation, at minimum cost for the BASS. The data collection period, originally planned by June and half July was extended as much as possible, until last 6 December 2020. The data analyzed in this paper were collected between end June and 6 December 2020. Four months throughout entire Catalonia, with the invaluable collaboration of an important part of the 107 BASS, where social services professional staff made the effort of finding moments to collaborate with the project and contacting the participant citizens, in spite of being in a very complex overflow situation.
In the next sections, the different elements developed in the project are presented, as well as the methodological proposal to deal with small data. Real results from the questionnaire and some results resulting from the automatic analysis are shown.
2. Materials and Methods
2.1. State of the Art
Before building the INSESS-COVID19 instrument, different related studies had been consulted. In
Table 1, some of the works are listed.
2.2. INSESS-COVID19 Methodology
The project proposes an innovative methodology to reach the goals. The novelty regards three different issues:
The technological solution provided to collect data from citizens in short time
The methodological solution for automatic analysis of collected data
The methodological solution proposed for reaching the citizens to involve in the analysis
The main steps of the proposal are listed below. In the next subsections, details on each step are provided and the novelty highlighted where it is.
- A.
Analysis of the phenomenon and design of observation tools
Before starting with the technical part of data management, the proposed methodology suggests starting by understanding the structure of the target ecosystem. From this analysis, a clear idea about the sample design will appear on the one hand, and the kind of questions required from participants as well. In addition, the ways in which data will be collected require attention.
Analysis of the target ecosystem
Identification of target subpopulations and profiles
Robustness with regards to the moment of answering
Construction of the impact-oriented questionnaire
Design of technological infrastructure
Workshop design 3
- B.
Collection of territorial information and data analysis 5
The proposed sequence of steps to perform the analysis is inspired in the traditional KDD procedure (KDD: Knowledge discovery from data). In our case, we introduce a specific proposal for the operativization of the very last step of Knowledge Production proposed by Fayyad [
5], from which a significant lack of literature exists even nowadays, and which is aligned with the emergent field of Explainable AI [
6].
Data collection methodology
Data pre-processing
Descriptive and territorial analysis
- 3.1.
Multivariate variables
- 3.2.
Temporal variables
- 3.3.
Open questions analysis through Natural language processing methods
Intelligent Multivariate Analysis
Pattern identification across BASS
Artificial Intelligence-based Conceptualization
As it will be seen along the paper, the questionnaire includes variables with complex structures and some of them express along several columns or not in the DB. Dealing with this situation requires the development of some new methodological components that will be detailed along the paper.
Definition of a typology of complex variables
Design of automatic analysis procedures 10
Design of specific visual and analytical tools for complex type of variables
Statistical secrecy preservation 8
Privacy issues 7
Treatment of the statistical error 6
Metainformation model 11
Automatic reporting12
Implementation
- C.
Results interpretation, diagnostics and final recommendations
In the following, details on all steps are provided.
2.3. Analysis of the Target Echosystem
We propose that this part includes three aspects:
Understanding of the structure of the target domain. For the case of INSESS-COVID19, this requires understanding the structure of Social Services in Catalonia. How are they organized, which public administrations have competences in the different kind of services, the set of available services and so on.
Also, a review of current sources of official statistics about the target domain that can be used as a reference for the analysis is required. Literature review is useful. Not in the academic sense, but finding official reports describing the target domain (in this case, official statistics and surveys followed during pandemics)
This analysis, conducted together with the domain experts, will result in a clear identification of the kind of participants required and the kind of information required from them and will provide the inputs for the decisions taken in next steps.
2.4. Identification of Target Subpopulations and Profiles 4
As said before, after a deep understanding of the list of available Social Services offered in primary social care system, a list of 20 target profiles and the corresponding inclusion criteria were defined together with the Social Services professionals, from both government, city councils and regional councils (consells comarcals). The proposed profiles point out to segments of population a priori expected to be significantly damaged by the pandemics:
Single-parent families
Young people unemployed
Unemployed over 50 years old
Citizens coming from abroad in irregular situations
Ex-tutelage people and underage alone
Poor workers (very low salaries)
Poor workers (temporal and discontinuous permanence)
Poor workers (submerged economy)
People under ERTO or dismissed
Autonomous workers and small entrepreneurs under bankruptcy
Dependent elderly
Elderly leaving alone
People with disability (physical, sensorial or emotional)
Informal care-givers
People with mental disorders
People from LGTBI community under vulnerability
People with addictions to alcohol, drugs or conducts
Women victims of male violence
People without home or leaving in infra-homes
Professionals from Essential Social Services and Health
2.5. Construction of the Impact-Oriented Questionnaire
After an extensive analysis of the conceptual framework, a conceptualization of the target areas of life to be studied was agreed with the experts. Among all the instruments, surveys and reports analyzed, the reference conceptual model was the SSM.cat model [
7], an instrument to compute the social vulnerability adopted by the Catalan government to be part of the new Social Services system (e-Social), planned as the kernel of the digital transformation of Social Services targeted in the Strategic Plan of Social Services of Catalonia [
8] and very much aligned with the current structure of primary care Social Services in Catalonia. The process by which this reference model was selected is new as it is based on a systematic review of the State of the Art, including the elaboration of a taxonomy of indicators, grouped by themes, and the description of the reviewed surveys in terms of the number of variables (and topics) related to every theme, the expert-based evaluation of the utility of these questions regarding the goals of the study, and the design of the thematic blocs and sequence according to that.
The SSM.cat model was inspired by the Dutch version of the Self Sufficiency Matrix model, developed by the University of Amsterdam [
9], which in turn is an adaptation from the original Self Sufficiency Matrix developed by Diana Pearce for Wider Opportunities for Women as part of the State Organizing Project for Family Economic Self-Sufficiency [
10,
11].
Inspired in SSM.cat, INSESS-COVID19 assesses social vulnerability from the following 11 areas of daily life:
Incomes
Daily activities
Home
Domestic relationships
Mental health
Physical health
Substance abuse
Daily activities skills
Social network
Community participation
Legal framework
The INSESS-COVID19 questionnaire has been developed by focusing questions on these areas. Each area can contain a different number of questions, mainly oriented to bring to the fore not only social vulnerability but also the impact of the COVID19 in this vulnerability. The result is a questionnaire with 21 blocks that generate up to 195 items, of different structures, according to the type of questions.
Figure 1 shows the global structure of the survey.
2.6. Validation of Questionnaire and Profiles
The questionnaire and sample design outcomming from the first phase of the methodology are extensively validated through several rounds of experts.
Two experts of the Advisory board of the project specialized in innovation for Social Services analyzed both que list of questions and the set of target profiles defined and provided positive feedback and some suggestion to improve writing to reduce ambiguities
The updated versions of both target profiles and questionnaire were submitted to the Social Services Commission of the Catalan Federation of Municipalities and a workshop was celebrated to evaluate the proposal that was fully accepted by the experts
Technical staff of the Social Services Department of the Catalan Government also reviewed the materials with successful feedback
Practitioners on Social Services checked the materials with a positive feedback as well and small amendments on ambiguity of the writings
None of them detected any missing profile in the sample design or question in the questionnaire and some highlighted the interest of some profiles or questions appeared as a consequence of the systematic review proposed in the paper that would have not been included from a more traditional expert-based approach (like Delphi or focus-groups).
2.7. Robustness of Data Collection Moment by Design
The INSESS-COVID10 instrument introduces an innovative structure in the questionnaire, intended to allow a long period of data collection while preserving the comparability of the data collected. This is a very relevant characteristic of the questionnaire that allows extensions of the data collection period in such a way that keeps the property of considering data together for the analysis. This provides an important advantage in front of small samples, as providing longer period for data collection valid sample can increase without limit in the validity of previously collected data.
The proposal made in our work is that all questions from the questionnaire are divided in two categories:
Static: Characteristic that keeps static along the entire study period (age, sex, place of birth, etc.)
Dynamic: Characteristic that might change value along the study period
The proposal is to require answers in some fixed moments along time for all Dynamic questions in the questionnaire (
Figure 2). The methodology is general, but for the case of INSESS-COVID19, it was decided to fix three moments of inquire: Pre-pandemics (January 2020), post-pandemics (July 2020) and expectations for the future (January 2021).
Introducing this design in the questionnaire has the property that the study gains robustness with respect to the specific date in which the citizen is participating into the project. The questionnaire asks about situations/perceptions in this three fixed time points, so the data collection process can be as long as required and data still permits the analysis of the dynamics of the phenomenon. Answers of persons participating in July, or August, or October, still provide information about the situation of the person in January 2020, July 2020 and January 2021, so they can be analyzed together. Considering the critical situation of the BASS during the 1sr wave of pandemics, this solution is overcoming the limitation that most of the territory could not dedicate time to the study in June–July, and without introducing this kind of design the viability of the project would not survive.
The impact of the 1st wave of the pandemics becomes measurable through the differences between July and January 2020.
The consequence is that this design introduces packs of variables in the questionnaire, which are not anymore independent, and specific procedures to analyze them in the correct way will be required. These are introduced later in the paper.
2.8. Technological Infrastructure
The methodology includes the design of the technological infrastructure that allows easy and secure access to the questionnaire to the citizens that will participate into the study and provides the pipeline to generate the final automatic reports based on the data collected in these questionnaires.
Figure 3 displays the overview. A server in the cloud compliant with all GDPR is hosting the digital questionnaire. The access to the questionnaire is made through a website that requires authentication and it can be reached with either a cell phone, tablet or PC (personal computer). Data collected in the questionnaire is downloaded (even periodically) to be automatically processed through R and KLASS [
12] scripts and a well edited working report is automatically produced in Word, where the results of the analysis are displayed and formatted as a final document. The web is also hosting a view for the BASS staff with support documents to organize the workshops.
After implementation and deployment, technical validation of scripts, server performance, web functionality, and availability of all required materials was performed.
2.9. The INSESS-COVID19 Workshops
Originally, the project planned face-to-face workshops with the citizenship and part of it consisted in filling-in the INSESS-COVID19 questionnaire. The main advantages of such a design are:
Digital gap issues of vulnerable population are assisted during the workshop and successful participation is guaranteed
The data collection time is constrained. In 2 h workshop all answers for a given BASS are collected
Missing data is reduced.
Misunderstanding of questions is reduced, or eliminated
The main limitation of this design is to require coincidence in time and space and requires logistics and specific rooms offered by the BASS for the workshop celebration.
With the circumstances of the prolonged pandemics in successive outbreaks, an on-line, delocalized in time and space, version of the workshop was activated. The contextualization of the activity was pre-recorded in videos, uploaded to web, so that each participant has to enter the web, follow the videos (10 min) and answer the questionnaire, all available in a private web area. In this modality, the properties of the workshop are:
No need to offer a specific room to celebrate the workshop
No need to fix a day and time to celebrate the workshop
Time for data collection needs to be a longer period. Extra follow-up of participants is required to guarantee the delivery of questionnaires on time
Missing data can increase
Misunderstanding of questions is still reduced through videos, but no interaction is available, so it might be not totally eliminated
Specific long-term human support is required to solve the digital gap issues of vulnerable population. The BASS has to offer a person to this purpose.
The main aim of the mini-videos is to guarantee that all participants have the same understanding of the questions and know the main goals of the project, thus still helping to reduce both the misinterpretations of the questions.
The project considered four workshop modalities (
Figure 4):
INSESS-COVID19 Face-to-face Workshop (
Figure 5a): All people who are participating in the workshop meet together in a site provided by the BASS. INSESS-COVID19 team join through videoconference to lead the workshop.
INSESS-COVID19 Mixt Workshop (
Figure 5b): Some participants are located in the room assigned by the BASS for workshop. Also, some participants join the workshop through videoconference. The INSESS-COVID19 team join through videoconference.
INSESS-COVID19 Online Workshop (
Figure 6a): All participants join the workshop through videoconference. INSESS-COVID19 team join by means of videoconference to lead the workshop.
INSESS-COVID19 Free Workshop (
Figure 6b): All participants do the workshop on-line in its own schedule and from where they prefer (home, working place, etc.). The BASS professionals send to all participants the accesses to the website and videos of the project, to be seen before starting the workshop. The workshop consists on watching the proposed videos where the project is presented and after that, answering the questionnaire.
Other modalities: Along the data collection process, some BASS used creative mechanisms to involve citizenship into the study:
Rubí decided to organize a quasi-face-to-face workshop on his own, by using the electronic materials available for the Free Workshop on the project website.
Mollet del Vallès, convened the Culture department to hold a quasi-face-to-face workshop in an open day in order to involve more citizens and provided information for 80 citizens.
Reus was using a distributed network strategy, so each of the specialists had to found only two or three participants and a phone interview was followed to fill in the questionnaire
Cervemakers and the Institut de Cervelló, proposed participation in INSESS-COVDI19 as a volunteer activity for 4th ESO students and they have also collaborated as agents of the project by monitoring citizen participation.
2.10. Validation of Workshop Design and Technological Infrastructure
On 2 July, two pilots were conducted:
The BASS Castell-Platja d’Aro found 20 people who met some of the requested profiles and called for the workshop in a place provided by Social Services. Due to pandemics, INSESS-COVID 19 team joined the meeting remotely, through videoconference, and introduced the project, gave the context and all the instructions and answered all doubts about the questionnaire to the participants. After the 2 h workshop, all the 20 responses were already uploaded in the INSESS-COVID19 server. None of the questions was misinterpreted and all answers were provided.
The second pilot took place in the BASS la Noguera. In this case, trying to bridge the digital gap, social services professionals selected the 20 participants, and gave a phone call to pass the questionnaire; the professional was transcribing the citizen answers into the INSESS-COVID19 server. The time required to collect answers from the 20 participants took more than 2 months. None of the respondents misinterpreted any question.
2.11. Data Collection Methodology
According to the official statistics from last Third Sector Barometer [
13], the vulnerable population from Catalonia is 1,584,000 people. The sample size can be determined under the approach of infinite population, as the asymptote of the sample error under the finite population approach is reached around 1,000,000 population. According to classical expressions [
14], a sample of 1067 citizens participating into the project would provide a sample error of 0.03 at a 0.95 confidence level.
Taking into account that the BAS were in an overflow crisis because of the pandemics, we assumed that about a 20% of them would not be able to engage the project, so, we determined that the network of 107 BASS from all territory would be asked to find 20 citizens each, by following a minimum of 10 of the target profiles. Social Services professionals for each BASS were selecting 20 citizens from a subset of profiles that properly represented the main problematics occurring in their geographical areas. Expertise of Social Services teams was on play at this step in a two-stage sample design, in a combination between collaborative co-creation methodologies and classical multiple stage sampling strategies.
The selected citizens were invited to participate in the project by following the INSESS-COVID19 workshops in any of its forms. The INSESS-COVID19 questionnaire was opened from 17th July 2020 and has been continuously collecting data until 6th December 2020. On 7th December 2020, (01:00 am) 971 answers were collected in a database containing 195 variables and downloaded for automatic analysis.
2.12. Typology of Variables in INSESS-COVID19 Questionnaire and Analysis Proposed
The INSESS-COVID19 questionnaire combines variables of different types and structures, which require different kind of analysis.
Figure 7 lists the different types of variables considered in the questionnaire, the form that the question has in the digital questionnaire, the internal format generated at the level of the background database where data is represented, and the combination of graphical and numerical tools used for the basic descriptive analysis. In addition, an example of the INSESS-COVID19 questionnaire for each case.
This typology is one of the contributions of the paper and provides some complex variables that enquire to a certain issue and generate more than one column in the background dataset. According to the type of the question, the nature of the information collected and the way in which this information is represented in the database, this is directly affecting the way to visualize this data and the statistical procedure associated. This produced, in consequence, the creation of some new procedures to analyze these complex datasets and some new visualization tools.
Multivalued variables: A multivalued variable is a qualitative variable X with S possible modalities D = {m1, m2, … mS} so that an individual can simultaneously take several values from D. This is the case for example of X = “ICT available”, D = {PC, tablet, cellphone}. The values of X, xi € P(D), so that an individual can simultanoeusly have PC and cellphone and so. The concept of multivalued variable is not new. However, in this work specific descriptive tools to better extract information from these kinds of variables is introduced.
Temporal basic variables Temporal variable (X,T) defines as a qualitative variable (nominal, ordinal, binary or Likert) that is measured T times along time, providing T columns in the dataset as temporal replicas of X. We can denote these replicas as X
t1, X
t2, …, X
T. In the
Figure 7 they are denoted by LikertXtime or NominaXtime
TQQ variable: Temporal Qualified Qualitative (X, T, Q) is a qualitative variable X with S modalitites in D, replicated T times. For each modality ms a value (from Q) indicating the qualification f ms is given (Q is a Likert or ordinal set of values). As an example, variable X = participation in the society, is taking four modalities D = {Associations, Networks, Volontariety, Others}, which indicates the kind of participative actions that the person follows. The variable is replicated T = 3 times (t1 = January2020, t2 = July 2020, t3 = January 2021). Each Xt is, in turn a set of Likerts, such that for each modality of X in t1 we have a Likert qualifying the degree of participation of the person in it. Q = {Molt (A lot, Una mica (Some), Gens (None), NC (missing answer}. At the level of internal representation, each TQQ variable provides card(D)xT Likert columns each taking values in Q that require a joint description.
2.13. Design of Specific Visual and Analytical Tools for Complex Type of Variables
Indeed, some of the tools used are very basic, but others have been developed ex professo in this project and open the door to enlarge the knowledge provided in the first descriptive analysis of any database, given that the type of variables are properly conceptualized prior to the analysis itself. In the following, the description of the new advanced descriptive tools is proposed.
Each of these tools have been properly validated before including in the procedures used to analyze the project data. First, the proposal was validated with stakeholders of the report to see if they appreciated useful information given by the tool. Then, technical validation of scripts implementing them was performed. Finally, interpretability of the results was used as final validation criteria when the entire project report was submitted to final stakeholders.
2.13.1. Extended 5-Number Summary
Being X a numerical variable (x
1,…, x
n), the 5-Number Summary [
15] is a set of 5 sufficient robust statistics used to describe numerical variables (See
Table 2). It is composed by Minimum, Q1, Median, Q3 and Maximum. In our version, we extend it by adding Mean, Quasi-standard deviation and Variation Coefficient, so that information about symmetry of the variable and relevance of variance can also be evaluated.
2.13.2. Extended Frequency Table
Being X a nominal variable the Extended Frequency table (
Table 3) extends the traditional one with the standard error, computed according to expressions described in this paper and the pooled standard deviation of all modalities together as a goodness indicator of the question as a whole. For nominal qualitative variables, the modalities are presented in descending order, in a Paretto style, so that the most frequent modalities appear in the top of the table. For Likert variables, the original order of the modalities is presented.
2.13.3. Marginal Bar Plot, Pie or Frequency Table
The multivalued variables provide multivalued responses composed by subsets of modalities. This is the case for example of digital devices used by a person (they can be multiple, right? Cell phone, tablet, pc, laptop…). Being X a multivalued variable (x1,…,xn), where xi is a list of modalities separated by “;”. The frequencies of each single modality of the variable are not available by direct analysis.
The marginal bar plot, as in
Figure 8, apparently looks like the classical bar plot, but it is built over a multivalued variable. This means that a single individual might be represented in several bars simultaneously. Consequently, the corresponding proportions column have a total overcoming 100%. So that the marginal frequency table has a similar aspect to the frequency table but represent proportions that sum up over 100%. The same happens with the pie. All of them represent the marginal counts or proportions of the (eventual) dummies representing each of the modalities of the variable, independently of how this variable is internally represented in the data base (as a single column of lists of values in the cells, or as a set of dummies, one per modality).
Figure 8 shows the area of the life impacted by unsolved processes. The same person can have several areas impacted simultaneously, like civil status (divorce process for example) and economy and family.
2.13.4. Multivalued Frequency Table
As nominal multivalued variables are represented by columns with lists of modalities in the cells, we propose the multivalued frequency table (
Table 4) to analyze the bags of modalities selected by respondents. In the multivalued frequency table, all the subsets of modalities provided as answers are displayed with their corresponding counts and frequencies. This in fact represents a subset of the empirical joint probability distribution of the variable. To preserve the statistical secrecy combinations are published only for frequencies greater than three. The number of hidden combinations is also reported at the end, as well as the uncertainty metrics. These variables are implemented through multiple-choice questions in the questionnaire. When collapsed in bags of modalities their weight in the analysis keep as one variable. When represented as dummy variables, as in the traditional way, they can bias the analysis as they increase dimensionality of data set unnecessarily.
2.13.5. Trajectory Graph
Originally introduced in [
16,
17], it consists of a two-dimensional plot with the modalities of the target qualitative variable (sorted or depending if it is nominal, or Likert or ordinal). Time is represented in the X-axis and it is discrete. In the INSESS-COVID19 questionnaire, this tool is used to represent all the temporal basic variables. Those corresponding to Dynamic characteristics and measured at the three time stamps presented before: January 2020, July 2020 and January 2021. For each individual the nodes representing their choices along time are linked with an edge. Edges of same colour represents same trajectory of the individuals. The thickness of the trajectories represents the proportion of respondents following that pattern. Trajectory graphs represent in a single tool packs of 3 different columns in data file corresponding to same variable X measured in 3 timestamps X
T1, X
T2, X
T3; where each X
Ti is a replica of X showing the value along time. Trajectory Graphs teach which individuals evolve in similar ways. They give an opportunity to identify temporal patterns and further find which variables distinguish them. This interpretative analysis generates hypotheses about which factors are associated to negative evolutions or harmful for individuals. The tool is transversal, and it has been used in [
16] to identify causes of functional impairment in neurological patients with spinal cord injury during the process of social inclusion after discharge. In [
17] it was used to understand the patters of evolution of the operation mode of wastewater treatment plants daily. Here we apply to discover the main trends of temporal evolution of the main variables from INSESS-COVID19 questionnaire one by one.
Using Trajectory Graphs in R is another contribution of this paper, this being the first time that it is implemented in R to be automatically represented in automatic reporting.
Figure 9 shows the trajectory graph for the variable convivial relationships.
The variable Quality of convivial relationships is ordinal and can take 10 different modalities (from 01. Satif (Satisfactory) to 9. Inexistent and 10. NC (missing)). This variable has been measured by three timestamps in the questionnaire. A line in the graph represents each respondent. All respondents following same temporal path are shown with same line color.
The interpretative power of this tool for non-technical-skilled users is enormous: Horizontal bands mean stability. Whenever the modalities of the target variable (X variable) are sorted top-down from better to worse, the “V” and “ꓥ” patterns mean instability found after pandemics 1st wave (in July 2020) in opposite senses. While “V” pattern means worsening and retrieving, the “ꓥ” pattern means improvement after pandemics and bad hopes in January 2021. Of course, the trajectory map can be generalized to more timestamps and any kind of qualitative variable. It is useful to understand the dynamics of a group of individuals along time. Another contribution of this research is that an efficient algorithm was designed so that the combinatorial nature of the trajectories can be managed and computed in very short CPU times.
The “Vꓥ” pattern is a special pattern identified for the first time during this research. It corresponds to a double dynamics in the same process (in this case, the pandemics), where part of the individuals follow a “V” pattern (the pandemics worsen their situation and they expect to recover by the beginning of 2021) whereas another segment of individuals follow the opposite pattern “ꓥ” (they were in bad conditions before the pandemics and the pandemics connected with people, better emotional conditions etc., while they expect to come back to the original situation by the beginning of 2021).
2.13.6. Trajectory Frequency Table
For temporal basic variables: Apparently looks like a multivalued frequency table. The main difference is that it has been built from a set of several qualitative variables (one per timestamp), each of them are simple choice and represented in a different column in the dataset. It quantifies the information shown in the Trajectories map. See in
Table 5 the trajectory frequency table corresponding to the R1. RelUConv variable presented later in the Results section.
2.13.7. Multiple Bar Plot
As usual, it represents the joint probability distribution of 2 qualitative variables. In this case, one is time. The other is a nominal, ordinal or Likert variable. For temporal basic variables. See an example in
Figure 10.
2.13.8. Grid of Pies
For temporal basic variables the T columns representing time can be analysed independently as if they were ordinary qualitative variables. A pie for each timestamp can be done and they are presented in a grid See an example in
Figure 11 for economic situation.
2.13.9. Transition Tables
Tables quantifying the transitions between two consecutive timestamps, in counts or proportions. Given a temporal basic variable (X,T), it is the cross table between Xt and Xt + 1, t = {1:T − 1}. See an example in
Figure 12 for the changes in the quality of convivial Unit Relationships between January 2020 and July 2020.
2.13.10. Changing Tables
Cross table of the categorization of successive transition tables that quantifies how many state changes are observed in both the first and second transition.
Figure 13,
Figure 14,
Figure 15 and
Figure 16 are examples on changes of the quality of the relationships in the Convivial Unit.
2.13.11. Multiple Stacked Bar Plot
This is a graphical representation proposal to provide a compact view of a TQQ type variable with a Q, X and T. In this case, the three stacked bar plots represent participation in society through time. For each timestamp T = (G20, J20, G21), a stacked bivariate bar plot represents the relationship between the Likert Q (1Molt (high participation), 2.Una mica (moderate participation), 3Gens (no participation), 4NC (unknown)) (in bars) and the modalities of X, here indicating if the participation in different social activities (like neighborhood networks (Xarxes), associations (Associacions) voluntary movements (Voluntari) or Others (Altres)). Changes along time can be analyzed as well. See
Figure 15.
2.13.12. Error Estimation
The results of all estimates build over questionnaires data have associated sampling errors. The main statistical offices in our context have been consulted and two different methods are used to compute them.
2.14. Statistical Institute of Catalonia (IDESCAT)
IDESCAT is the statistical office from Catalonia and uses the Variance Coefficient (CV) of the estimate
as the estimation of the relative sampling error for the estimate
. CV is published in the sampling error tables. The estimated CV allows obtaining a confidence interval at 95% of the estimated characteristic (
θ):
In turn, computing
follows the recommendations of Eurostat and the Net-SILC2 working group [
18], so that the error clustering and the ultimate cluster approach are used. According to this methodology, for the calculation of the variance of the sampling error, only the variation between the totals of the primary sampling units (the census tracts) is taken into account. This might parallel the BASS role in our case.
2.14.1. Statistical National Institute (INE, Instituto Nacional de Estadistica)
[The sampling errors of the estimates of some of the main investigated characteristics are calculated quarterly. A resampling method is used to obtain the sampling errors. The INE uses the reiterated semi samples method [
19,
20] in most of their important panels, among them the APS (the Active Population Survey, EPA in Spanish) [
21].
This procedure consists of obtaining r semi samples from data (being a semi sample a subsample of size n/2, with n the original sample size). From each semi sample s, the estimate
of the target parameter
is calculated. Once all the estimates have been calculated, as well as the estimate of the full sample
the variance estimator is given by:
where
r is the number of subsamples considered,
is the estimate of
obtained with the semisample
s (a reweighting technique is applied using the CALMAR software) and
is the global estimation of the target parameter, based on complete sample.
In the case of the APS, the number of reiterations used is 40, formed by making pairs with the sections of each strata, ensuring that the two sections of each pair belong to the same APS rotation shift; the first section of each was randomly assigned for 20 reiterations and the other section for another 20. In this way, each reiteration is constituted by a number of sections equivalent to 50% of the sample (semi sample) and each section appears in the half of the iterations. The survey publishes the relative sampling error as a percentage (coefficient of variation):
2.14.2. Calculation of Sampling Error in INSESS-COVID19
In our case, we provide the CV of each item of the questionnaire based on the same expression used by IDESCAT
For the numerical variables
is the observed mean and for the qualitative ones is the obseved proportion. The
as usual. So, the most important part in our case is to estimate
). For numerical variables, it is estimated as the square of the sample quasi-standard deviation. For the qualitative variables, each modality is considered as following a Bernoulli distribution, so that
represents the proportion of that modality, whereas
In addition, a confidence of the qualitative question as a whole is provided by means of the pooled standard deviation of all modalities.
2.15. Privacy
Many of the questions contained in the INSESS-COVID19 questionnaire are sensitive (being the object of violence, being in irregular situation in the country, suffering from mental disorder, etc.). Guaranteeing the privacy and anonymity of the respondents is crucial to make them sure that they can answer all the questions without being scared.
This is the reason why the questionnaire is self-contained and anonymous, such that the respondent cannot be identified and their answers cannot be crossed with any other database at individual level. In particular, they cannot be crossed with the Social Services information systems. So that we cannot expect to get any extra information about the person out of the questionnaire. Some questions require information that Social Services already have about people, but we preferred to ask again and avoid mistrust feelings that could limit the answers provided by the respondents.
To guarantee this security, the BASS professionals identify the people to participate into the workshops, but they do not share with INSESS-COVID19 team their identities. They communicate to the participants the links and passwords to enter the project website and the questionnaire but using a common password the system cannot trace the identities of the respondents, so that the responses keep anonymous and secure. The server hosting the questionnaire database is RGPD compliant as well, and INSESS-COVID19 team preserves the microdata without sharing with any other institution other than aggregated data.
However, all these good practices are not sufficient to guarantee the statistical secrecy of the respondents.
2.16. Risk of Revelation of Statistics Secrecy and Preservation
The citizen’s profiles targeted by INSESS-COVID19 project focus on some subpopulations that represent minorities presumed to be impacted by the COVID. The data collection process has been distributed along the territory in order to minimize the efforts required to BASS professionals, already collapsed by the management of the cases impacted by pandemics. Some of the BASS were providing more than the required 20 citizens, but a number of them provided around 20 or sometimes less. This means that for some profiles, a BASS can provide one or two single people. This raises serious limitations for publishing classical descriptive statistics at the BASS level, as it would be easy for the BASS professionals to disclose the statistical secrecy by identifying the person. This phenomenon happens not only when data is presented at BASS level, but even when minority profiles are studied at Catalan level, by crossed with other variables that can reveal sufficient information to identify the people.
The classical practice of not publishing results about too small subpopulations is not a solution in the context of this project, as vulnerable minorities (even is not statistically significant) require attention and cannot disappear from the picture (let us think about women victim of domestic violence, they are never too much, bus this is not a reason to hide in the analysis what happens with this segment of population, right?)
INSESS-COVID19 is proposing and applying some good practices that preserve statistical secrecy even in front of very small subpopulations.
All data has been taken into account for the computation of global statistics.
All modalities of qualitative variables with too small number of responses have been hidden from the public report (only those with a minimum of 10 responses have been published). The modalities with some responses but not enough to be public are listed in the report. Therefore, one can know that less than 10 people have been accounted in the study for those modalities, but exact number is not available.
Target profiles with less than three participants are only listed as present profiles in the sample, but without the exact number of respondents. This is particular important when the results are reported at BASS level.
The target profiles are not mutually exclusive. Thus, many of the citizens participating in the study simultaneously meet several profiles: for example, single-parent women who also work in the field of essential services, or men with very low wages and in a situation of under-housing, etc. This makes possible to decrease the publishable threshold until three, since one cannot know if the people in this “hidden profile” have only this characteristic or some others and identification of the person keeps preserved.
2.17. Territorial Information
As usual when data is collected over a territory, a map visualizing the statistical information is very relevant. In INSESS-COVID19, four territorial levels were apparently suitable: Cities and villages, BASS, Vegueries, and Provinces. The 947 Catalan municipalities are grouped at a first administrative level in 42 Comarcas. Each comarca is a BASS managing all municipalities inside the comarca with less than 20,000 inhabitants. The municipalities with more than 20,000 inhabitants are a BASS themselves as well. Therefore, Catalonia has 107 BASS in the territory. Vegueries is an intermediate grouping of comarcas. Catalonia has eight Veguerias and four provinces. The province is too big to be considered in the INSESS-COVID19 study as the heterogeneity inside a single province is too high from the social vulnerability side. Thus, BASS and Veguerias are the two territorial levels considered for geographical representation.
It is worth to mention that qualitative variables cannot be represented in maps as a whole, but some specific modalities have to be selected and their territorial proportions represented one by one.
2.18. Metainformation Model
Once the different types of variables have been defined, and the statistical tools to analyze each type of variable is clear, a mechanism to provide intelligence to the scripts performing the descriptive analysis is required. This is based on variable declaration and the implementation is designed on the basis of a metainformation file that provides all required conceptual information to the R system to run proper descriptive analysis, able to use predefined descriptive procedures for each type of variable. The metainformation file has to contain all contextual information from data. Out proposal is to use a metainformation file in form of a table (implementable as a csv file for example) with the following structure: The rows are associated to variables. Some variables provide metainformation through several rows.
Col: Number of column where the variable is in the dataset
Eticol: For rows containing modalities of a qualitative variable. It indicates the column of the variable if it is represented in a single column. For TQQ variables it contains the number of the columns containing the modalities.
Block: As the questionnaire was designed by thematic blocks (economy, health, etc.) the number of the block of the question is specified
Block name: Specifies the name of the block
Block label: Short label for the block to be used in the report
Question: Complete text of the question as it is appearing in the digital questionnaire
Answers: The rows bellow the question contain all modalities in D
Columns: Values of Q for TQQ variables
Rephrasing: A short expression for both questions and possible answers to be used in the statistical tables and graphs, as the long texts will overlap and make reading difficult
Colcurt: Short labels for Q values in TQQ variables
Object: Indicates the kind of information in the row (question, modality, name of Block, separator (between variables)
Type of variable, according to the typology defined above
Descriptive type: Descriptive procedure associated (some types of variable follow similar descriptive tools). Each descriptive procedure uses a specific combination of descriptive tools (classic or including the innovative ones proposed in this paper)
Comments: There is a space to write context information if it is needed.
Reference: In case that question is inspired in a reference survey (see
Table 1). Useful for validation
View: For pattern interpretation, we divided the variables in different groups, depending on the principal topic.
3. Automatic Analysis and Reporting
The key for a getting a quick feedback and, as a consequence, a quick support for the decision-making is to have the technological infrastructure ready to collect data as well as to analyze the data as soon as the collection period is closed.
Data arrives to the on-line questionnaire automatically as soon as participants provide their responses without additional intervention of the research team, other than ensuring the permanent availability of the server.
At any moment, data can be downloaded from the on-line questionnaire in form of a csv file, so several waves can be treated as well to form a continuous panel if required.
The contents of the csv file represents the several questions from the questionnaire following the formats described in
Figure 7 according to the type of the variables representing the different questions.
Given a certain questionnaire, a metadata file can be linked with it, by indicating which type correspond to each variable, and which columns contains the information relative to that variable in the csv.
Each questionnaire requires its own metadata file. Changing questionnaire is relatively simple, so that modifications in the corresponding digital questionnaire can be easily done, and the corresponding metadata file must be modified accordingly.
The analysis of the data collected in the questionnaire is automatically processed through some R and Rmarkdown scripts, which inputs both the dataset in csv format and the corresponding metadata file.
A knowledge component is also implemented, so the procedures know in each moment which kind of analysis is appropriated for each variable, according to its type. This gives the intelligence to the system and is able to manage exceptions. In addition, it can be modified to add new data types including other analysis tools when required. This component is the one including all the guidelines that guarantee the preservation of the statistical secrecy in front of small samples mentioned in previous sections.
In addition, a very important part of the procedure is that Rmarkdown has been designed for automatic reporting in such a way that it produces a formatted Word document with the results. So, the result of the analysis is an editable Word file ready to be read, commented, and post-processed in a very easy way by the decision-maker itself, just requiring specific domain expertise to select the relevant results, to add complementary explanations for the analytical findings, to synthesis the findings in a short overview or to reorder them in a rational that makes sense for the communication of results.
When the analysis must be repeated periodically (every six months for example), the system is also prepared to add those reordering and selection criteria into the automatic reporting part, thus producing a results document much closer to what the expert need to communicate results.
As said before, the INSESS-COVID19 questionnaire is generating a csv file with 195 columns representing 25 blocks of information. Some of the variables split in many columns by internal representation, as explained before. The total elapsed time between downloading the csv file from the questionnaire (located in the server) and getting the Word file containing the results of the analysis by using the scripts designed in the project is about 15 min on average. And the aspect of the obtained document is very close to a final report, as it can be seen in the
Figure 16.
This means that the methodology developed by INSESS-COVID19 project provides a technological infrastructure that permits to get direct and fresh information from the citizens, specific professional collectives or relevant actors involved in a certain decision by direct participation tools, where:
The decision-maker can decide what to ask, even if its information system is not collecting that information (modification of the questionnaire require less than 2 h)
The decision-maker can decide who must receive the questionnaire and when (sample design and representability of respondents being crucial)
The decision-maker can decide if answering the questionnaire is voluntary or mandatory and the response deadlines
Depending on the case, call the respondents may be immediate if personal mails are available, or might require more time, if intermediate institutions must find them and call. However, this is out of the technological part of the proposed methodology.
Once the participants have been called and new questionnaire activated, 20 min would be enough for responding a questionnaire of similar extension as the one build for INSESS-COVID19, and 15 min would provide the working document with the results of the analysis for diagnoses and interpretation, thus constituting a very powerful tool for quick diagnoses of relevant situations for further decision-making, and for implementing direct participatory strategies in a new way of policy-making.
Of course, the proposed tools are not restrictive for policy making, but its use can be extended to monitor any kind of industrial or business process through data monitoring, just modifying the questionnaire, or the input data of the corresponding scripts.
In the following, we synthesize the results of the analysis of the INSESS-COVID19 questionnaire.
Sample Validation
After the data collection, a further validation of the representability of the sample should be required. In addition, this can be pursued by making proportion comparison statistical tests and homogeneity tests to check whereas the distribution of the sample is homogeneous to the distribution of the population. However, this is the first time in Catalonia (and probably in Spain) that a study is conducted targeting 20 vulnerable profiles, independently if they are current users of Social Services System or not. In addition, there are not population data available to make this validation. In fact, all reference official statistics or reports consulted as State of the Art have some similarities with our study, but target populations are not directly comparable, so precluding the possibility to test this part. Being the first time that such a population is analyzed, this work will become the reference to test other studies in the future.
In spite of this limitation, we tried to go further and inspected some of the referent official statistics and reports to see if we could get some clues and indications that our sample is indeed well representing the reference population.
Official statistics from INE or IDESCAT like census or the
padró provide data about the proportion of disabled population in Catalonia, for example, and since all disabled people gets a certification from Social Services, it happens that if the INSESS-COVID19 sample is valid, the sample proportion of disabled persons should be equal to the real proportion reported in the IDESCAT. Same happens with the assigned housing; all families that gained the right to have a gratuit house have been linked to the Social Services system to manage it and the IDESCAT in the Anuari Estadístic de Catalunya 2019 reports the proportion of the Catalan population in this situation that is as well comparable with the one appearing in INSESS-COVID19 sample. Same situation occurs with Widow people, which is officially reported in the census from INE and all of them process their pension through the Social Services system as well.(
Table 6) However, the proportion of married people would not be comparable. Indeed, since census is done for the entire population and being vulnerable or not directly impacts in the capacity of marrying (which is an indicator of stability), official census statistics on married people cannot be directly compared with those from our sample, where only vulnerable population is targeted.
The official report from Social Services in Catalonia (the Rudel report) cannot be used for the comparison, since is only reporting about Basic Social Services, and we are also including in our study other segment of populations like mental health patients which are users of Specialized Social Services and same happens with other profiles included in the sample. In addition, the Third Sector Barometer provides interesting information, but only regarding Third Sector users, as expected, and in our sample, we are including people that never before has been linked to the Social Services System neither to other Third Sector entities. For example, entrepreneurs that had bankrupt are included in the INSESS-COVID19 sample cause they are a vulnerable group that merits attention and might become users of the Social Services system in the near future, but these people have never been part of any of the statistics provided by Third Sector Barometer or Rudel report. In addition, workers from essential services occurred in the INSESS-COVID19 sample come from healthcare system, social services system and hostelry sector. None of them structurally linked with Social Services before. In addition, official statistics about the size of those professional sectors are unusual as well, since they include non-vulnerable people, which are not targeted in the INSESS-COVID19 sample design.
In synthesis, for those indicators where an external official statistics is available and comparable with the configuration of INSESS-COVID19 sample, the sample looks representative, but the global validation is non-suitable, being INSESS-COVID19 a pioneer study in its category.
Finally, the global statistic error of the sample is 3%, which is small enough to provide significant results.
4. Results
In the following the main results of the questionnaire, presented to the Catalan government last 15th December 2020 are synthesized in such a way that the different tools used in the analysis are illustrated and global results discussed. The territorial coverage of the respondents is reasonable (971 responses), although some areas in Tarragona province did not engage the INSESS-COVID19 project as a consequence of the overflow in Social Services already referred before. Here number of responses are presented in aggregated way. Later, those BASS with less than five respondents are preserved from public results, and only used for internal analysis and for building the final global results.
Figure 17 visualizes the participation of the BASS providing some response to the questionnaire. White corresponds to BASS that did not participate into the project.
Figure 14 and
Figure 18 shows the Paretto diagram. It can be seen that some specific BASS provided more than the required 20 participants.
Figure 19 provides participation at the level of Vegueria.
4.1. Economic and Working Impact
Question L3.1.: Indicates your personal working category in January 2020, July 2020 and your forecasting for January 2021 (“Indica la teva categoria laboral a gener i juliol de 2020 i quina creus que serà la teva categoria laboral al gener de 2021”)
Responded by the entire sample. Some conclusions are visible in
Figure 22, the working Category Frequencies.
The number of people who do not work and receive no benefits raises a 50%
The n. of people who do not work and receive some benefit raises by 17.6%
The number of people who have no job or occupation increases by 11%
Question L3.2. and L3.3.: Indicates your personal working situation in January 2020, July 2020 and your forecasting for January 2021 (“Indica la teva situació laboral a gener i juliol de 2020 i quina creus que serà la teva situació laboral al gener de 2021”) See Working situation frecuencies in
Figure 23.
These two questions provide different modalities for the working situation:
From similar tables made of question L3.2. (1. Cindefinit (Permanent contract), 2. CtempActiu (fixed term contract), 3. TreballPerCTemp (intermitent temporal contracts), 4. TeballNregul (irregular working activity), 5. ERTO (temporal regulation process), 6. RecentCtemp (recent temporal contract iniciated), 7. TrobaFeinaFixa (Fix work found) it was found that:
The number of people who had a business and stopped working during the lockdown or went into bankrupt increased by 110%
The number of people with non-precarious working conditions (permanent or fixed-term contracts) decreased by 41.62%.
The 51.25% of people without a job are afraid of not working by January 2021 (the most mentioned reasons are that many companies closed because of COVID19, after a certain age, possibilities to be contracted again decrease, for certain sectors, the people is afraid to be infected by the employee and prefer not to contract new workers).
Regarding Economic Situation
Question E1: Economic situation at January 2020 and July, and forecast for January 2021 (“Situació econòmica a gener i juliol de 2020 i previsió per gener de 2021”) See multiple barplot in
Figure 10, grid of Pie charts in
Figure 11 and proportions in
Figure 24 which show question.
Question E2.: Did you need to submit for some of the special supports to receive funds to mitigate the problematic created by COVID-19? (“Has necessitat acollir-te a algun dels ajust especials que s’han posat en marxa per mitigar la problemàtica per la COVID-19?”).
The number of people with economic problems increases a 23.34% (this accounting for those with difficulties to resist the entire month, those with new debts by the end of the month and those that require external economic help to go ahead)
A 42.8% of them is convinced that they will have economic scarcity by January 2021
A 62.20% of respondents had some Social Services need
A 46.1% needed support for food (from them a 64.51% searched it into the BASS)
A 25.00% needed support to pay the rent of the house (and 51.85% of them searched for it into the BASS)
A 11.8% asked for Renda mínima garantida (minimum vital rent) and 51.3% of them searched for it in Catalan government
A 15.7% needed psychologic support, and 51.3% of them searched it into the BASS
A 51.8% needed a support that implied some economic benefit. Unfortunately, a 70.37% of them did not received the payment by 1st July 2020. Some of them couldn’t complete the electronic submission by lack of digital skills, some of them (14.41%) were out of the restrictive eligibility criteria. See in
Figure 25 Cross table of E2.AjutsCOVID19 per levels.
Special attention requires the difficulties on life conditions, smoothed by the alarm state, as all eviction processes were interrupted. Nevertheless, they will emerge again in the next months:
A 27.18% lives in social houses or shares a room in a flat (Question F4. Way of living (Habitatge) from the questionnaire)
A 27.1% needed support to pay the electricity or gas bills (and 67.30% of them searched help into the BASS)
A 10.8% needed help to pay taxes
4.2. Social Impact
A 15.24% are dependent people (Question D1: Do you have some dependency degree (tens algun grau de dependència) of the questionnaire?) See barplot in
Figure 26a
From them a 55.40% refer a worsening dependency process from January 2020 (and a 53.65% of them attributes worsening directly to COVID19) (Question D2: Do you think your dependency level would be different if you would be reevaluated now? Creus que si et valoressin ara tindries una variació en el grau de dependència?) See Cross Table of T1.1 per levels in
Figure 26b.
The questionnaire gets information also from the other side of dependency. The side of the informal caregivers:
Question PC2.1: How many dependent people have you in charge, according to the age? (Quantes persones en Grau I de dependència tens a càrrec en les diferents franges d’edat? (0–11) anys)
This variable has one more complexity level, because dependency is classified in three groups of increasing severity by introducing a fourth variable into the analysis. So, to analyze this item the three variables considered are:
Severity of dependency: Ordinal variable with three modalities: Degree I (lower impairment), Degree II and Degree III (higher impairment)
Age group: Ordinal variable with 4 modalities determined by experts: Children: (1–11) years, Teenagers: (12–17) years, Adults: (18–69) years, Elderly: more than 70 years.
Number of dependent people in charge: discrete variable: (0,1,2….)
Also, the questionnaire includes an entire block dedicated to the use of time. See Multiple stacked barplot of questions PC2, PC3 and PC4 in
Figure 27.
For each degree of severity, the inner analysis replicates the structure of the previous questionSee multiple barplot of question PC2 with the number of degree I dependent people in charge per age group
Figure 28.
See Cross table of question PC2 with the number of degree I dependent people in charge per age group
Figure 29, temporal proportions table in
Figure 30 grid of pie charts in
Figure 31.
In addition, the questionnaire includes an entire block dedicated to the use of time, from which we can see that:
Question R1. RelUConv: How were on average the relationships in the following environments (“Com eren majoritàriament les relacions que mantenies amb les persones en els diferents àmbits?”).
This is a pack of questions asking for Convivenctial unit (Unitat convivencial), Family, Neighbours, Friends, WorkingMates and other. In all of them, the pattern “Vꓥ” is observed more or less intensively.
A total of 93 patterns are observed from which 30 can be listed as the others have a too small frequency to be published under guaranty of preserving statistical secrecy.See trajectory map in
Figure 9.
See Trajectory frequency table in for question R1: RelConv in
Figure 32.
The automatic report provides the bivariate multiple plot and the frequencies table and the grid of pie charts as well. Here the proportions table is shown. See
Figure 33.
Figure 12 shows the transition table between January and July 2020 and
Figure 34 between July 2020 and January 2021 and one can see which changes in the quality of the relationships are more frequent. During the lockdown a 7.92% of the participants moved from satisfactory relationships with people living in the same home to worse situations (most of them to worrying relationships or tense), whereas a 4.53% improved their initial relationships to satisfactory.
See changes reported along time in question R1,RelUConv per time in
Figure 13a.
See Change patterns in convivential unit in
Figure 13b, change patterns in familiar relationships with people living out of home in
Figure 14a and change patterns in relationships with neighbours in
Figure 14b
See trajectories map in
Figure 35 and change patterns in
Figure 36a about relationship with friends. See change patterns in labour relations in
Figure 36b.
The “Vꓥ” pattern appears again here, with certain proportion of people that behaves more links with other people during the pandemics, and those that feel more isolated
Question Soc4.: The pandemics created links with other people (family, friends, neighbours, etc.)? La pandèmia: T’ha creat vincles d’unió amb altres persones (família, amistats, veïnatge, …). Barplot of isolation feelings during pandemics in
Figure 37a and intensification of links in
Figure 37b.
Figure 38a shows frequency table of isolation feelings and
Figure 38b intensification on links.
Question: Do you feel or have you felt alone? (T’has sentit o et sents sol?).
Results are shown in different figures. See trajectory map of loneliness feelings in
Figure 39, Trajectories frecuency table in
Figure 40, multiple barplot in
Figure 41a and proportions per level in
Figure 41b. See Grid of pie charts in
Figure 42. Changes January 2020–July 2020 are shown in
Figure 43a and see planned changes in July 2020–January 2021 in
Figure 43b.
A 72.7% of respondents felt more isolated
The loneliness feeling increases by 29.3%. This is a pattern mainly followed by women (70%) more than 60 years old (on average), living alone, with some lack of digital skills and a 52.18% of them requiring emotional support during pandemics.
A 41.45% of participants required psychological support due to COVID19 and from them a 30.95% required emotional support.
A 23.58% of participants referred some mental disorder in January 2020. From them: a 96.94% received pharmacological treatment. Among people with mental disorders, 46.28% suffer from depression and 58.51% suffer from anxiety disorder.
The 73.78% of people with mental disorders declared to feel worse in July 2020
A 68.86% of people with depression declares to feel worse in July 2020
A 72.3% of people with anxiety declare to feel worse by July 2020
A 5.12% of people without mental disorders in January 2020 declare feeling worse in July 2020
A 57.93% of people with disabilities feel worse and 58.33% of them attributes worsening to the COVID19
Moreover, a 49.64% of participants have teleworked or have followed online training during the pandemics, while only a 5.19% of them already did tele-activities in January 2020. In July 2020, a 21.84% of people involved in tele-activities (working or education) suffered the impact on care activities (relatives, elderly, children…). A 54.4% of them required emotional support. See frequency table of Mental Disorders in
Figure 44a and Marginal barplot of Mental Disorders in
Figure 44b.
4.3. Violence
Among the options to choose for the quality of the relationships at different environments (questions R1 to R9 of the questionnaire), particular options asked if the person is being object of violence, either physic emotional or psychic. In total, a 6.38% of the respondents declare to be victims of some form of violence. From them, a 72.58% are women. Civil status, profession and academic level are transversal among these group (17.4% have university studies). A common characteristic of these people is that 90.33% of people have working precariat (no stable or temporal contract, but other irregular ways of work or unemployment). The questionnaire poses two additional questions to get more details about the pattern of the aggressor and the forces balance with the victim.
Question R4. Aggressor: If you have been object of violence, who performs it? (“Si has indicat ser objecte de violència, qui exerceix aquesta violència?”) See frequency table of kind of aggressor in
Figure 45a and bar plot showing who is the agressor in
Figure 45b. See the frequency table of R4 .Agressor in
Figure 46.
4.4. Synthesis of Remaining Results
In the following, we synthesize the results of applying the automatic intelligent scripts to the entire dataset.
4.4.1. Economic and Working Impact
The number of people who do not work and receive no benefits raises a 50%
The number of people who do not work and receive some benefit raises by 17.6%.
The number of people who have no job or occupation increases by 11%
The number of people who have been licensed or folded raises by 78.04%
The number of people who reduced their working hours increases by 36.36%.
The number of people who had their own business and stopped working during the lockdown or went into bankrupt increased by 110%
The number of people with non-precarious working conditions decreased by 41.62%.
The 51.25% of people without a job are afraid of not working yet by January 2021 (the most mentioned reasons are that many companies closed because of COVID19, after a certain age possibilities to be contracted again decrease, for certain sectors, the people is afraid to be infected by the employee and prefer not to contract new workers).
The 51.25% of people without a job are afraid of not working yet by January 2021
The number of people with economic problems increases a 23.34%.
A 42.8% of them is convinced that they will have economic scarcity by January 2021
A 62.20% of respondents had some Social Services need
A 46.1% needed support for food (from them a 64.51% searched it into the BASS)
A 25.00% needed support to pay the rent of the house (and 51.85% of them searched for it into the BASS)
A 11.8% asked for Renda mínima garantida (minimum vital rent) and 51.3% of them searched for it in Catalan government
A 15.7% needed psychologic support, and 51,3% of them searched it into the BASS
A 51.8% needed a support that implied some economic benefit. Unfortunately, a 70.37% of them did not received the payment by July 1st, 2020. Some of them couldn’t complete the electronic submission by lack of digital skills, some of them (14.41%) were out of the restrictive eligibility criteria
A 27.18% live in social houses or share a room in a flat
A 27.1% needed support to pay the electricity or gas bills (and 67.30% of them searched help into the BASS)
A 10.8% needed institutional help to pay taxes and tributes
A 51.8% of participants submitted applications involving economic support to the administrations during the first wave
The 70.37% of applicants for economic support did not receive a penny by July 1st 2020
(They mention a variety of reasons among which we can highlight the delay on resolutions, the difficulties to make the submission, the impact of digital gap of making the digital application, the restrictive eligibility criteria that left excluded a 14.41% of the people that declare to need the support).
4.4.2. Social Impact
A 67.5% of the participants to INSESS-COVID19 project are women.
A 15.24% of the participants are dependent people
From them a 55.40% refer a worsening dependency process from January 2020 (and a 53.65% of them attributes worsening directly to COVID19)
A 16.99% of respondents had dependent people in charge in January 2020
The number of people with dependents in charge increased by 40.43% by July
An 18.02% of the respondents didn’t declare dedication to dependent people in January and declared to dedicate more than 70% of their daily time to this matter by July
A 72.7% of respondents felt more isolated
The loneliness feeling increases a 29.3% and this is a pattern mainly followed by women (70%) more than 60 years old (on average), living alone, with some lack of digital skills and a 52.18% of them requiring emotional support during pandemics.
A 41.45% of participants required psychological support due to COVID19 and from them a 30.95% required emotional support.
The 73.78% of people with mental disorders declared to feel worse in July 2020
A 68.86% of people with depression declares to feel worse in July 2020
A 72.3% of people with anxiety declare to feel worse by July 2020
A 5.12% of people without mental disorders in January 2020 declare feeling worse in July 2020
A 57.93% of people with disabilities feel worse and 58.33% of them attributes worsening to the COVID19
A 54.4% of the people making teleworking or tele-education during the pandemics required emotional support
4.4.3. Violence
In total, a 6.38% of the respondents declare to be victims of some form of violence.
From them, a 72.58% are women.
Civil status, profession and academic level are transversal among these group (17.4% have university studies).
A 90.33% of people are under a working scarcity.
Often the person is victim of more than one aggressor simultaneously: 14.51% receive violence from tqo profiles of aggressors simultaneously; 27.42% from three
In a 93.54% of the cases, the aggressor shares an equality relationship with the victim, being a neighbor, a friend, a brother…
In a 45.55% of the cases the aggressor has a power relationship with the victim, being a father, a boss, a professor, etc.
5. Discussion
In 2020 the crisis of the Covid-19 is impacting segments of population that were already affected by the previous crisis, being the job area, the working class, and the young population the segments more punished again. Nevertheless, not only that, as we shall see.
INSESS-COVID19 shows as some of the most relevant impacts between January and July 2020 the economic indicators listed in
Section 4.4.1. Economic and Working Impact Among the working class, there is a pessimism that merits attention. People is worried about their future and an important part of them think this situation will not improve neither in the short or midterm.
Uninterrupted decrease of incomes of many people and families is acceleration the increment of poverty risk in Catalan society, for both moderate and extreme poverty. This has raised the demands of need to public social services and third sector entities, as well as help and economic support submission applications.
Special attention requires the difficulties about life conditions, smoothed by the alarm state. The sudden impoverishment of wide segments of population will have a delayed effect on the lack of capacities to pay taxes, bills of domestic services like gas or electricity, the house rent, or the bank quotes for loans and mortgages. The alarm state declared by the government has interrupted all eviction processes. Nevertheless, they will emerge again in the next months, as soon as alarm state is abolished, and these processes will be reactivated in a much worse context than when they were interrupted.
In fact, the ERTO (temporal regulation of occupation procedures), institutional helps to self-employed people and other economic funds provided by the governments contributed somehow to smooth the economic effects of the pandemics, inefficiencies and delays on the management and resolution of applications sensibly diminished the positive impact they could have had.
Until here, the main conclusion is that the COVID19 has raised a crisis that impacts on population segments already punished by the previous crisis on 2008, which were not recovered yet, thus creating an amplified impact towards poverty and social vulnerability in many critical needs, like housing or work.
However, as said before, there is something new in the COVID19 crisis, that was not observed in previous crises and that worsen even more the social vulnerabilities of the people. As it has been seen in
Section 4.4.2. Social Impact, where indicators are showed. The COVID19 crisis is also a social crisis and a crisis of relationships, and it is impacting as well to other population segments different from those affected by the 2008 crisis, as a consequence of the new social vulnerabilities emerged from social distance measures that pandemics management required: Restricted mobility, home lockdown, social isolation, teleworking, accelerated digital transformation, interruption and delay of court and administrative processes, etc. These measures caused serious impacts to women and elderly.
In addition, this is in seriously different from official common figures. Indeed, according to CCI2018, a 58.5% of the users of Social Services are women. The proportion of women in the INSESS-COVID is significantly higher. In addition, this points out to a bigger impact of the pandemics on the vulnerability of women, provided that gender was not a criterion used in any of the 20 target profiles defined to participate in the project. So, when BASS were finding people following those 20 profiles, it happened that most of them were satisfied by women. Indeed, women assumed a heavy load in the worse periods of the pandemics, informal caregivers tend to be women, single-parent families, women in charge of dependent people, children or people with disability or mental disorders. Nevertheless, not only, most of the health and social services professional profiles strongly stressed during the pandemics tend to be female works as well. Finally, many widows are also women, so old women leaving alone are also seriously impacted by isolation, loneliness and dependency issues during the pandemics.
On the other hand, mobility restrictions and the high vulnerability to COVID-19 of elderly people caused serious confinement-related impacts to this segment of population: loneliness, isolation, depression, digital gap, etc.
The questionnaire gets information also from the other side of dependency. The side of the informal caregivers
Regarding social relationships and participation, in all areas, working, familiar, friendships... the pattern “Vꓥ” is observed for the confinement period involving the double dynamics of:
Strengthening the links, increasing solidarity and intensifying participation, even in voluntary activities
Disconnecting and isolating from relatives, friends, neighbors, colleagues
Thus, many segments of population required psychological and emotional support. The loneliness feelings, isolation and mental impairment raised in many people, especially in elderly.
Finally, the violence has also been present during the pandemics as show violence indicators in
Section 4.4.3 Violence
The questionnaire also includes information about the digital gap and the interruption/delay or court and administrative processes (divorces, regularization, evictions, etc.). The most impacted groups are women in different forms, and one of the more impressive patterns is that of women victims of violence, who had to pass the confinement at home together with the aggressor while divorces or restraining orders were interrupted in court.
As a main advantage of the proposed methodology, we are providing a tool for direct participation that can provide access to query citizens (or professionals whenever needed) in quick times, and process collected data very quickly. The questions can be adapted to each application experience, and the analysis will keep in automatic, provided that the Metainformation csv file is provided together with dataset. In addition, a special design of the questionnaire can solve the small number of responses by substitution of respondents that can delay along time without losing validity of dataset a long time. Finally, the results are offered in form or working document in Word that is radically unshortening the capacity of using this results in strategic meetings immediately after data download from digital questionnaire.
As all studies based on citizens data, results depend on the truth of the answers provided by participants.
Time required to complete the study depends on the celerity of BASS searching participants, and response time of the participants. Face-to-face workshops proposed in INSESS-COVID19 were designed to mitigate the time required for data collection step and pilots proved their effectiveness, even if the pandemics constrained to work under the “free” modality. Limitations to celebrate workshops as originally designed were solved by developing new modalities for the workshops. Counterpart, free open workshop increases coverage but loses control of time to provide the response. In any case, the technology developed and the statistical new descriptive tools proposed perform well and quickly and they will provide much valuable results when answering the questionnaire becomes mandatory (this depends on the topic of the consultation).
The proposed methodology constitutes a powerful tool to disclose the underlying patterns of social vulnerability in Catalan territory, but is still not providing predictions on Social needs of population in the current months. Once the patterns have been discovered, the predictive model for the specific patterns will become reachable with the next step of the analysis and classifier techniques will be used.
Data comes from the entire Catalan Territory, but selected participants identified by the BASS are not obliged to answer, so that, some of them might skip the commitment and generate poor data from some BASS. In addition, sample heterogeneity between territories might appear. However, this heterogeneity is associated with intrinsic characteristic of the territory itself, so, it is not necessarily wrong. However, this can be compensated by calling new substitute participants with same profiles and their answers will be valid thanks to the introduction of temporal variables included in the questionnaire, even if he/she was answering the questions with important delay.
6. Conclusions
The impact of the COVID19 crisis on the Social Services along the territory involves two related dimensions: the impact on people in need of social care, and the impact on the praxis of social services professional teams. The COVID19 crisis appeared in a moment when, as a society, we had not fully recovered yet from the economic crisis started at 2008, and has added an additional burden to social services from all over the country that are already far overflowed.
This pandemic came when our technological maturity was less advanced than we, as a society, would have liked. We still cannot use the data as an immediate asset in crisis management.
The INSESS-COVID19 project has developed a technological tool suitable for collecting fresh and direct information from citizens almost immediately, and ready to analyze it with generic and automated processes that can be very helpful to deal with new and unexpected situations, like the management of emergencies and disruptions (as COVID19 was). Data Science and Artificial Intelligence are the disciplines that enable it. We stopped collecting data just one week before public presentation of results in front of the government. Everything was processed in a very short time. INSESS-COVID19 solves the extraction of added value from data in a very short time. The single current limitation is now the availability of data, the time taken by the citizen to get involved, to participate, to answer the questionnaire, the time required by the administration to think about which questions need to be addressed, to whom and when. The analysis of the 971 answers collected from citizens belonging to the 20 target profiles and distributed all over entire Catalonia, and including as well some individuals that had never been users of Social Services, but they start to be after the pandemics first round.
An innovative methodology to collect, analyze and report this data is proposed. It helps to see what is happening, to understand the main trends in different parts of the territory and to identify the relevant indicators for future studies where predictive models of the identified relevant socioeconomic parameters can be analyzed to build predictive models helping the decision-makers to anticipate. In addition, our results are producing the key inputs to be used in simulators for Decision Support.
The methodology is flexible to work upon other questionnaires and other subpopulation of respondents with minimum modifications required. It provides a new tool to get relevant decisional knowledge for decision-making support at many different decision-making levels, from most operative, to most strategic, including policy-making support.
The INSESS-COVID19 project shows how the COVID19 crisis is impacting, on the one hand, on same populations segments that were already damaged of the last economic crisis (2008) and, on the other, it impacts on new groups, rising emerging social needs that also demand the attention of Social Services: women and elderly.
The economic slowdown that began in 2008 affected the labour market in a particularly negative way and generated a double process of impoverishment due, on the one hand, to falling incomes and rising inequality in their job distribution and, on the other, the collapse of lower incomes. This situation limited the opportunities that individuals and families had to resolve their economic difficulties and increased existing social differences. Rising unemployment, prolonged unemployment, precarious wages, job discontinuity or the low purchasing power of retirement pensions weakened family economies, and this increased the problems and complexity of social situations, and it accentuated the processes of social exclusion of individuals and families. Among the most affected profiles were those who had lost their jobs, unemployed young people looking for their first job, young families with dependent children, single women with family responsibilities, single men without a home, elderly women with pensions. non-contributory and irregular immigrants.
In this work, a specific methodology to guarantee that the analysis of the territorial data is preserving the statistical secrecy for minority subpopulations is proposed, so that the information can be used for the decisions without risks of revealing the identity of participants.
In the future work, in-depth analysis is in progress to find BASS with similar profiles that admit a common local report that preserves statistical secrecy while providing specific information to the BASS. Clustering of BASS through multiview clustering techniques and semi-automatic knowledge-based dimensionality reduction techniques are being used to characterize BASS with a synthesis indicator of each block of information so that a better perspective of territorial similarities is elicited, and the real policy strategies can be descended at territorial level.


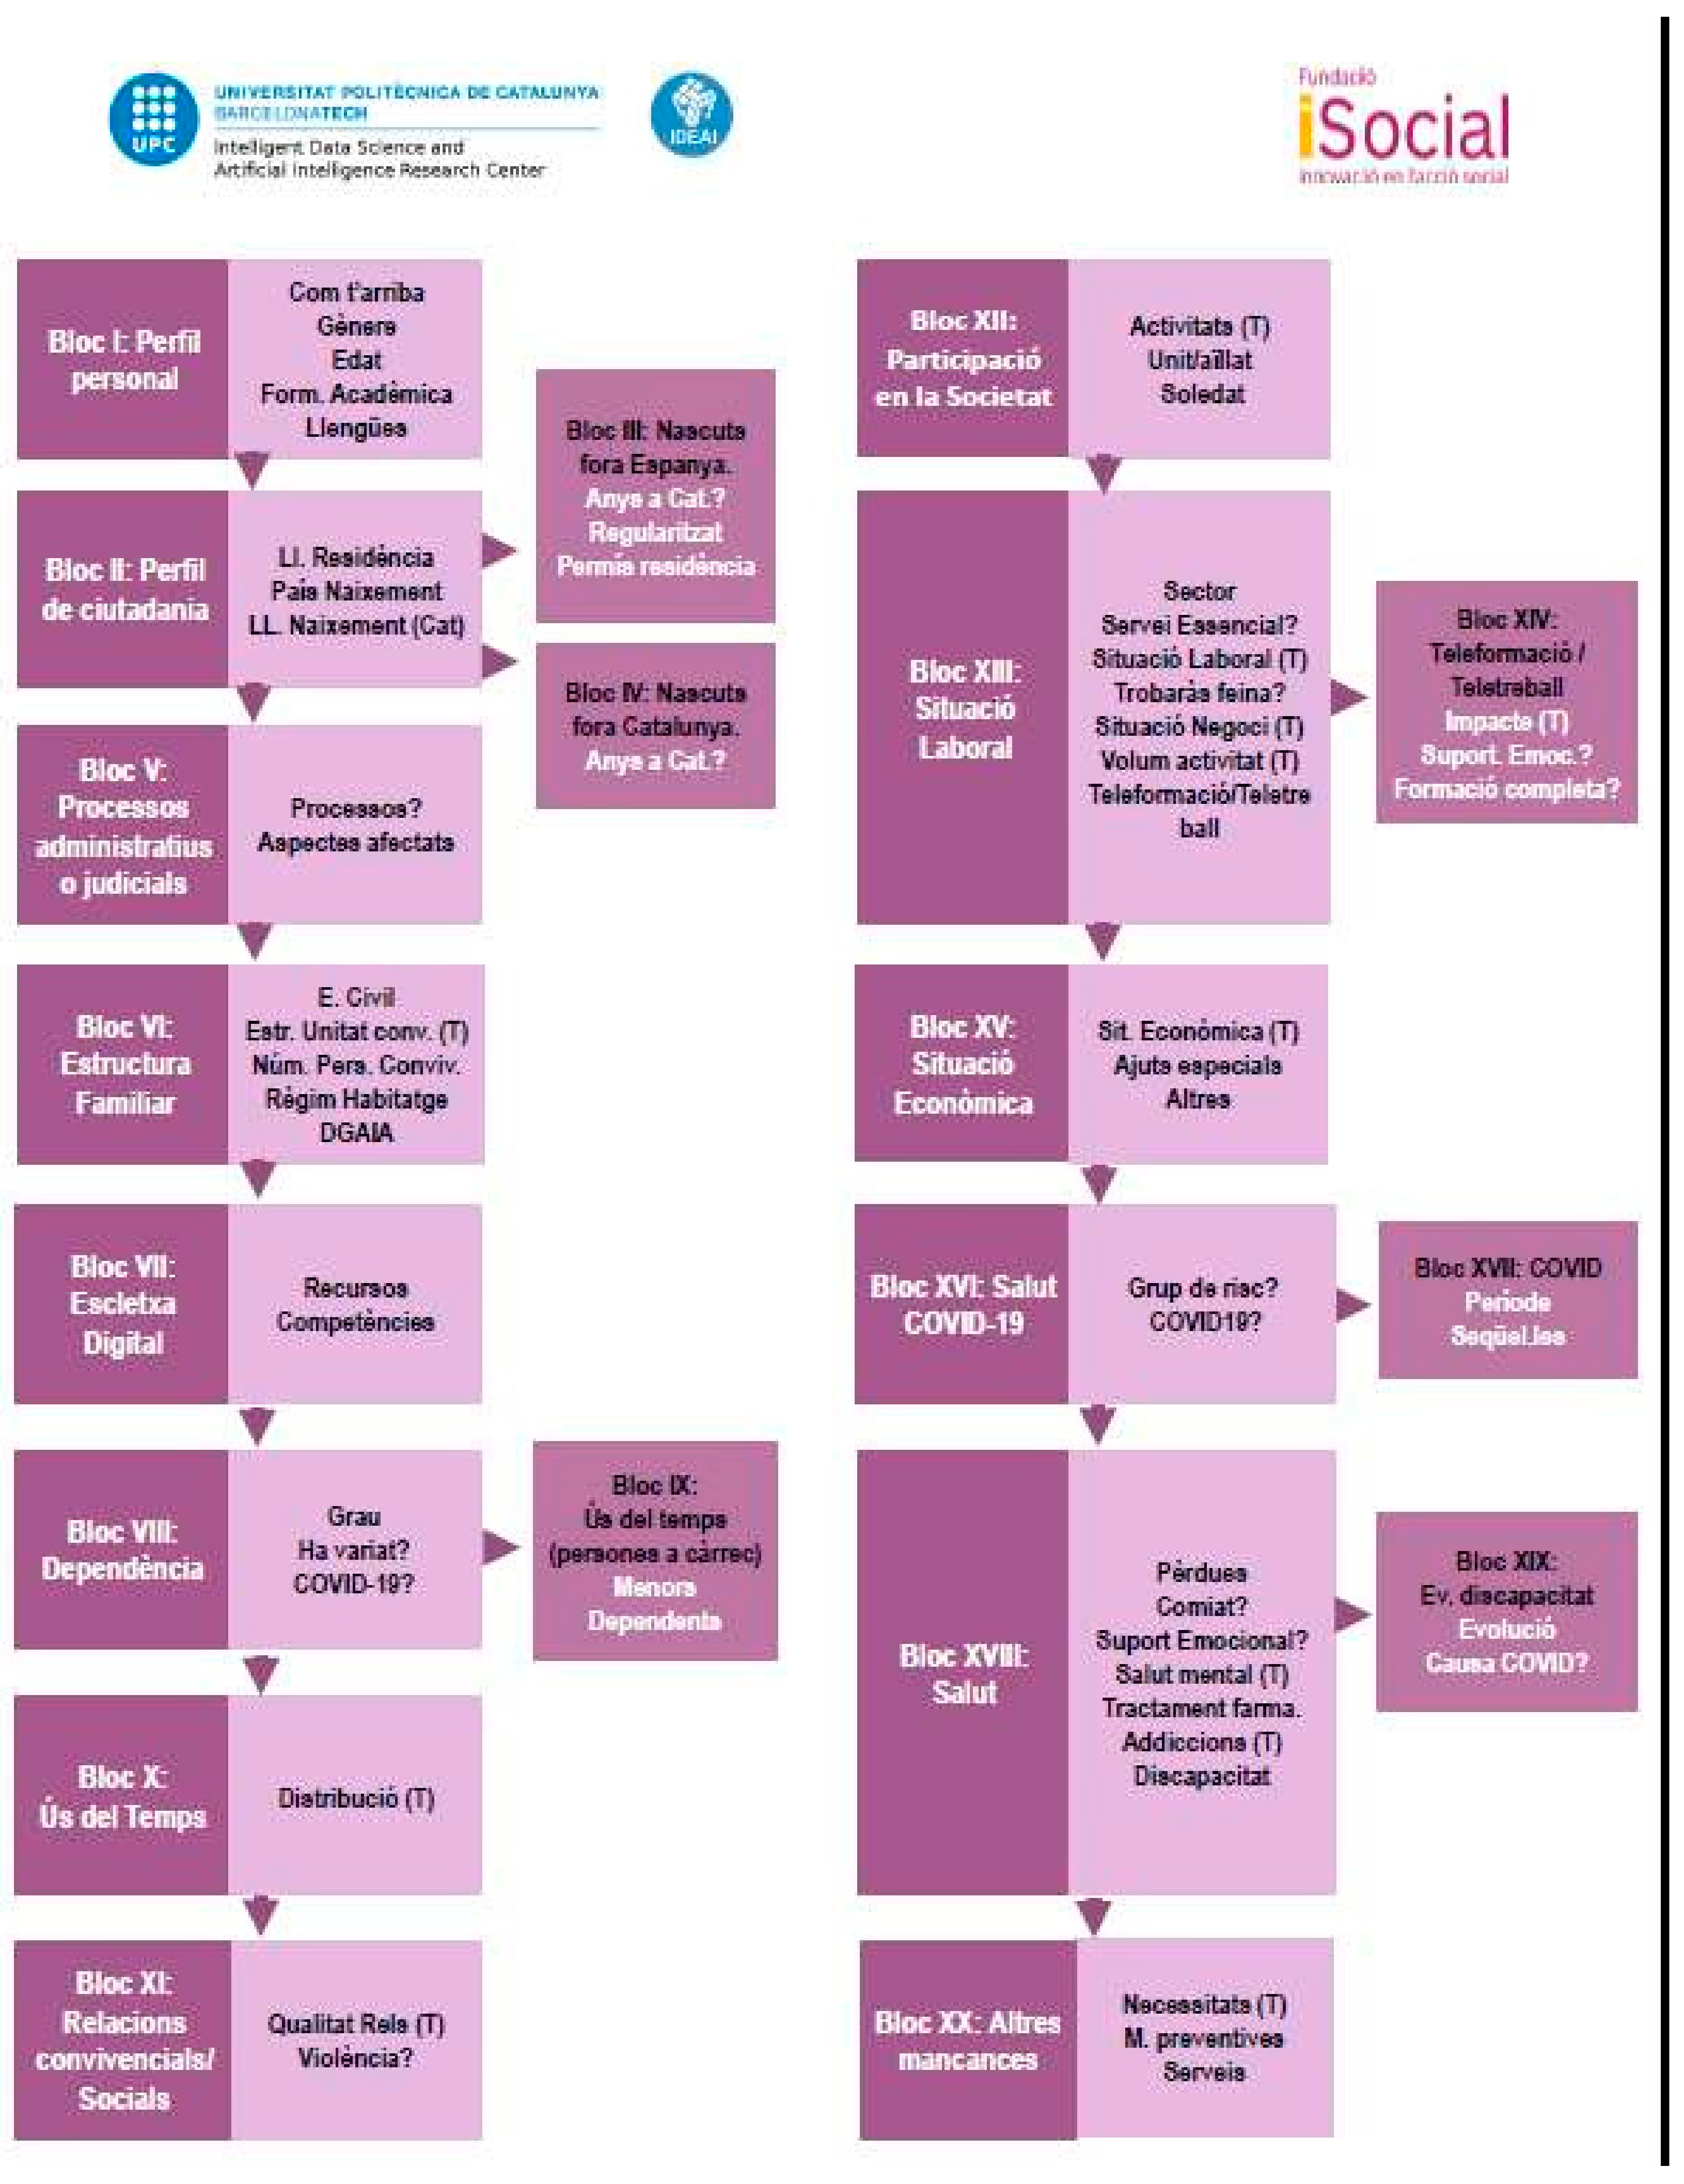

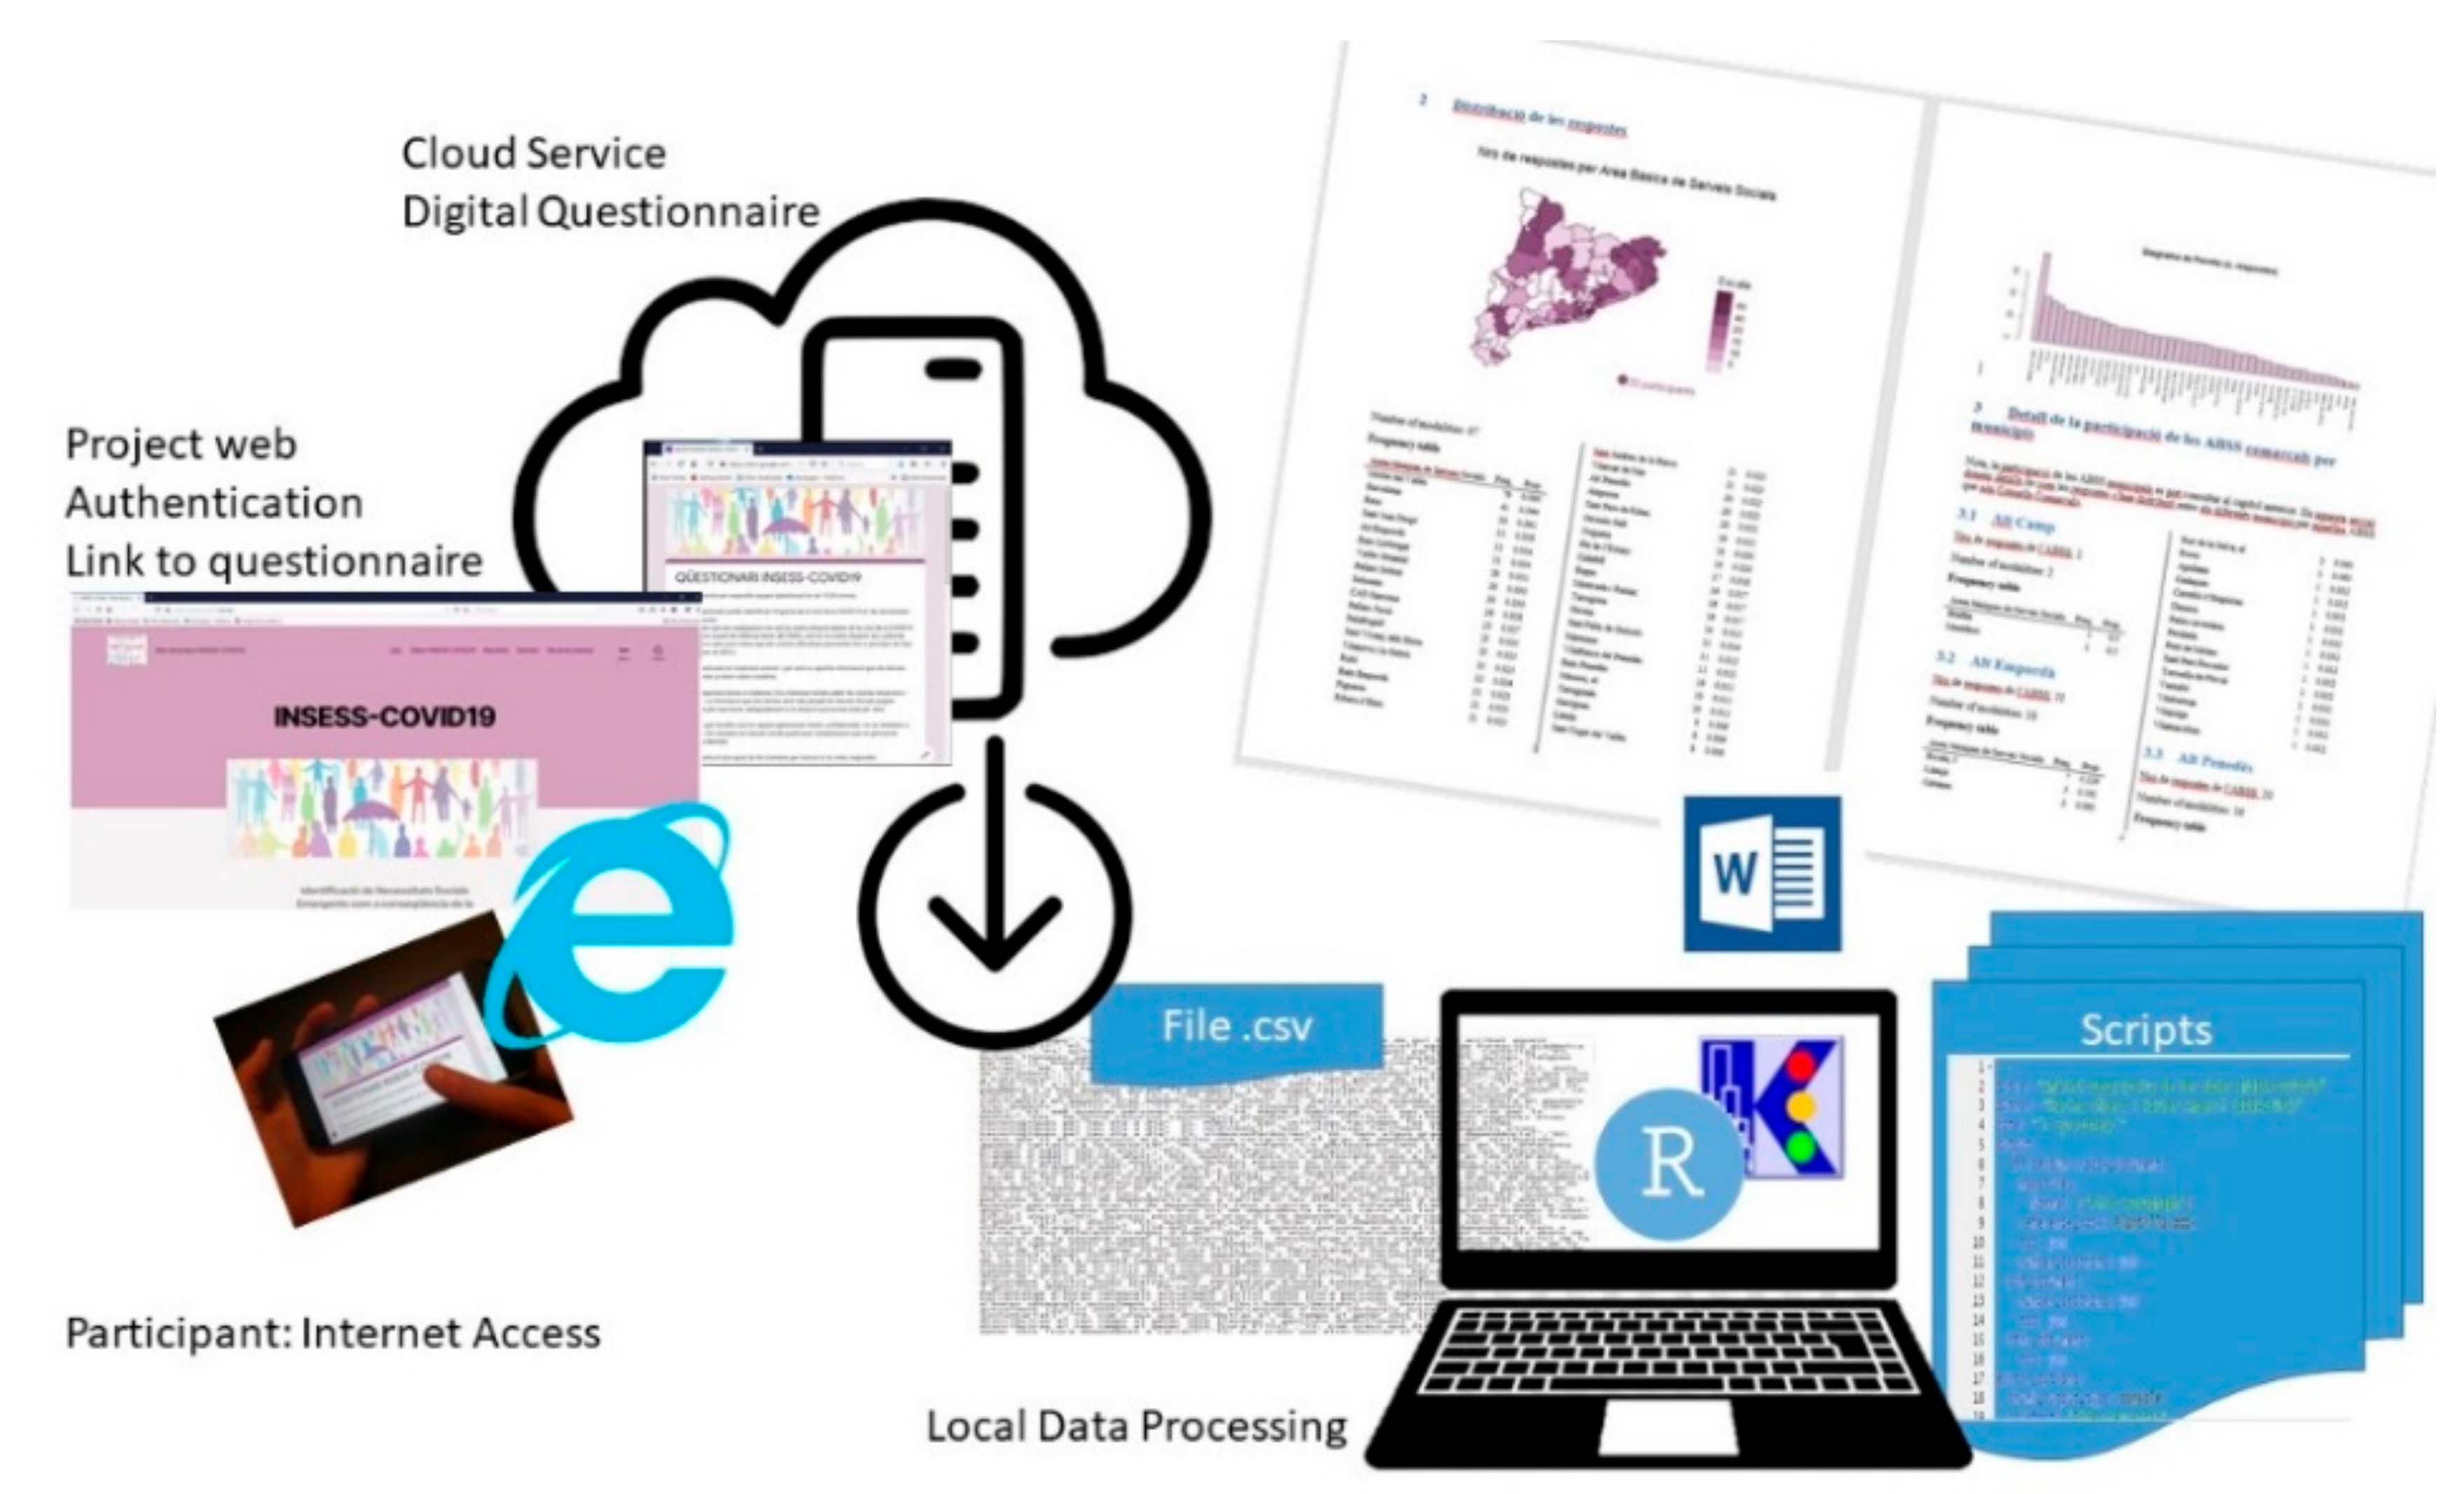

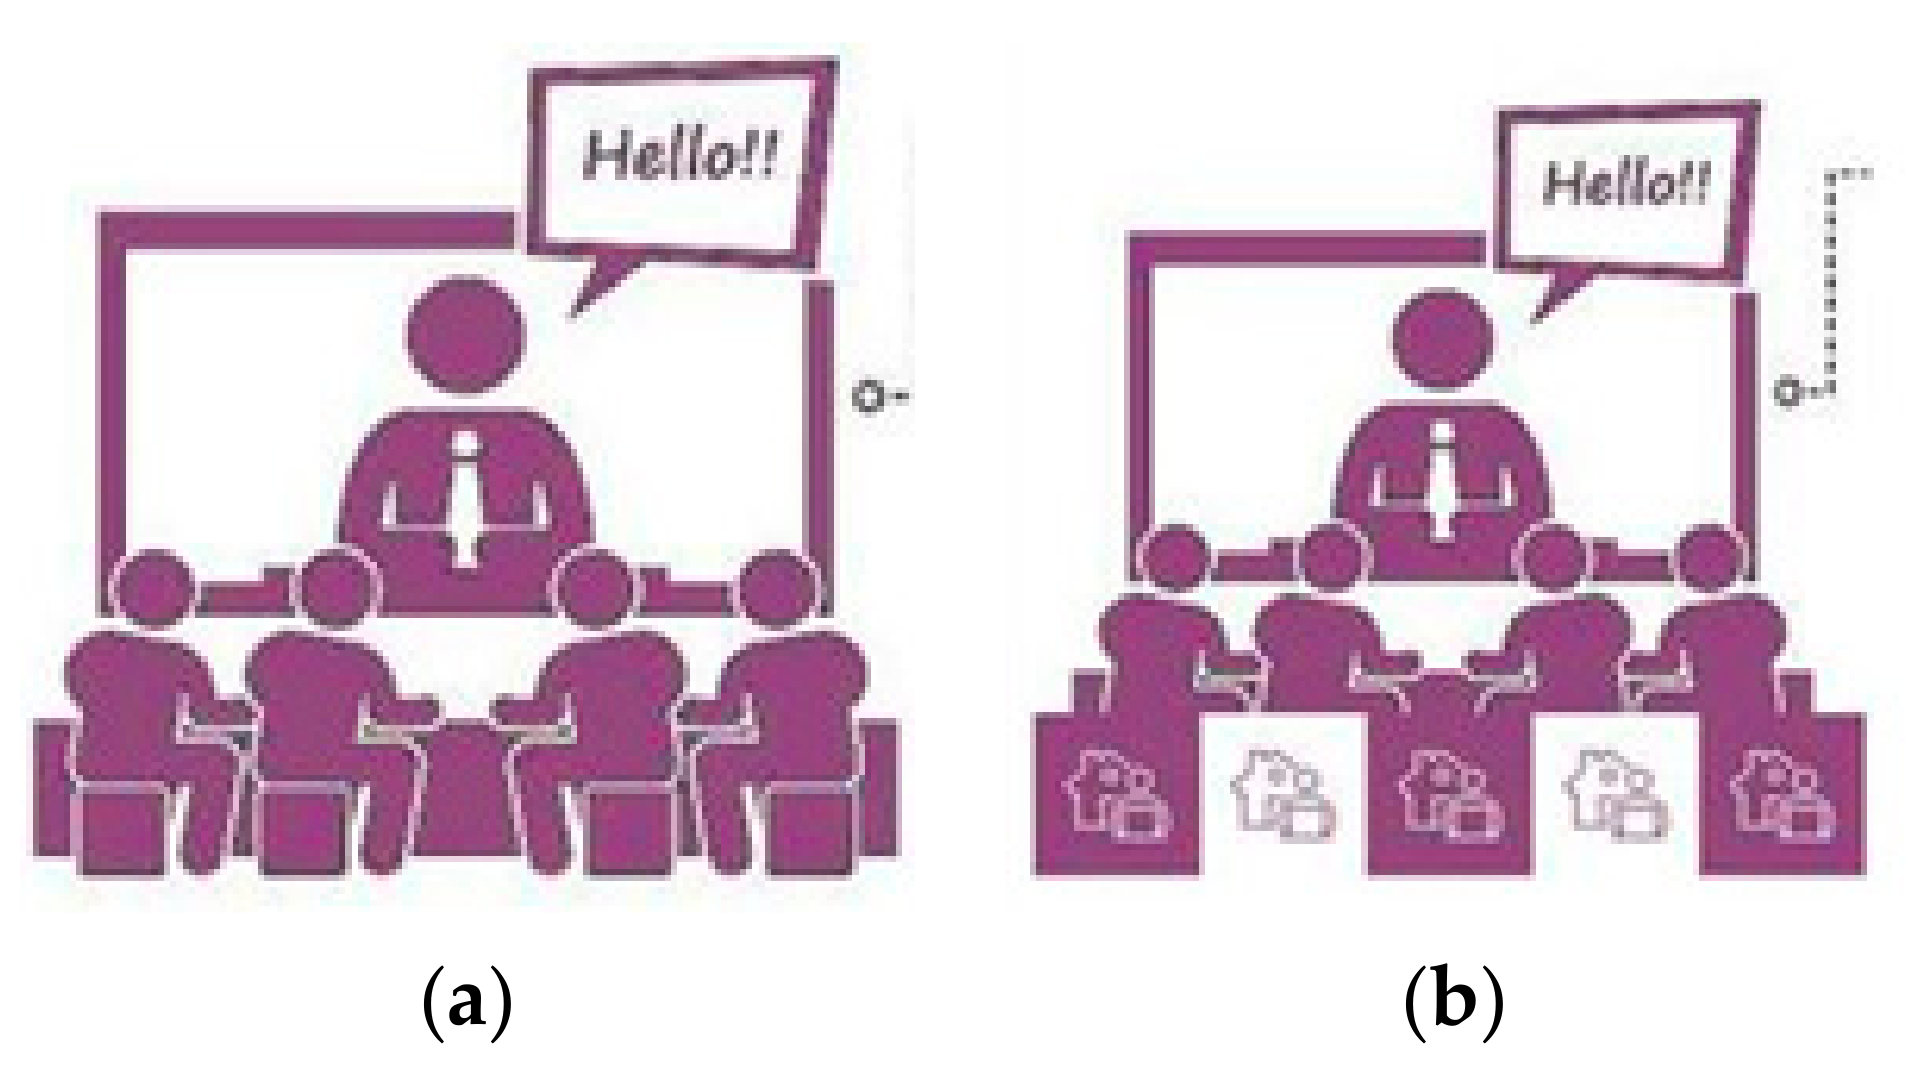
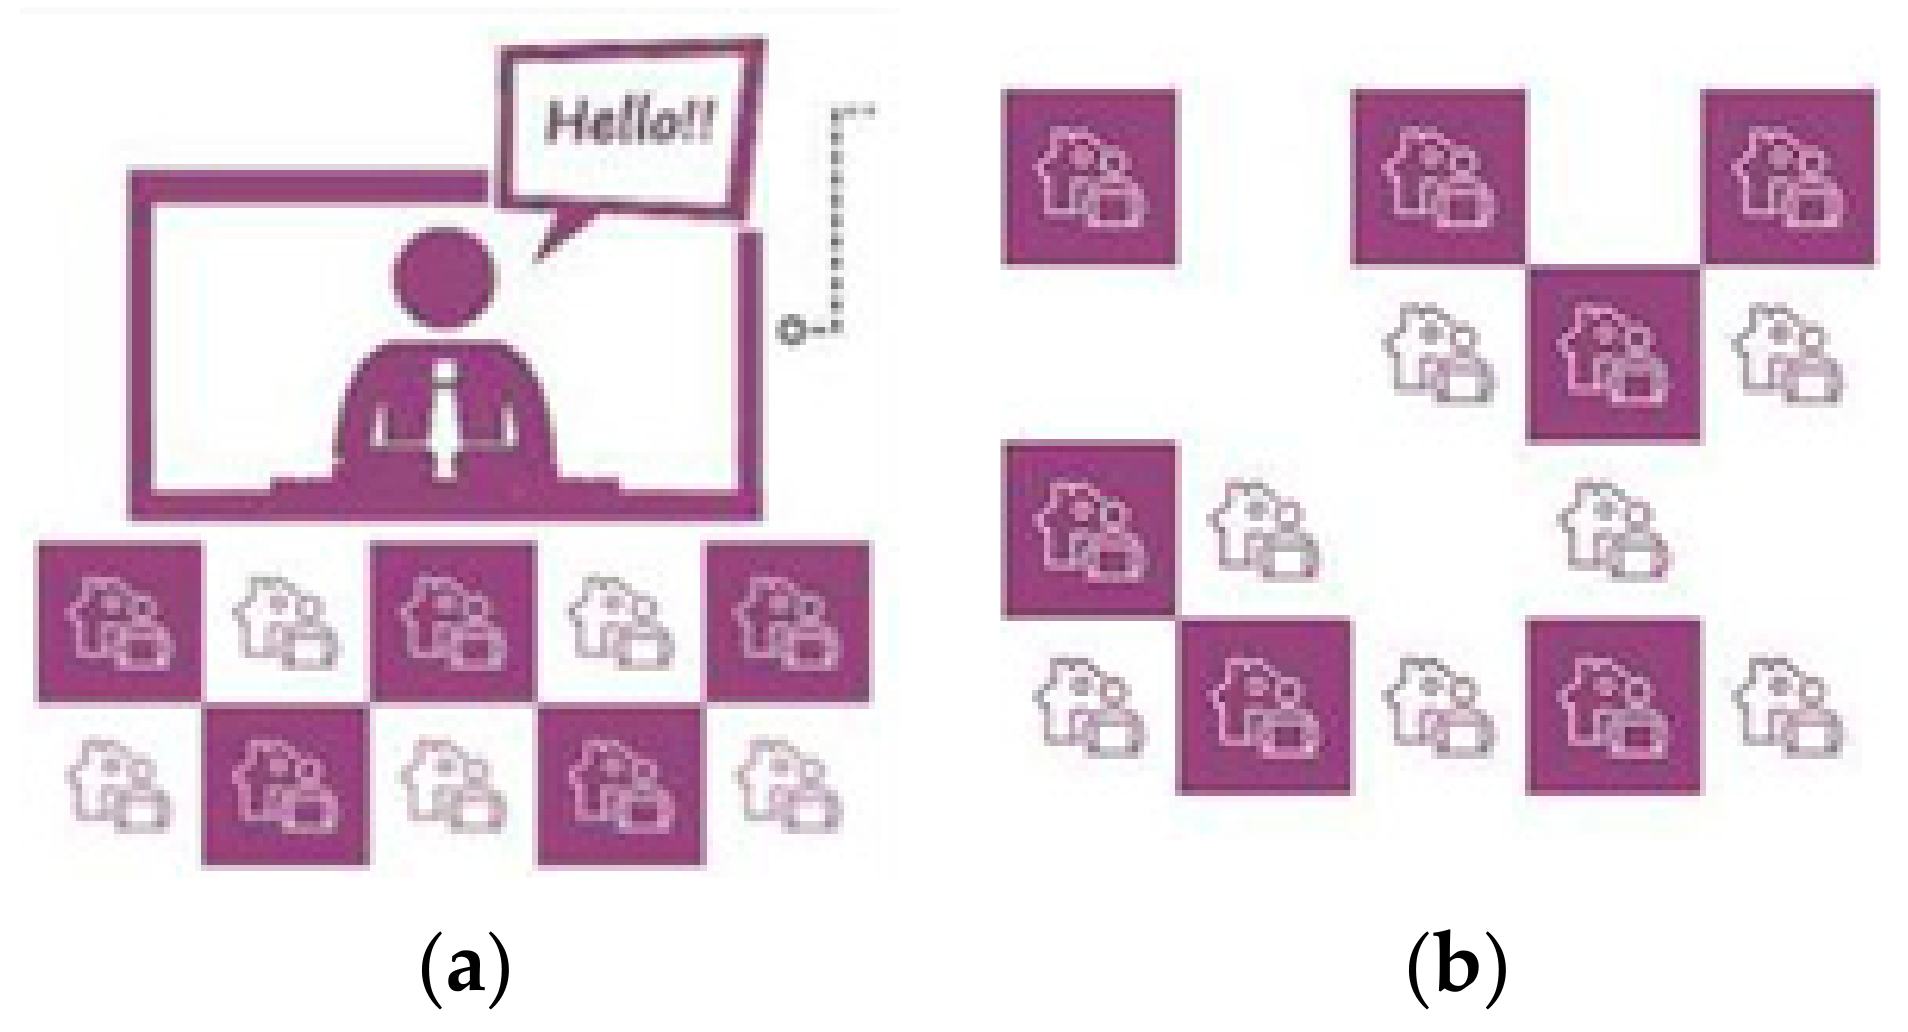

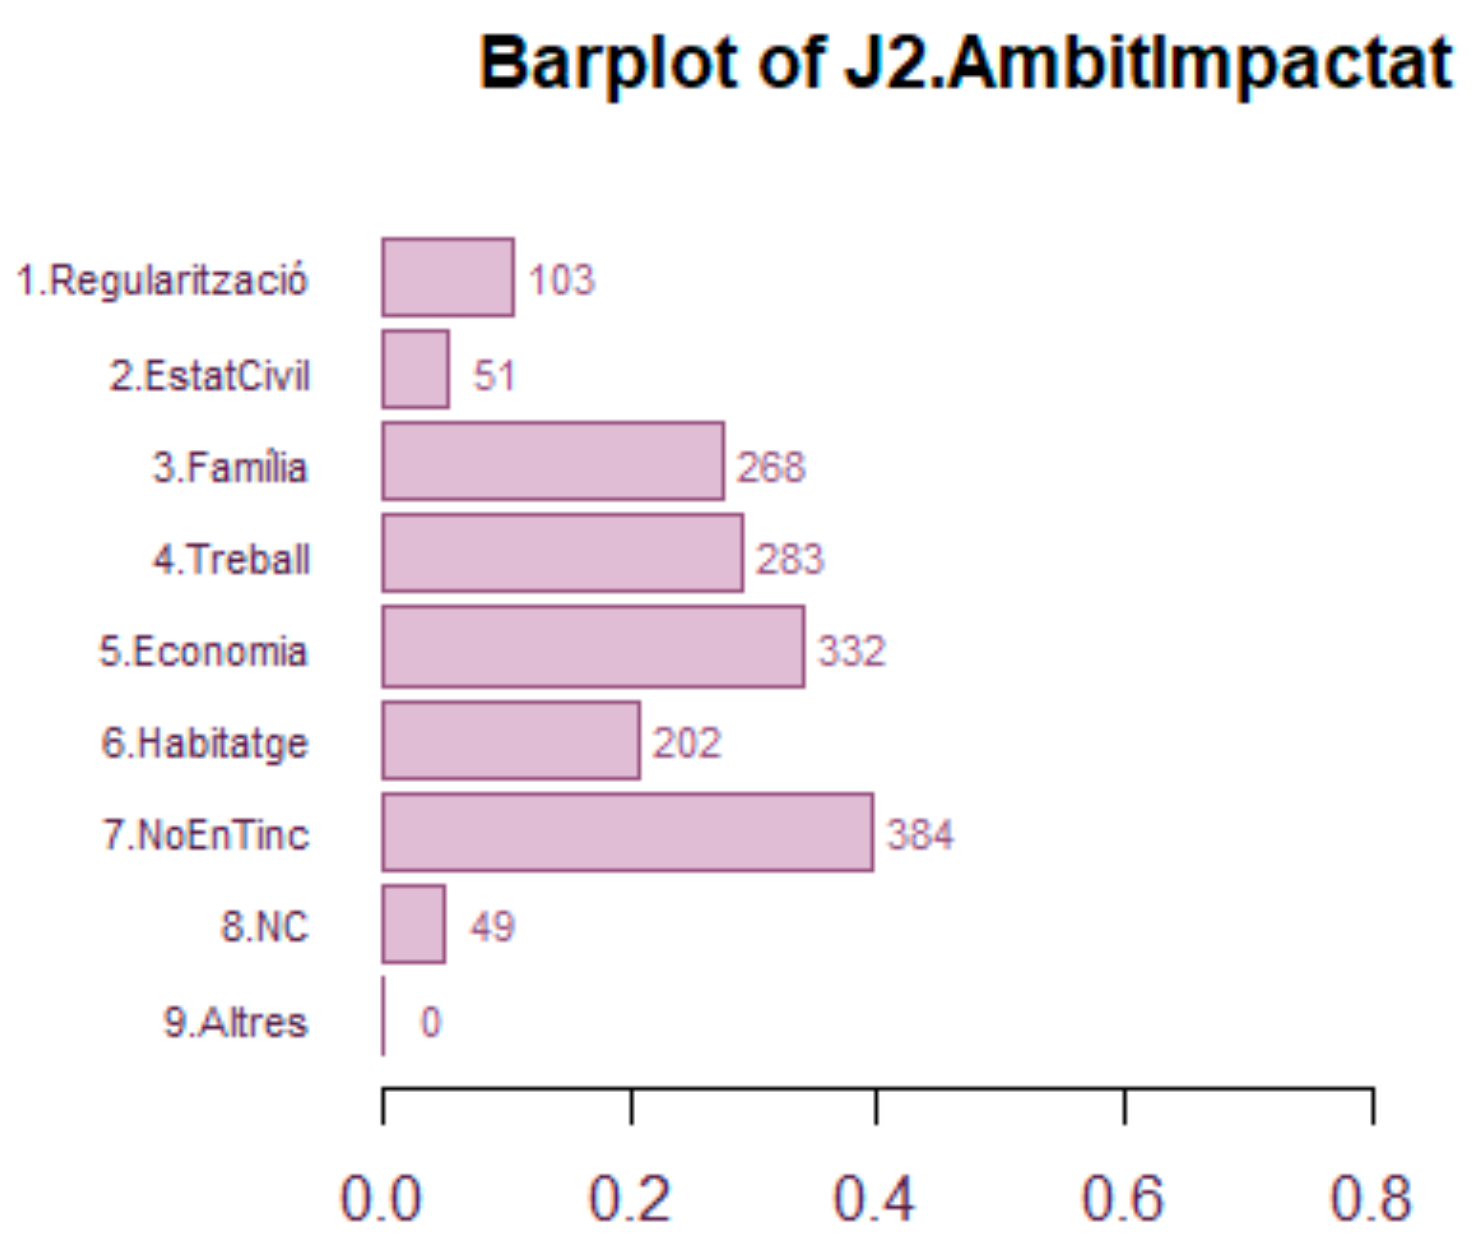
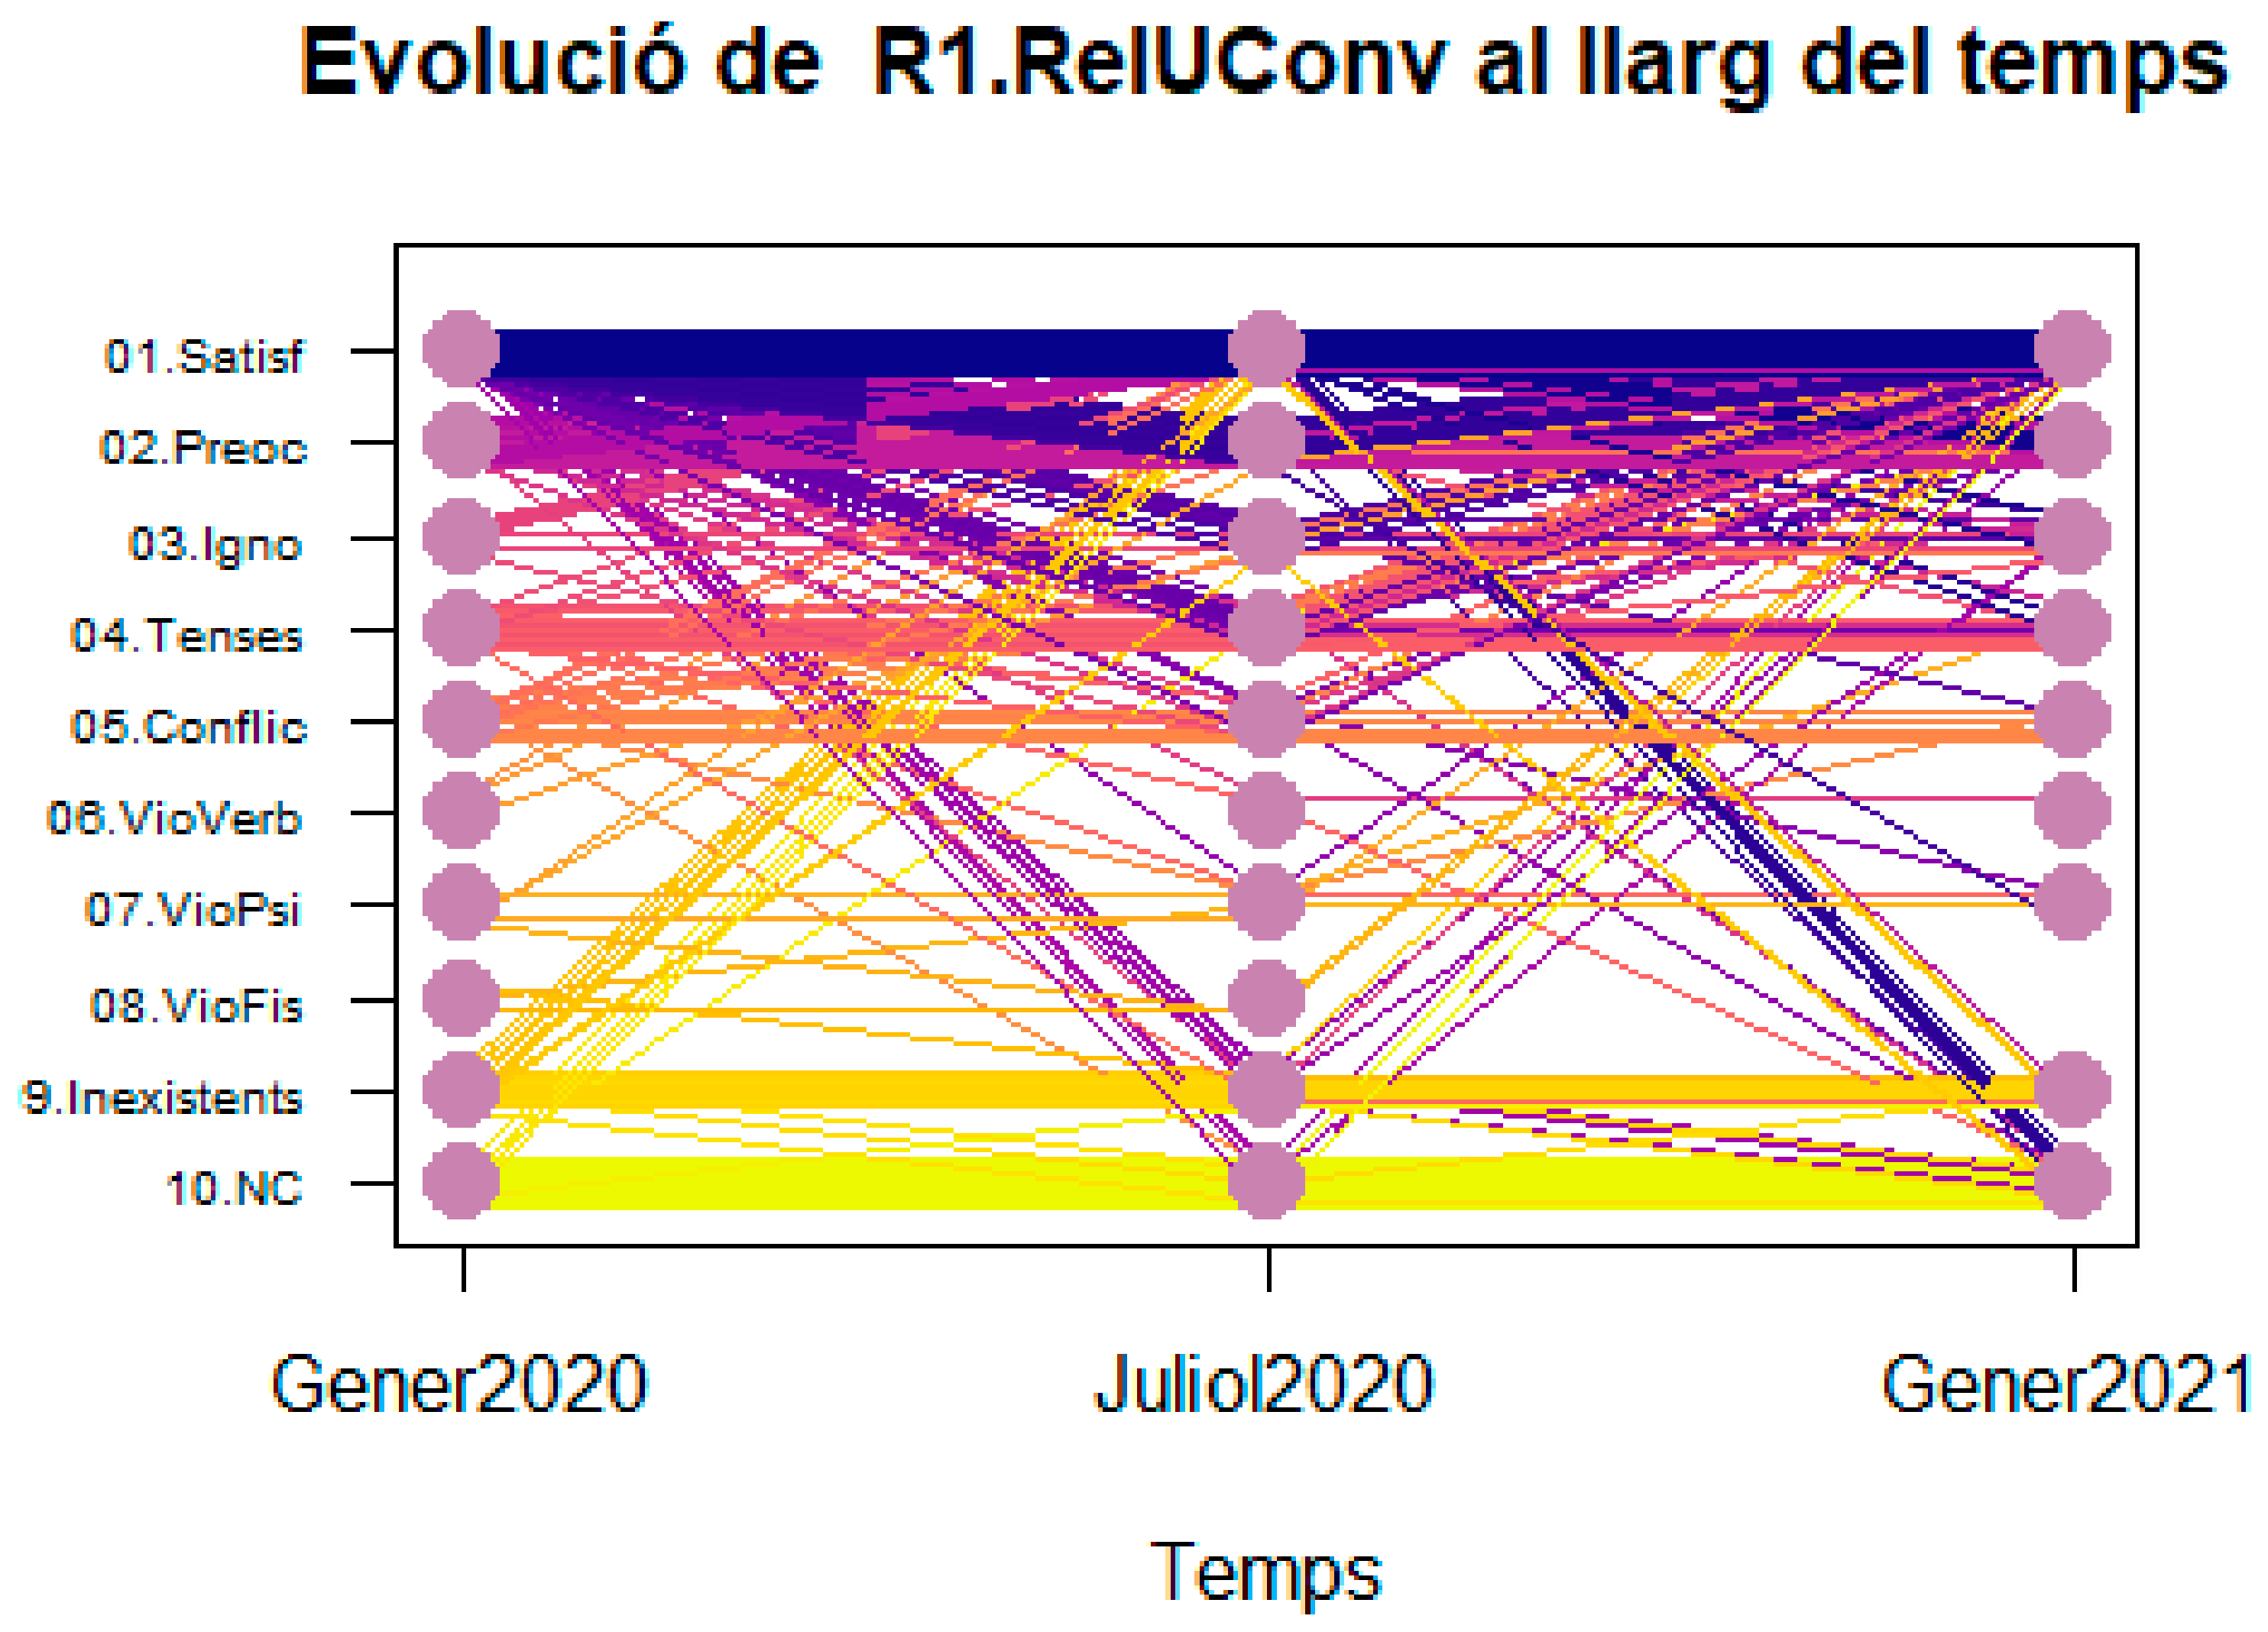
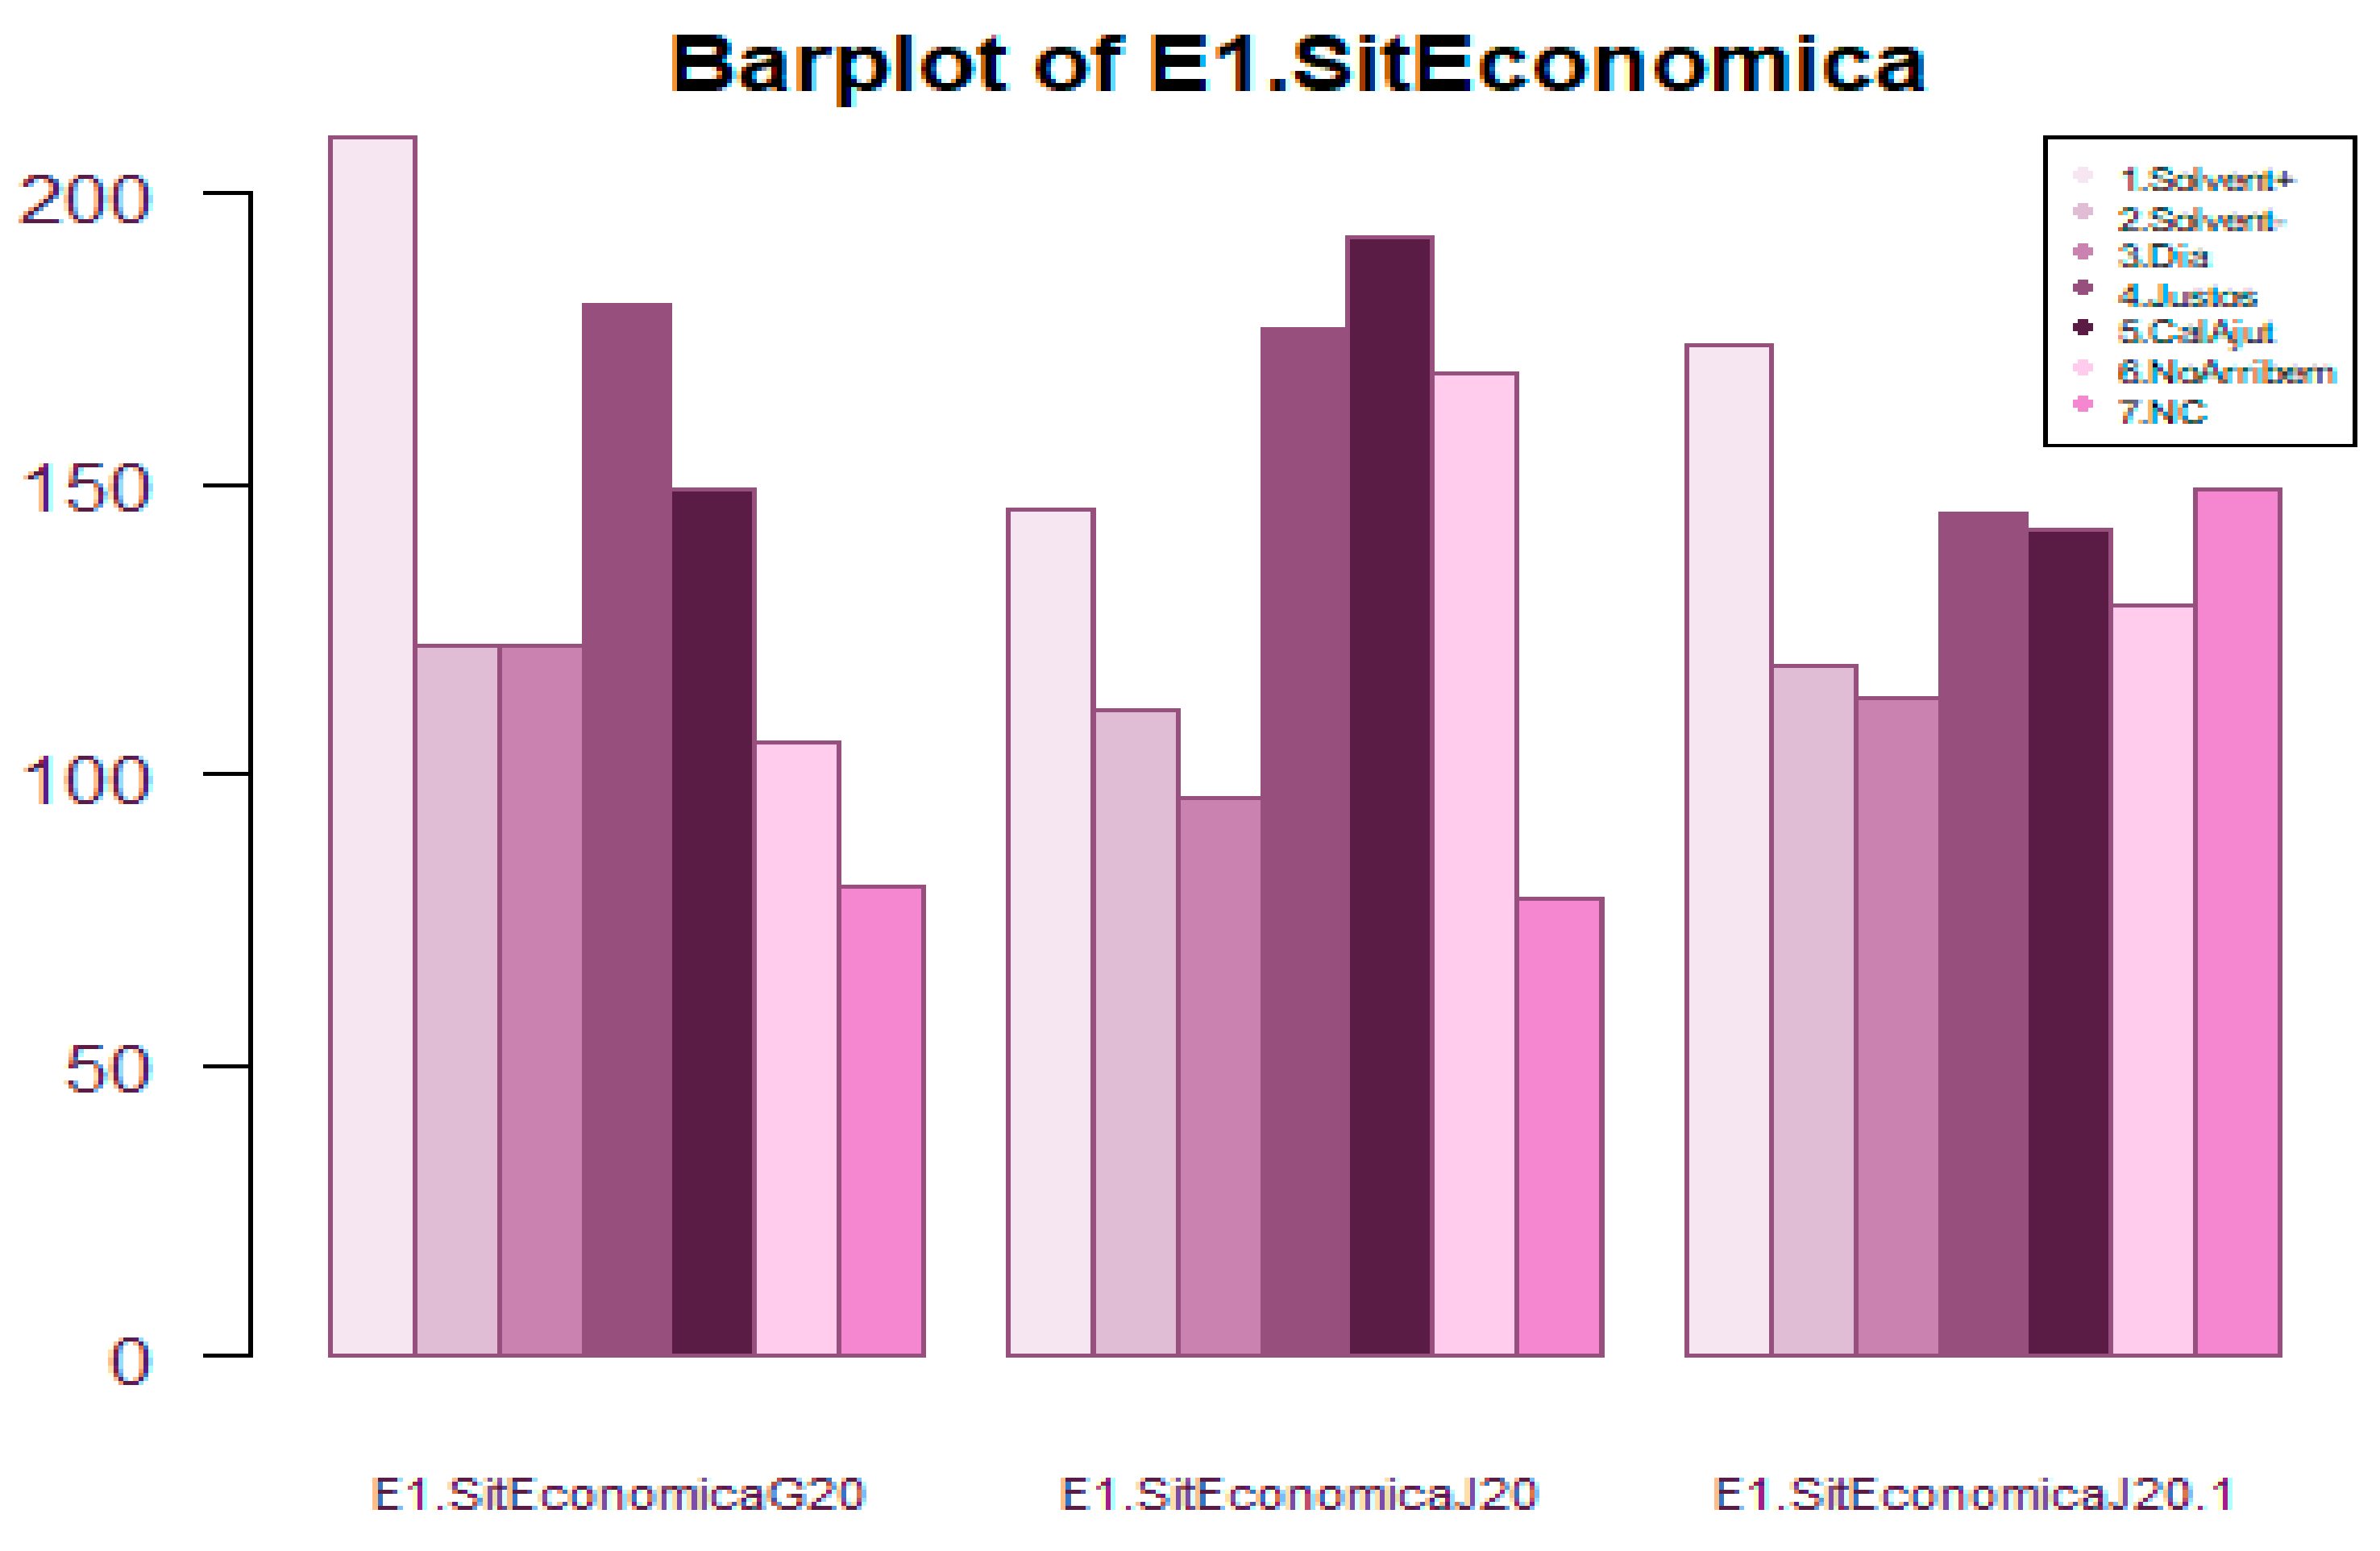

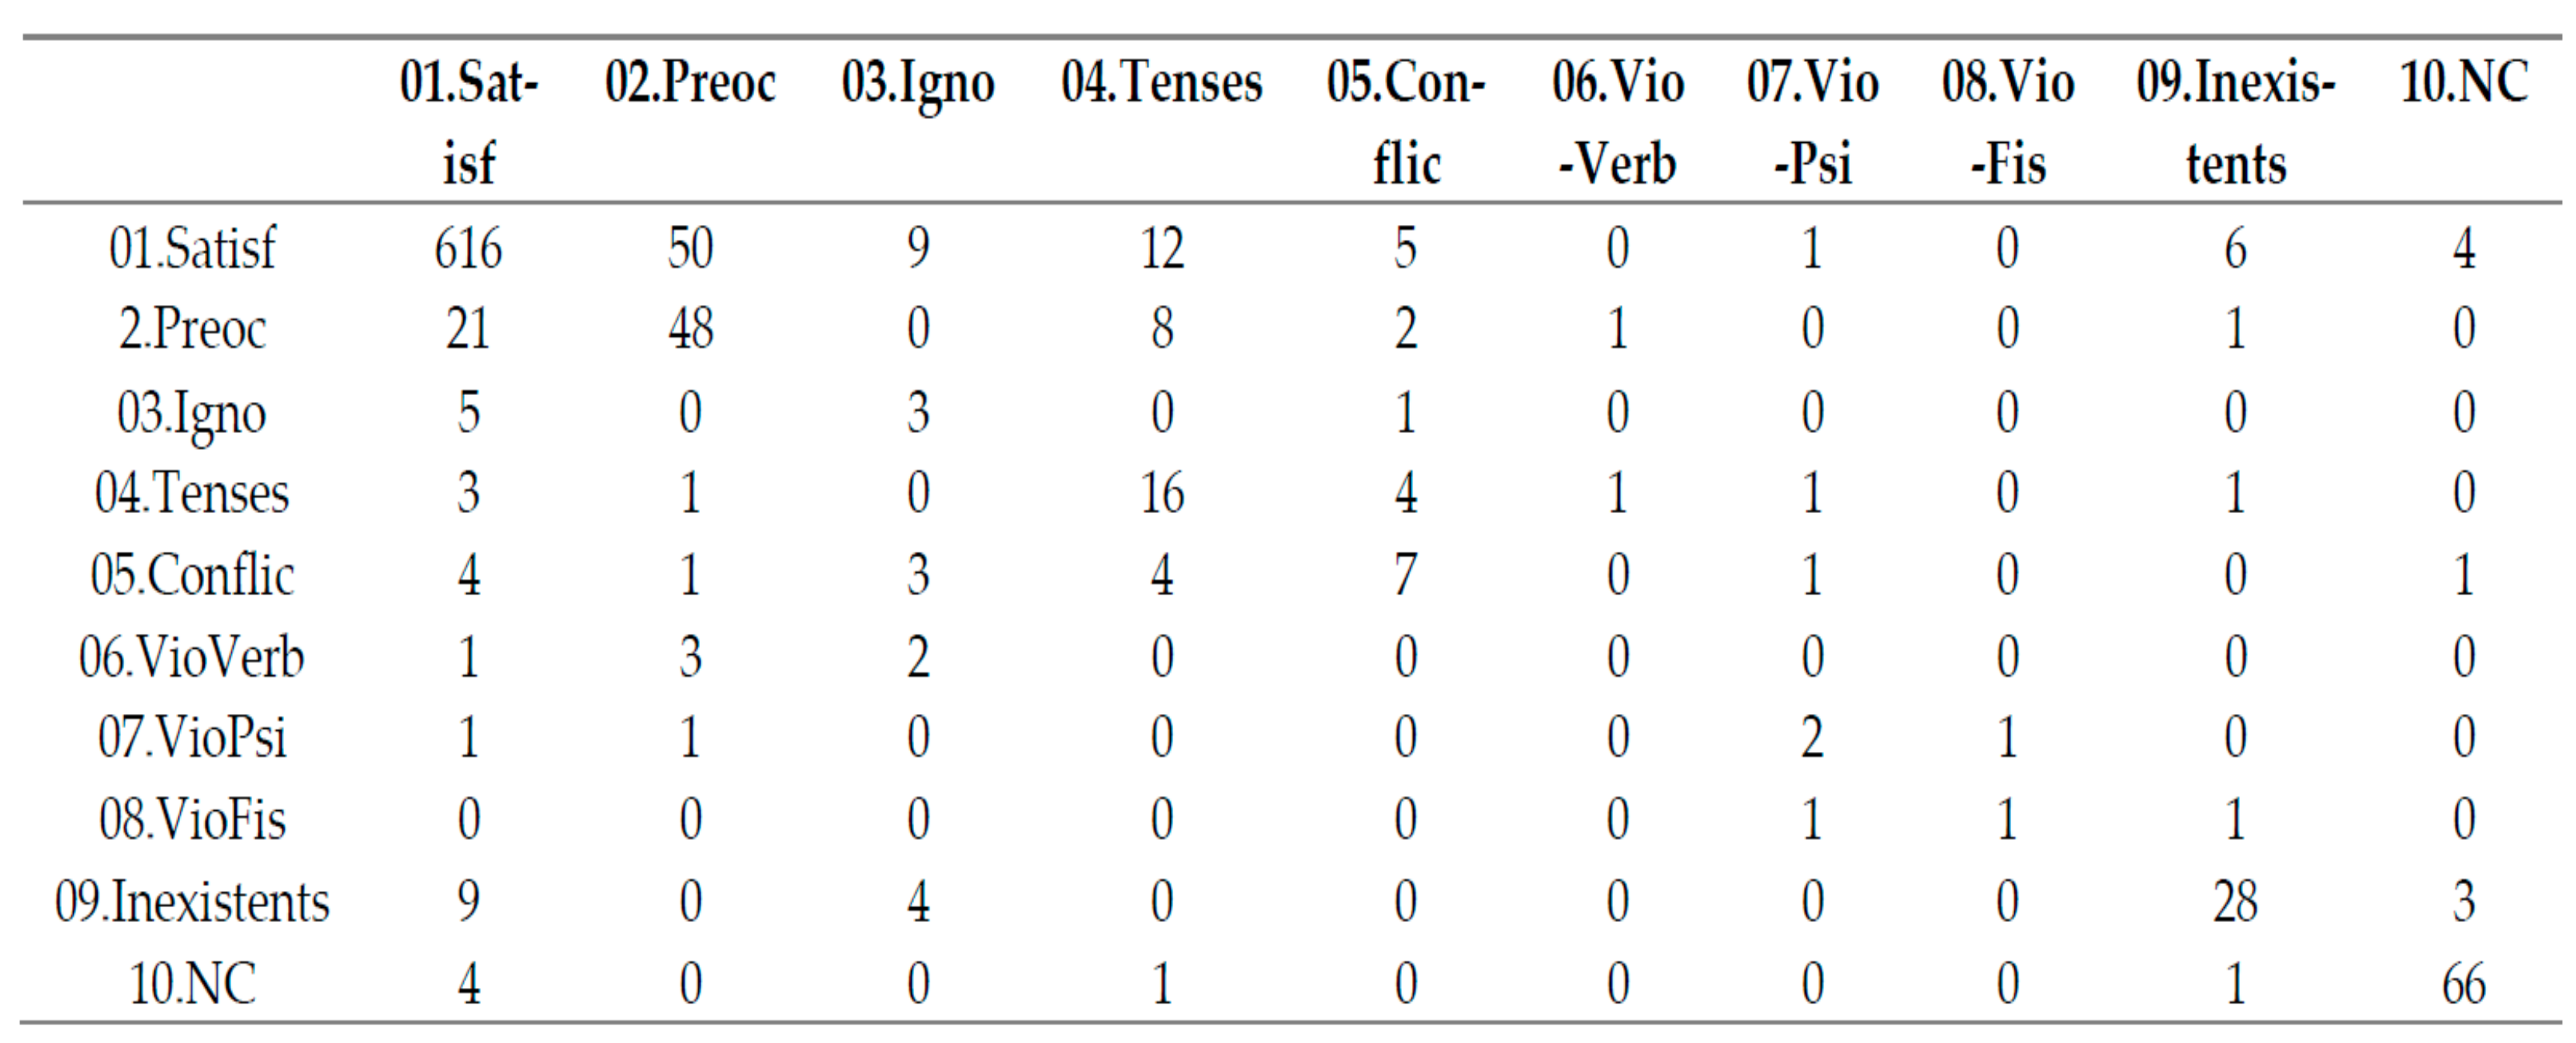

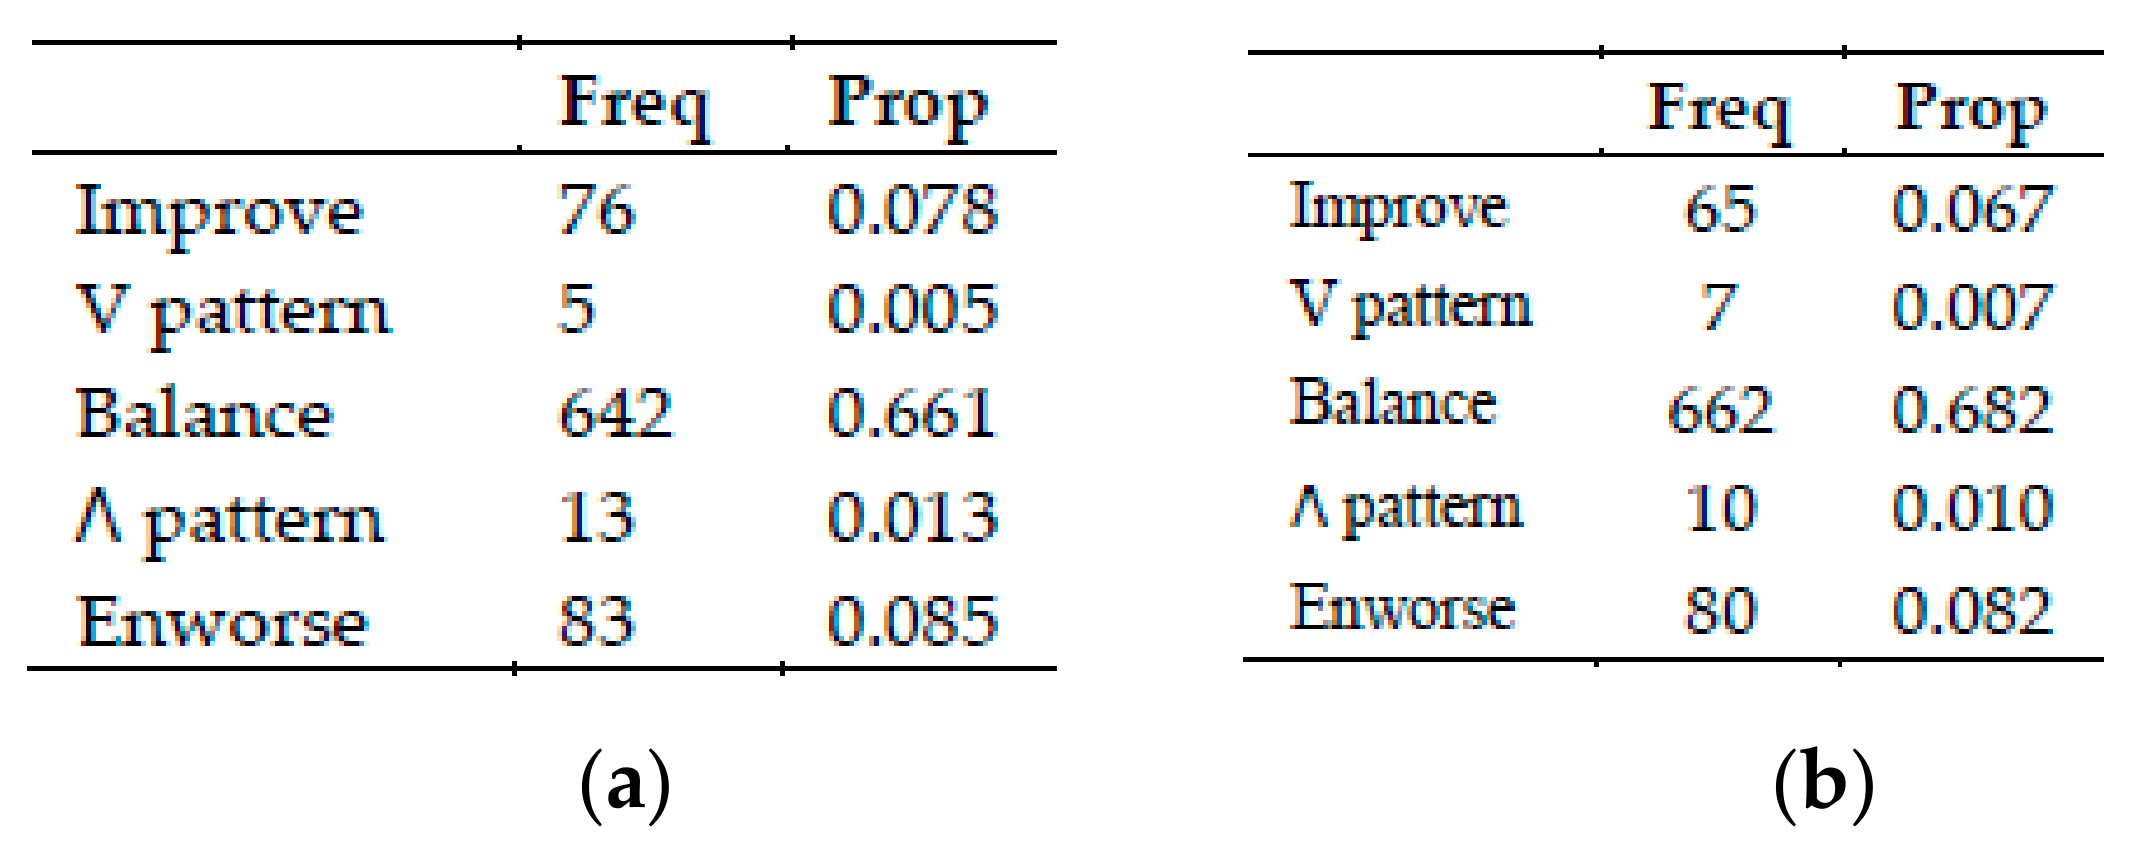
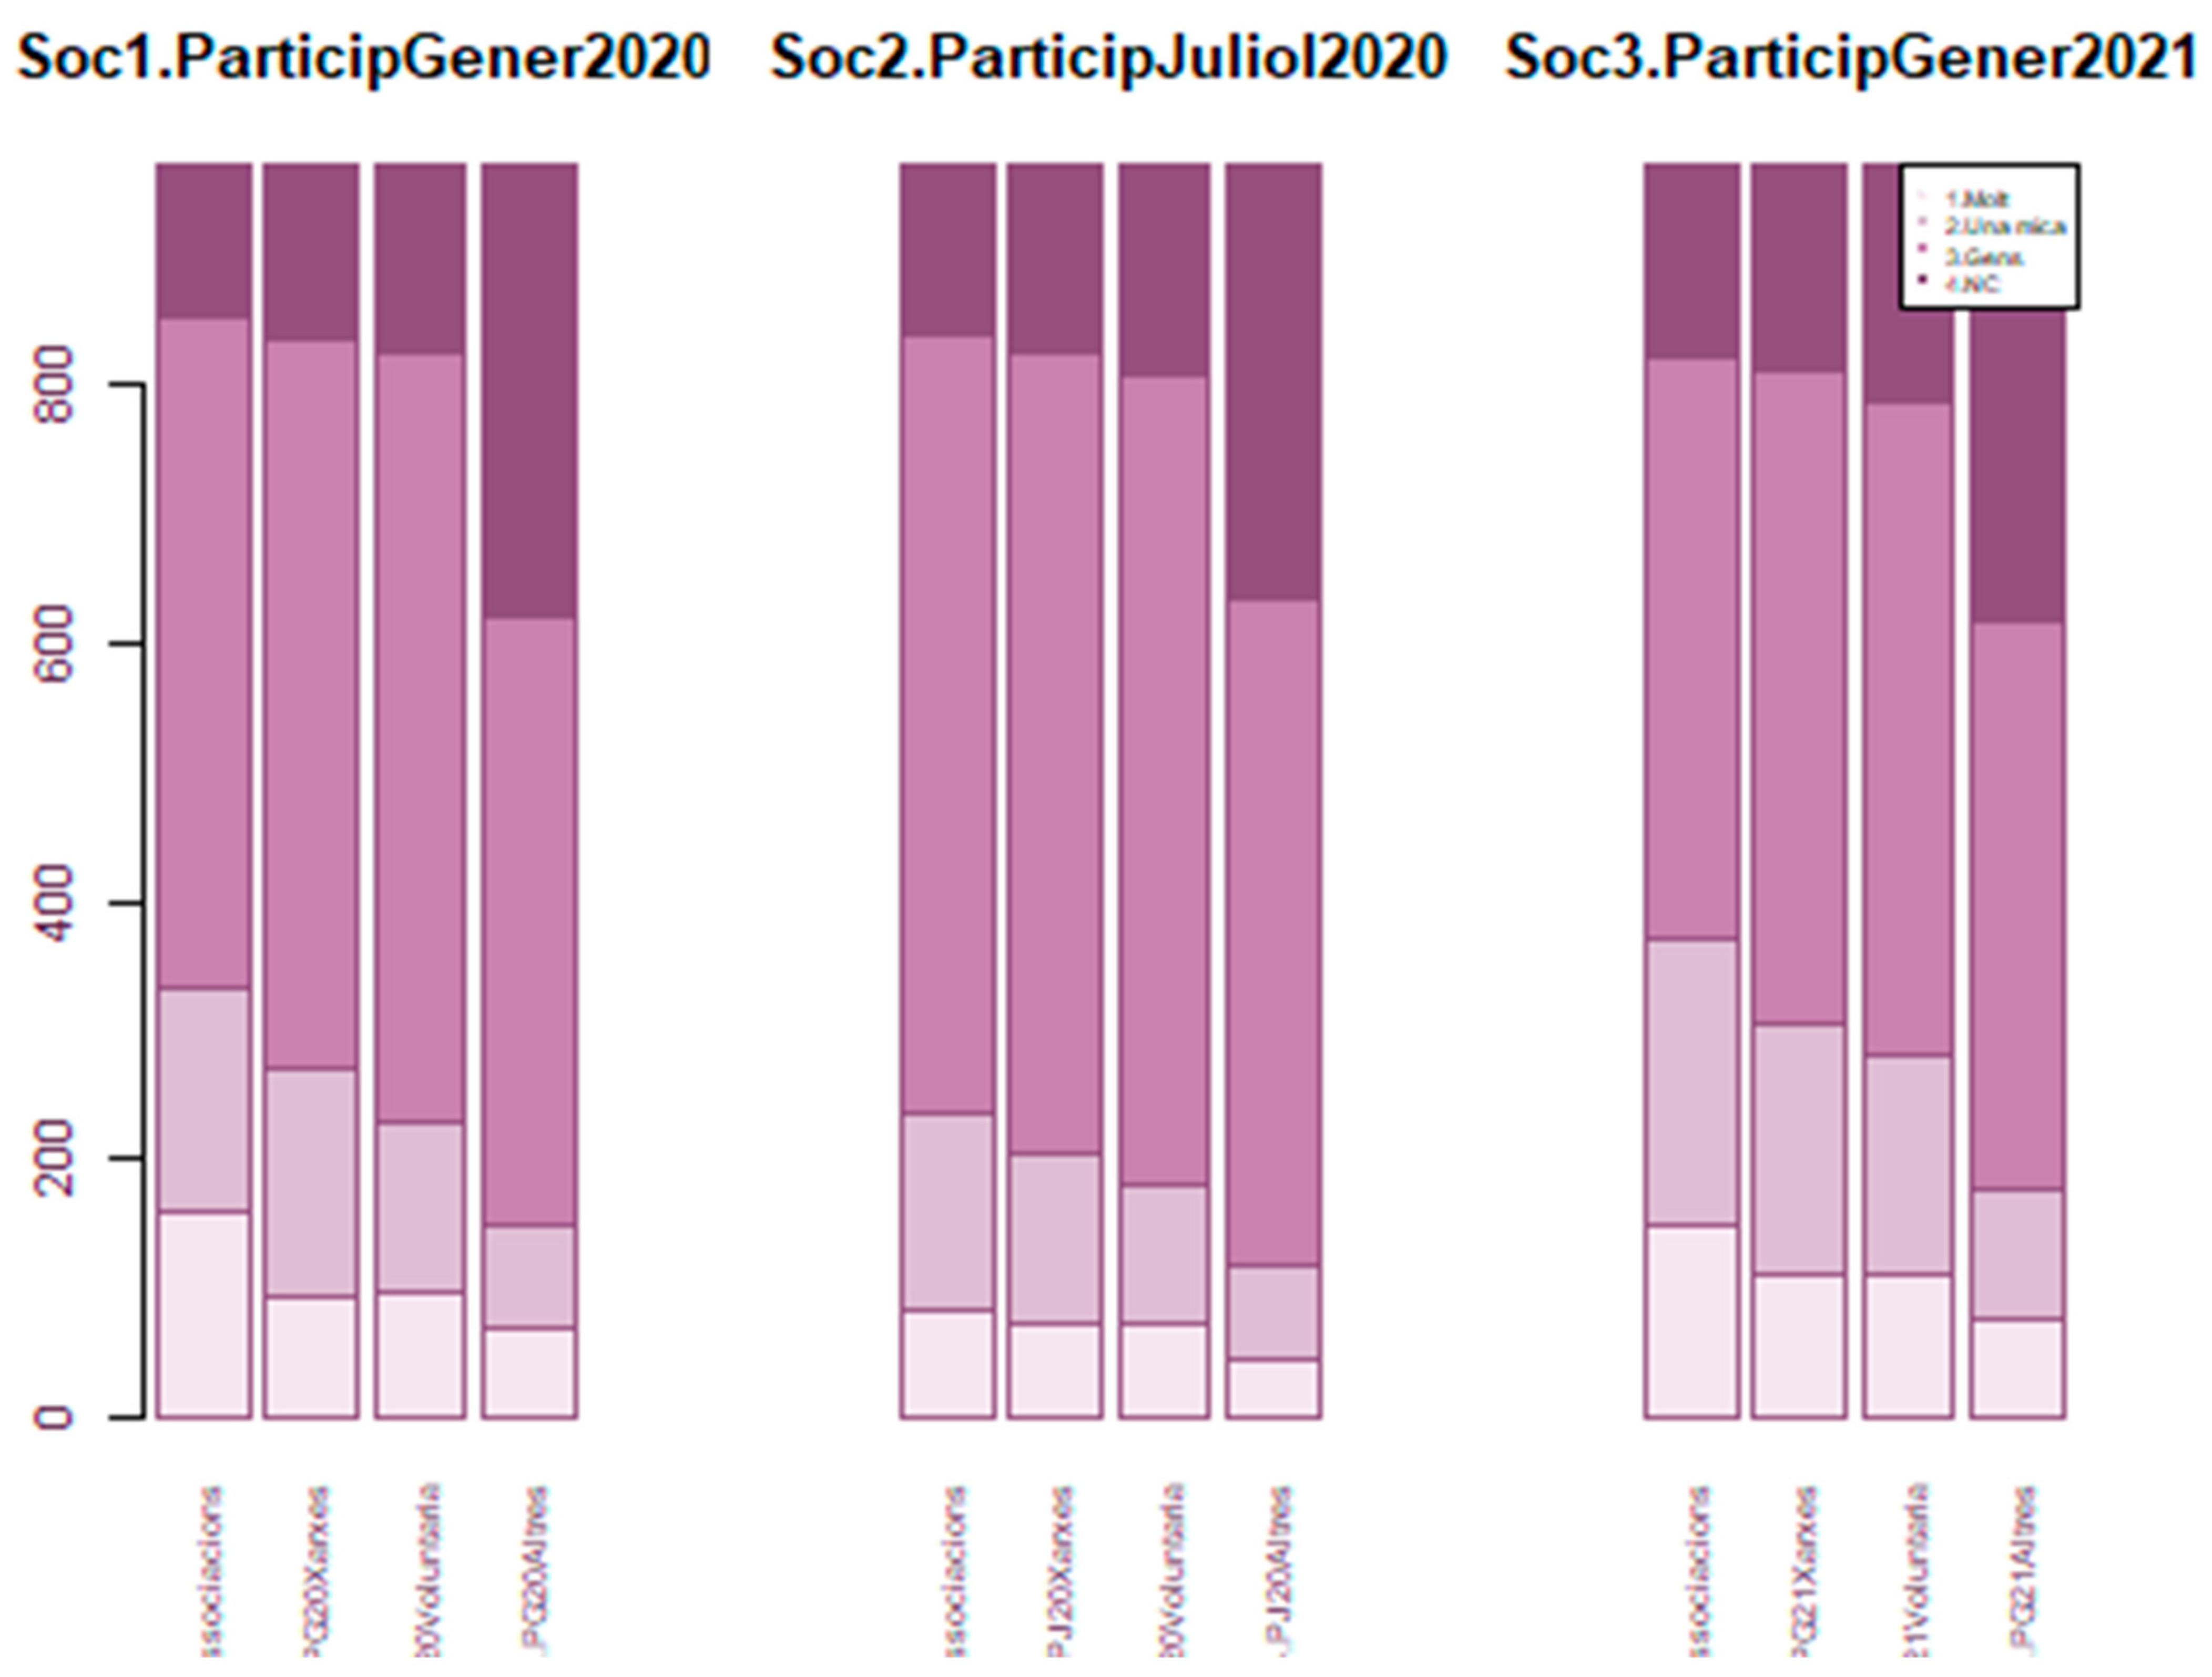
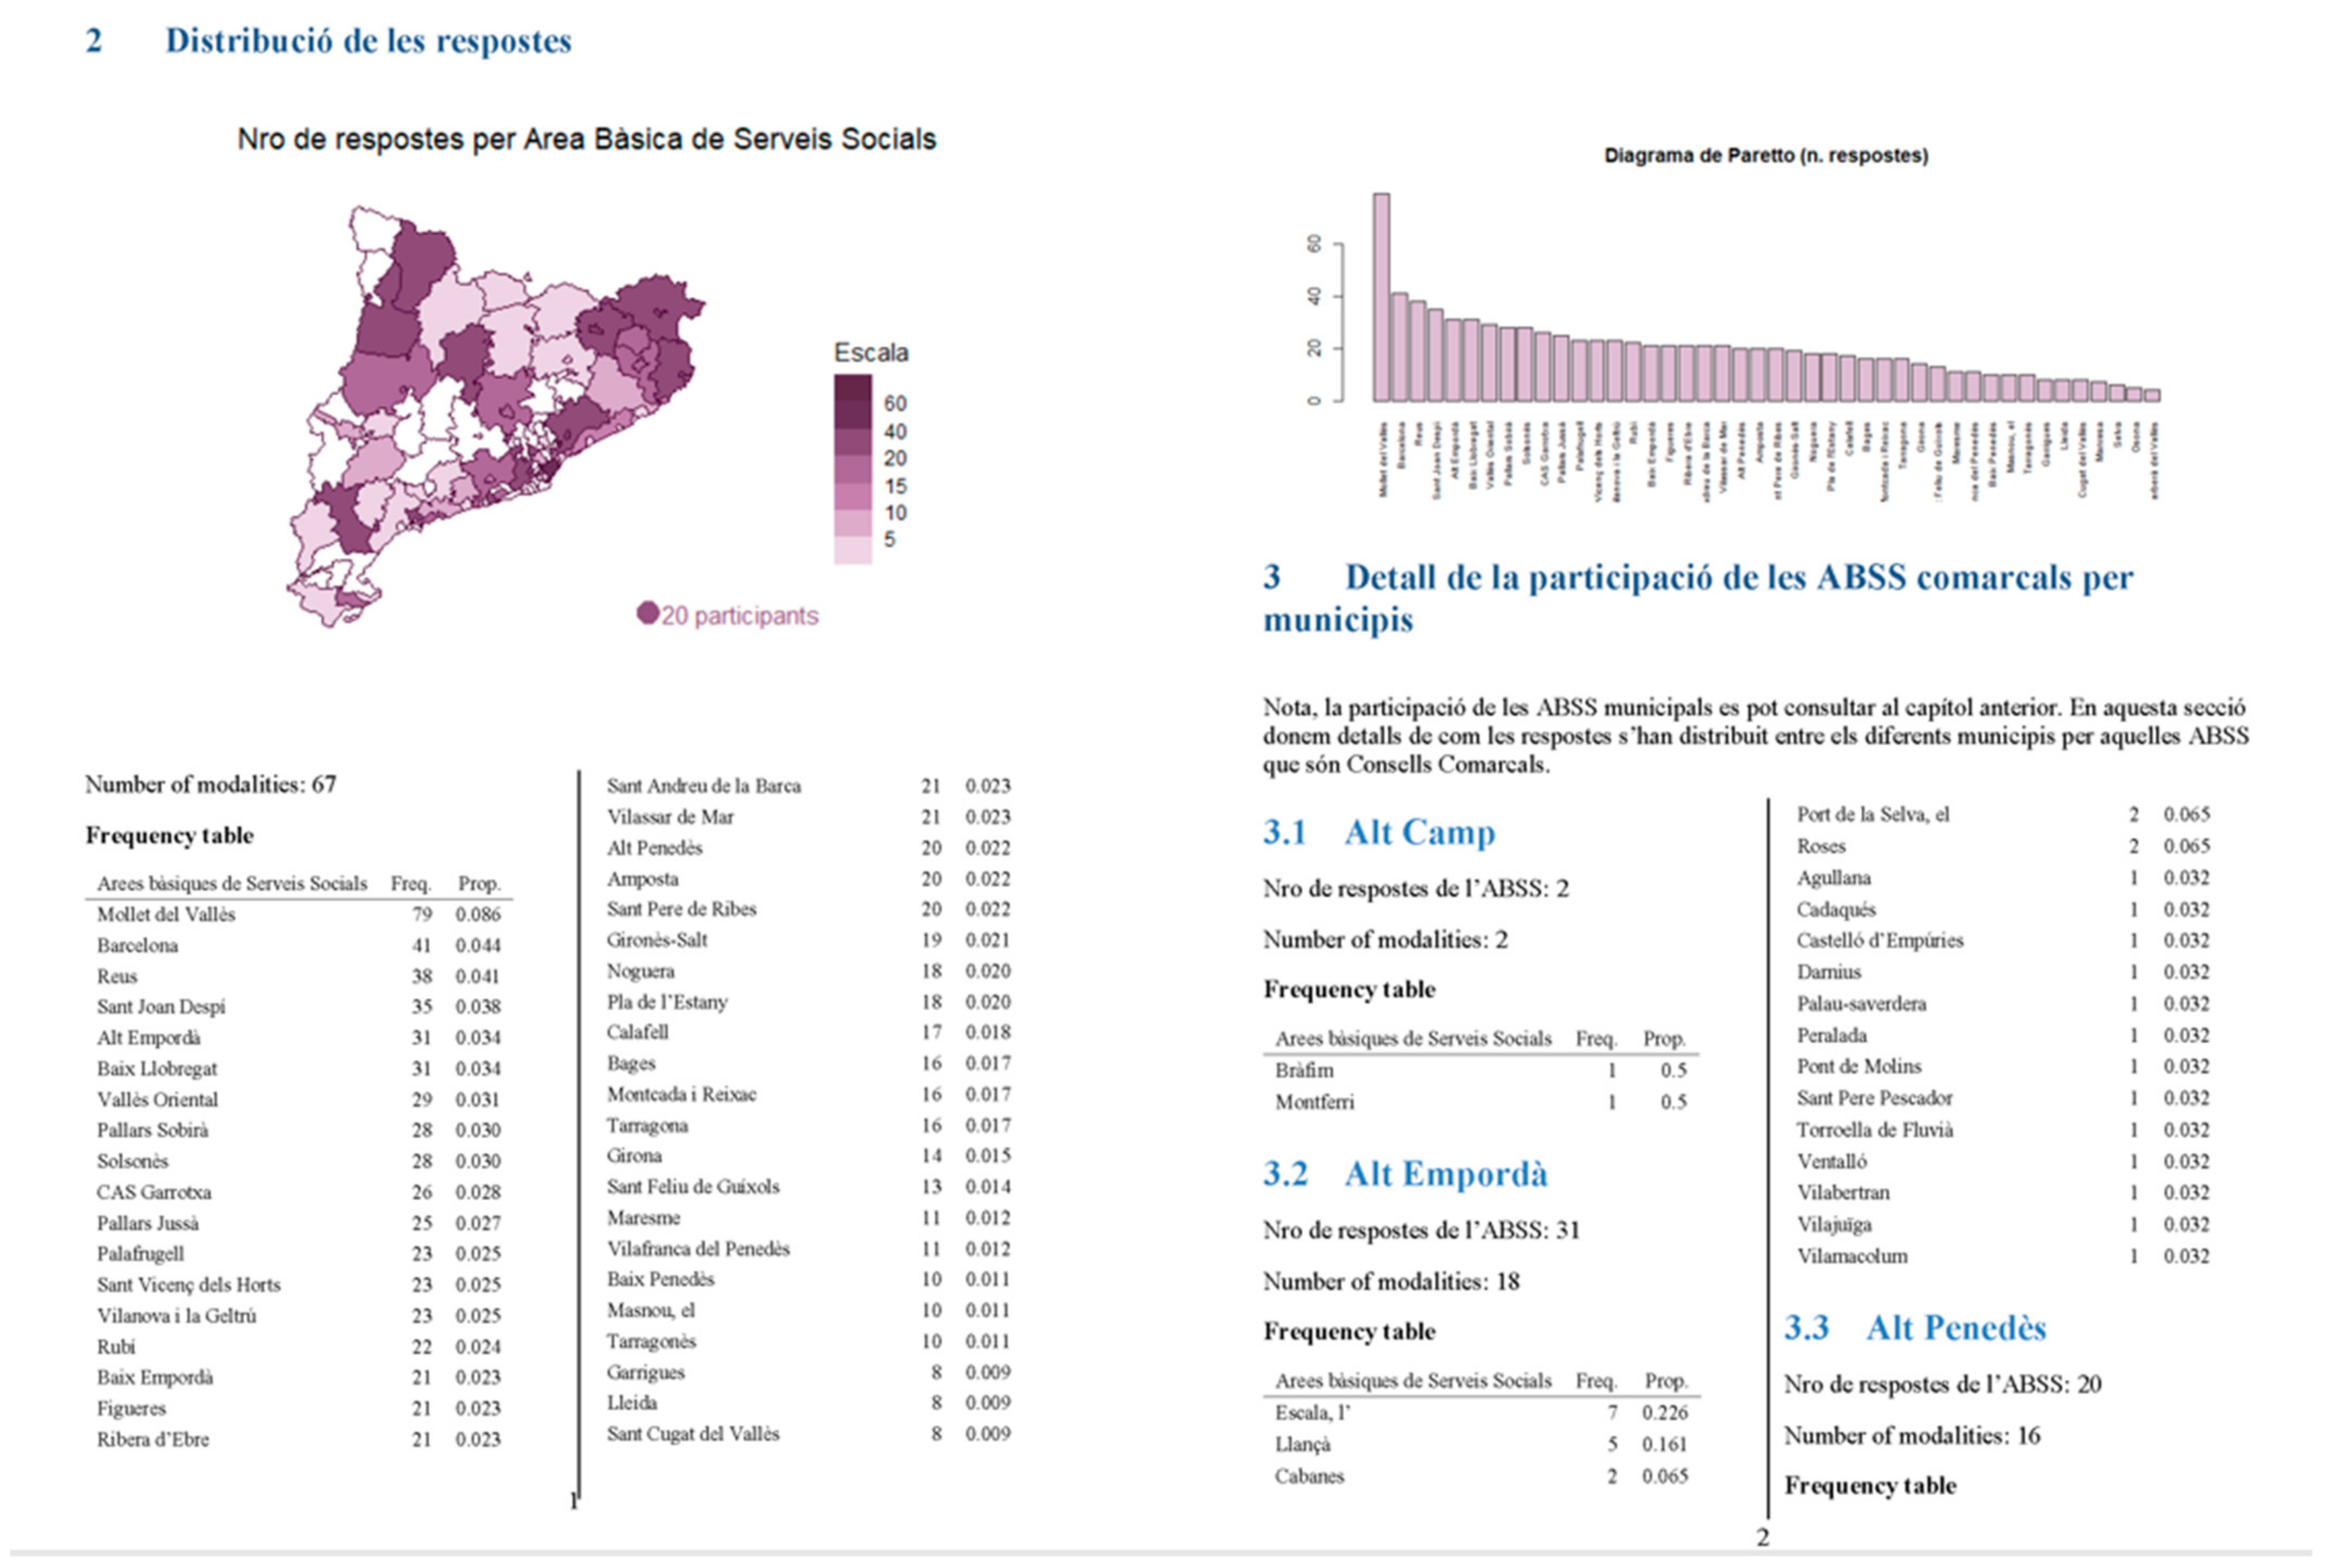

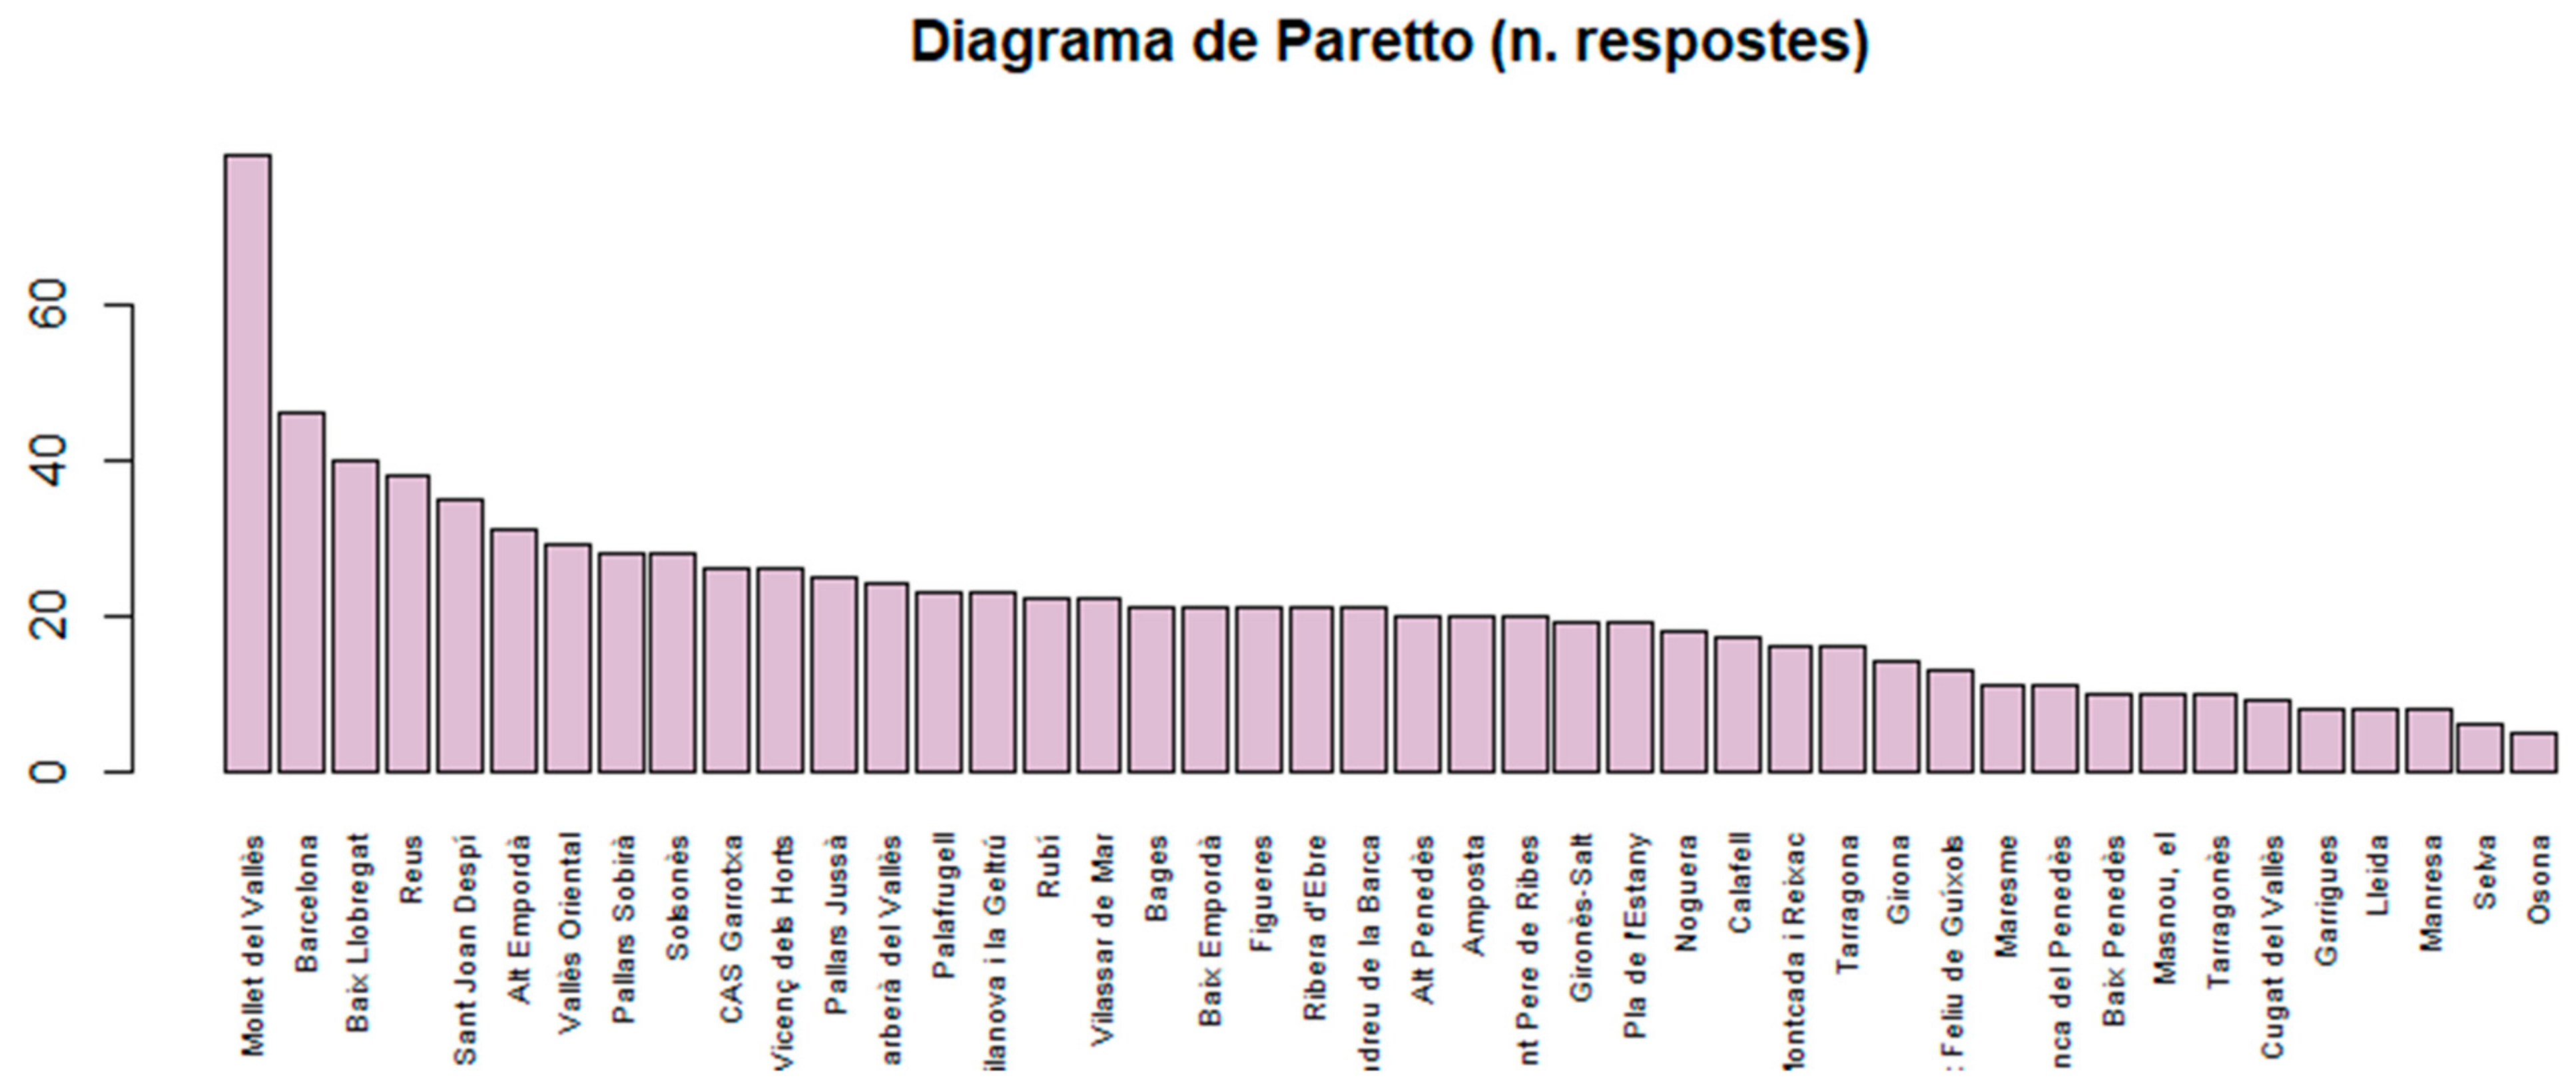
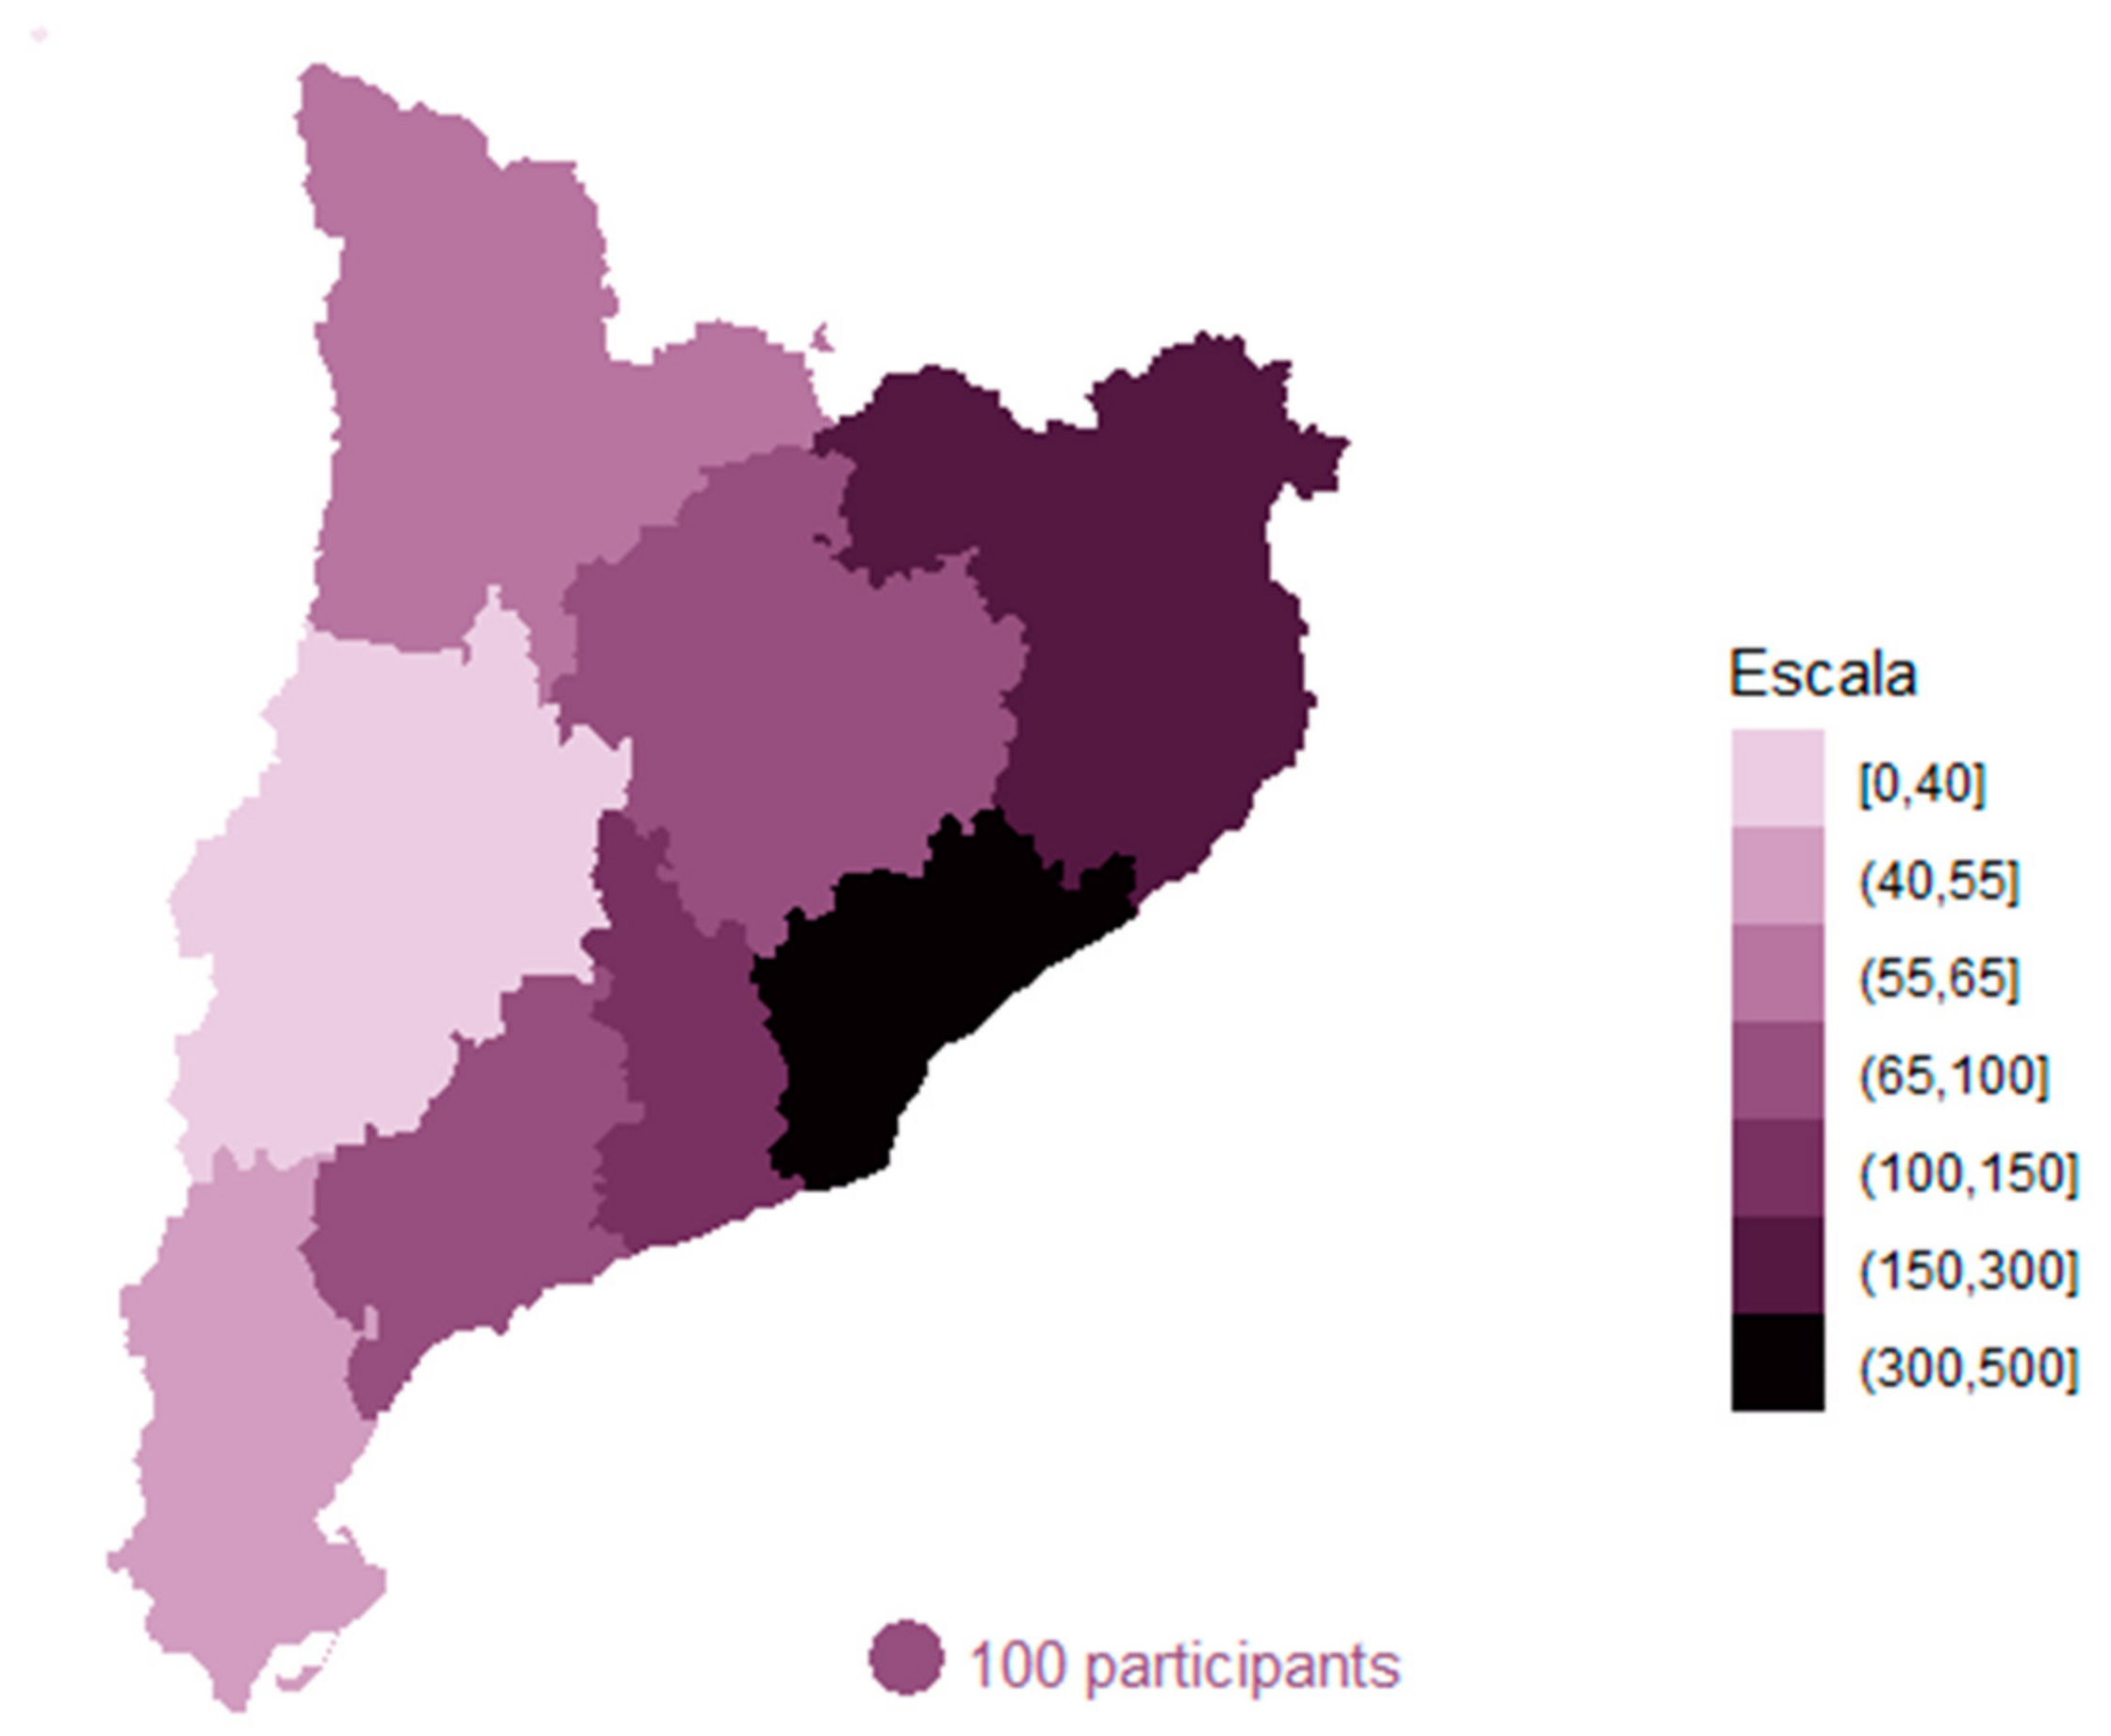
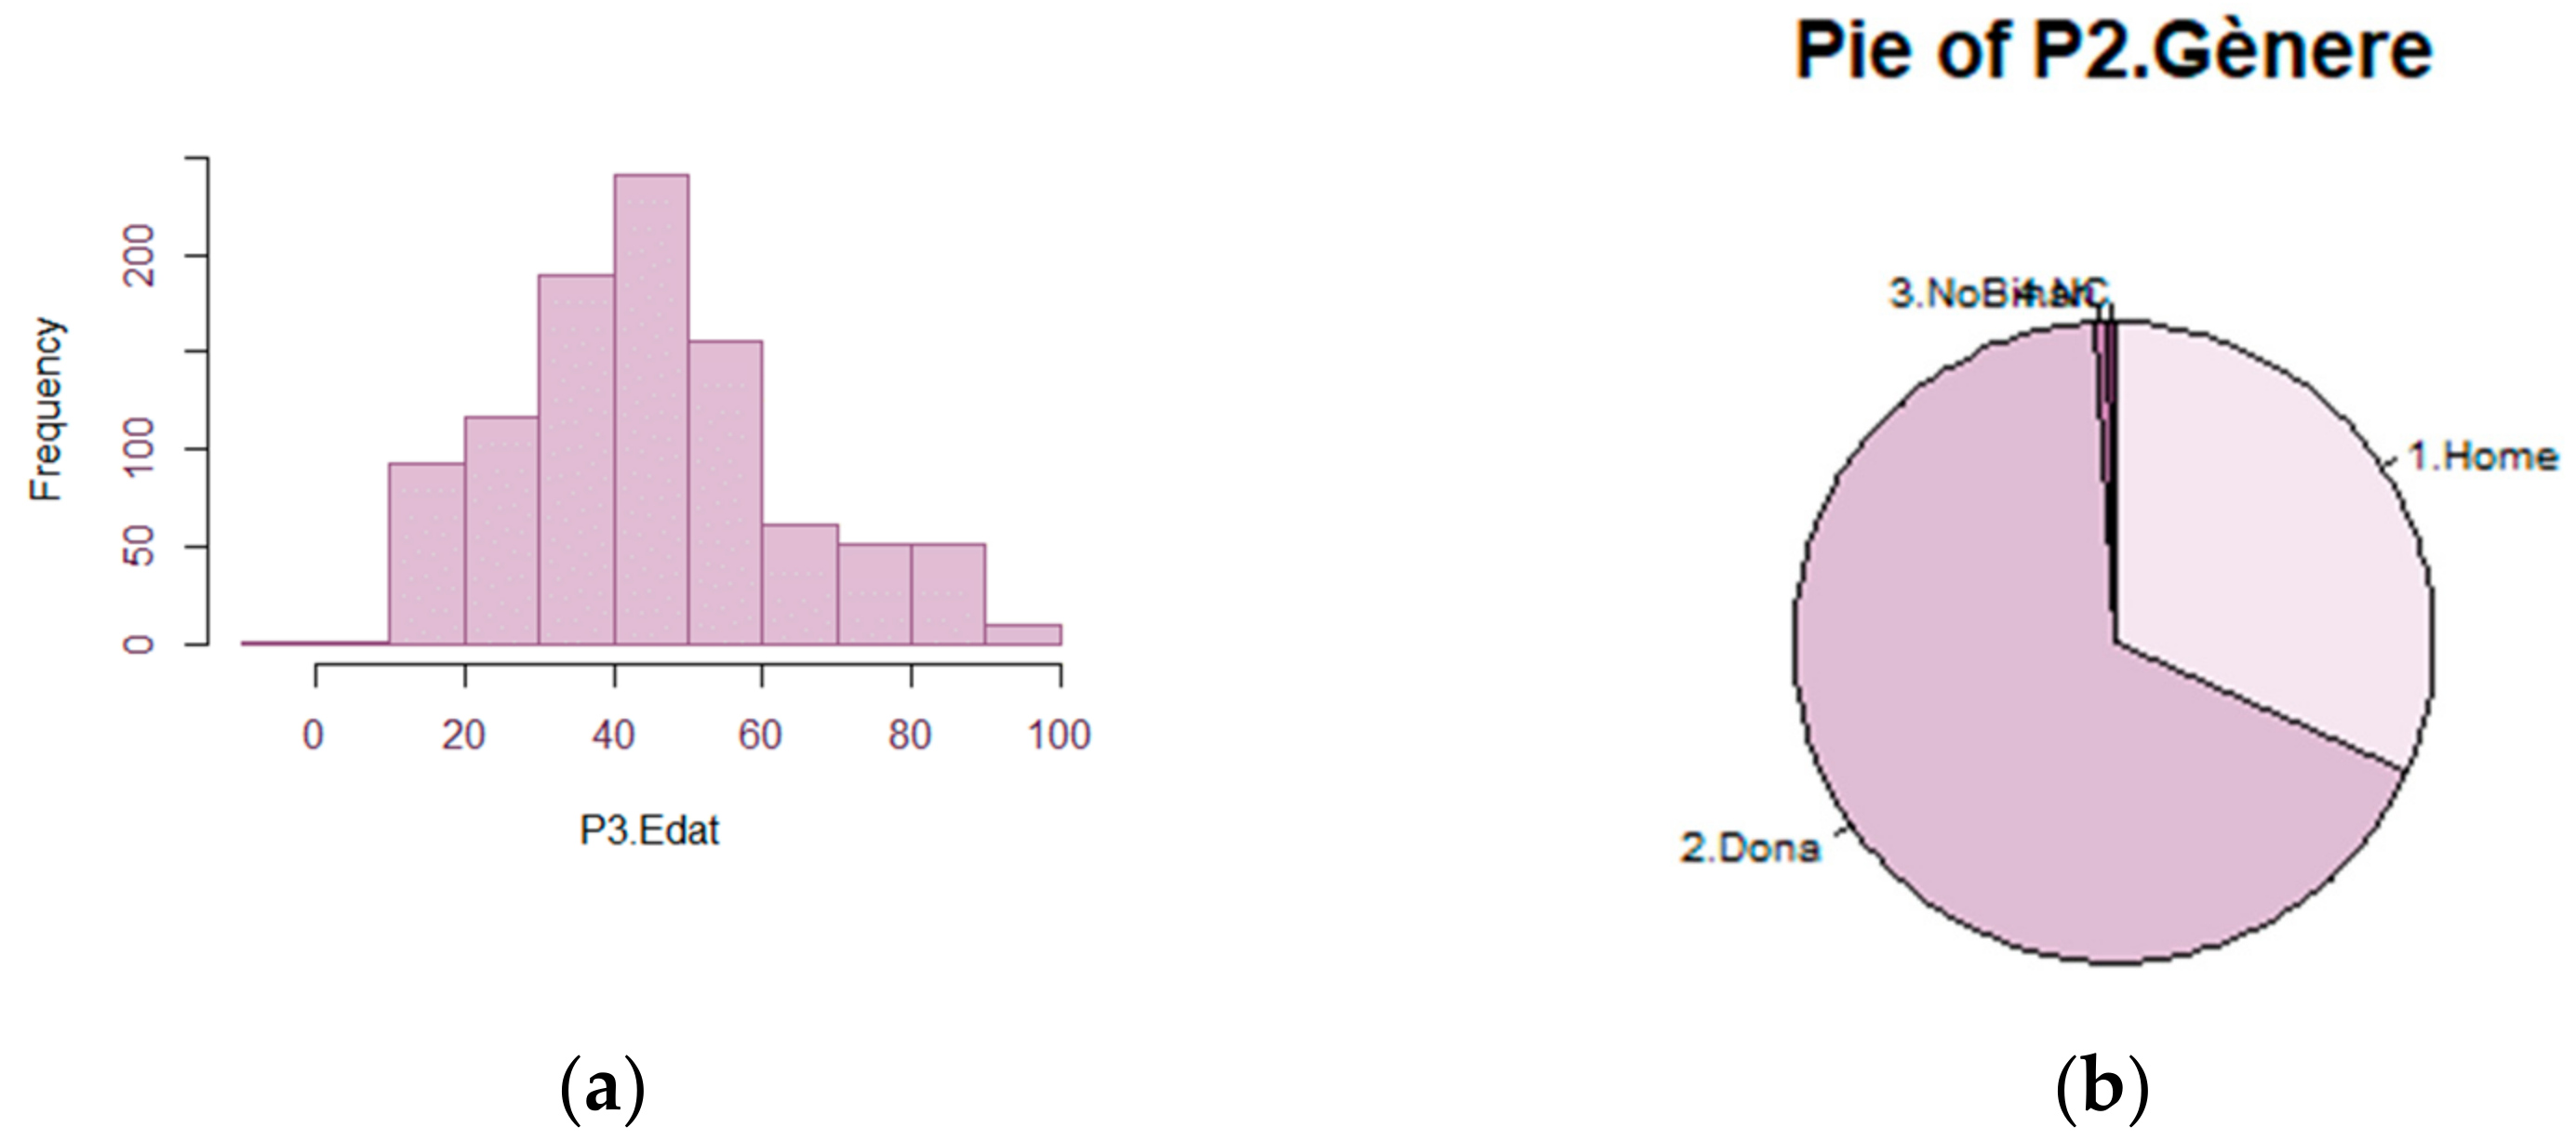
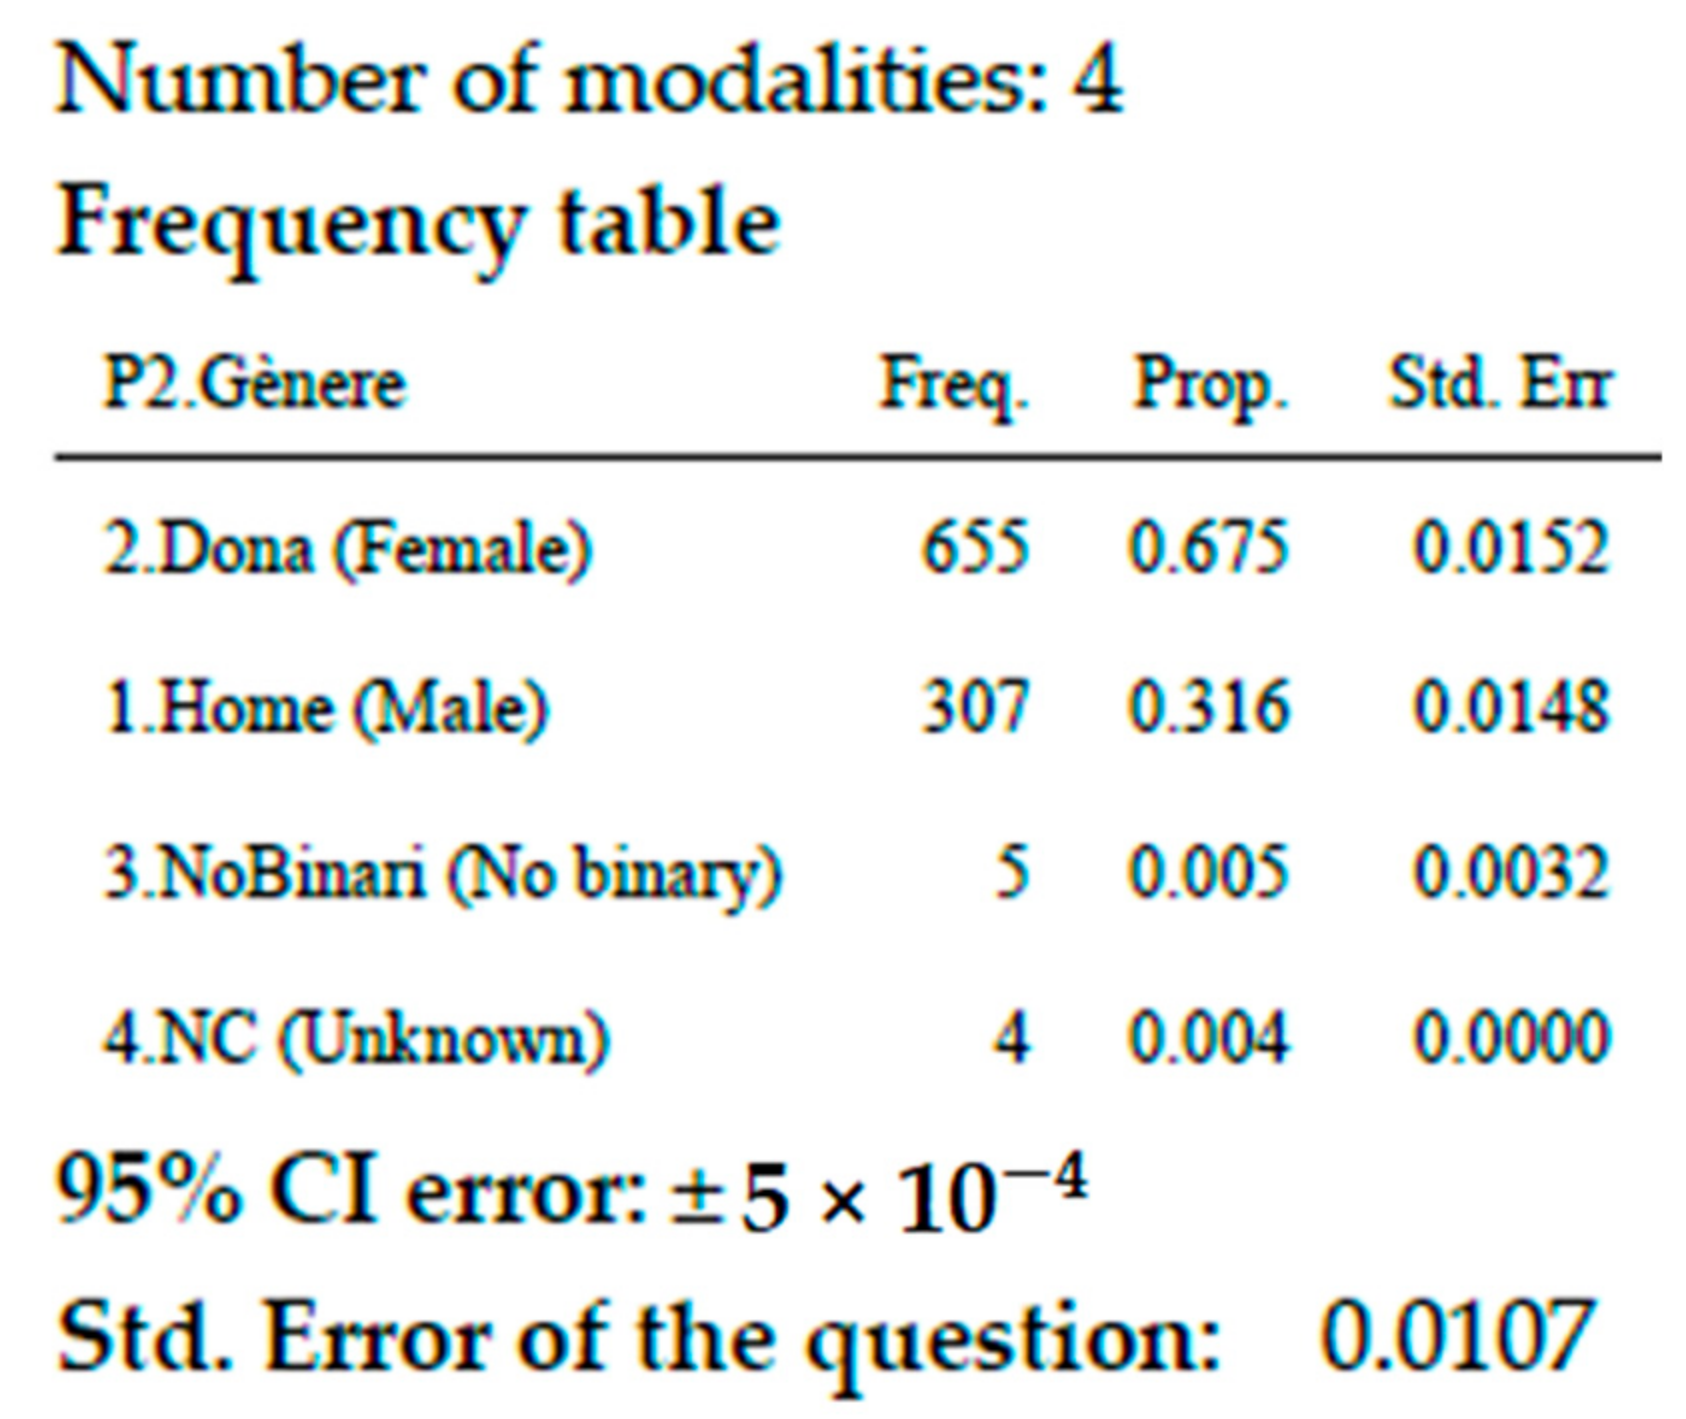
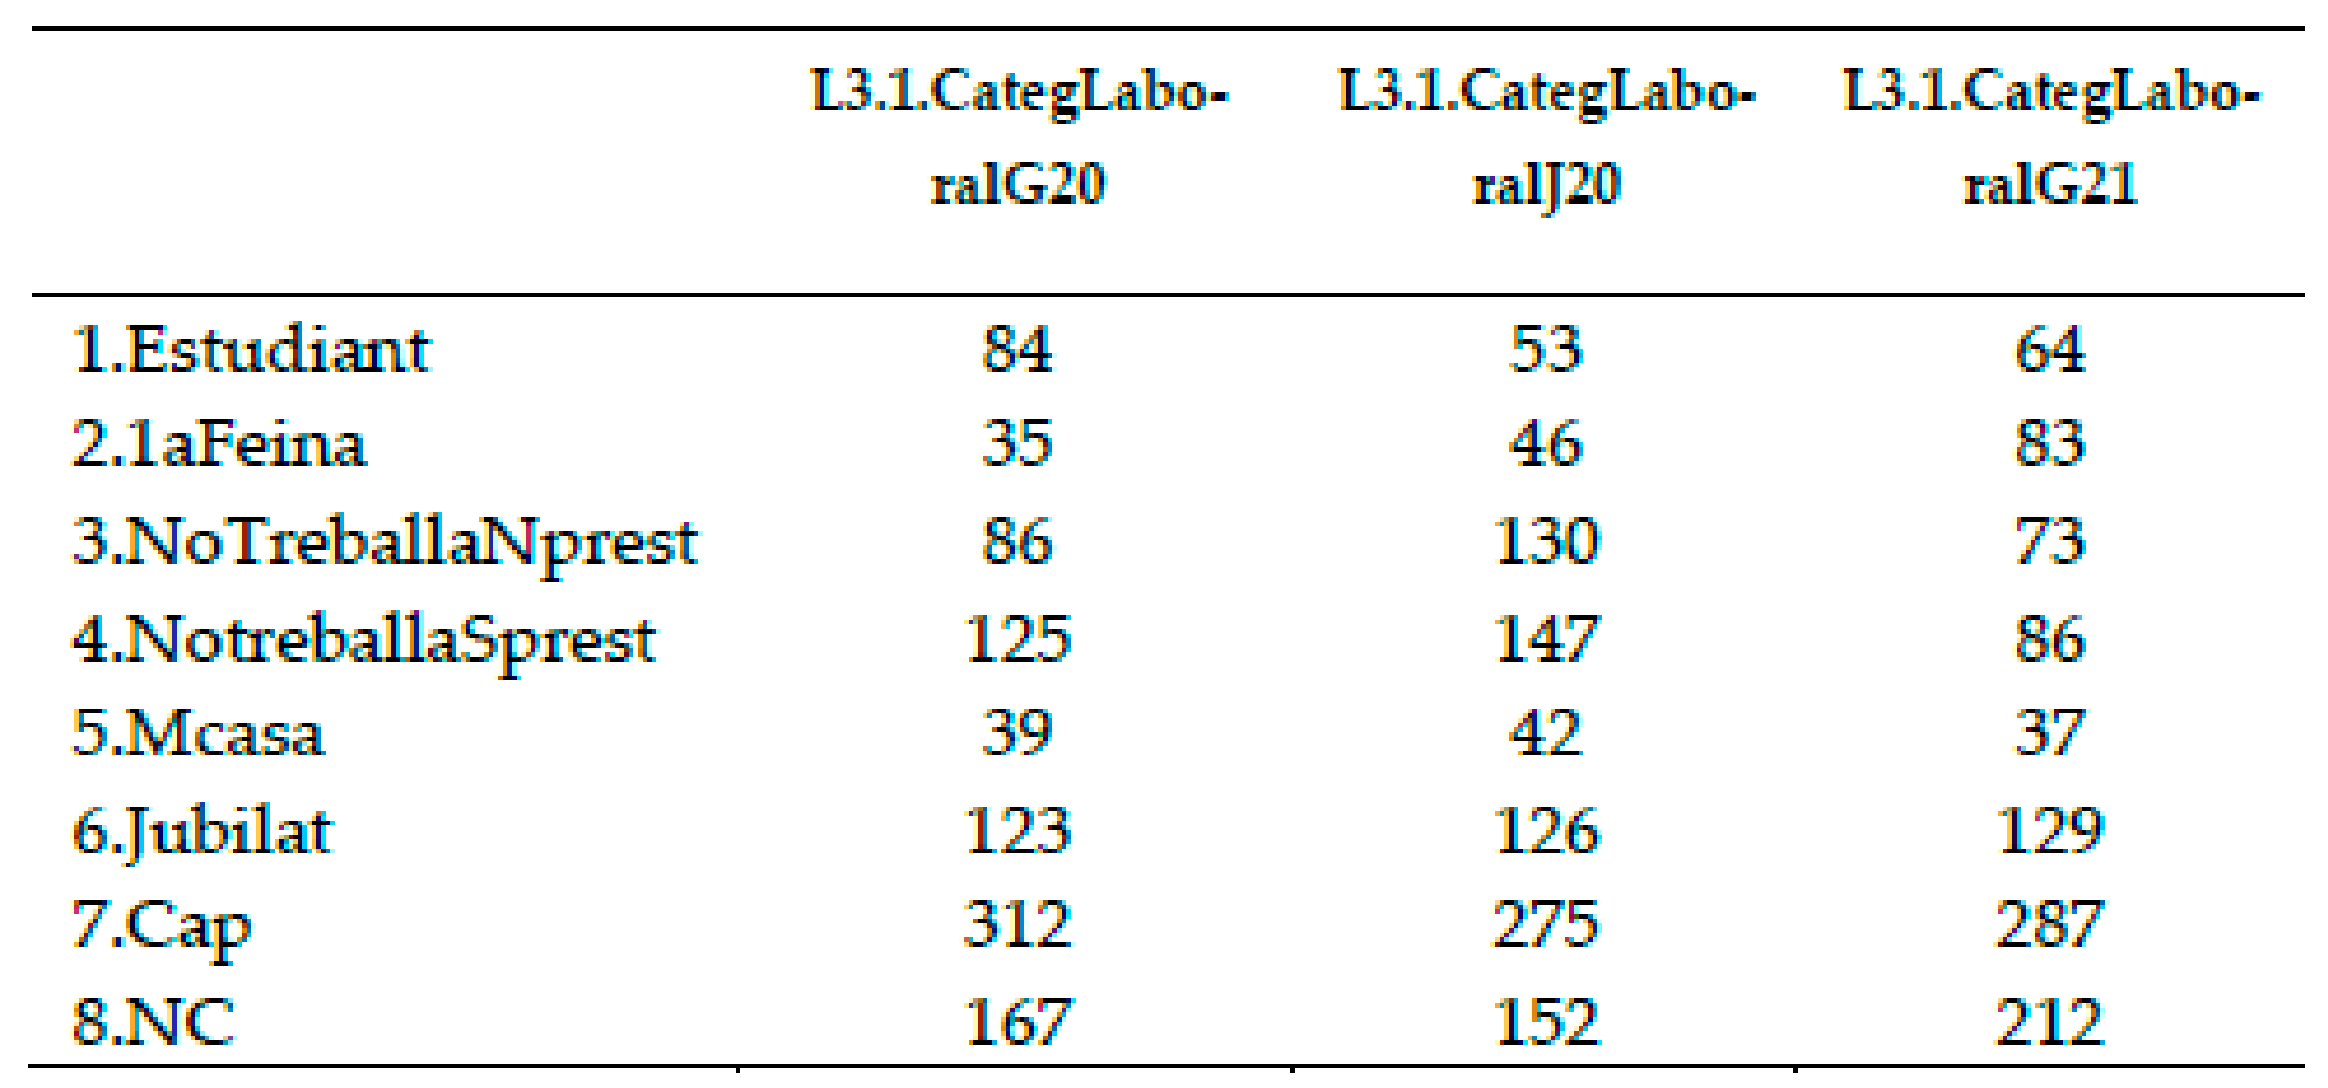
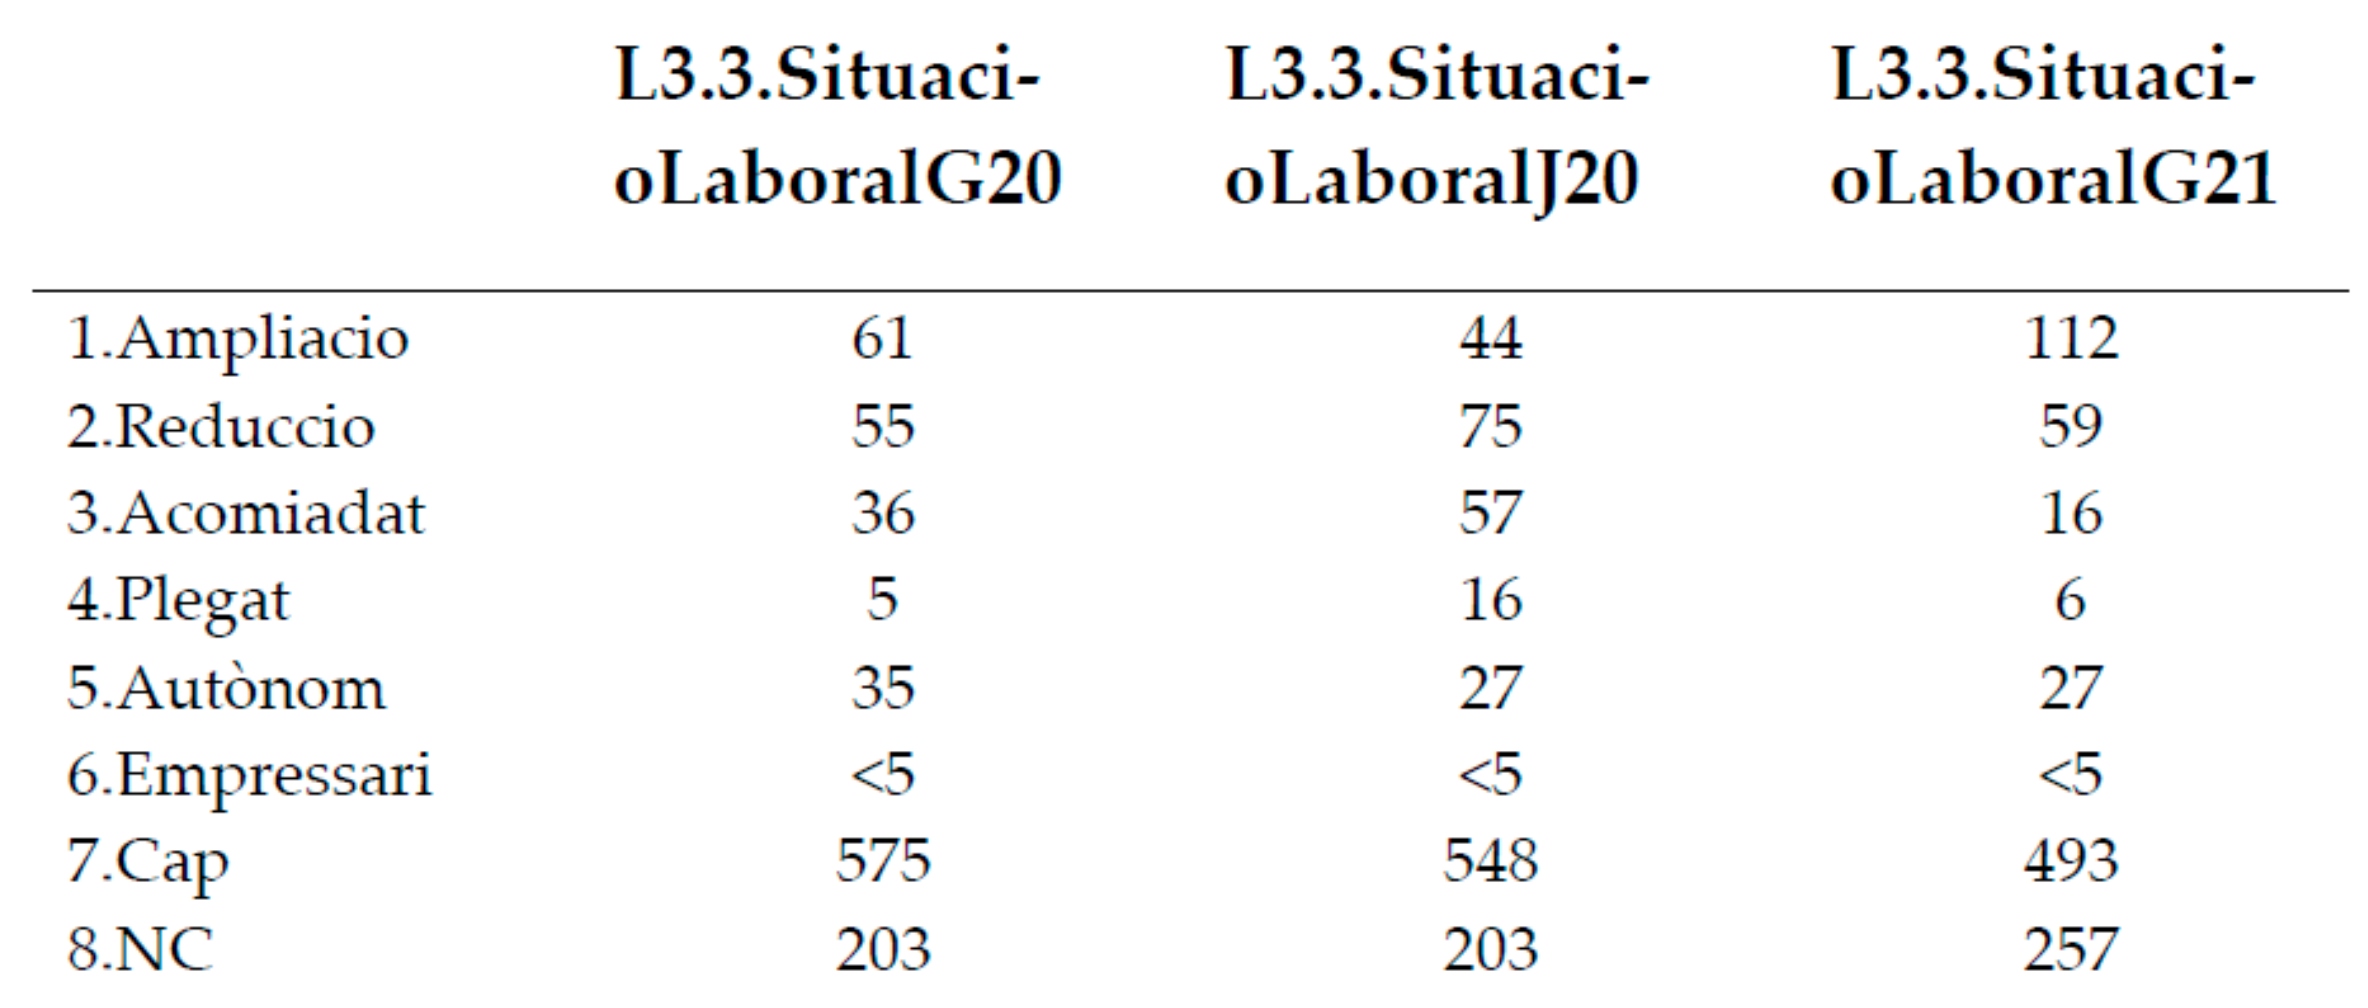
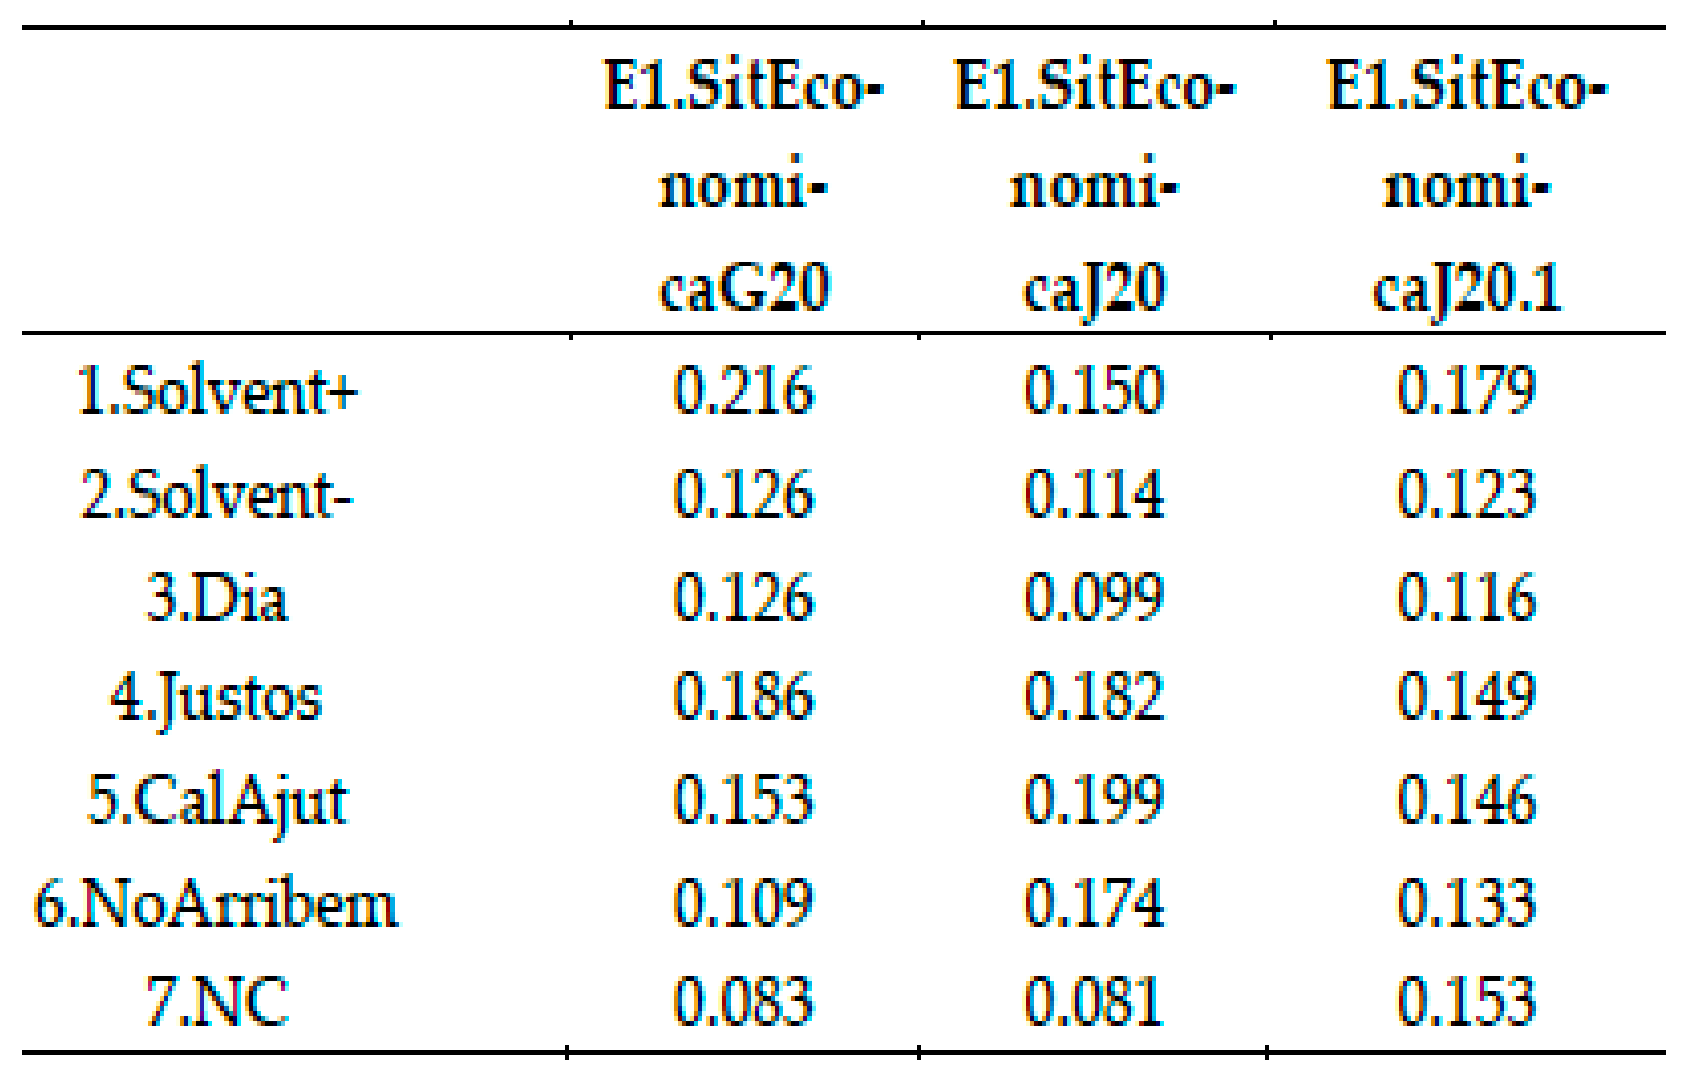
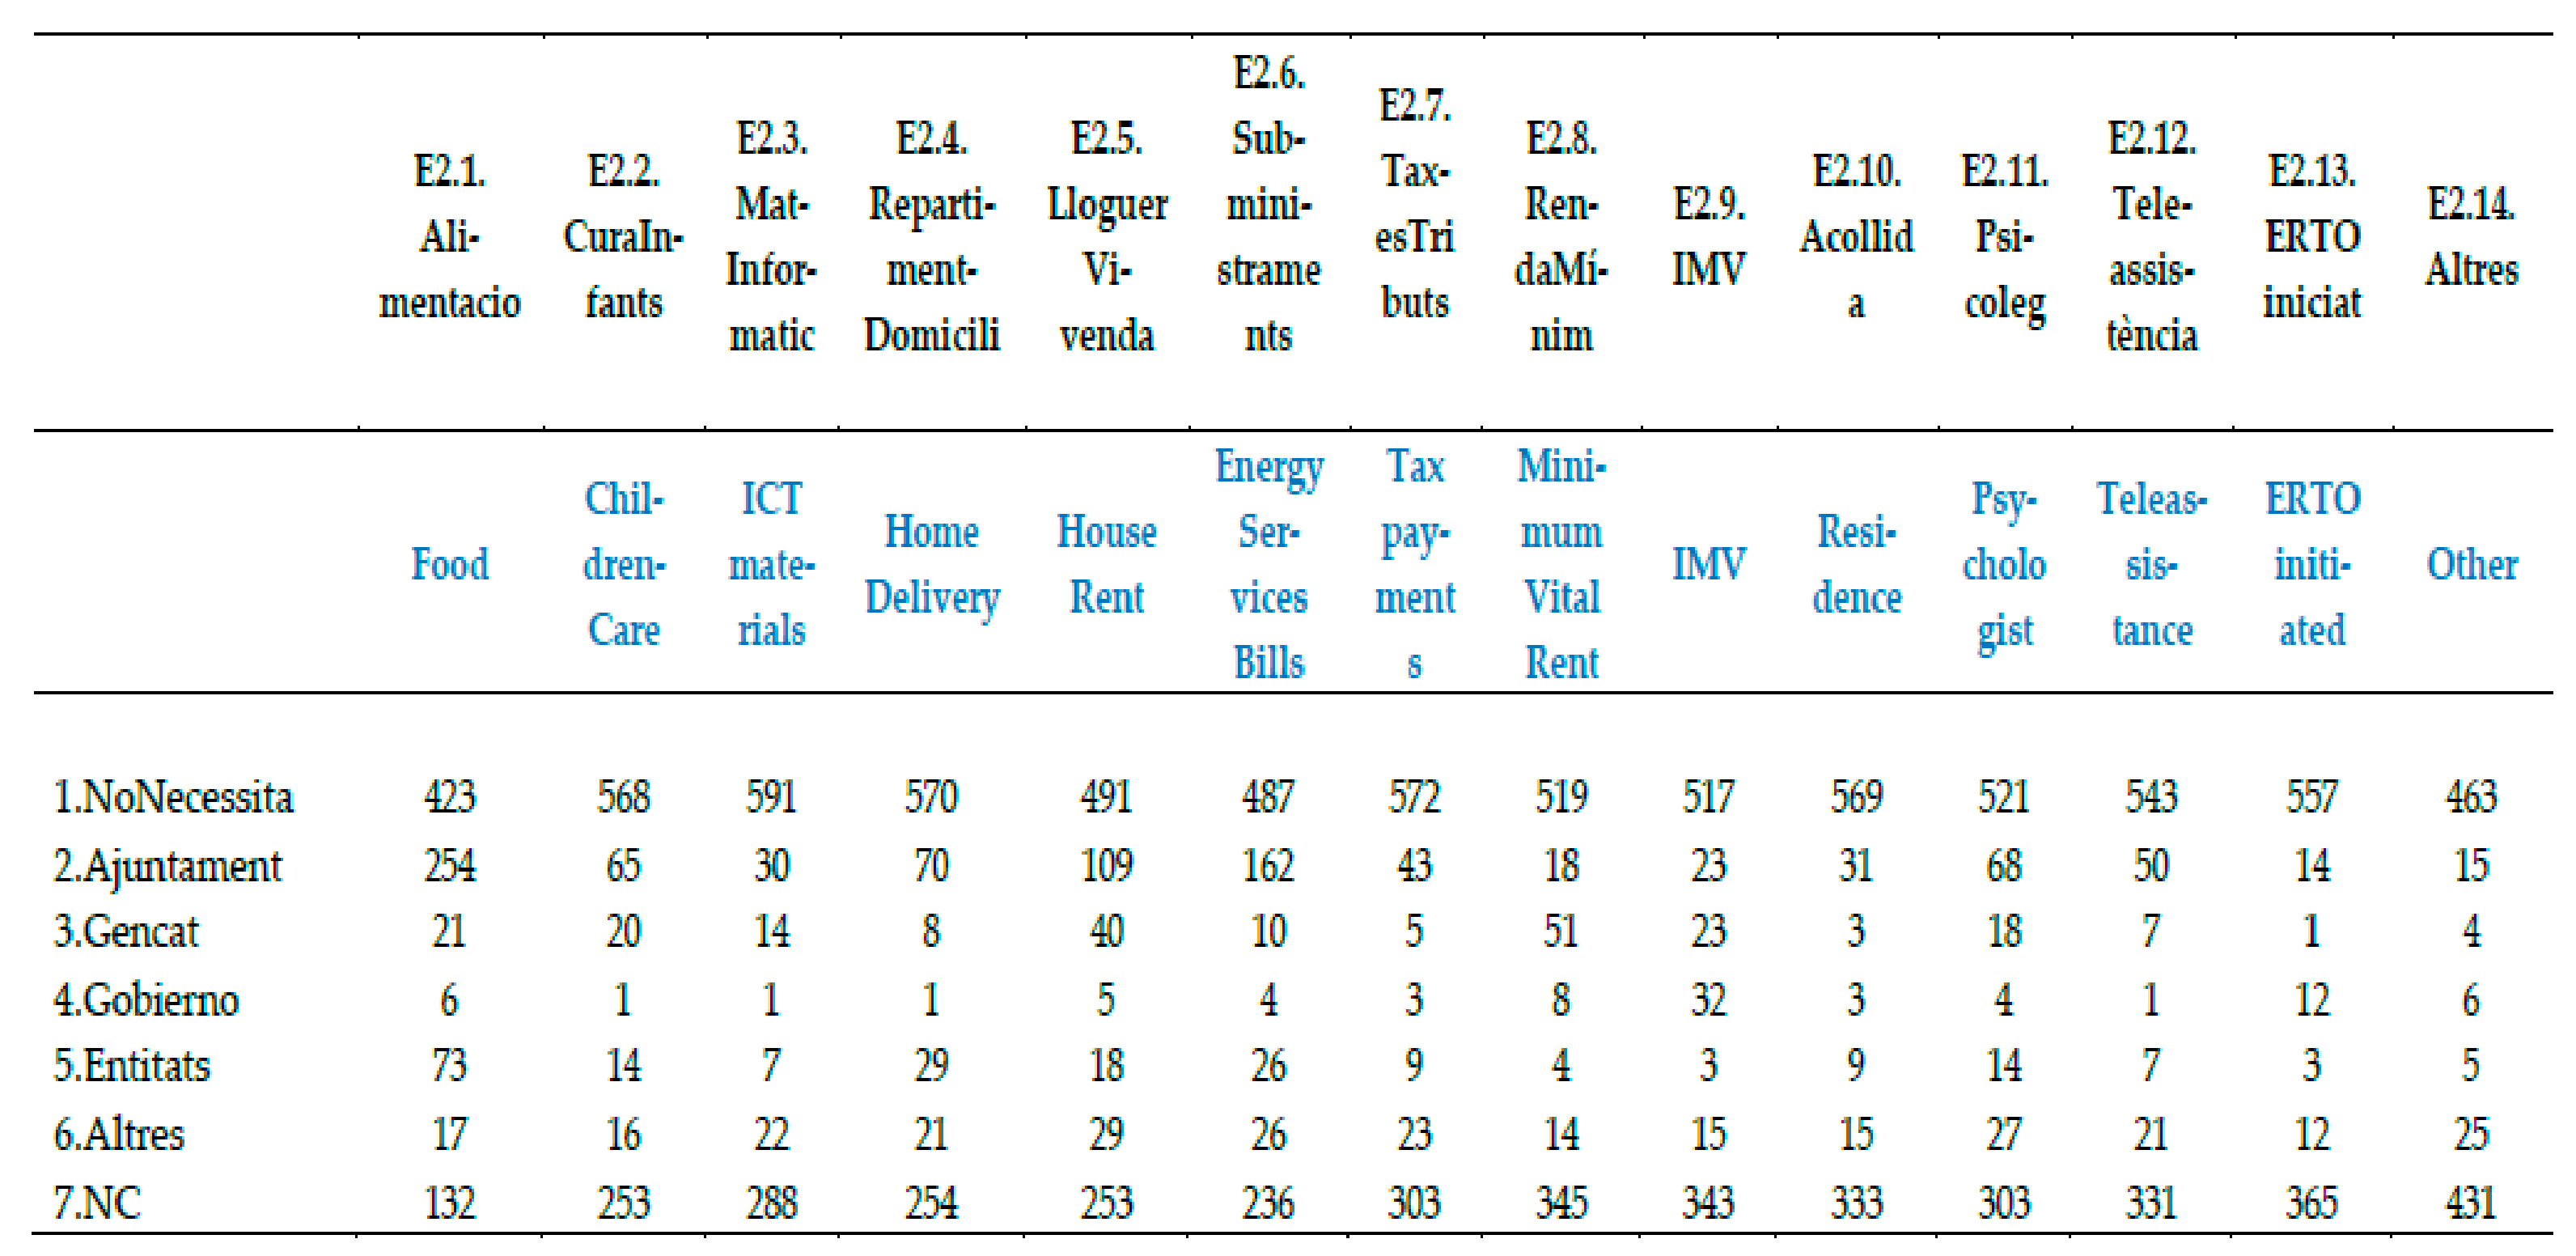


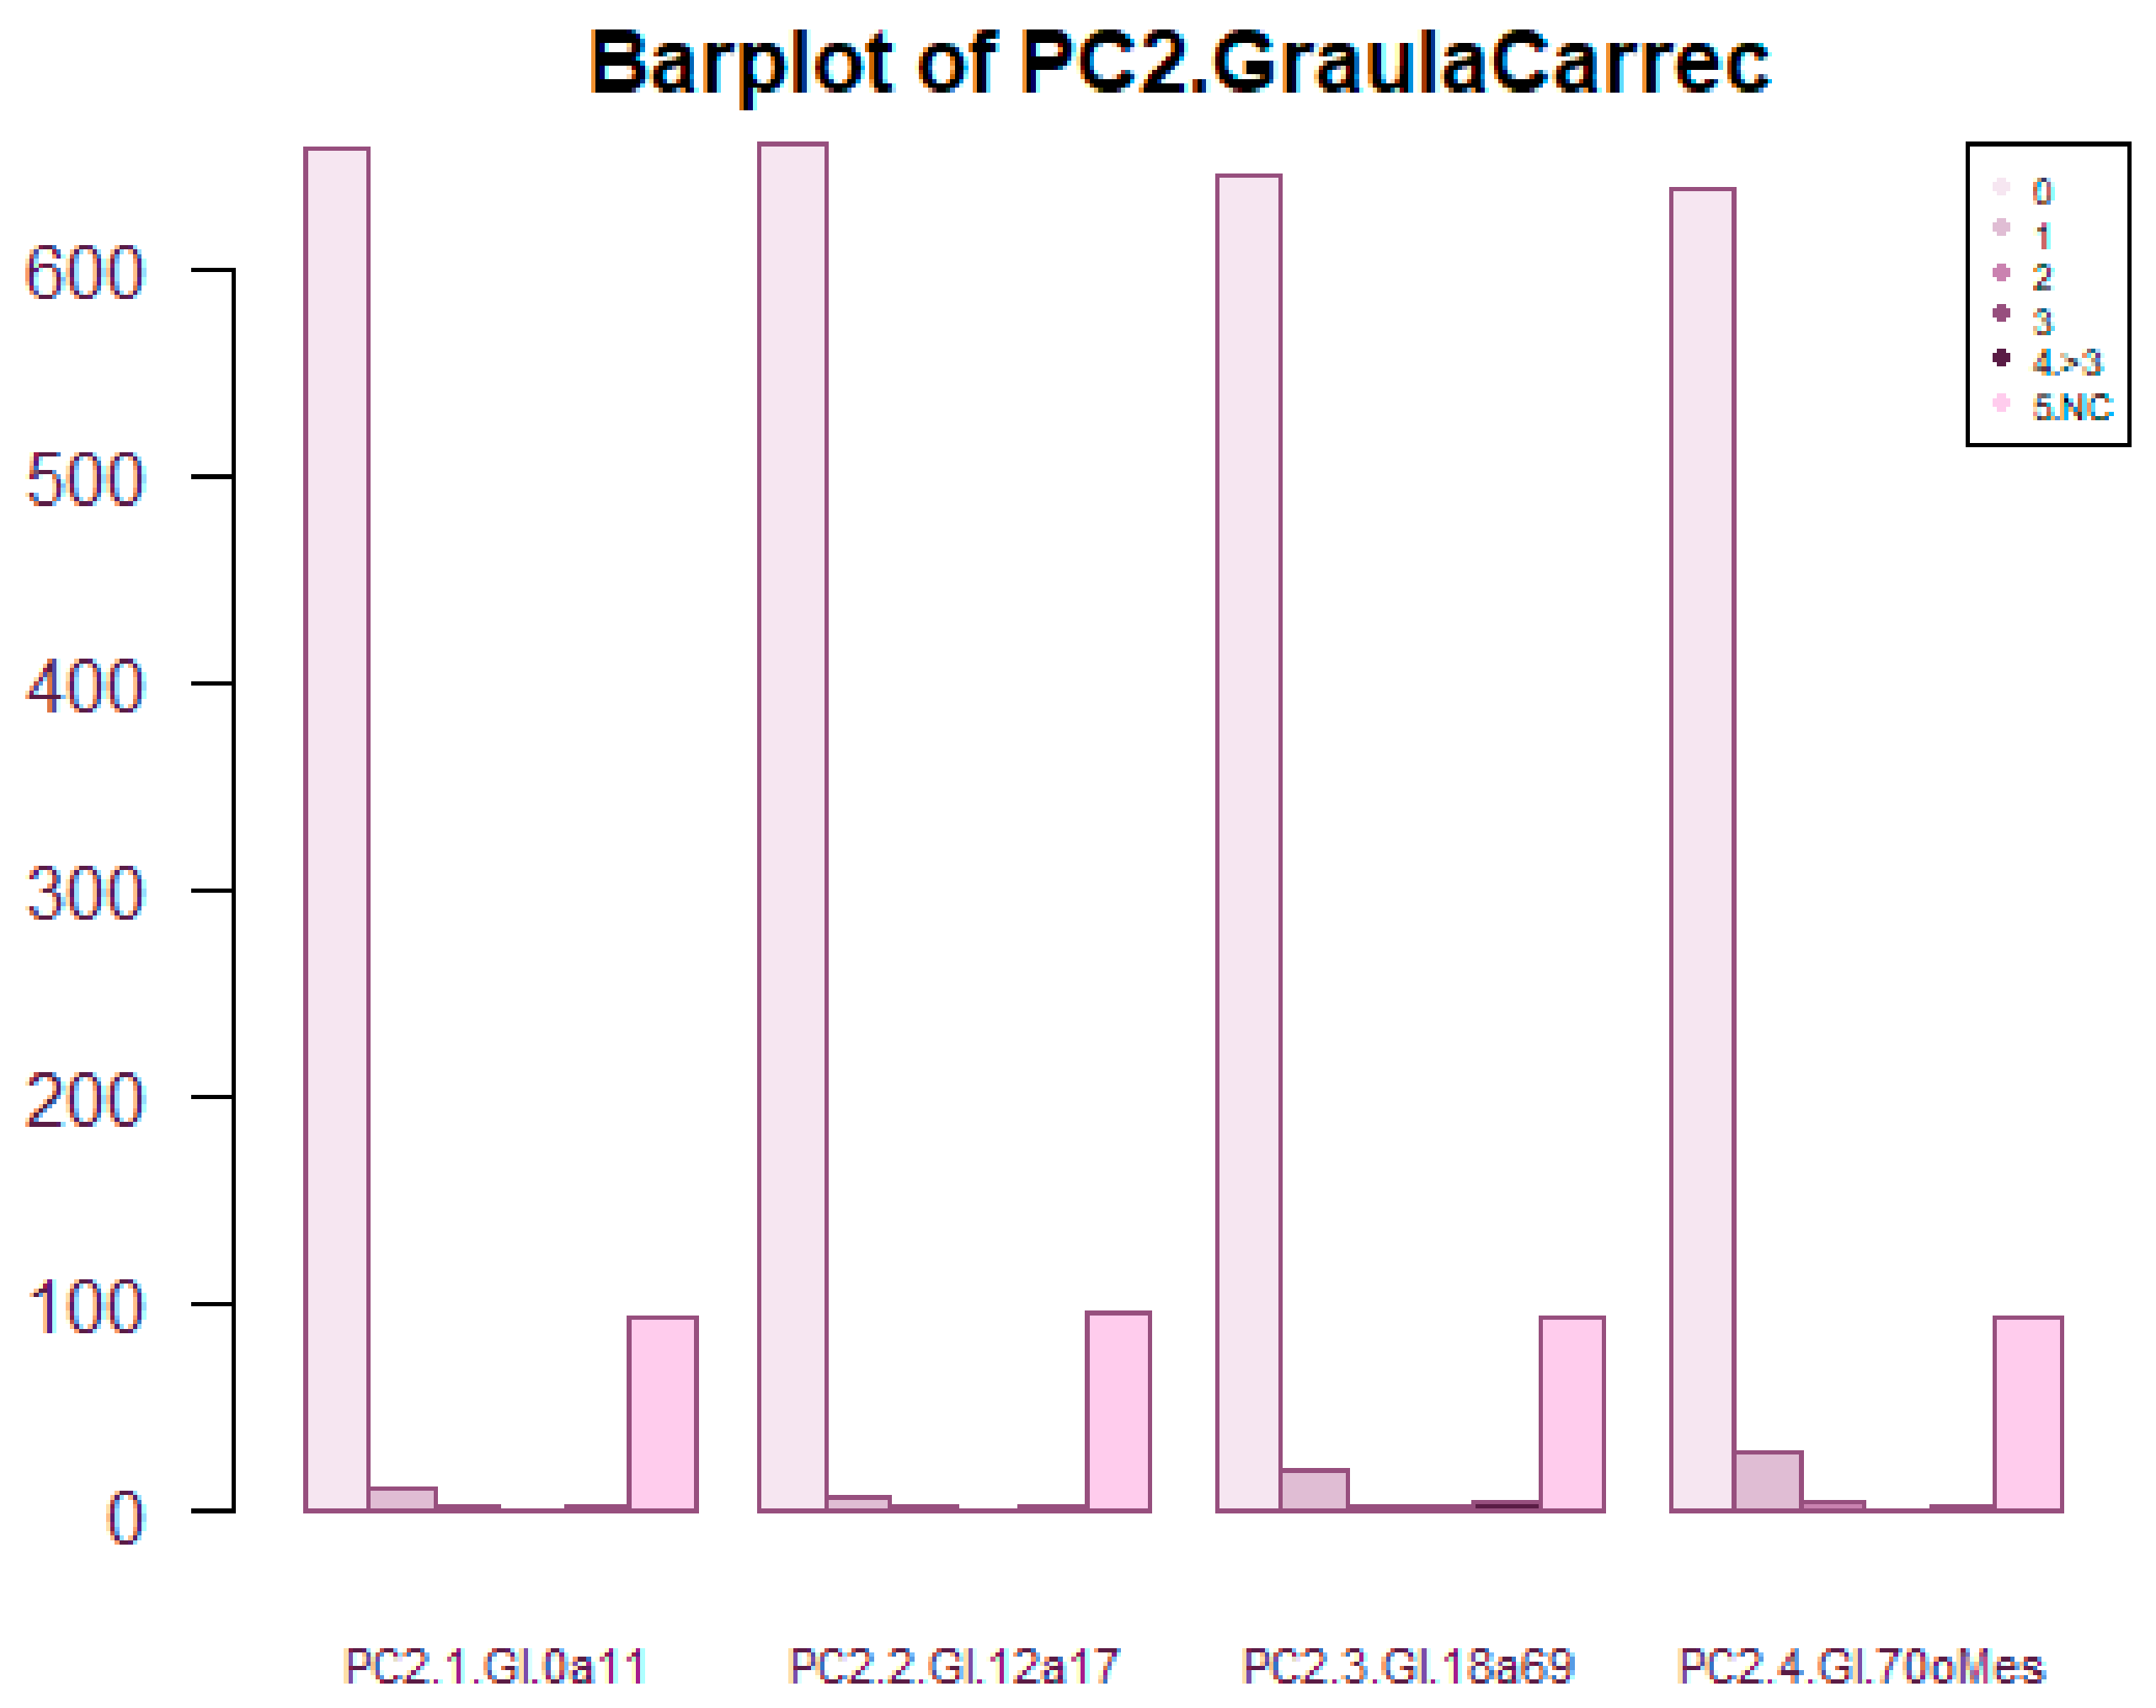
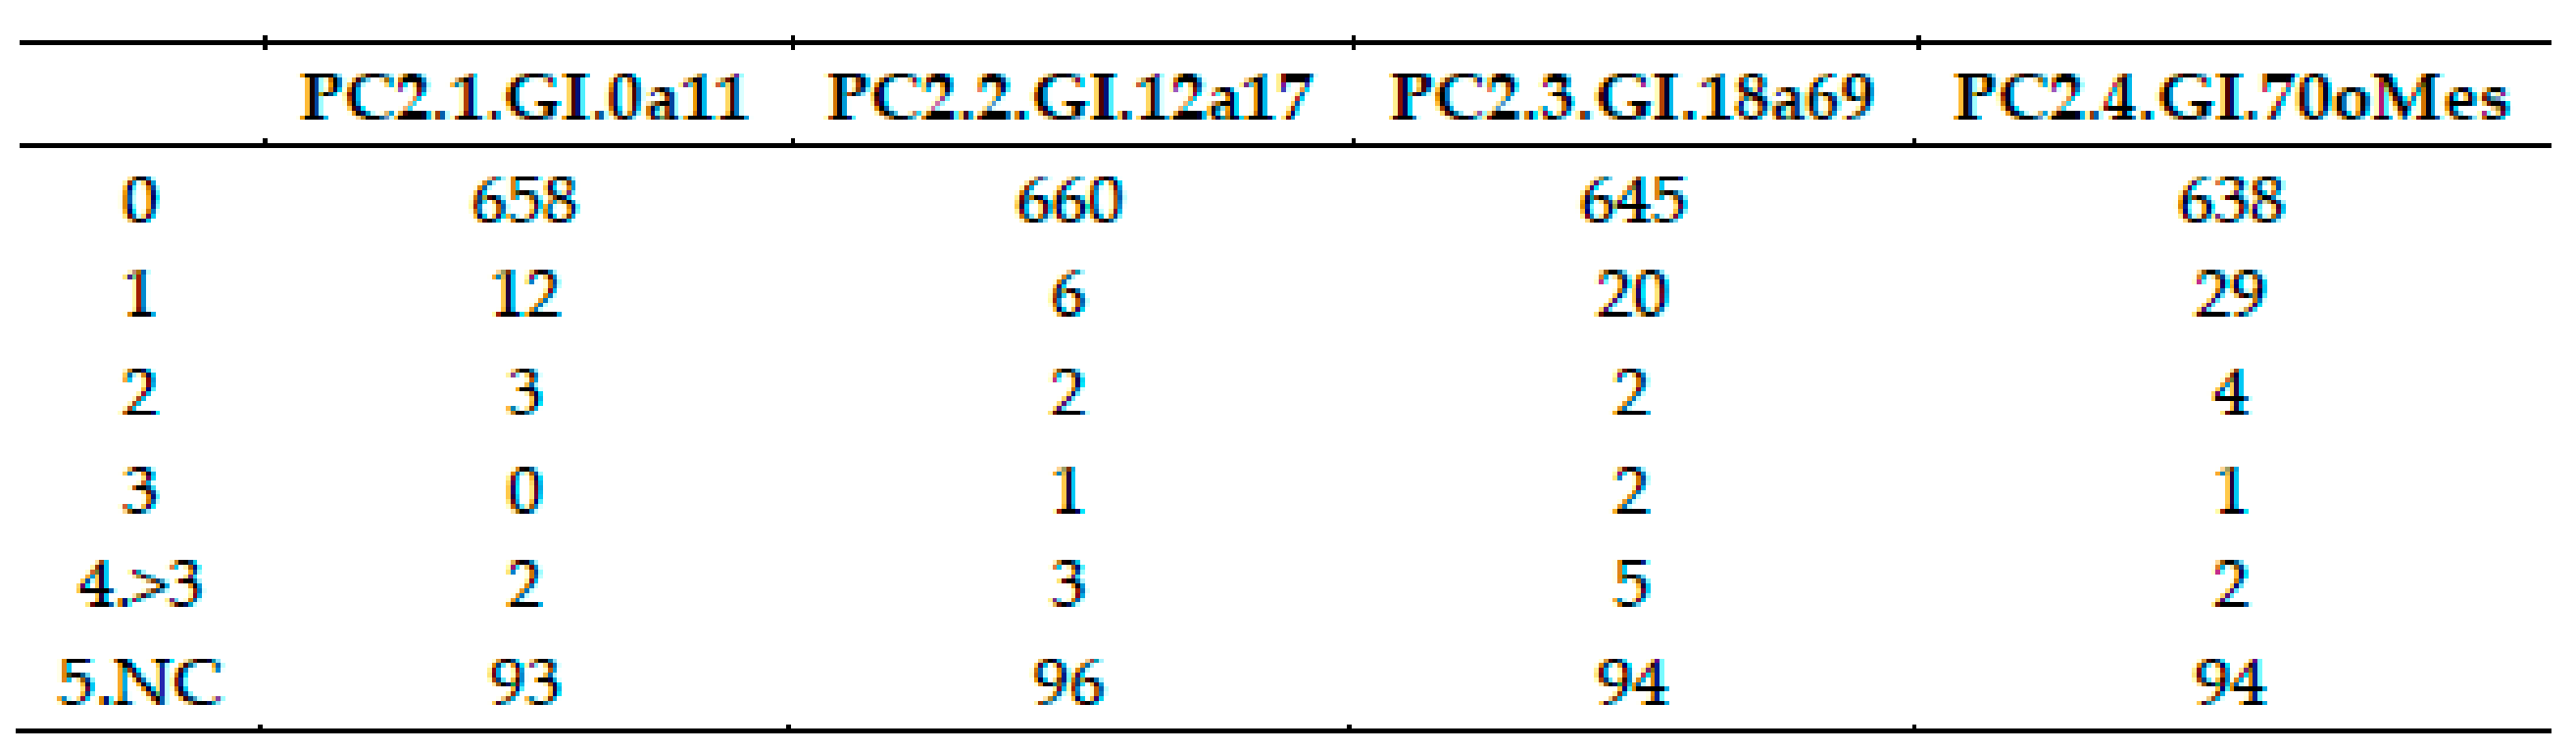
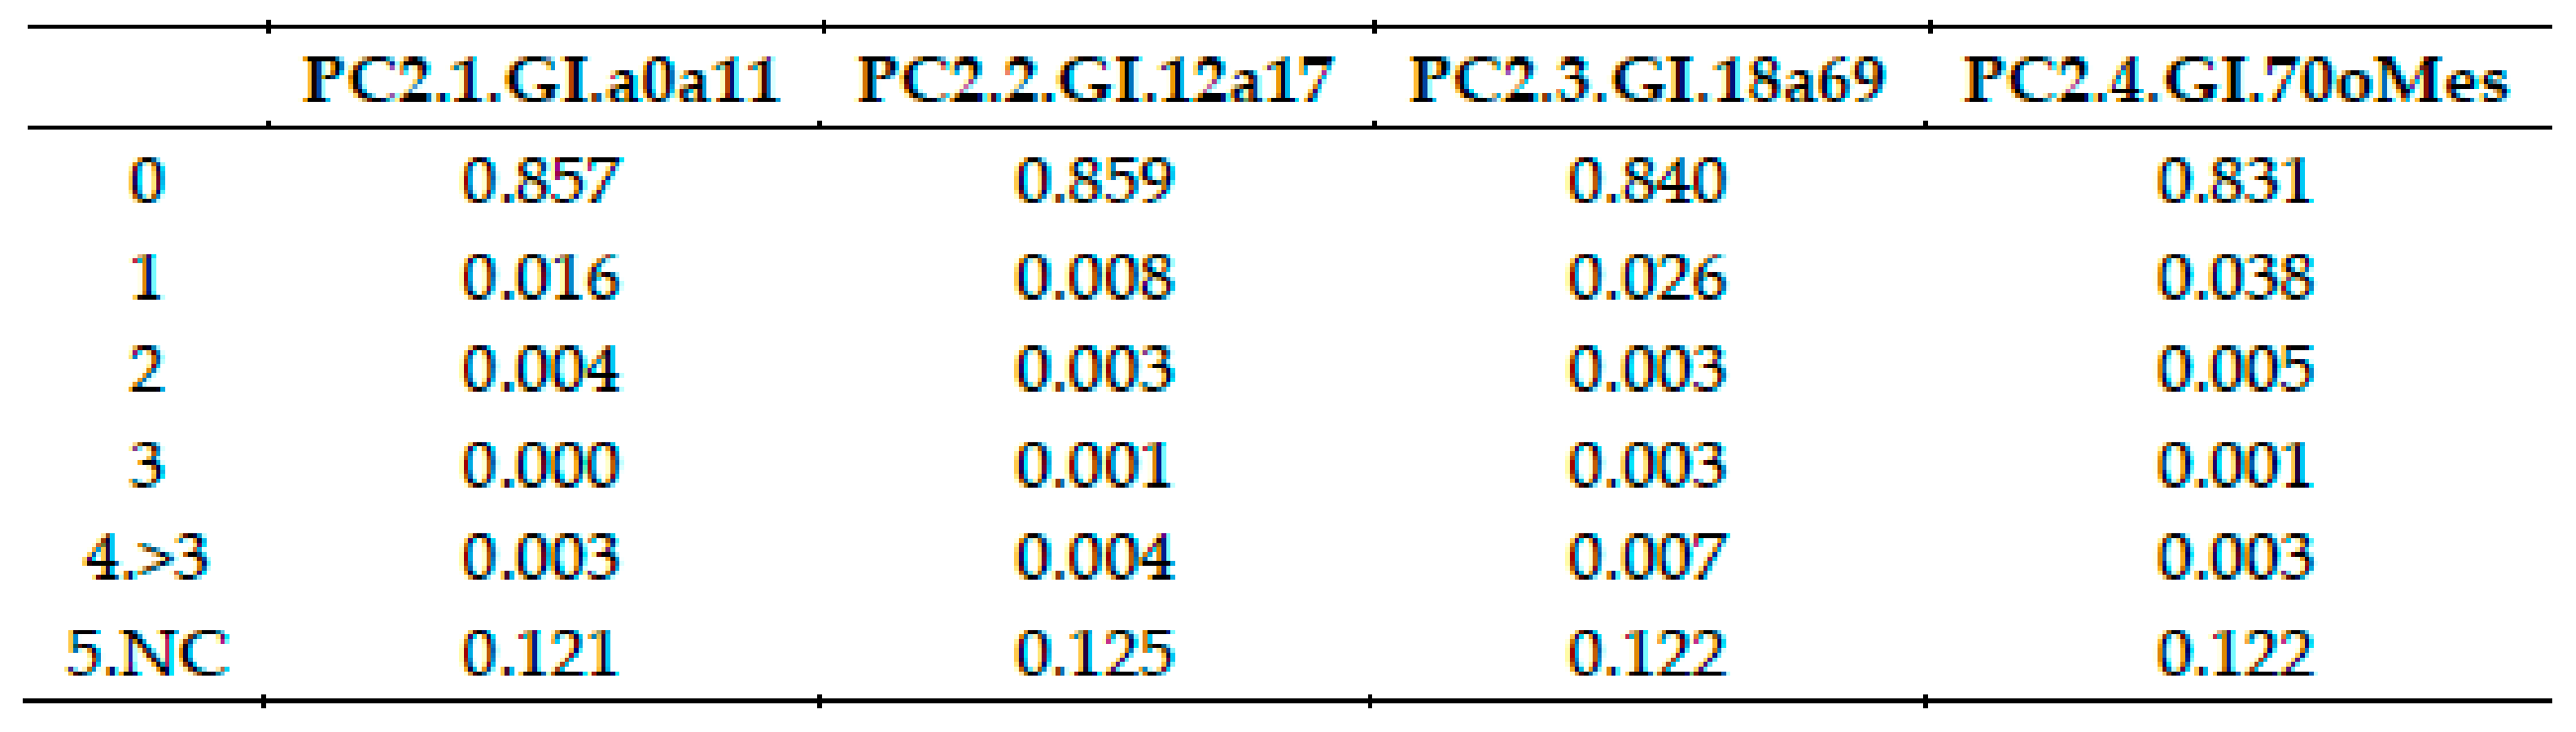
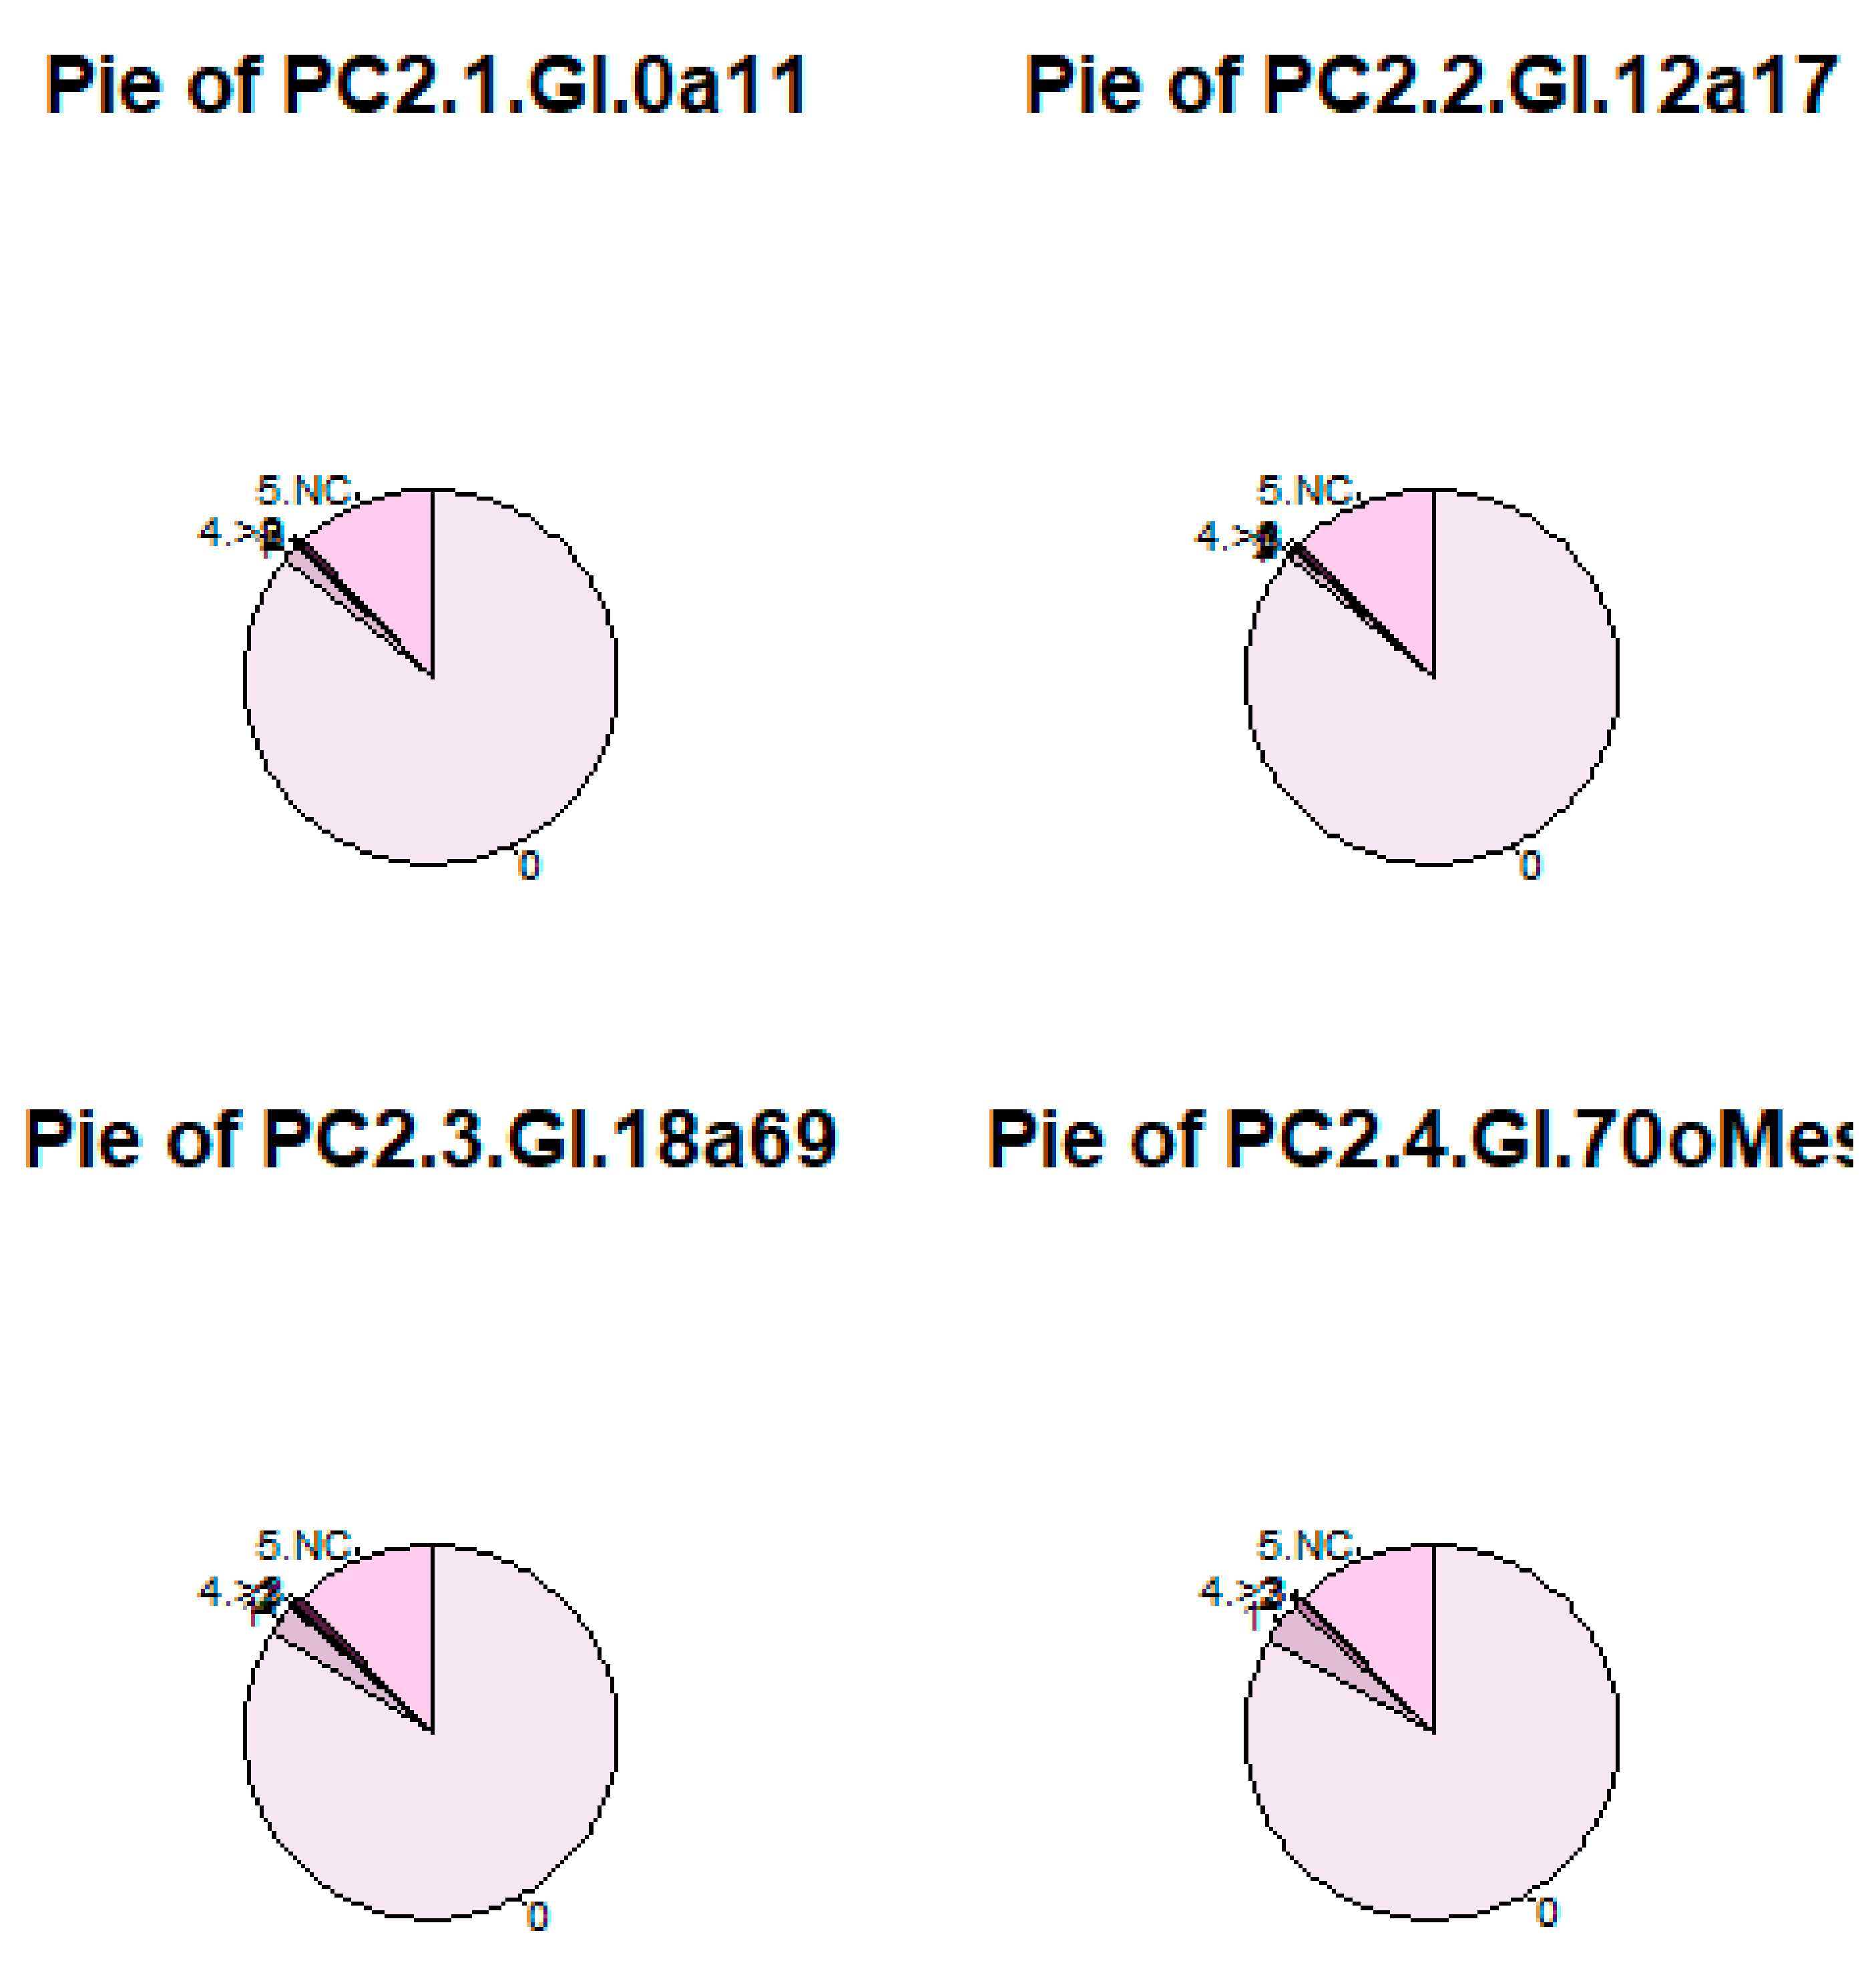
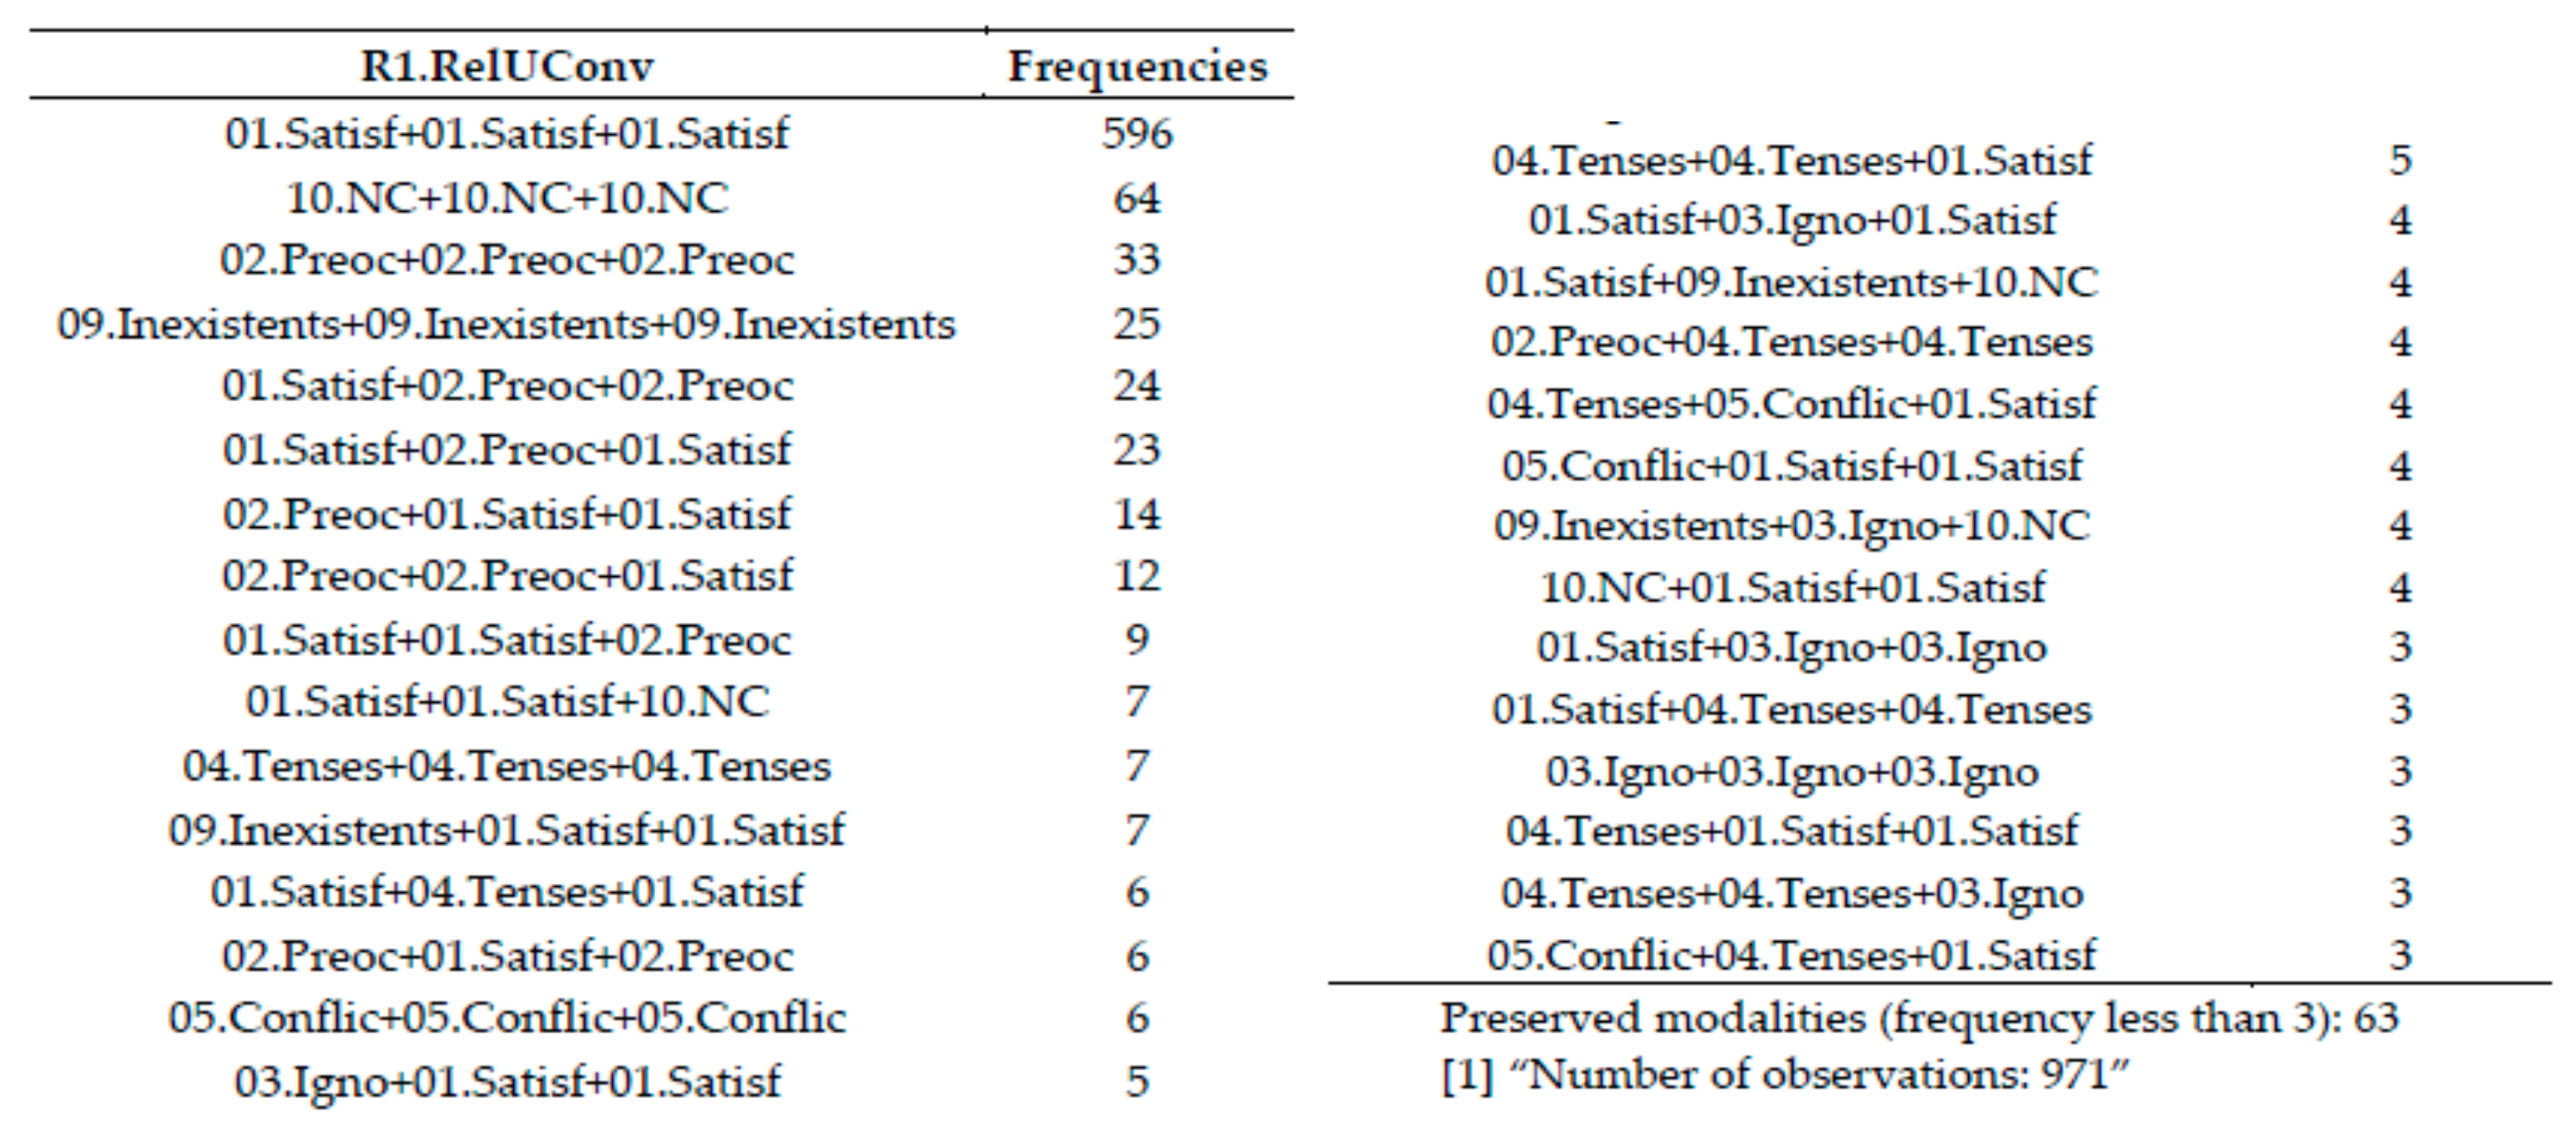
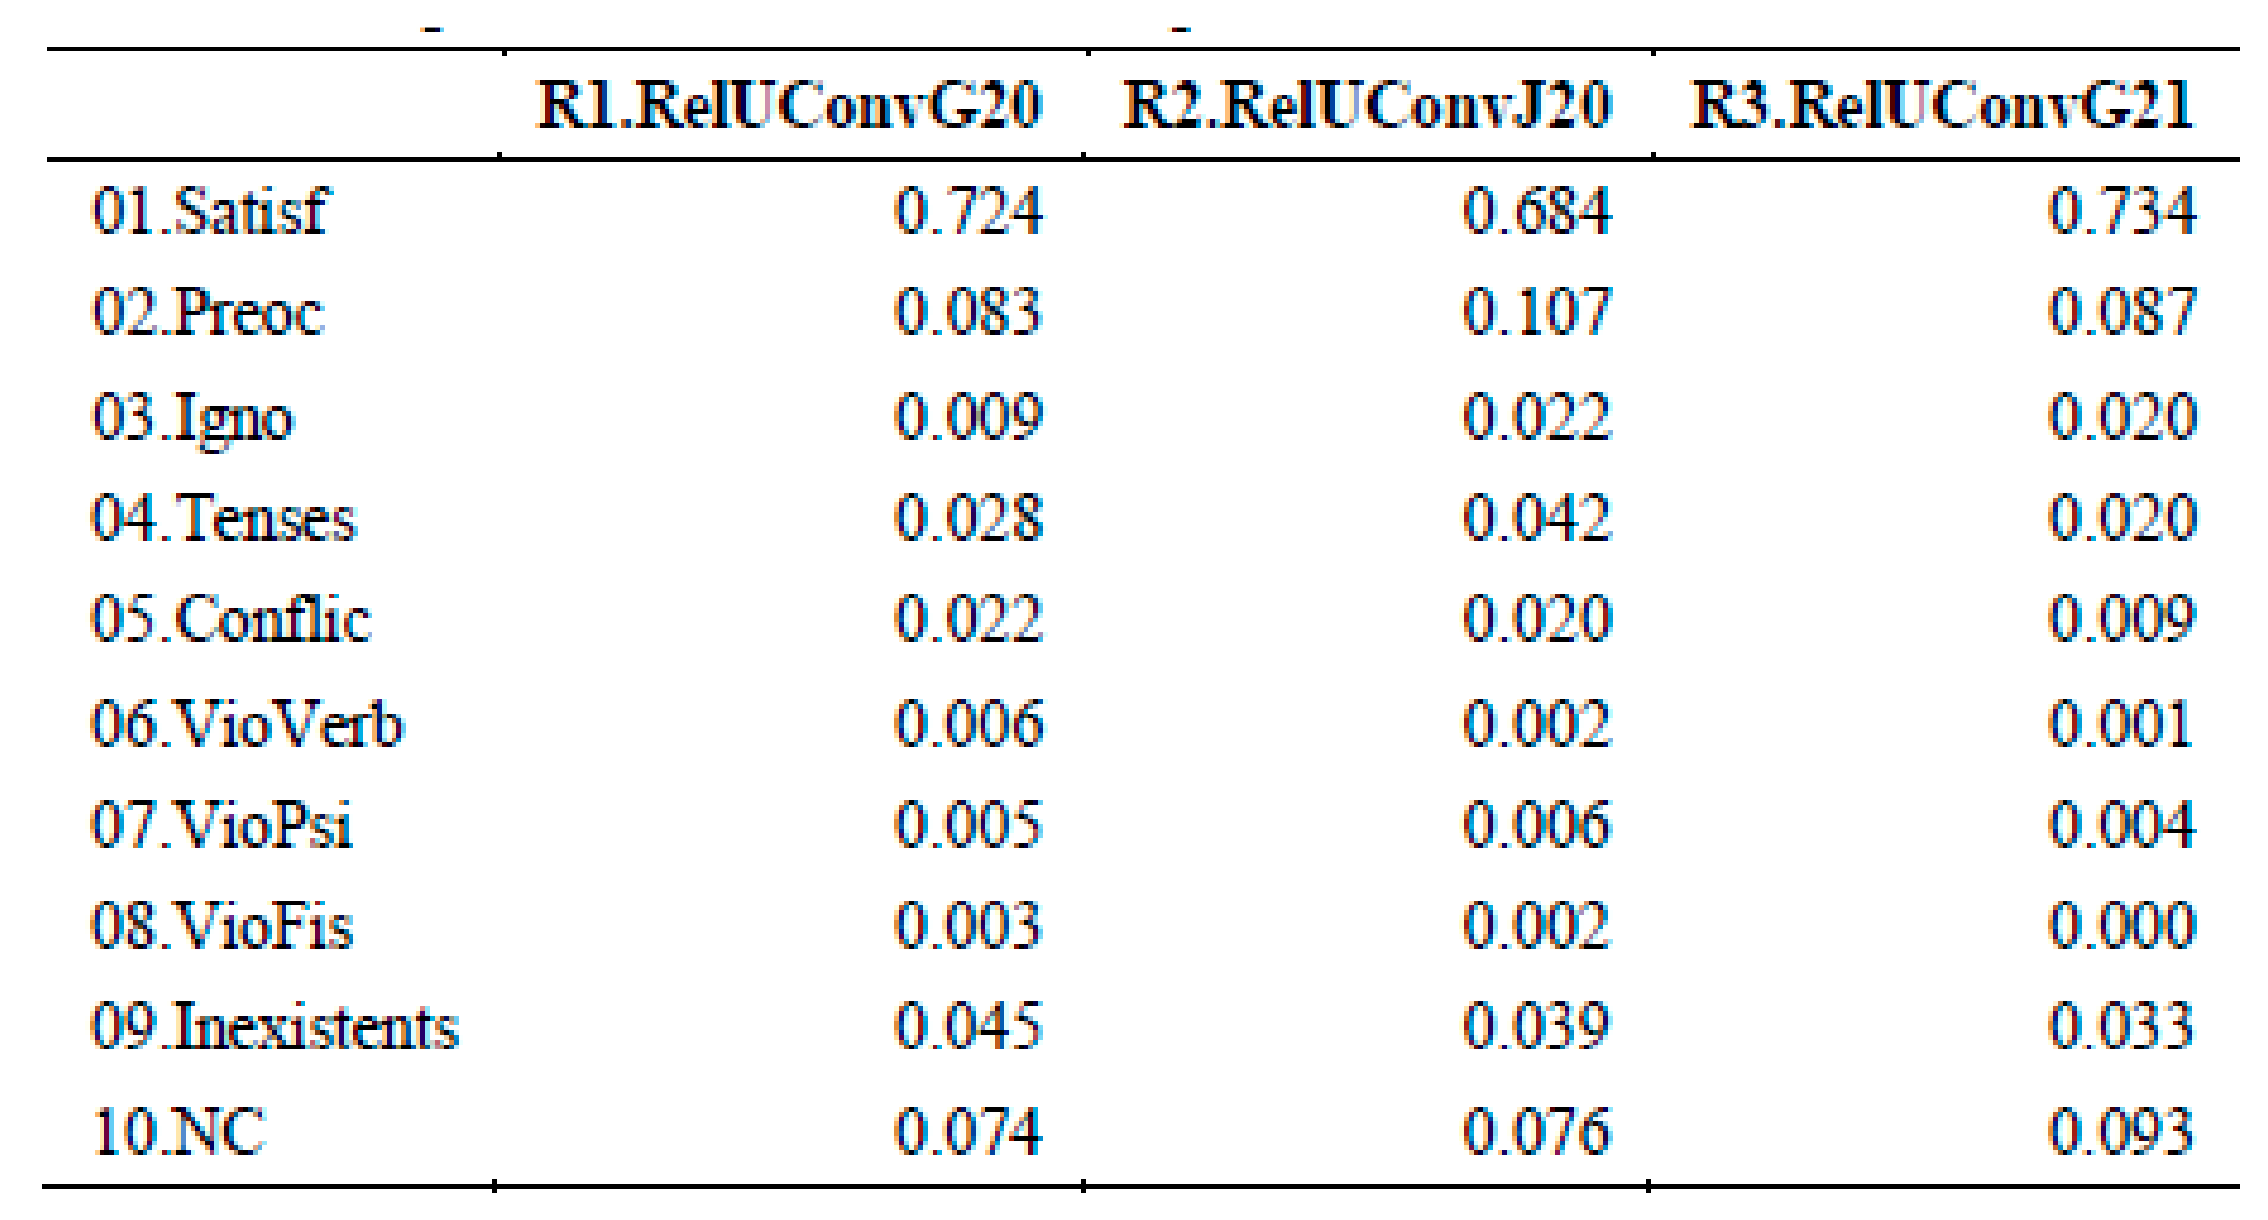
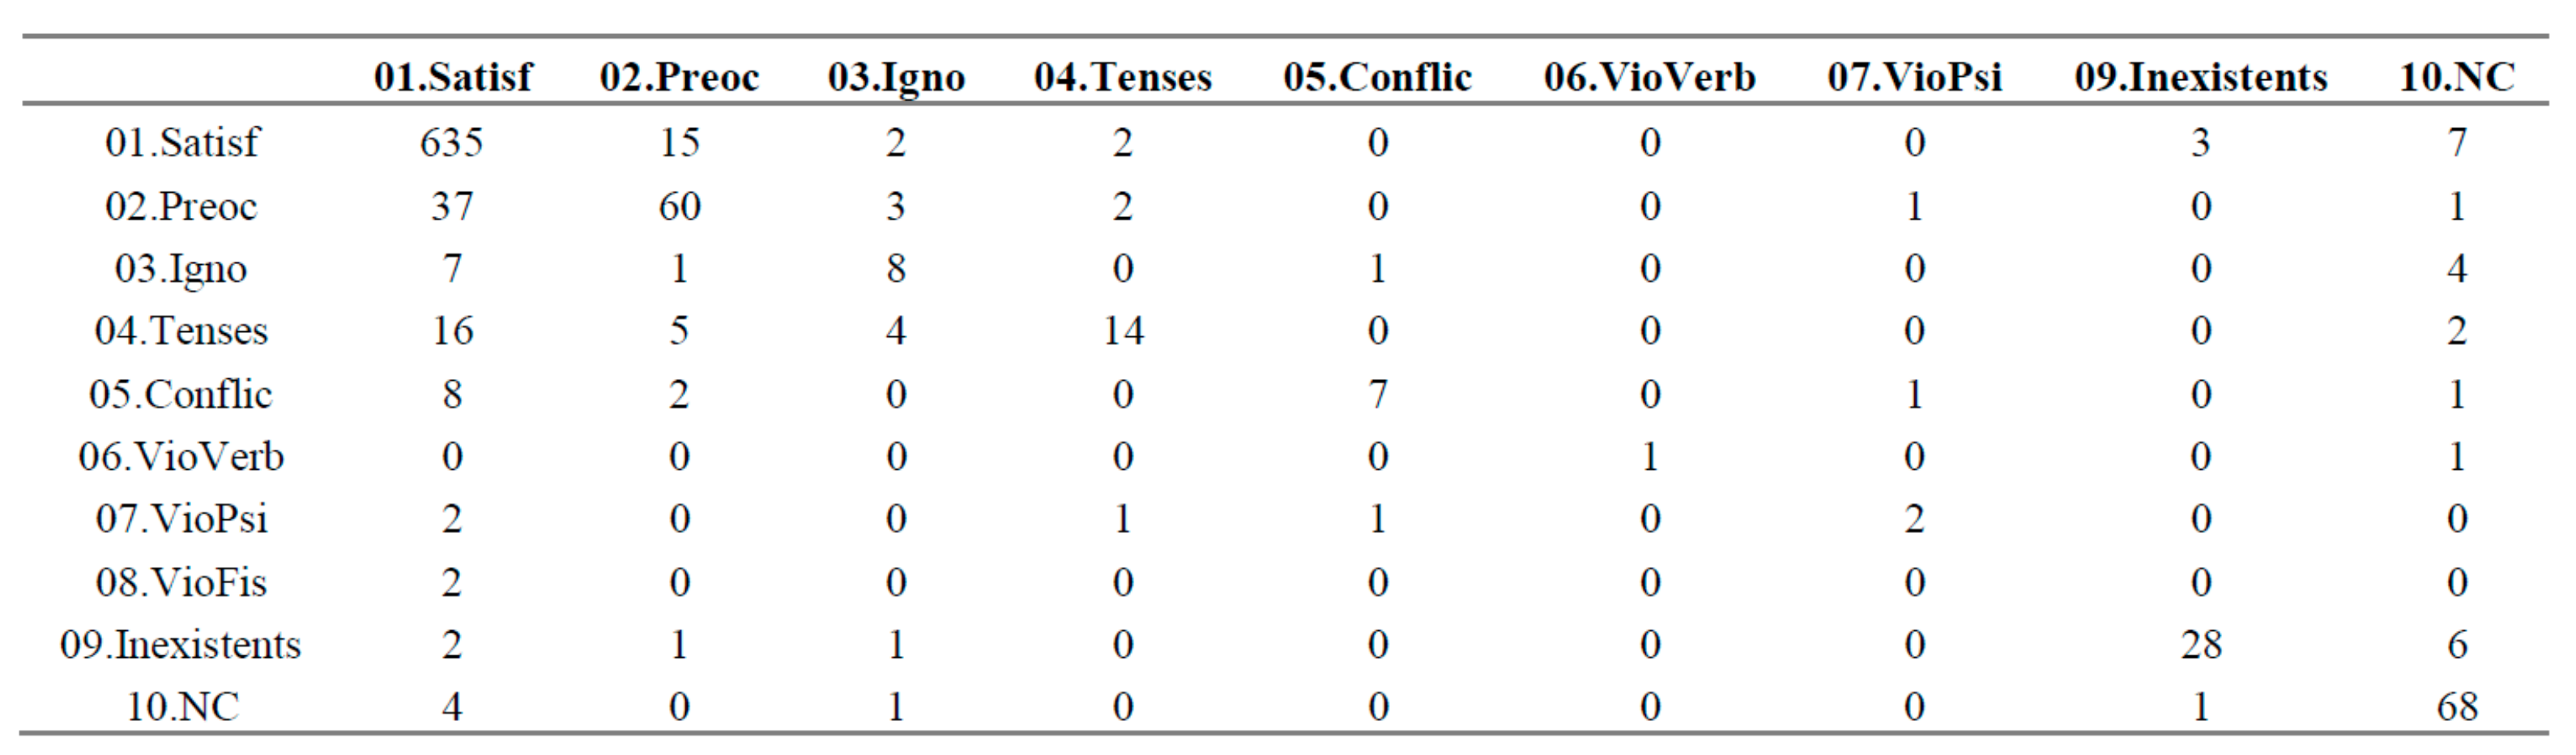

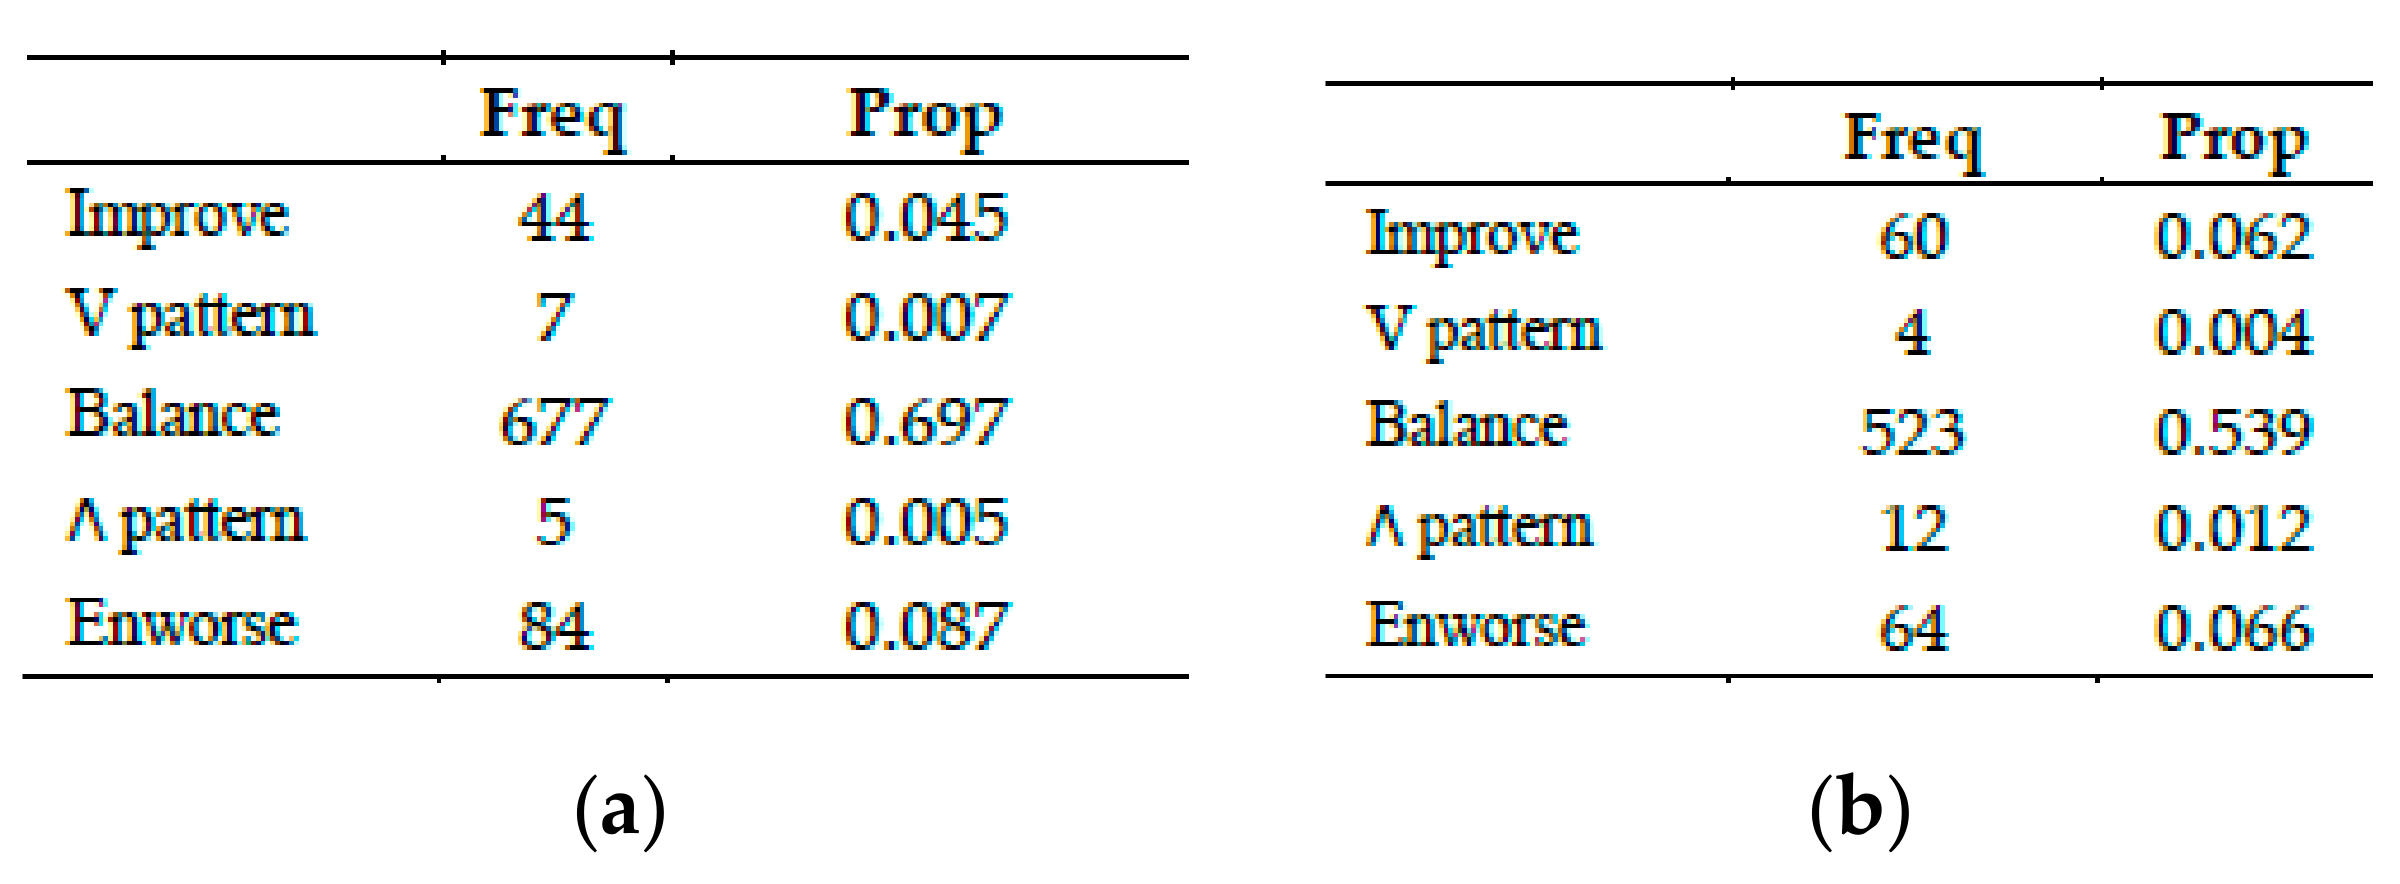
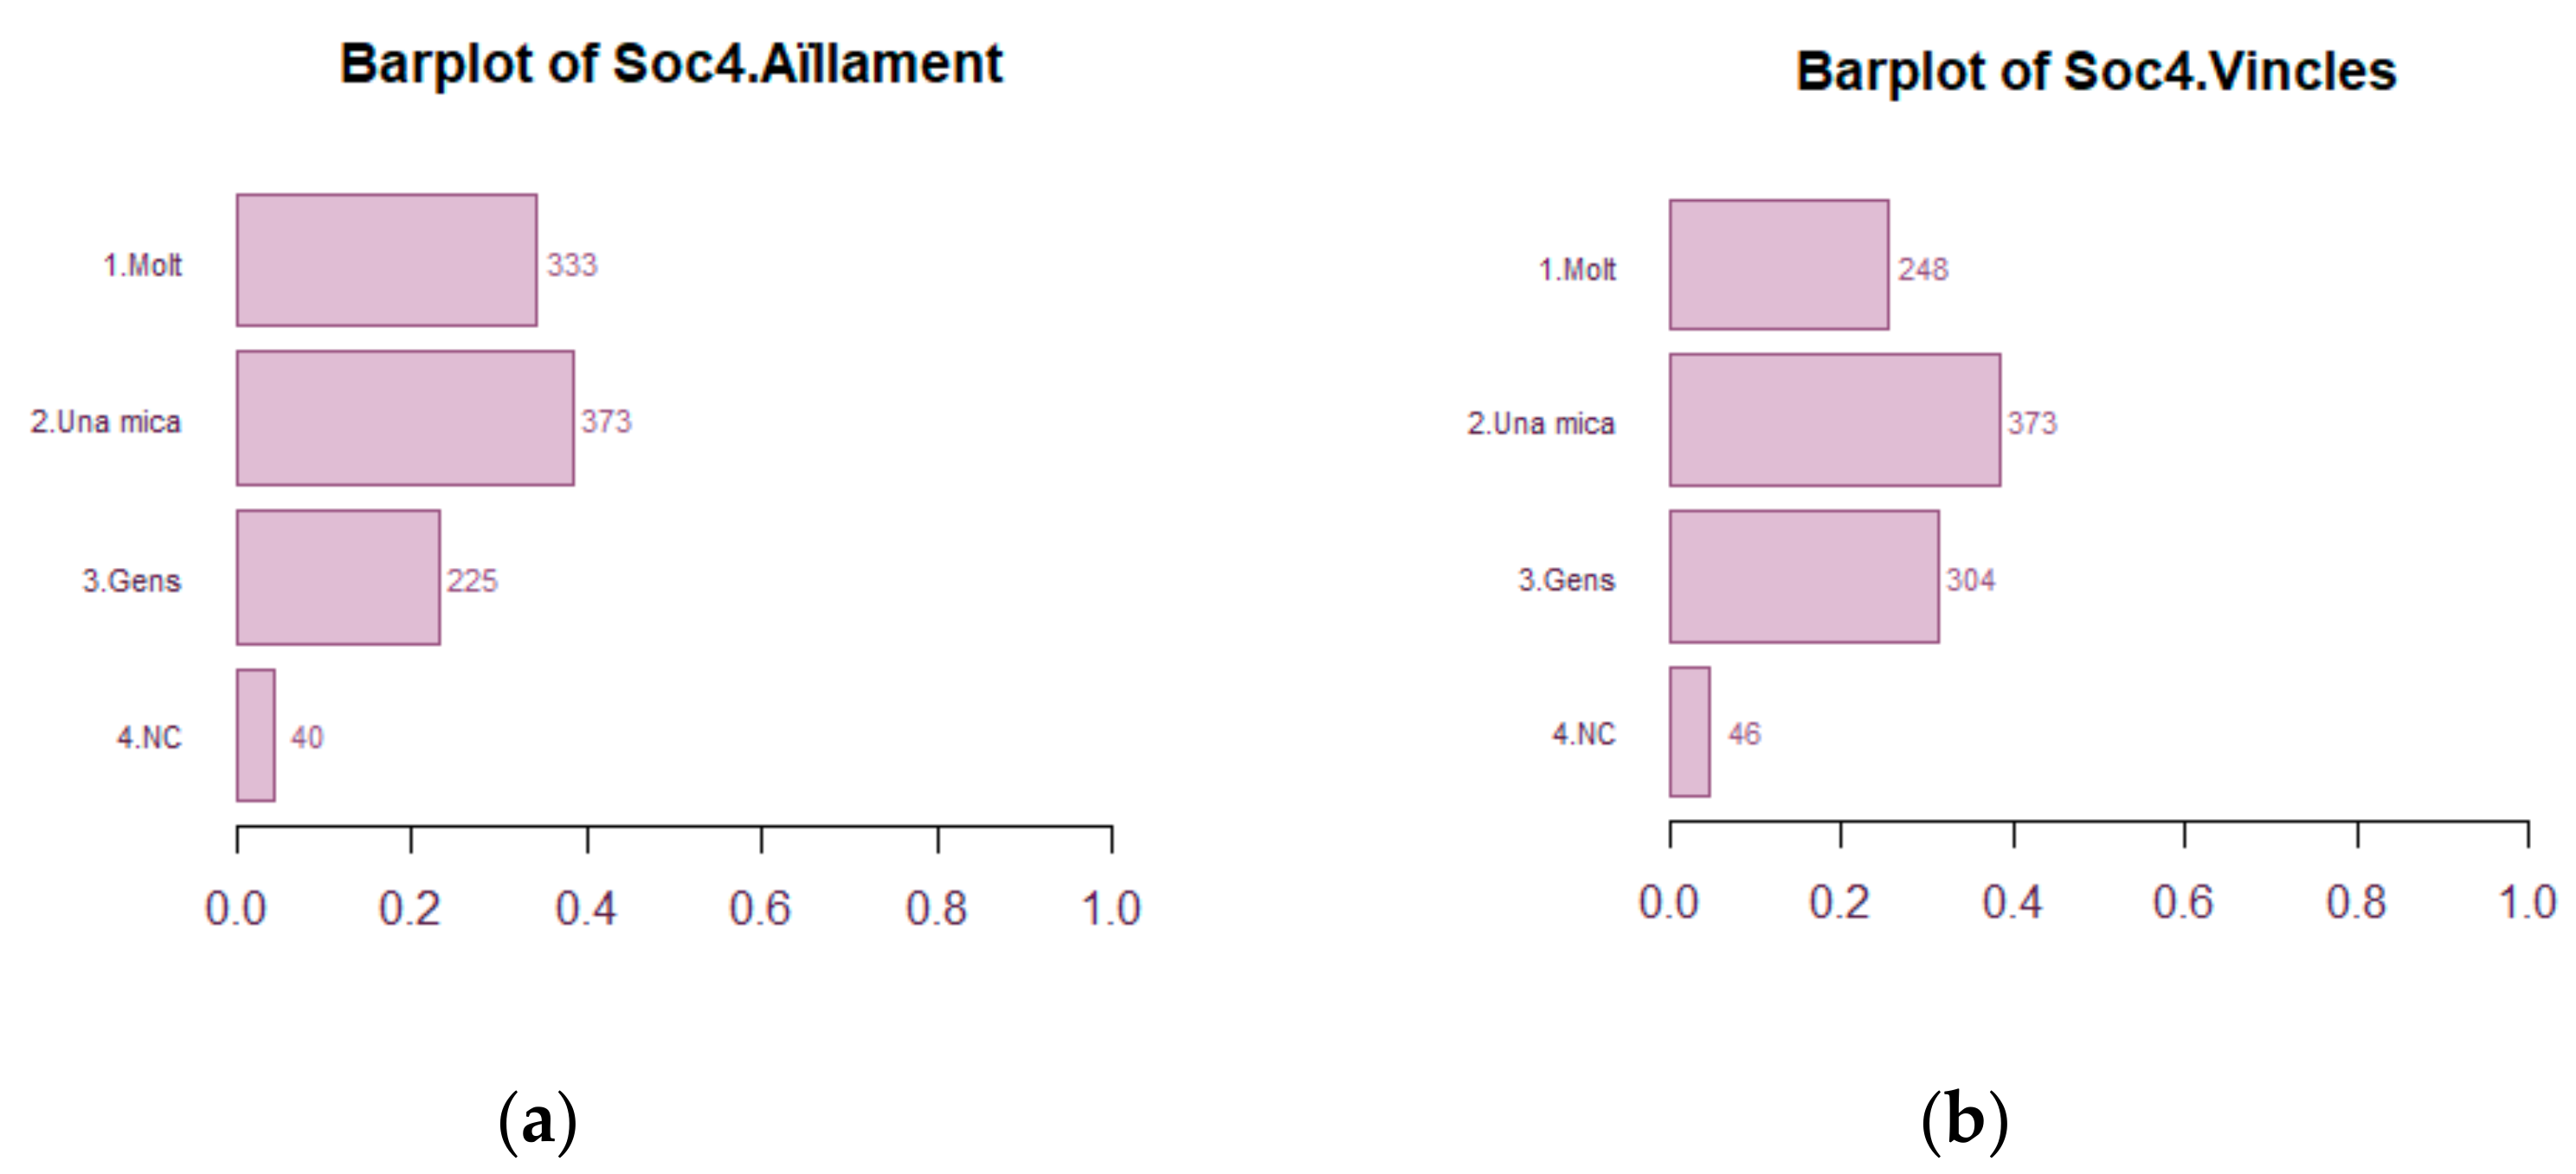
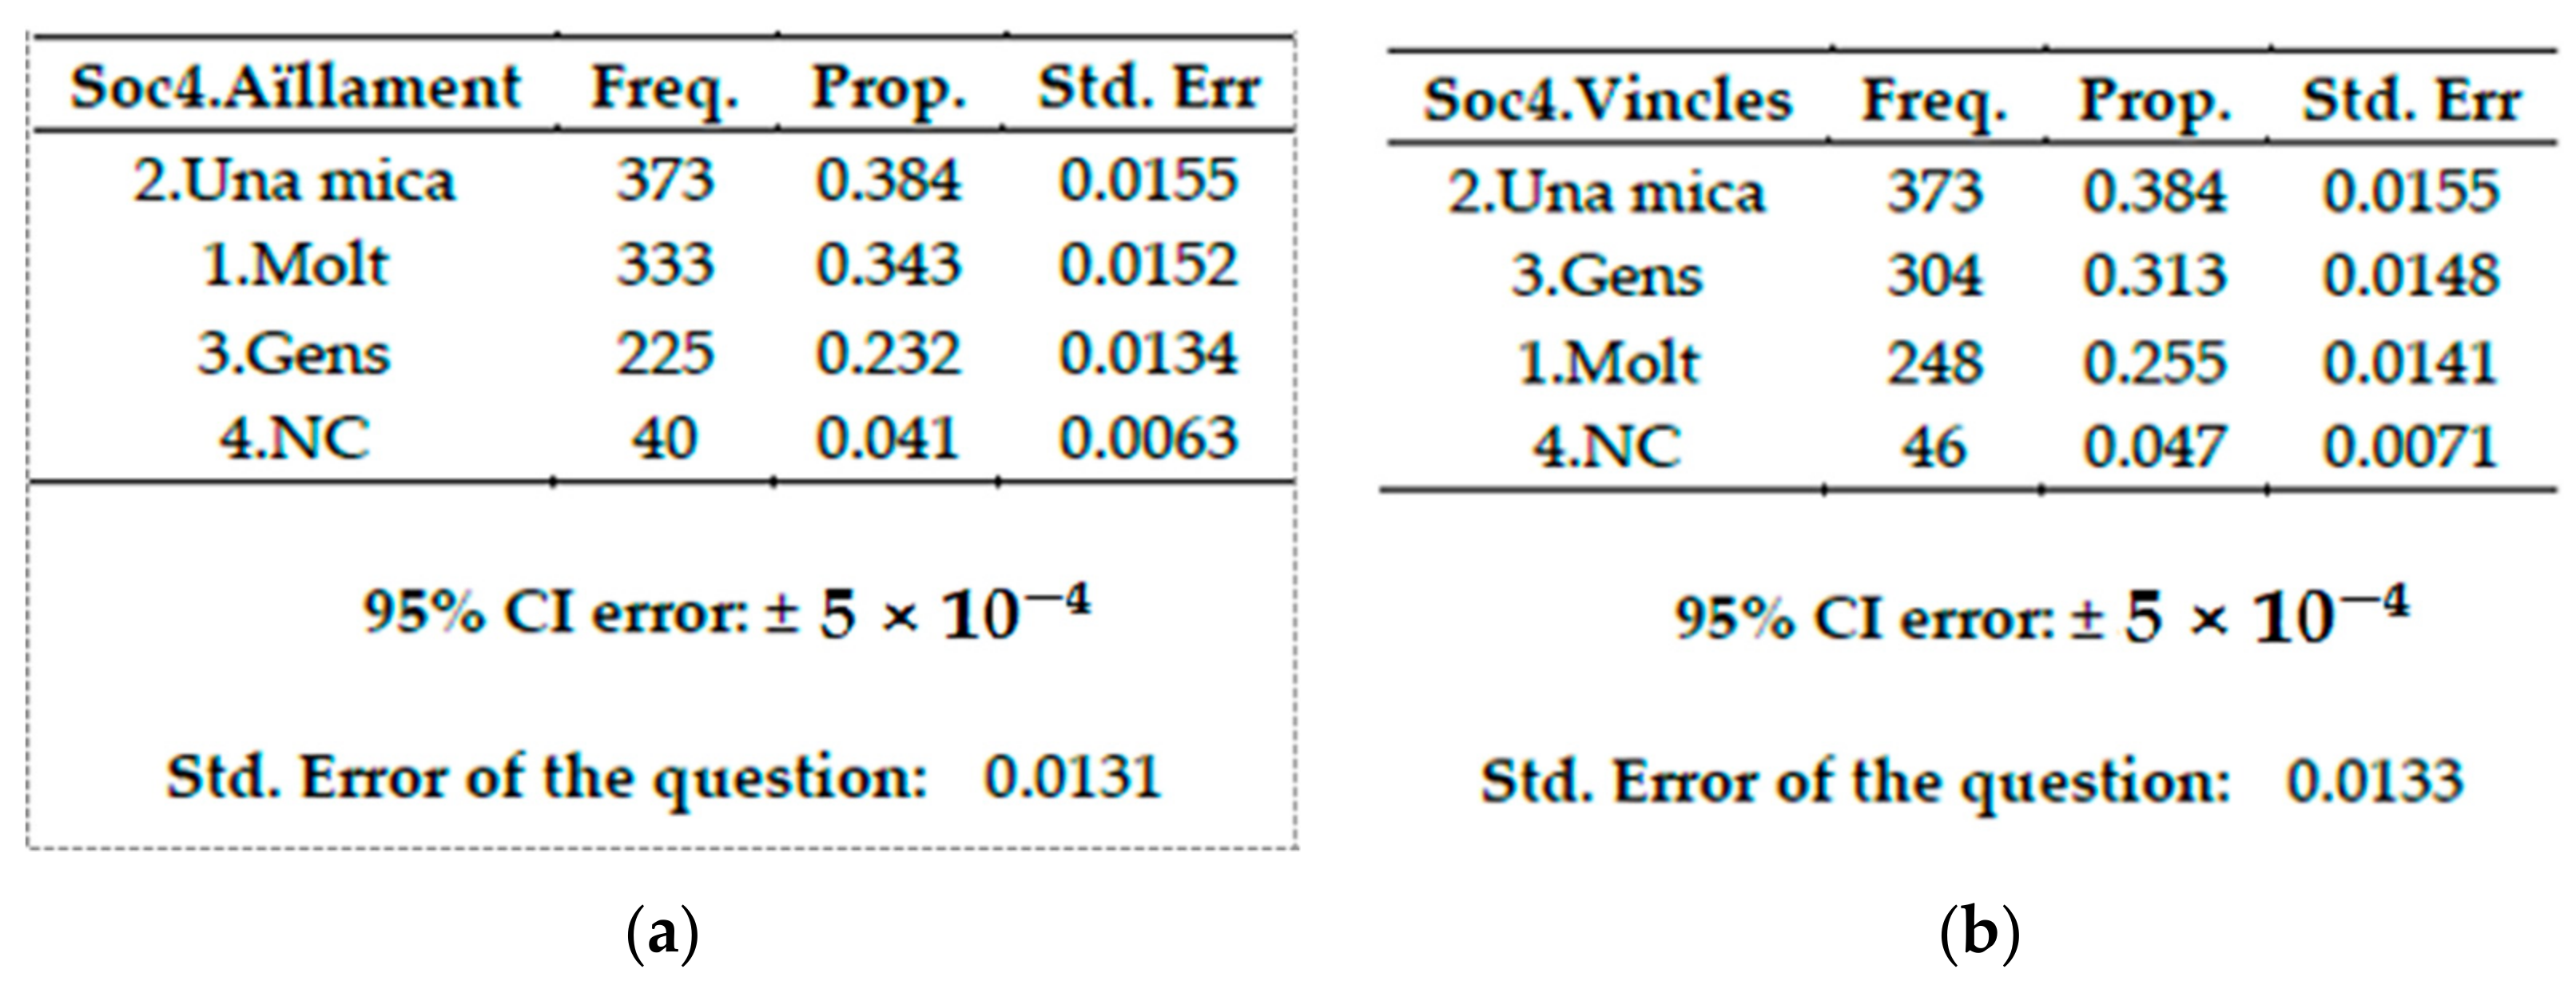
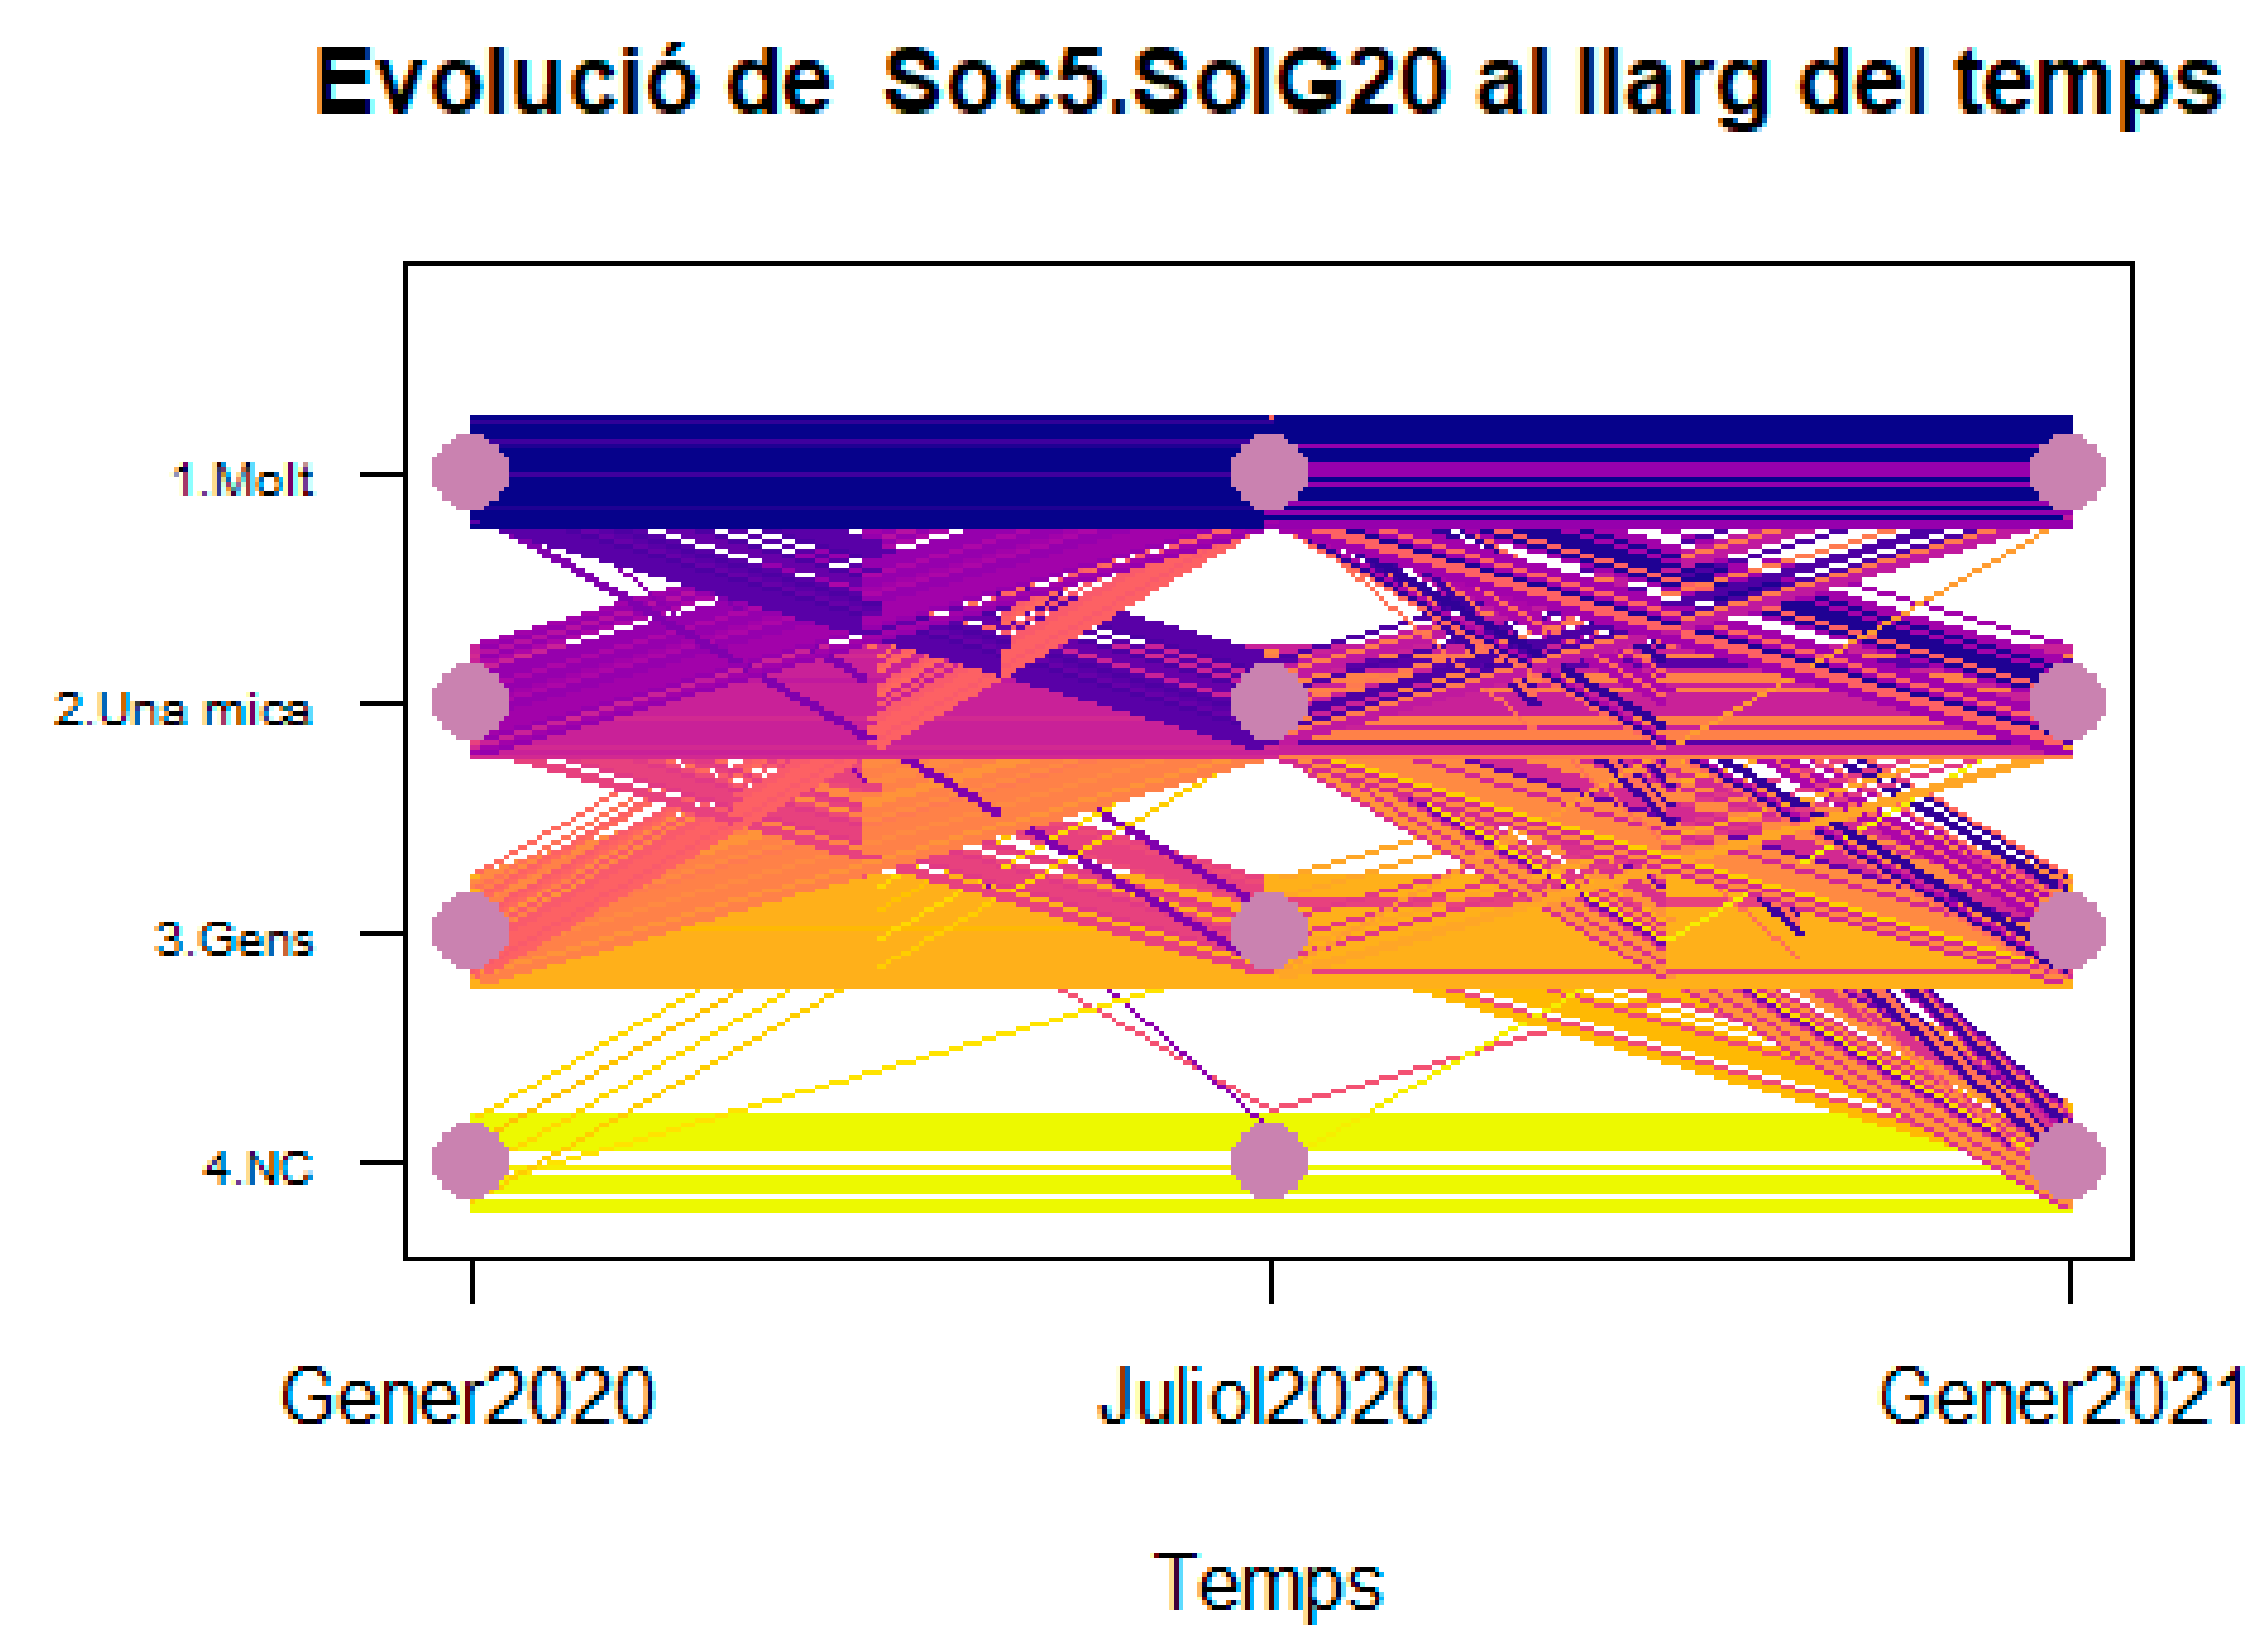
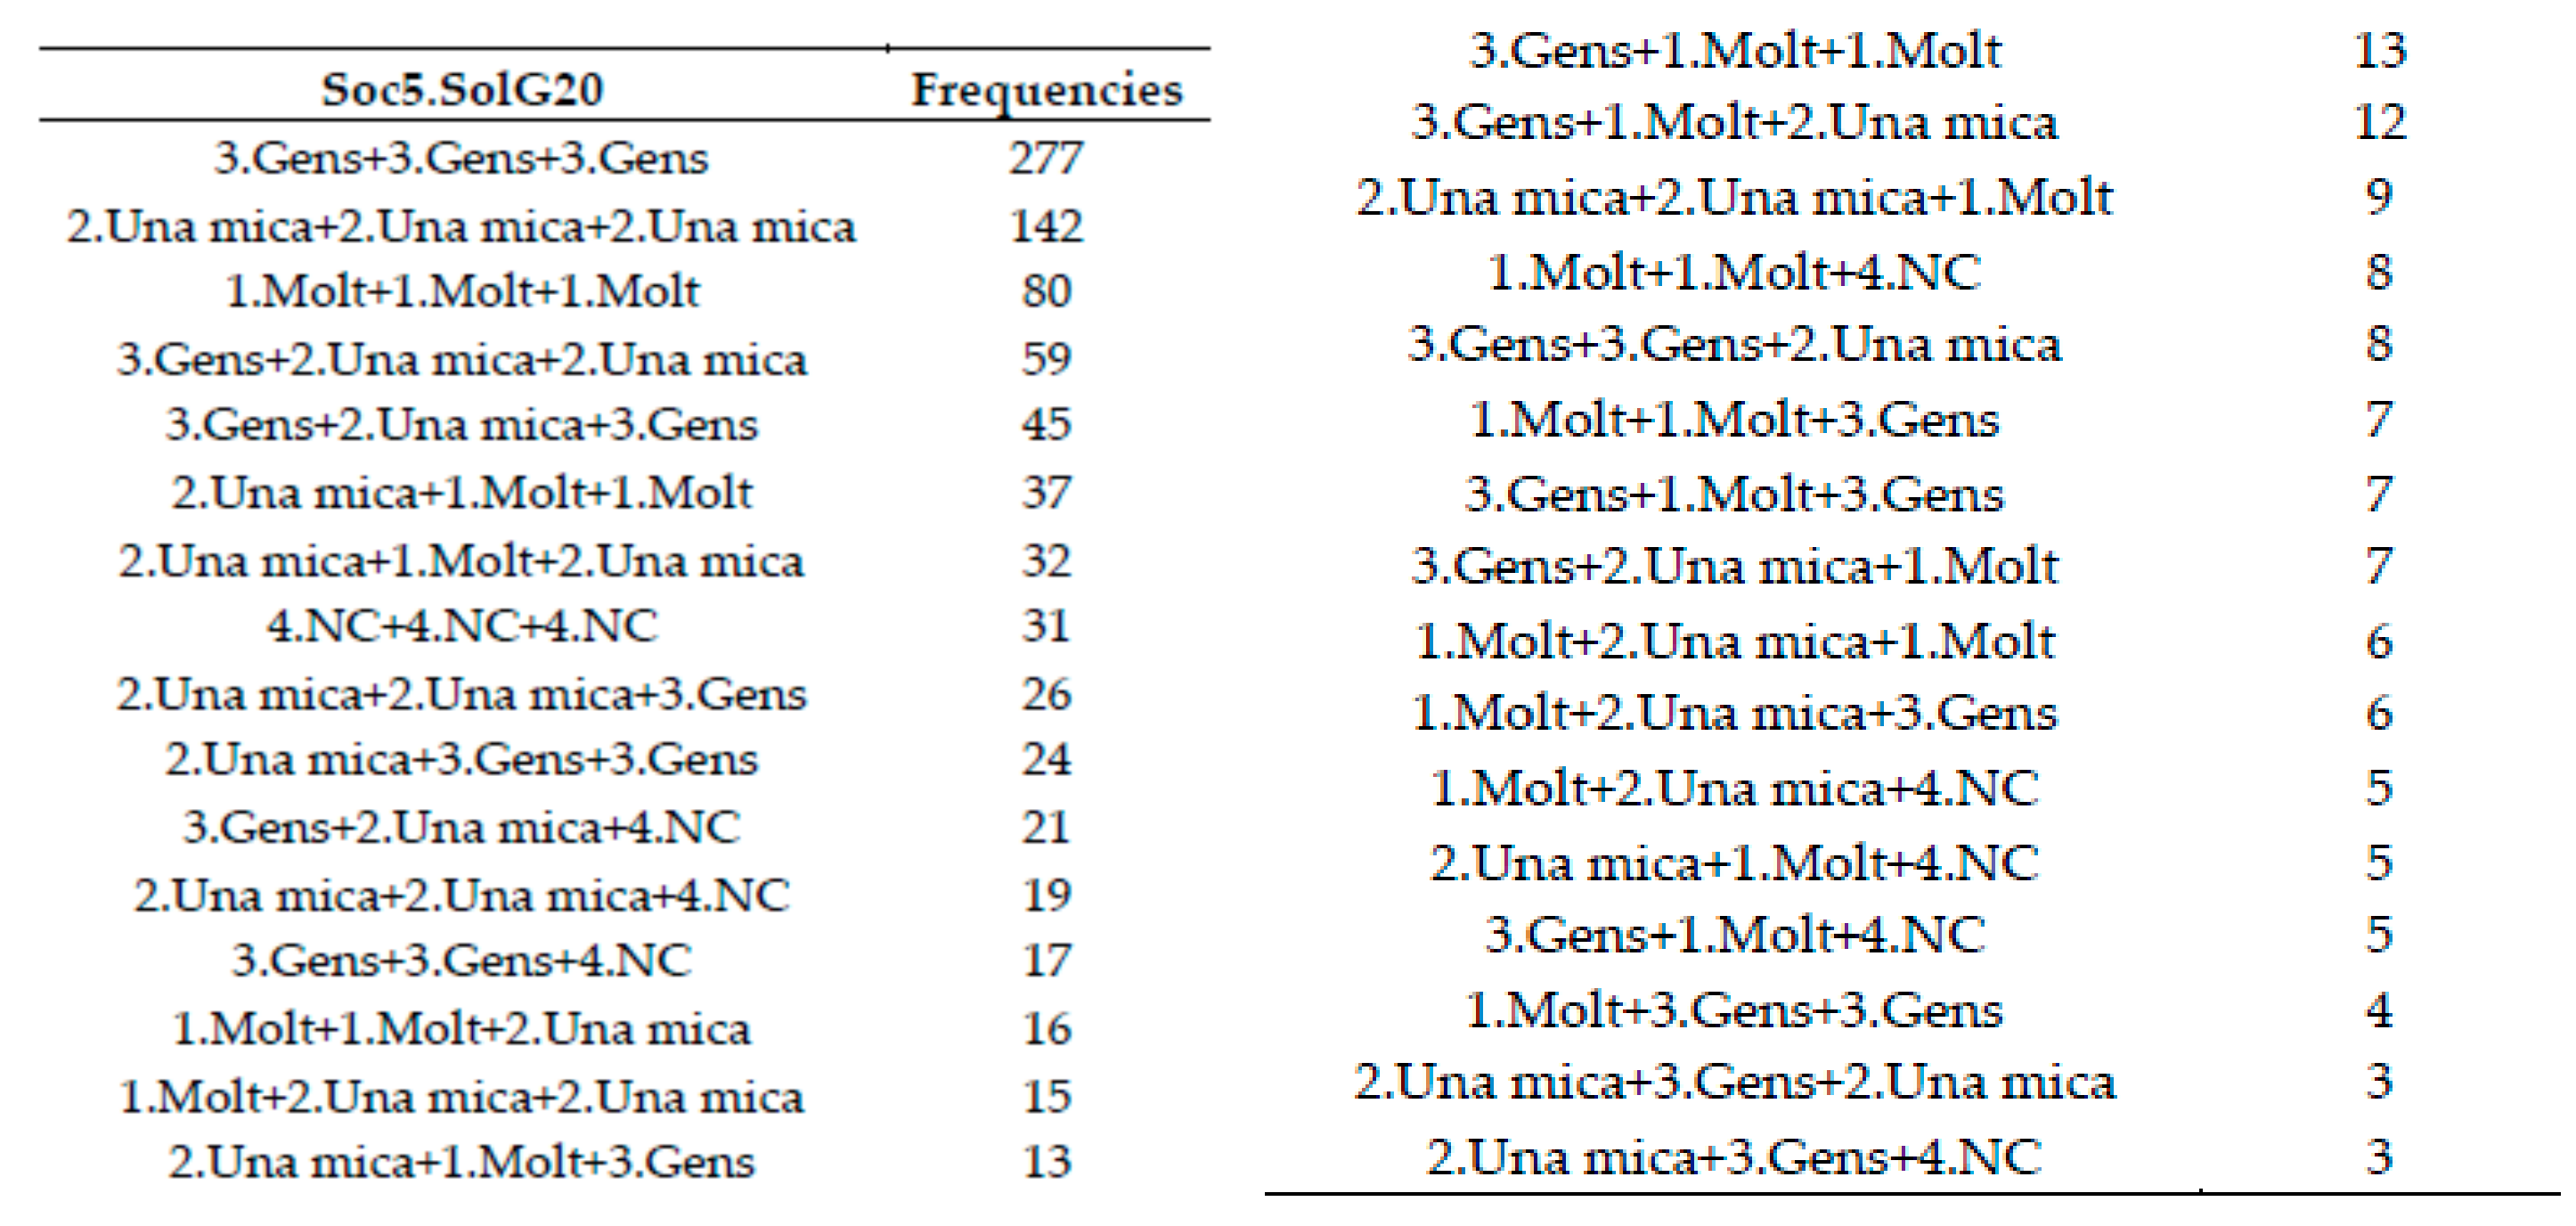
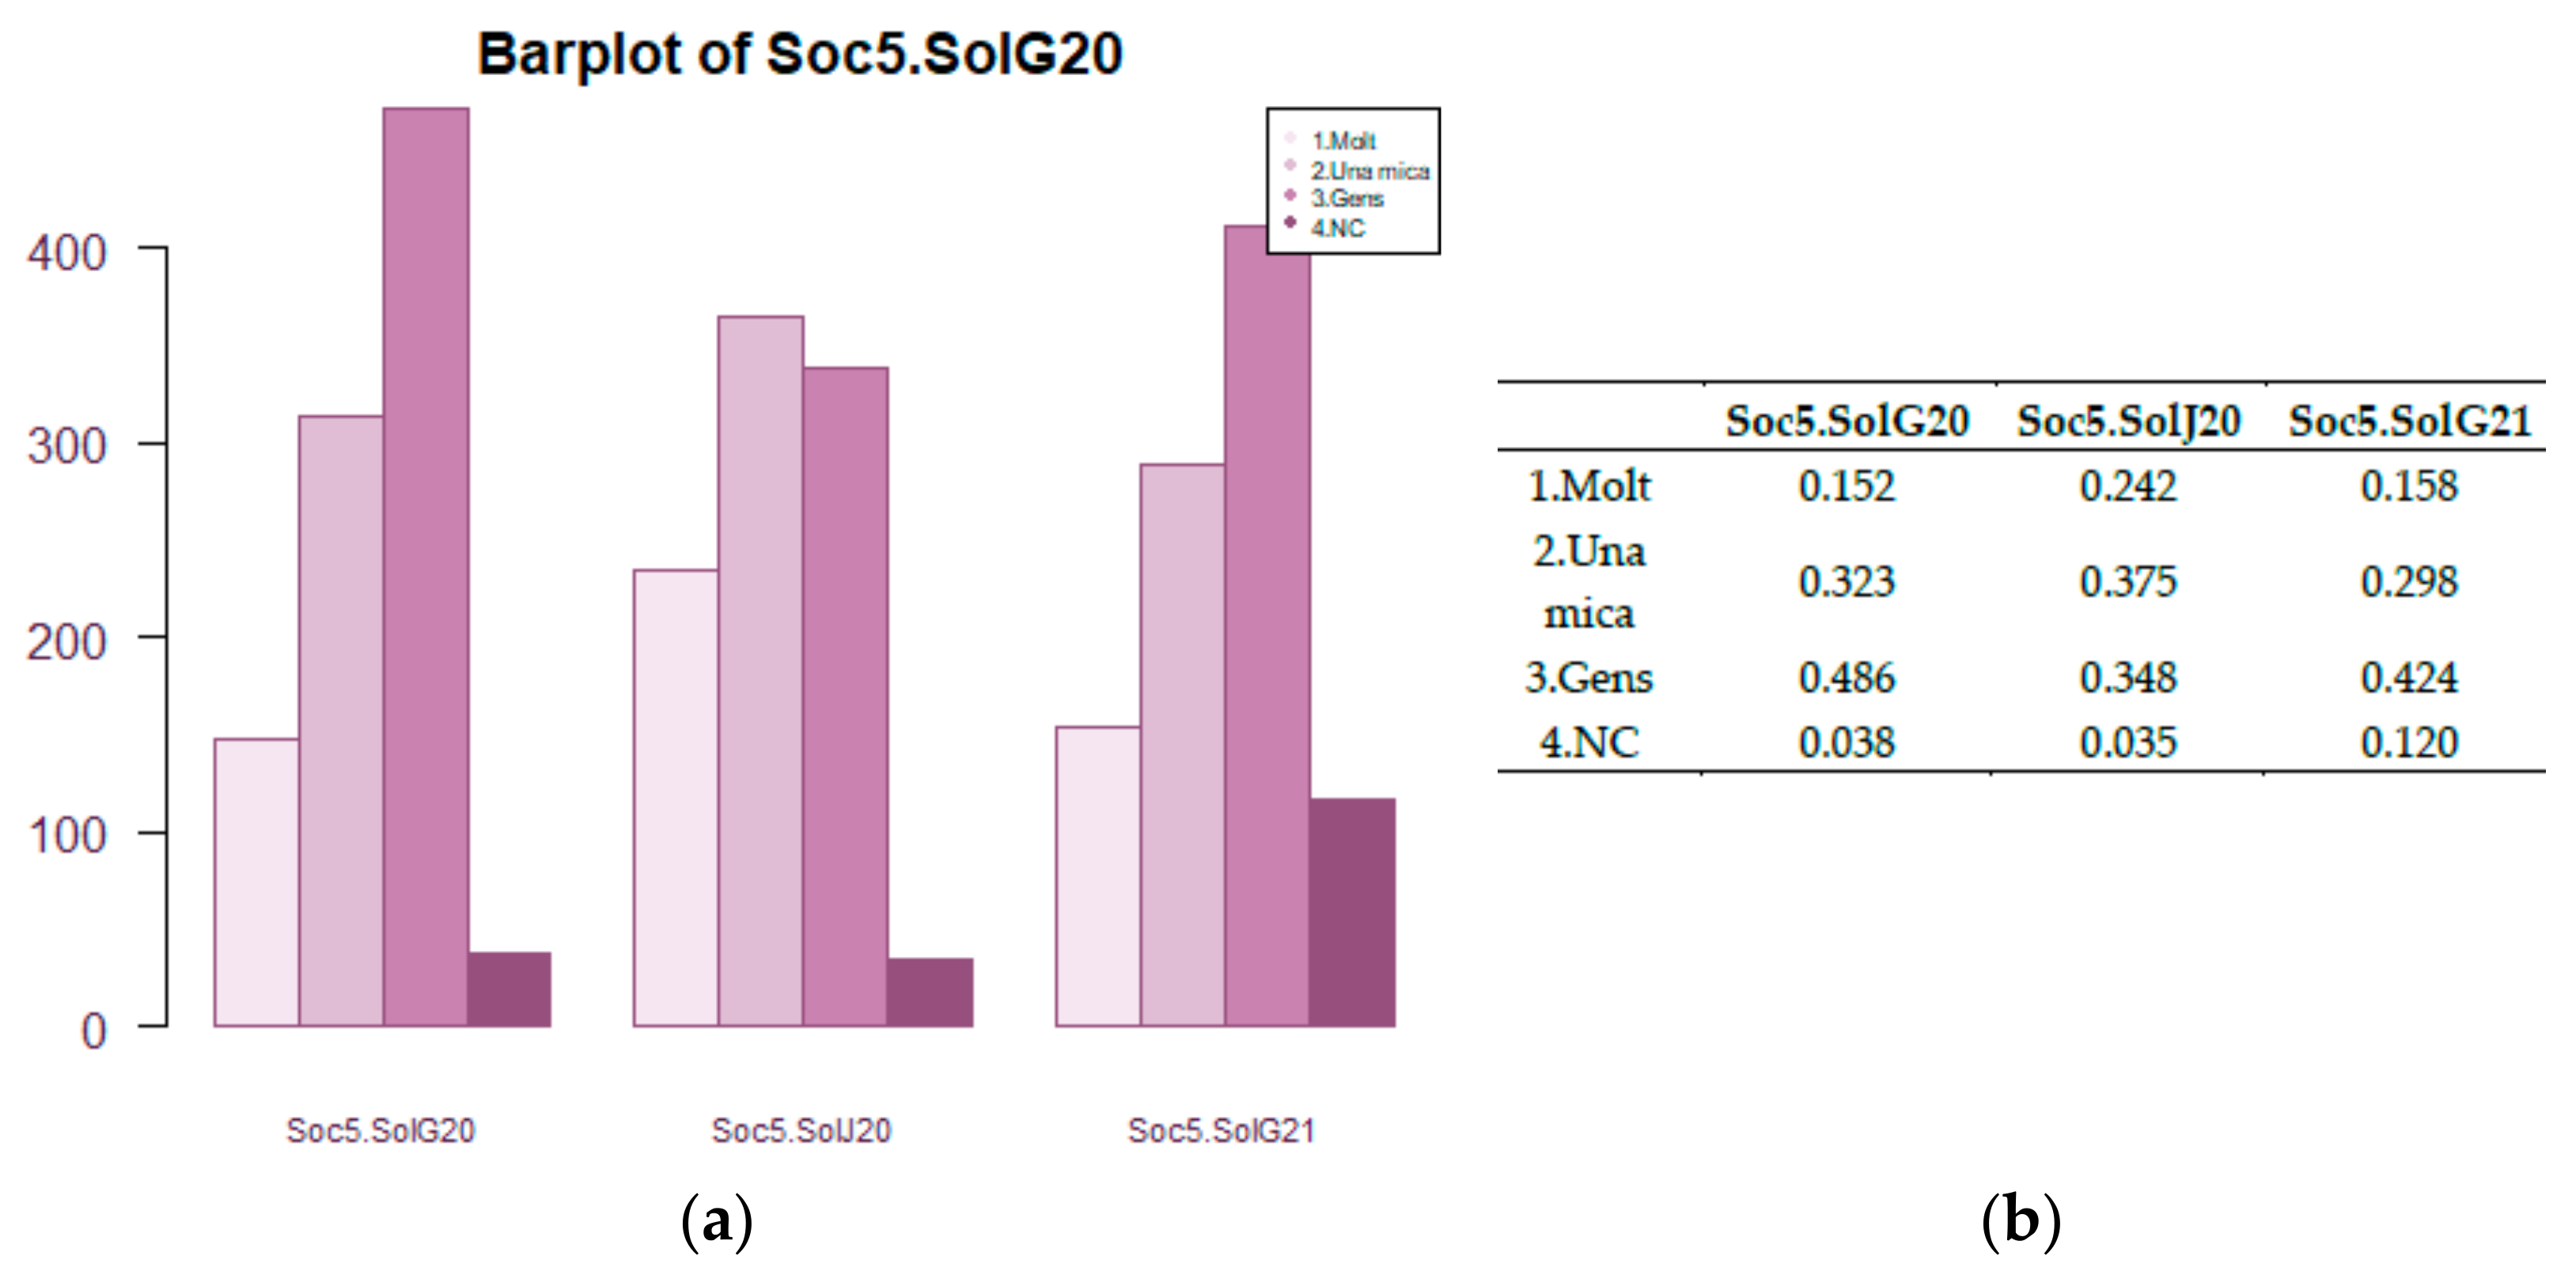
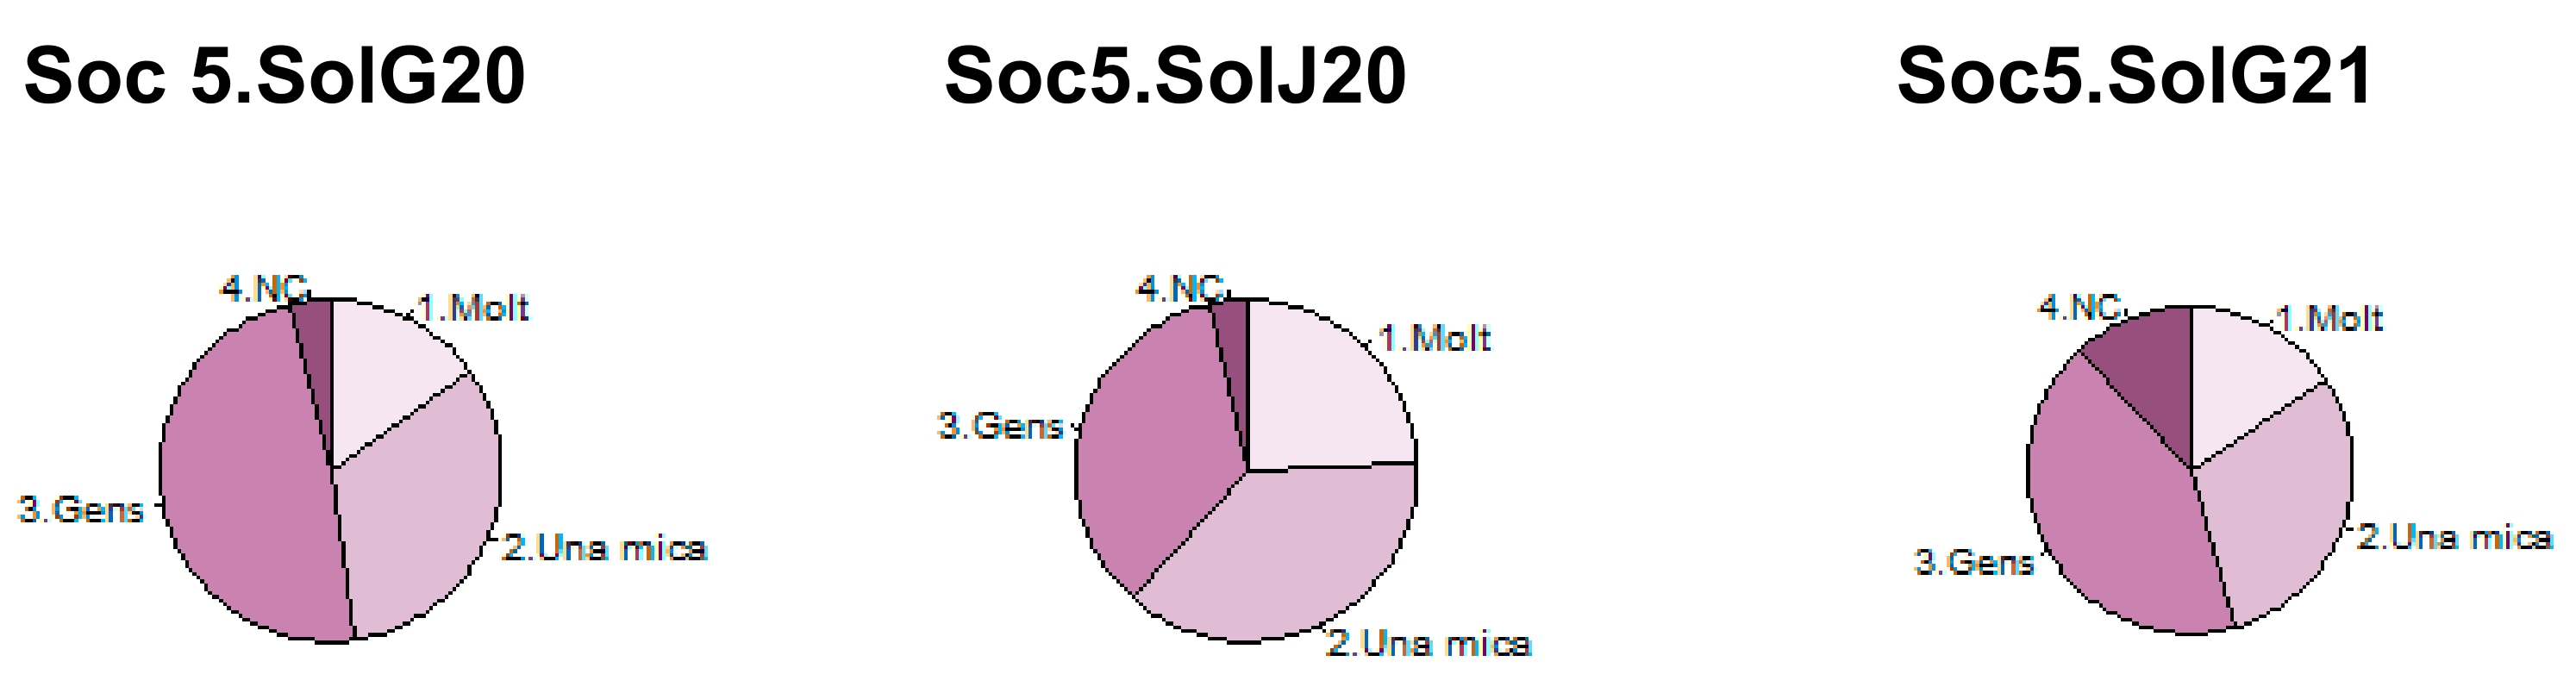
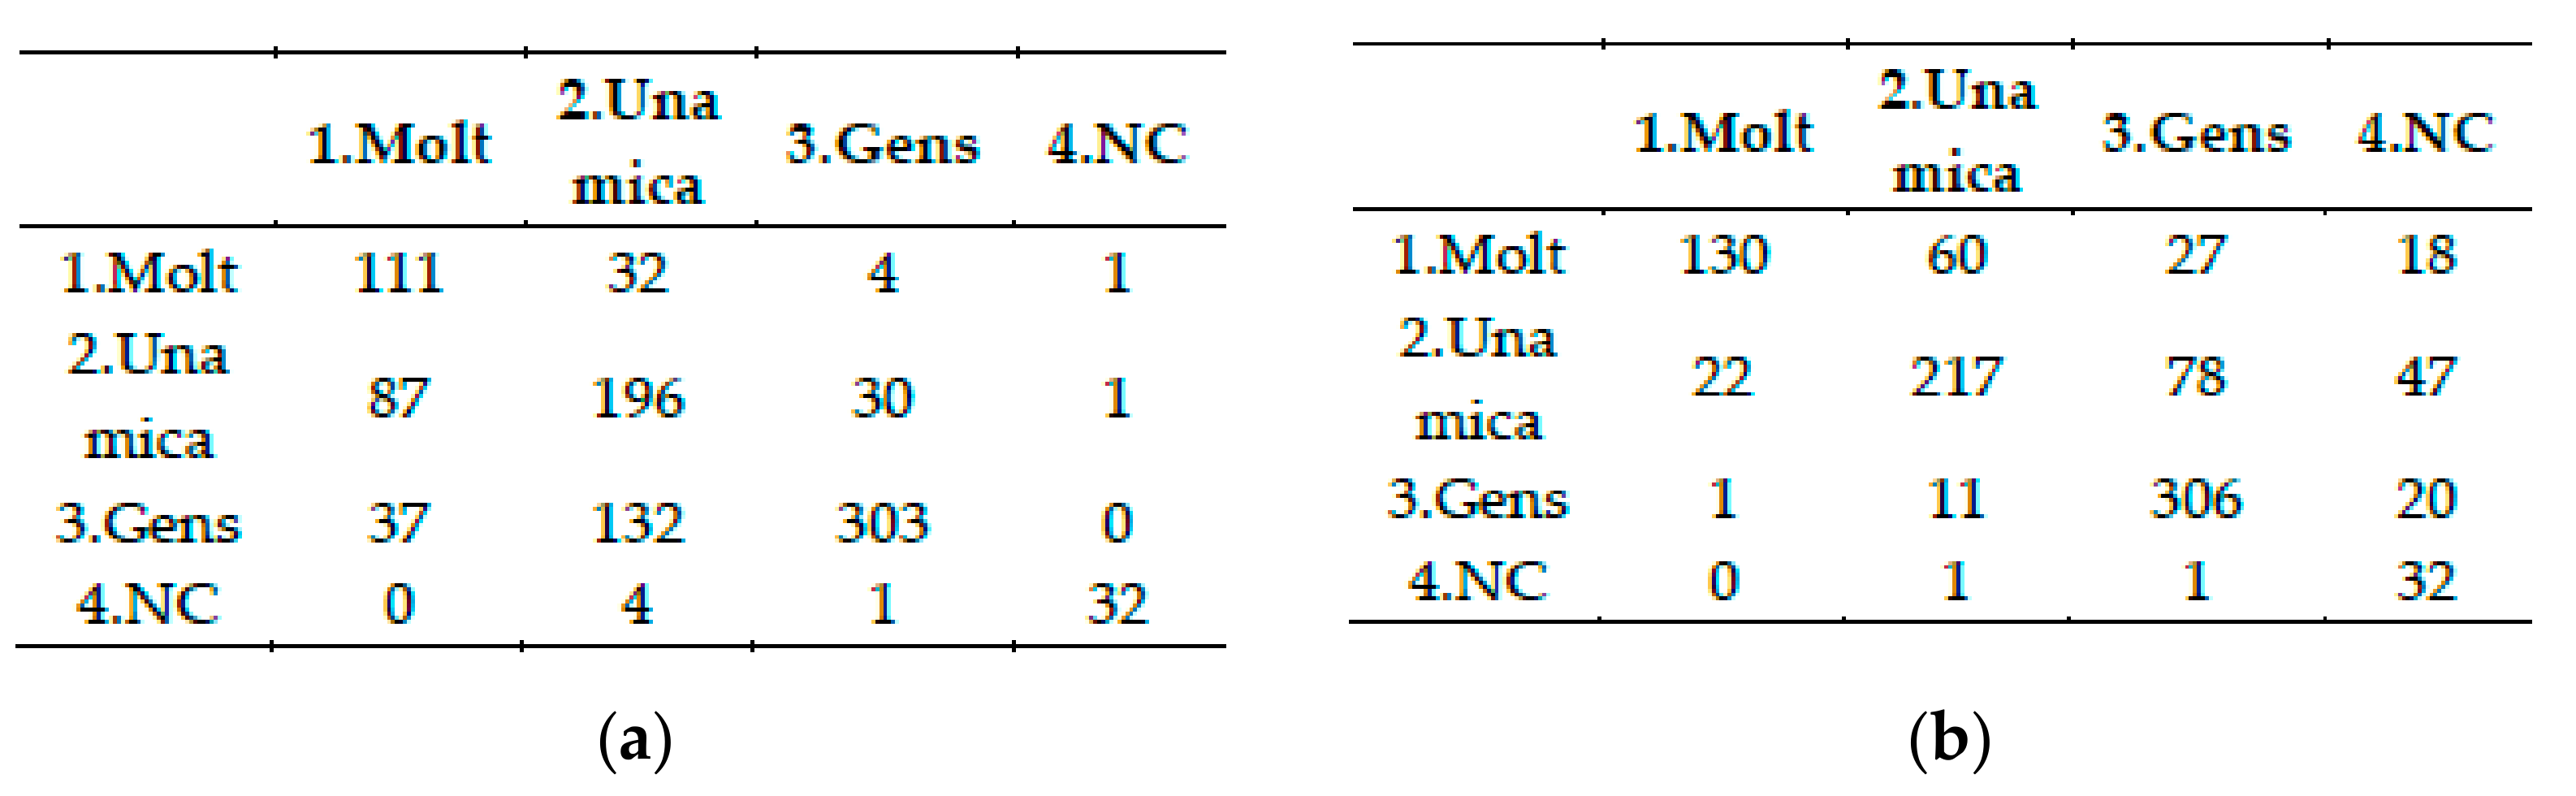
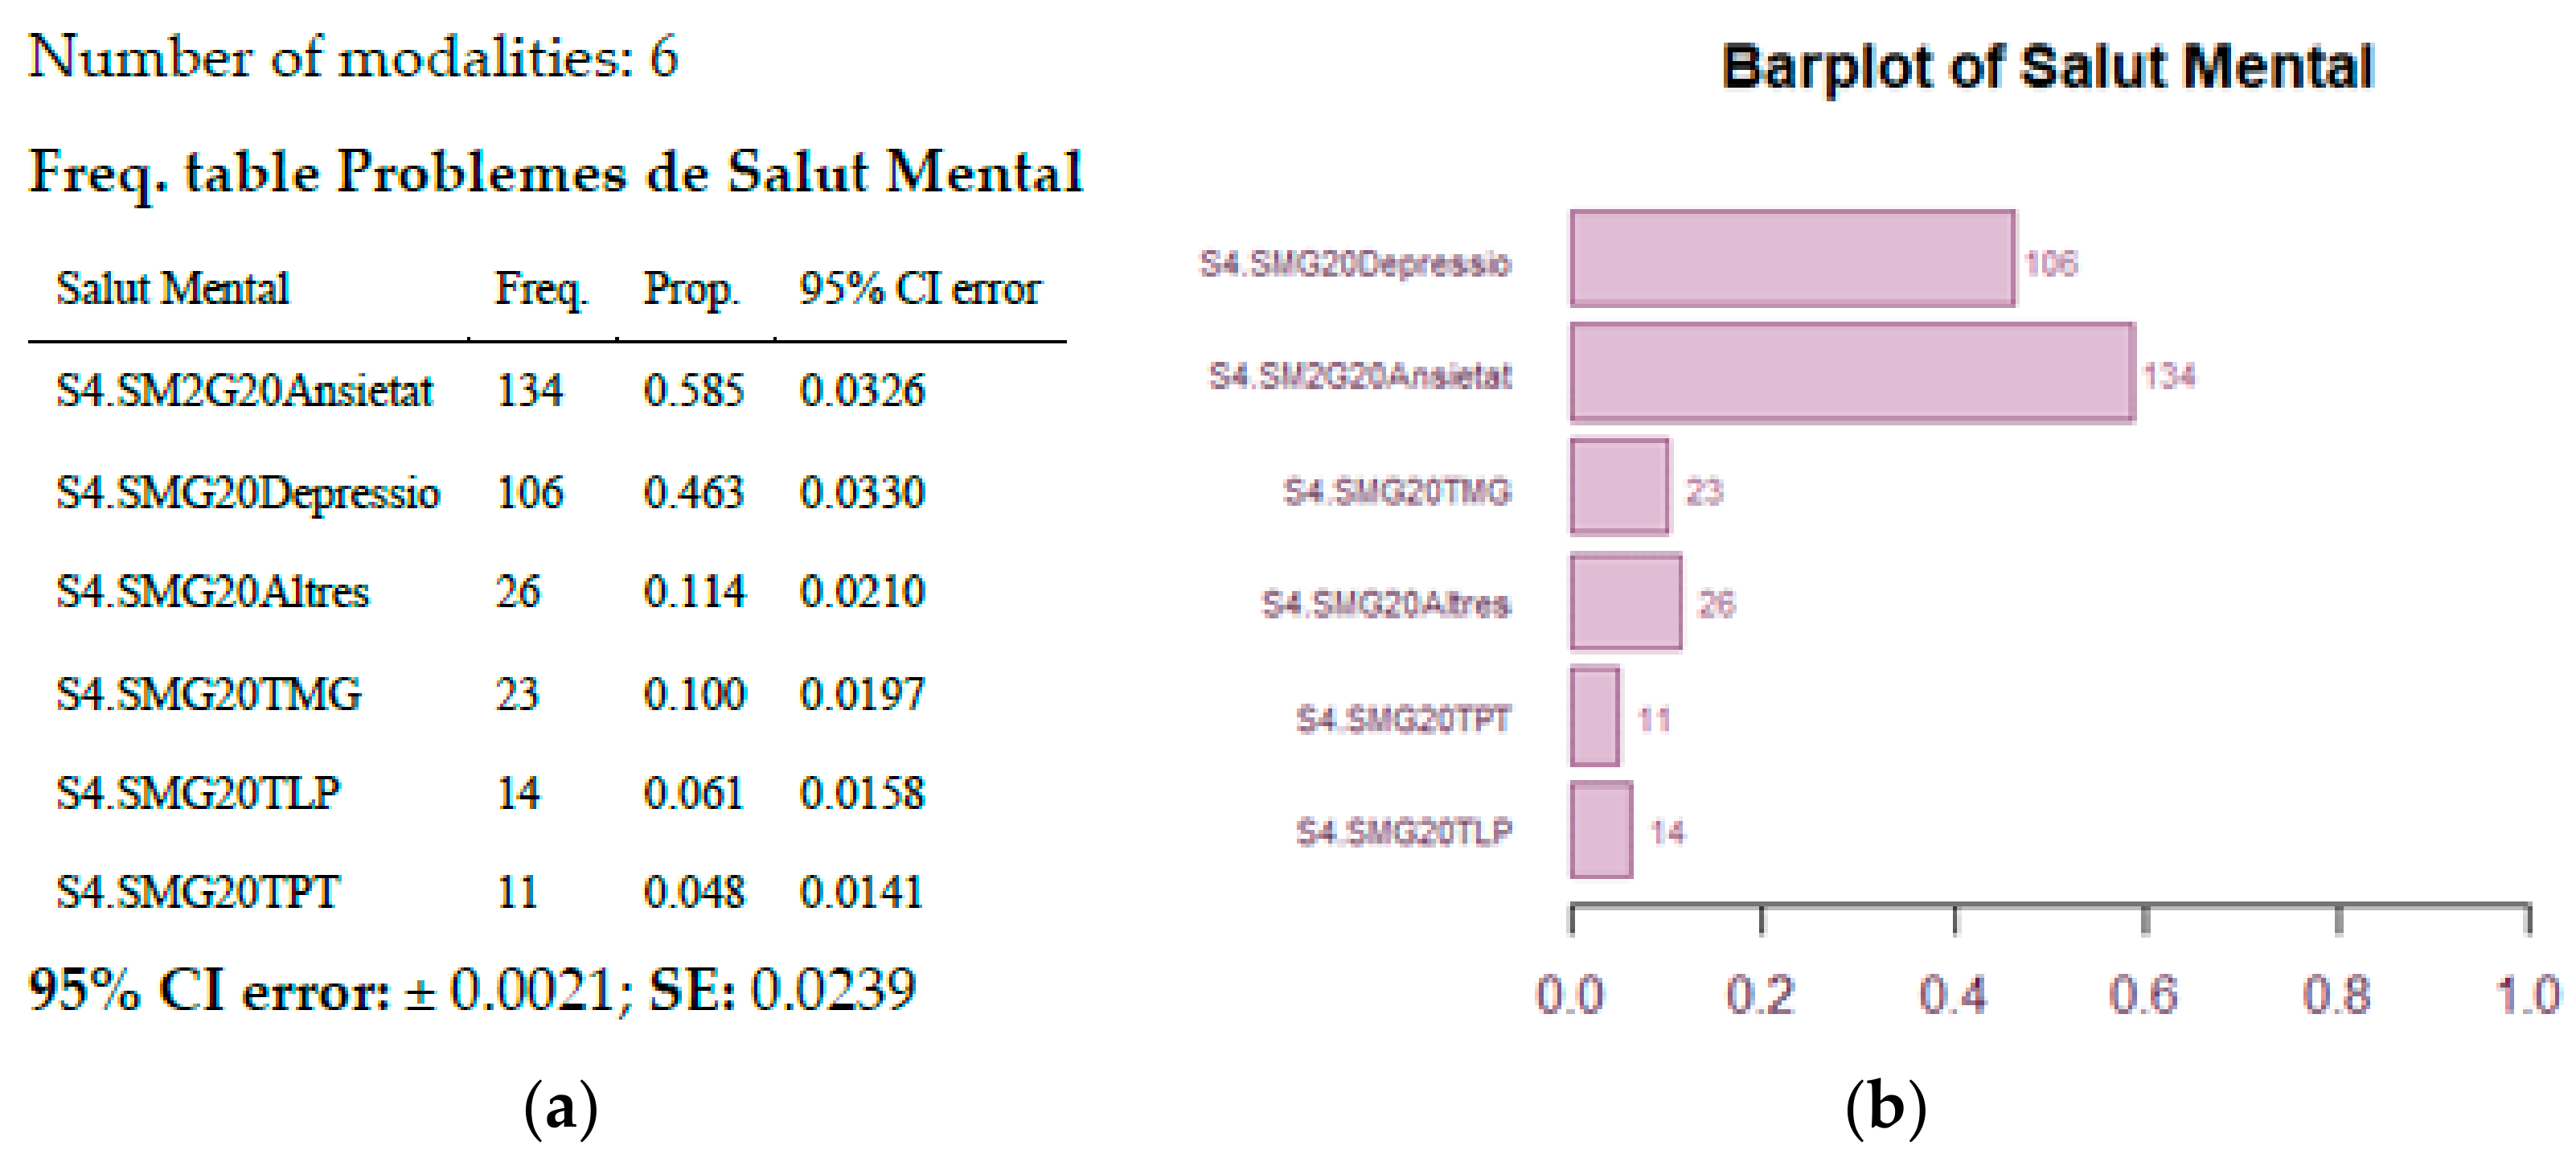
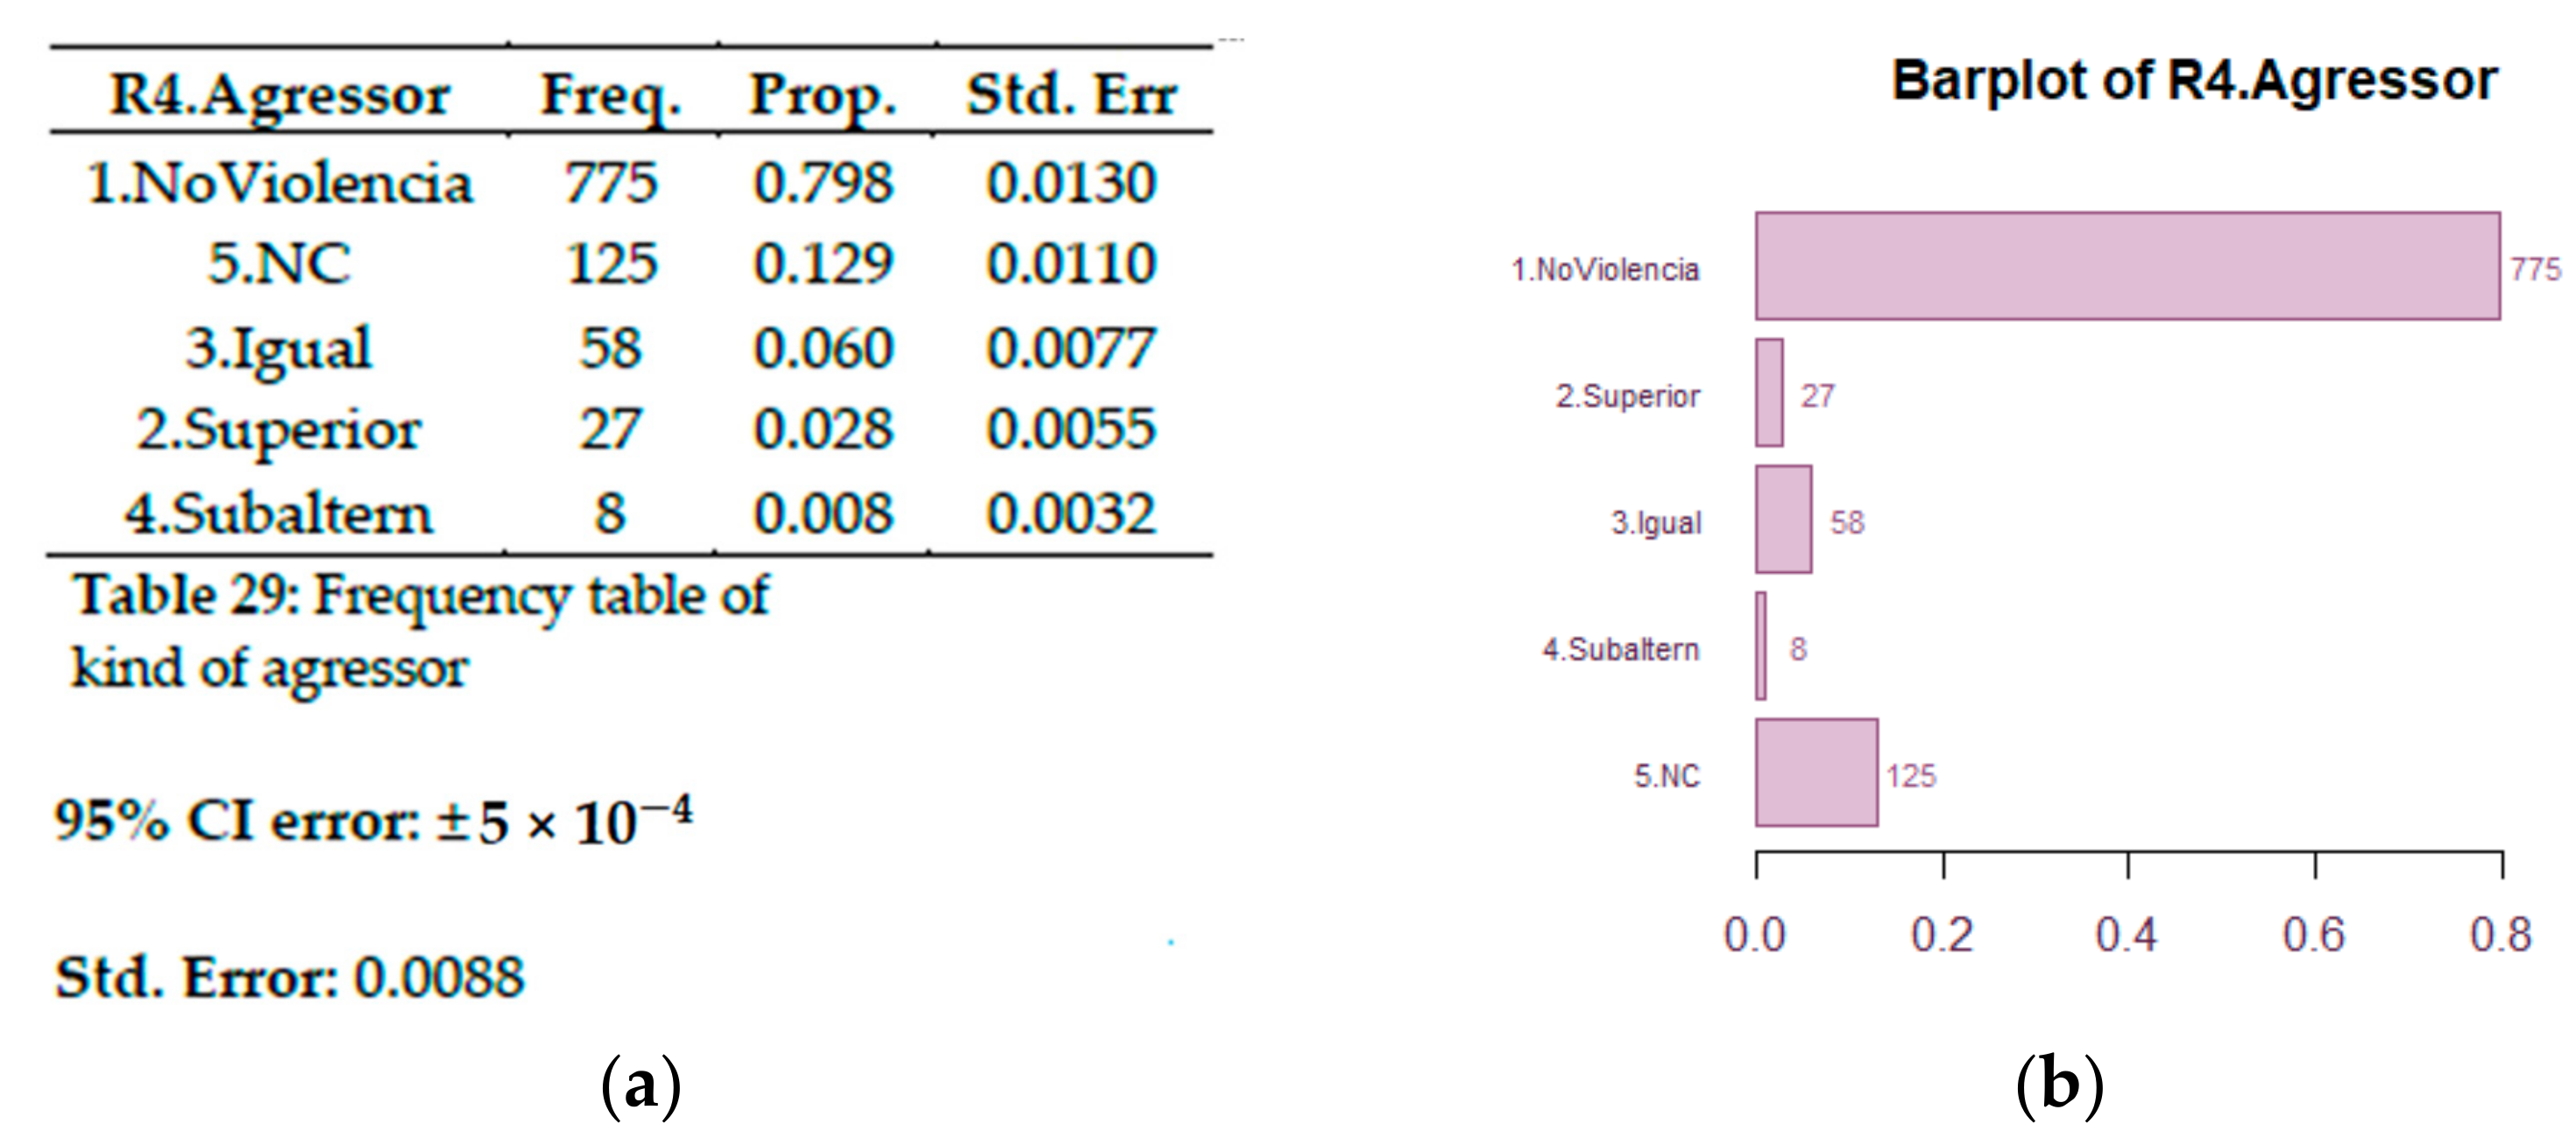
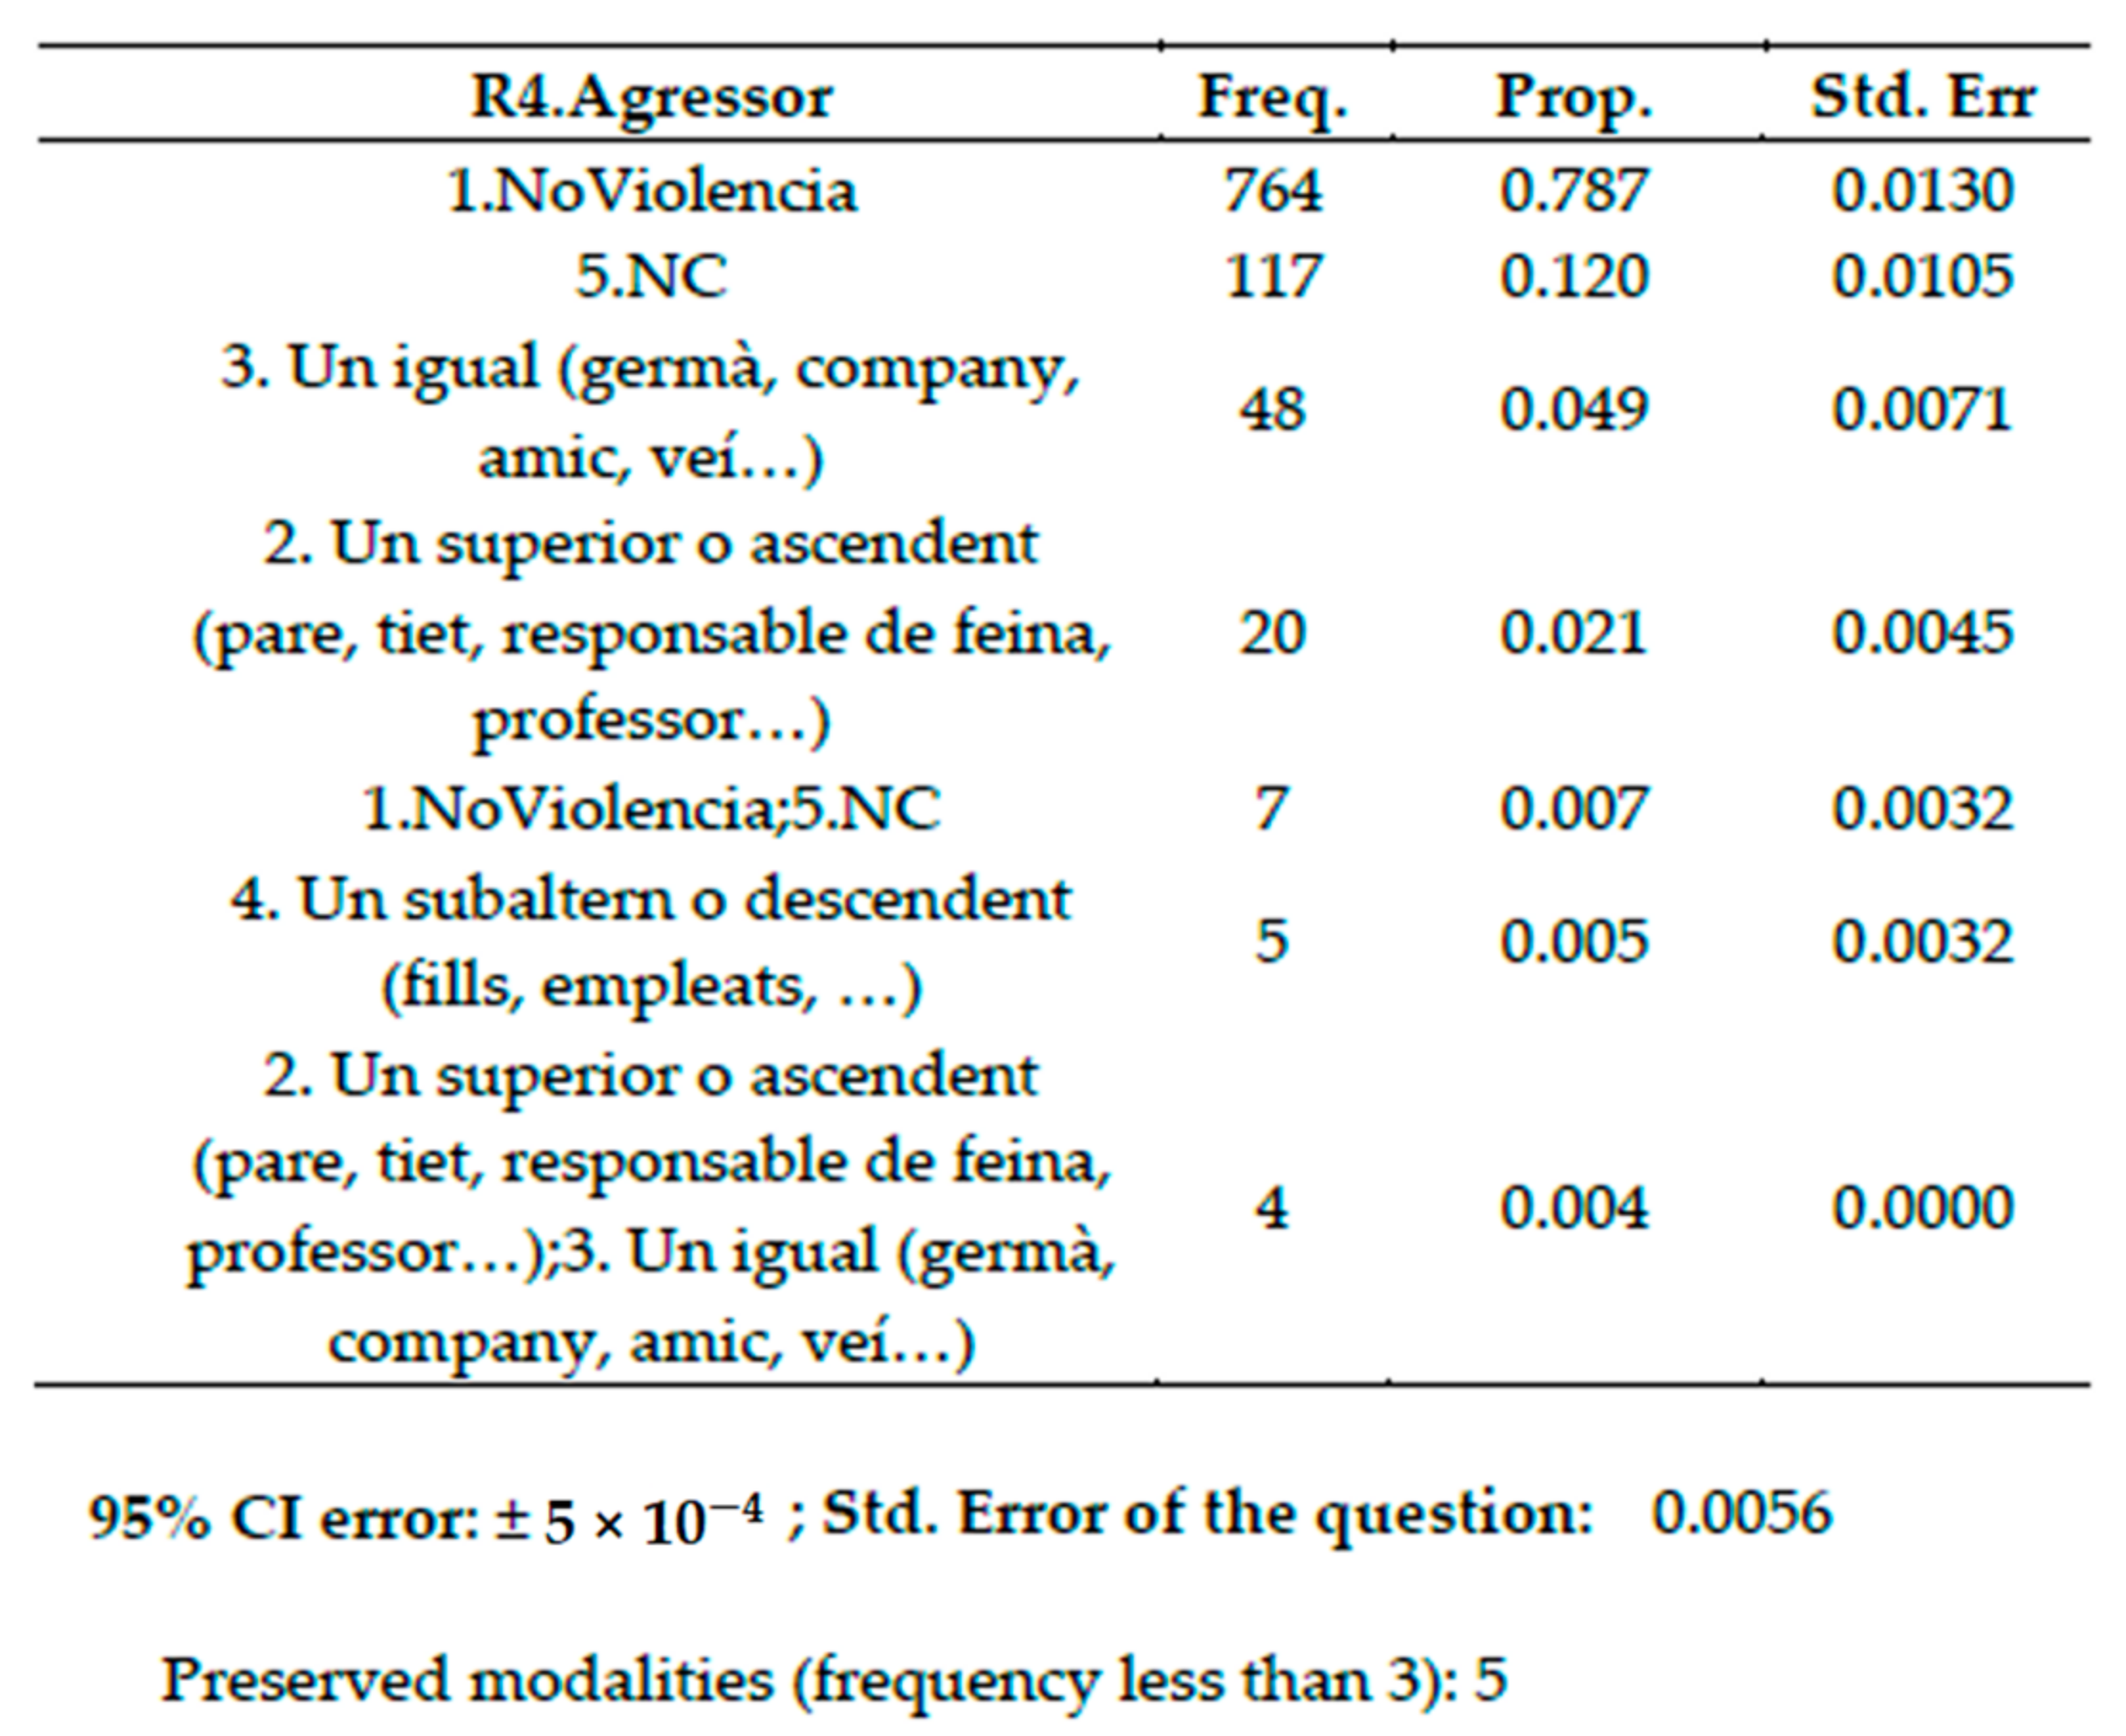
