Abstract
This study aimed to perform an extensive characterization of a 74.75TeO2–0.25V2O5–(25 − x)B2O3-xNd2O3 glass system with (x = 0, 0.5, 1.0, and 1.5 mol%) for radiation shielding properties. Linear and mass attenuation coefficients were determined using Phy-X PSD software and compared with the simulation using Monte Carlo software MCNPX (version 2.7.0). Half value layer, mean free path, tenth value layer, effective atomic number, exposure buildup factor, and energy absorption buildup factors of VTBNd0.0, VTBNd0.5, VTBNd1.0, and VTBNd1.5 glasses were determined, respectively. The results showed that boron (III) oxide and neodymium (III) oxide substitution has an obvious impact on the gamma ray attenuation properties of the studied glasses. It can be concluded that the VTBNd1.5 sample with the highest content of neodymium (III) oxide (1.5 mol%) is the superior sample for shielding of gamma radiation in the investigated energy range.
1. Introduction
The multitude of physical, thermal, optical, and structural properties of glasses make them far better than other goods. They are manufactured easily at different temperatures, which led to the increase in studies where they were used in optoelectronic devices and in other industries. A large number of these experiments are dedicated to glasses comprising rare earth metal oxides [1,2,3]. These low-cost glasses are ideal hosts for rare earth elements and are excellent materials for optoelectronics. Tellurium oxide (TeO2), the source material for tellurite glasses, acts as the network former in the matrix as it is combined with alkali metals, alkaline earth metals, intermediate metals, or other glass formers to form the glass [4]. Tellurium glasses exhibit low melting temperatures, high transmittance, high refractive indices, and chemical and mechanical tolerance.
In comparison, tellurium oxide glasses are equivalent to others in electrical conductivity, and have strong dielectric constants [5,6]. In addition to basic studies in which crystallization of binary and pure tellurite glasses were conducted, there are also important dielectric, structural, and radiation shielding studies reported. People expect glasses that involve transition metal oxides to be semiconducting [7]. In experiments, added metallic oxides produce a promising performance. Adding such insoluble metals to tellurium-based glasses greatly drives the creation of semiconducting materials. Vanadium pentoxide occurs as a glassmaker with semiconducting properties in the glasses, making it a reasonable option for a wide variety of applications [7,8]. It was recently shown that these glasses could have a high degree of radiation protection [9,10,11,12]. Previously, Elmahroug et al. investigated the radiation shielding properties for a Bi2O3–V2O5–TeO2 glass system in the energy range of 0.356–1.33 MeV. Their results showed that increasing Bi2O3 in a V2O5–TeO2 glass system leads to an increment in shielding competencies [13]. In fact, the use of glass materials for radiation shielding is not limited to this type of glass, but the frequency of research has been increasing day by day as a hot subject emphasized in many similar studies in recent years [14,15,16,17,18].
Some of the reasons for this situation are that some traditional materials such as lead and concrete used in radiation fields do not have superior material properties and have some characteristics that threaten health. Of course, although this does not show that they are an inadequate radiation shielding material, some international institutions and organizations have direct incentives for researchers to study new generation shielding materials that can be an alternative to these materials with their eco-friendly and promising properties. In this case, glasses can be considered as a strong candidate for these types of utilizations. In this study, a group of glasses encoded VTBNd0.0, VTBNd0.5, VTBNd1.0, and VTBNd1.5 based on a TeO2–V2O5–(B2O3/Nd2O3) glass composition were extensively investigated in terms of their gamma and neutron radiation attenuation competencies [1]. To the best of our knowledge, no extensive gamma-ray shielding characterization has been done using advanced simulation methods and numerical comparison TeO2–V2O5–(B2O3/Nd2O3). Therefore, this study aimed to perform a detailed characterization on the aforementioned glass composition, which could be very useful to understand the competencies of studied glass samples in medical and industrial radiation facilities. Moreover, this study aimed to discuss the potential effects of B2O3/Nd2O3 substitution on nuclear radiation shielding properties. Therefore, another important point to highlight is the concept of investigation that additive replacement effects will be evaluated with details. Some of the investigated parameters can be listed as linear attenuation coefficients (LAC), mass attenuation coefficients (MAC), Effective electron density (Neff), Half value layer (T1/2), Exposure buildup factor (EBF) and energy absorption buildup factor (EABF), tenth value layer (TVL), mean free path (λ), and effective atomic number (Zeff). The obtained outcomes from the current investigation would be useful to understand the direct impact of the glass structure and density as well as the replacement type on radiation shielding properties of a TeO2–V2O5–(B2O3/Nd2O3) system.
2. Materials and Methods
2.1. Simulation Studies for Gamma-ray Transmission
Mass attenuation coefficients (MAC) of the 74.75TeO2–0.25V2O5–(25 − x)B2O3–xNd2O3 (x = 0, 0.5, 1, 1.5 mol%) glass system were determined using Phy-X PSD [19] code and MCNPX [20,21,22] Monte Carlo code. Tellur-based glasses usually start to deteriorate and burn at high temperatures (about 900 °C) and accordingly they become a blackish color. The synthesis temperature rises when Nd2O3 rises above certain ratios. Therefore, the Nd2O3 reinforcement amount is kept at low rates so as not to exceed high temperatures. The main priority was a consideration of their elemental mass fractions (wt%) and material densities (see Table 1). The results of MAC determination obtained from Phy-X PSD and MCNPX can be seen in Table 2. Overall, average MAC values were obtained in a clear pattern and consensus. However, different smooth findings were recorded between the Phy-X-PSD code and the MCNPX Monte Carlo code. This situation can be clarified by the kinds of processes and physics lists MCNP uses in Monte Carlo simulation and random event generator for a process of radiation transport, while Phy-X PSD is a mechanism that uses statistical equations for direct determination of MAC values. Moreover, its worth mentioning that MAC values used in Phy-X PSD calculations are taken from the NIST (National Institute of Standard and Technology) database. There is no direct outcome to record MAC values in MCNPX code, but another sub-calculation is done through analysis of the output file. Monte Carlo simulations were generated by incorporating the main details, including input files, cell cards, and source information. Glass samples were determined ın terms of their elemental mass percentage, material density, and geometric shape. In respect to radiation interaction, we must discuss the concerns of shielding and nuclear protection. Data on the simulation must be detailed in a systematic graph. The expertise required to describe physical quantities and identify the specific input point. The arrangement of the gamma-ray emitting systems can be seen in Figure 1. In this measurement, the accurate F4 Tally mesh was used. This approach allows for the analysis of the average photon flux in a cell. Moreover, a point isotropic source was defined as a gamma-ray emitter. Mass attenuation coefficients of studied glasses were determined in few stages such as definition of gamma-ray transmission setup, simulation run, and analysing of outcome file. The gamma-ray transmission setup was designed considering the experimental conditions, where the terms of collimation and Pb shields are important. The 3-D view of gamma-ray transmission setup was checked using MCNPX visual editor. Initial checks showed that this model does not have any geometric errors or design problems. The simulation run was repeated for every single glass sample at different gamma-ray energies. Finally, a detailed analysis was performed in output file. To measure the attenuation coefficient, promary and secondary gamma-ray fluxes were exported from the output file.

Table 1.
Chemical compositions and density for glass samples.

Table 2.
Mass attenuation coefficients (MAC) of studied glass samples obtained from MCNPX code and Phy-X PSD program.
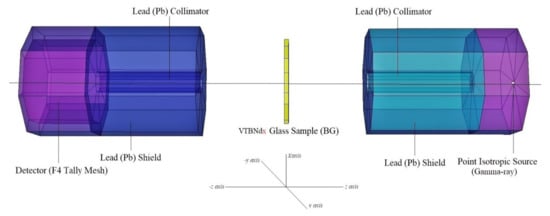
Figure 1.
MCNPX simulation setup for gamma-ray transmission studies (MCNPX Visual Editor).
2.2. Shielding Parameters
If the attenuator is located between the detector and the source, the amplitude of the primary gamma-ray decreases exponentially according to the Beer-Lambert law [23,24]:
Io is the intensity of primary gamma, while I is the intensity of transmitted gamma through the glass. In addition, μ indicates the linear attenuation coefficient of the energy of interest. The definition of x is the attenuator thickness. When it comes to a compound, the mass attenuation coefficients are calculated as [25,26]:
The term wi represents weight fraction of the ith constitute elements.
The total effective atomic cross-section was determined by taking into account the effective atomic number, effective electron density depending on the total molecular cross-section (σt), and the total electronic cross-section (σa) [27,28,29].
The used parameters are as follow:
- ni: number of atoms
- Ai: atomic weight
- Zi: atomic number
- fi: fractional abundance of ith element
- NA: Avogadro number
A certain attenuator thickness will decrease the absorbed gamma strength by a factor of two; this is called the half-value layer, and it is a function of distance from the source [9,30]:
The term one mean free path (MFP) describes an absorption of 0.368 of the initial gamma radiation [31,32]:
As a vital gamma ray shielding parameters exposure buildup factor (EBF), energy absorption buildup factor (EABF) is also a remarkable shielding parameter to obtain total contributions to gamma attenuation rays in a material environment. Currently, exposure buildup factor (EBF) and energy absorption buildup factor (EABF) parameters were also calculated using the Geometry-Progressive (G-P) fitting method. A thorough explanation of the above mechanism can be found in our previous reports.
3. Results
In this study, four different glass samples encoded VTBNd0.0, VTBNd0.5, VTBNd1.0, and VTBNd1.5 based on 74.75TeO2–0.25V2O5–(25 − x)B2O3–xNd2O3 (x = 0, 0.5, 1, 1.5 mol%) systems were tested for their feasibility for nuclear radiation shielding utilizations. The experiments on optical and structural properties were widely reported, which included alloys of different composition. In a previous paper, Kilic [1] discussed the effect of B2O3 and Nd2O3 substitution on the optical, structural, and thermal properties of these glass samples. He discovered a personal association between Nd2O3 reinforcement and the optical properties and thermal and structural properties of 74.75TeO2–0.25V2O5–(25 − x)B2O3–xNd2O3 (x = 0, 0.5, 1, 1.5 mol%) oxide glasses. To fulfil the demands of IAEA and WHO organizations, the importance of alternative shielding materials is rising. This study attempted to investigate the connection between the intriguing results in the Nd2O3 reinforced oxide glasses and their nuclear radiation shielding properties. A first move was made in evaluating availability concentrations for alloys in a 0.015–15 MeV range, using a general-purpose Monte Carlo method and Phy-X software. The selected energy range is a standard energy range of theoretical gamma ray shielding calculations, where the critical behaviors at the low, middle, and high energy region depending on dominant interaction processes such as photoelectric effect, Compton scattering, and pair production can be observed. The word ‘LAC’ (µ) is used to measure the shielding efficacy of glass samples. Density relies on the effectiveness of shielding compounds and the energy of the gamma rays. Figure 2 shows the interaction between the photon energy of VTBNd0.0, VTBNd0.5, VTBNd1.0, and VTBNd1.5 samples. In Figure 2, the energy zone’s effect on the variance of the LAC value was affected by the photoelectric effect, Compton scattering, and pair production mechanisms. This result occurs due to the nature of radiation’s interaction with matter. At low energies, the LAC value is decreased because of photo adsorption. In the mid-energy region, Compton scattering was the dominant interaction in the measurement pattern. However, the highest LAC amount was calculated in the VTBNd1.5 sample, which has the highest concentration of Nd2O3. The mass attenuation coefficient (MAC) of the specified substance is density-independent and unique.
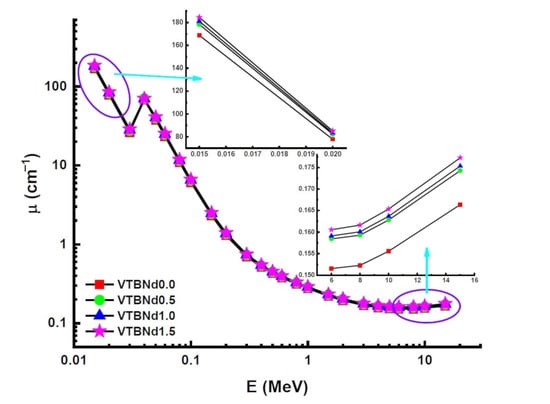
Figure 2.
Variation of linear attenuation coefficient (µm) against photon energy for all glasses.
Figure 3 displays the variation of obtained MAC values against photon energy (E). A variety of gamma-ray radiation and chemical compositions of attenuator glass have changed the rate of difference of MAC values. The landscape of the MAC data reveals noticeable trends in distinct areas. In the low energy area where the photoelectric effect determines how much gamma ray is absorbed, the absorption decreased significantly. Compton scattering dominance showed statistically substantial declines from MAC values. It appears that the VTBNd1.5 sample has higher MAC values at all incident photon energies. In particular, the findings for VTBNd0.0, VTBNd0.5, VTBNd1.0, and VTBNd1.5 samples were reported as 0.4926, 0.4977, 0.5027, and 0.5075 at 0.15 MeV photon energy, respectively. Moreover, MAC values were reported as 0.0353, 0.0355, 0.0356, and 0.0358 at 15 MeV photon energy for the studied glass samples in the same order. The condition obtained in both low and high energy areas can be explained by the inclusion of the largest amount of Nd2O3 in the glass composition because of its high atomic number. Similar results were reported by Elmahroug et al. [13]. Their results showed that Bi2O3 reinforcement in the V2O5–TeO2 glass system directly increased the mass attenuation coefficients of the studied glasses. Similar to our results, an increasing reinforcement amount with higher atomic number resulted in an increment in the V2O5–TeO2 glass system. The term HVL factor is a useful quantity to evaluate the required thickness of a shield, which can reduce the intensity of the incident gamma ray by half. Therefore, a smaller HVL can be considered as a supremacy indicator in shielding materials. In this study, HVL values of the studied glasses were determined. Figure 4 shows a variation of the half value layer (T1/2) against photon energy for all glasses. In the lower energies, HVL values were reported as small. This is an expected situation for any type of shielding material as low energy gamma rays can be attenuated in low material thicknesses. However, it can be seen from Figure 4 that HVL values are higher in the high energy zone.
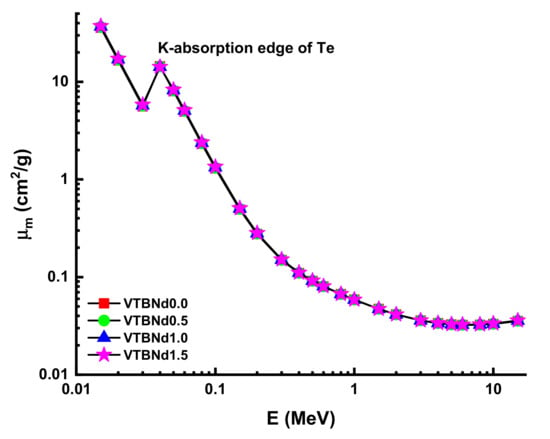
Figure 3.
Variation of mass attenuation coefficient (µm) against photon energy for all glasses.
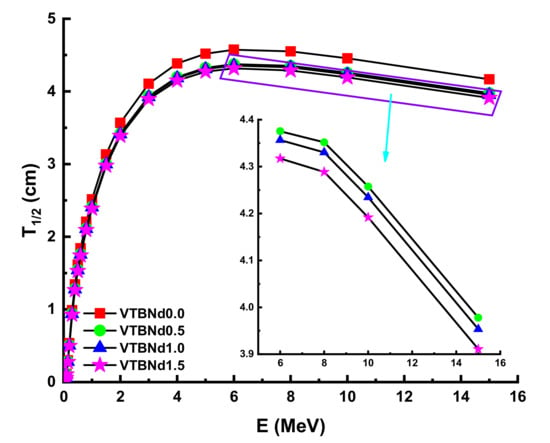
Figure 4.
Variation of half value layer (T1/2) against photon energy for all glasses.
It can be explained by the penetration property of gamma rays and its dependence on energy. For example, the HVL values of the VTBNd0.0, VTBNd0.5, VTBNd1.0, and VTBNd1.5 samples at different energies were found to be 0.0041 cm HVLVTBNd0.0 > 0.0039 cm HVLVTBNd0.5 > 0.0038 HVLVTBNd1.0 > 0.0037 cm HVLVTBNd1.5 at 0.015 MeV. Moreover, HVL values were reported as 0.2992 cm HVLVTBNd0.0 > 0.2840 cm HVLVTBNd0.5 > 0.2806 HVLVTBNd1.0 > 0.2760 cm HVLVTBNd1.5 at 0.15 MeV. Finally, HVL values were reported as 4.1660 cm HVLVTBNd0.0 > 3.9777 cm HVLVTBNd0.5 > 3.9533 HVLVTBNd1.0 > 3.9106 cm HVLVTBNd1.5 at 15 MeV, respectively. As shown from this ranking, the minimum HVL values were reported for the VTBNd1.5 sample, which has the highest amount of Nd2O3 additive in its glass structure. Therefore, one can say that VTBNd1.5 requires the smallest thickness to reduce incident gamma rays by half (T1/2). The importance of the mean free path (λ) is a consideration in the gamma-protection abilities of shielding materials. The glass samples were examined, and the results are detailed in Figure 5.
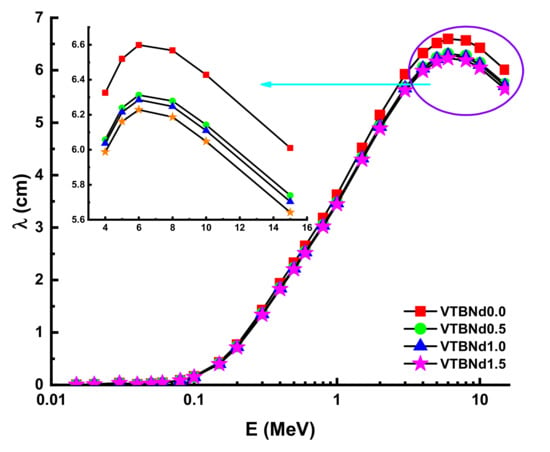
Figure 5.
Variation of mean free path (λ) against photon energy for all glasses.
The λ values will differ similarly to the evolving pattern of HVL. The minimum λ values were recorded for the VTBNd1.5 sample. Another important shielding parameter is the tenth value layer (TVL). The term TVL factor is another essential evaluation criterion for the required thickness of a shield, reducing the intensity of an incident gamma ray to one-tenth (1/10). TVL vales of the studied glasses were determined and the results presented in Figure 6 as a function of the incident photon energy for all glasses. In the lower energies, TVL values were reported as small. A similar variation trend of HVL was also reported for the TVL values of the VTBNd0.0, VTBNd0.5, VTBNd1.0, and VTBNd1.5 samples. For example, TVL values were reported as 0.9941 cm TVLVTBNd0.0 > 0.9435 cm TVLVTBNd0.5 > 0.9323 TVLVTBNd1.0 > 0.9170 cm HVLVTBNd1.5 at 0.15 MeV. Overall, the minimum TVL values were reported for the VTBNd1.5 sample, which has the highest amount of Nd2O3 additive. The required atomic number for measuring the material’s appropriateness for gamma applications is tied to the proper photon control stage. The Zeff values of the glass samples measured are shown in Figure 7.
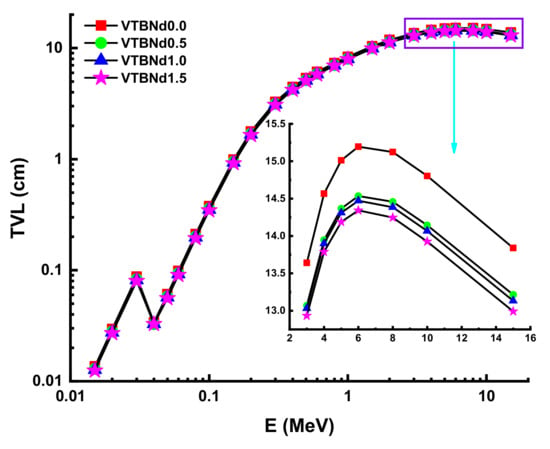
Figure 6.
Variation of tenth value layer (TVL) against photon energy for all glasses.
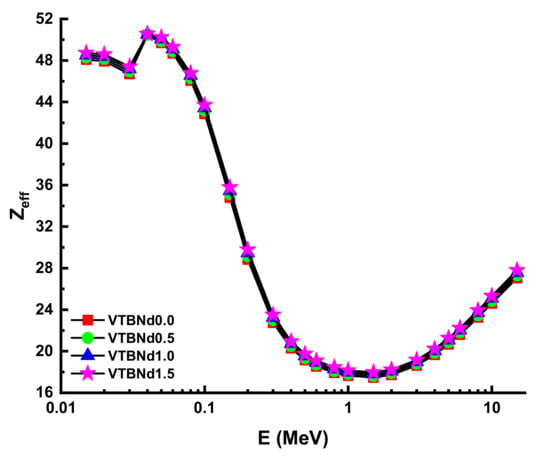
Figure 7.
Variation of effective atomic number (Zeff) against photon energy for all glasses.
Thanks to its high-quality shading properties, Zeff values were greatest for the VTBNd1.5 glass sample. For example, Zeff values for VTBNd1.5 were 34.80, 35.13, 35.46, and 35.78 for the VTBNd0.0, VTBNd0.5, VTBNd1.0, and VTBNd1.5 samples at 0.15 MeV, respectively. However, the highest Zeff values were reported at 0.04 MeV as 50.44, 50.48, 50.52, and 50.55 for the VTBNd0.0, VTBNd0.5, VTBNd1.0, and VTBNd1.5 samples. The particle concentration in the medium is calculated, and then a radiation density correction is used in the equation to account for scattered radiation. Secondary ionizing radiation must be included in the overall calculation of buildup. The buildup factor is a multiplier compounded by the photon’s attenuation rate to calculate the photon’s total attenuation. The moderator allows for the disparity in the numbers of photons between the sources that makes up for their different intensities. Using the two sub terms of energy absorption, it can be classified into two forms of energy absorption factor, energy absorption buildup factor (EABF) and exposure buildup factor (EBF). In this study, EBF and EABF values were measured using a G-P fit approach from 0.5 to 40 mfp. The obtained fitting parameters along with their numerical values can be seen in Table 3, Table 4, Table 5 and Table 6. Figure 8a–e or Figure 9a–e display the calculated EBF and EABF values against photon energy for the VTBNd0.0, VTBNd0.5, VTBNd1.0, and VTBNd1.5 samples. Figure 8a–e or Figure 9a–e illustrate the concentration of the three distinct constituent layers of EBF and EABF due to photon radiation. Areas affected by gamma rays are important to the connections between radiation and matter. Since the photoelectric effect can be ignored near the binding energy of high atomic numbers, peaks can be observed in the first region. On the other side, though, the third segment of the sample is the most interesting during pair growth, with the value declining due to absorption processes.

Table 3.
(Exposure buildup factor (EBF) and energy absorption buildup factor (EABF)) G-P fitting coefficients (b, c, a, Xk and d) of VTBNd0.0 glass sample.

Table 4.
(EBF and EABF) G-P fitting coefficients (b, c, a, Xk and d) of VTBNd0.5 glass sample.

Table 5.
(EBF and EABF) G-P fitting coefficients (b, c, a, Xk and d) of VTBNd1.0 glass sample.

Table 6.
(EBF and EABF) G-P fitting coefficients (b, c, a, Xk and d) of VTBNd1.5 glass sample.
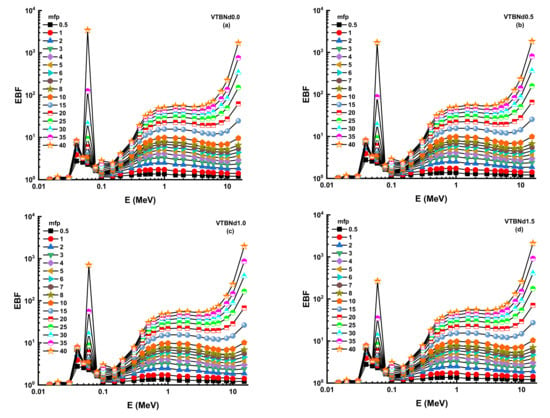
Figure 8.
(a–d) Variation of exposure buildup factor (EBF) against photon energy for all glasses.
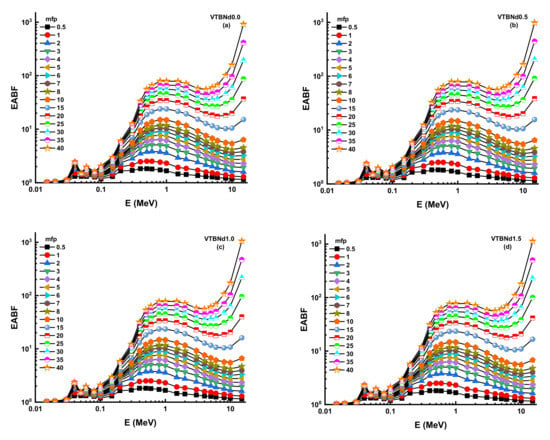
Figure 9.
(a–d) Variation of energy absorption buildup factor (EABF) against photon energy for all glasses.
Figure 10 and Figure 11 display the changes in EBF and EABF values of studied glass samples at 10, 20, 30, and 40 mfp. These figures can also be considered as the dependency function of EBF and EABF values against glass structure. Figure 10 shows that VTBNd1.5 has the lowest EBF and EABF values with its superior shielding properties among the investigated glasses. The same pattern was also seen for the EABF value. The minimum EABF values recorded for sample VPBCd8 were found at all mfp values. Analysis was conducted to compare the EBF and EABF values for a set of glass formulations based on mfp values such as 10, 20, 30, and 40 mfp. Figure 12 shows variation of energy absorption buildup factor (EABF) and exposure buildup factor (EBF) against effective atomic number (Zeff) at 1 MeV and 5 mfp for all glasses. It can be clearly seen from Figure 12 that the EBF and EABF is higher for glasses with high Zeff than for glasses with low atomic Zeff. It can be easily shown that there is a strict relationship between EBF values and the efficient atomic number.
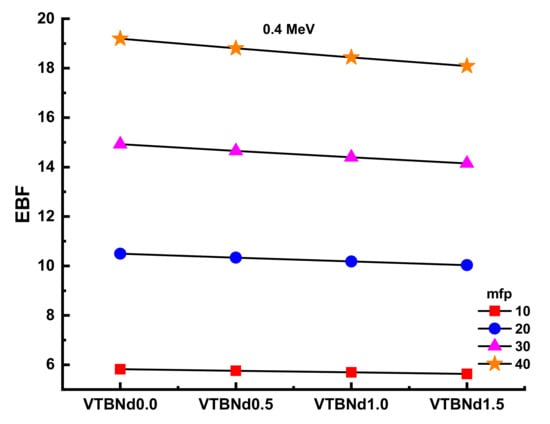
Figure 10.
Variation of exposure buildup factor (EBF) against glass compositions.
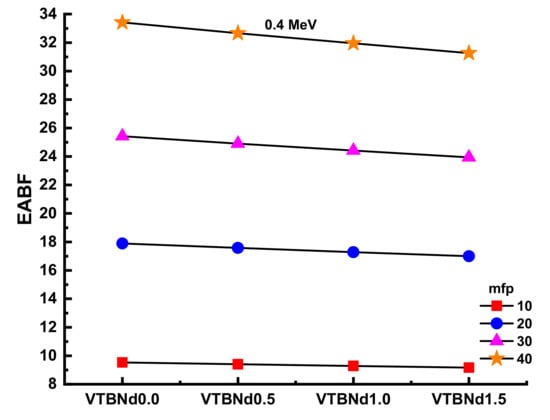
Figure 11.
Variation of energy absorption buildup factor (EABF) against glass compositions.
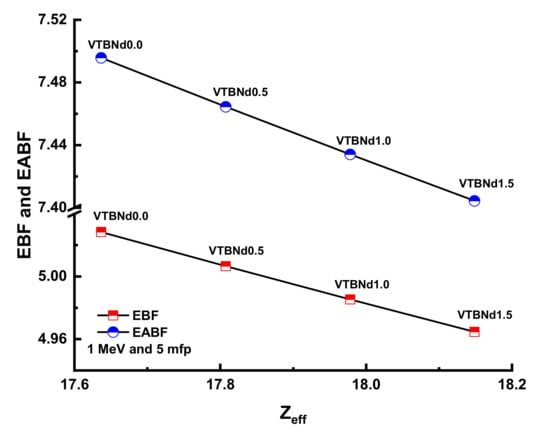
Figure 12.
Variation of energy absorption buildup factor (EABF) and exposure buildup factor (EBF) against effective atomic number (Zeff) for all glasses.
4. Conclusions
Nd2O3-doped glasses, among the technologically important lanthanide-doped glasses, are studied frequently due to their luminescence and optical properties. Moreover, among these studies, TeO2 glasses are mostly preferred due to their excellent optical properties. Being synthesized at low temperatures is one of the many advantages of these glasses. On the other hand, vanadium-doped tellurium glasses with semiconducting properties are considered valuable materials for semiconductor technology and optoelectronic materials such as lasers with the addition of Nd2O3. Apart from these advantageous properties, these glasses’ radiation properties were investigated in detail in this study. We aimed to perform a sizeable simulated characterization on a different type of Nd2O3, reinforced glasses and their nuclear radiation shielding properties regarding an ideal shield’s essential needs. The effect of varying the ratio of boron (III) oxide and neodymium (III) oxide concentrations on the radiation shielding properties of TeO2–V2O5–(B2O3/Nd2O3) were illustrated. The attenuation properties computed at expansive energies within the range of (0.015–15) × 10+3 keV. Some critical properties, such as T1/2, λ, TVL, µ, µm, Zeff, EBF, and EABF were determined. Simulated and theoretical µm values were obtained using the MXNPX code and the Phy-X PSD database. Good agreement was observed between the simulated and theoretical results. Generally, the VTBNd1.5 sample (1.5 mol%) Nd2O3 had the lowest T1/2, λ, and TVL values and the highest µ, µm, and Zeff values. That means that the VTBNd1.5 sample (with 1.5mol% Nd2O3) offers superior shielding against gamma radiation compared to the other samples. The results showed that radiation shielding properties increase according to the doping ratio. As a result of this study, it can be concluded that continuous research is needed in terms of glass sciences and material development studies. The effect of reinforcement was apparent. However, different types of comprehensive investigations with varying additive amounts can be considered as the continuous research of our project on eco-friendly novel shields.
Author Contributions
Conceptualization, G.K., H.M.H.Z. and M.H.M.Z.; methodology, G.K.; software, H.O.T., S.A.M.I. and M.H.M.Z.; validation, H.O.T., S.A.M.I., H.M.H.Z., H.A.A.S. and K.A.M.; formal analysis, G.K., N.T., H.M.H.Z. and M.H.M.Z.; investigation, H.O.T., S.A.M.I., G.K. and H.M.H.Z.; resources, G.K. and M.H.M.Z.; data curation, H.O.T. and H.M.H.Z.; writing—original draft preparation, H.M.H.Z. and M.H.M.Z.; writing—review and editing, H.O.T., S.A.M.I., N.T., H.A.A.S., and K.A.M.; visualization, H.M.H.Z.; supervision, G.K., H.M.H.Z. and M.H.M.Z.; project administration, H.M.H.Z. and M.H.M.Z.; funding acquisition, M.H.M.Z. All authors have read and agreed to the published version of the manuscript.
Funding
This research received no external funding.
Institutional Review Board Statement
Not applicable.
Informed Consent Statement
Not applicable.
Data Availability Statement
Data is contained within the article.
Conflicts of Interest
The authors declare no conflict of interest.
References
- Kilic, G. Role of Nd3+ ions in TeO2–V2O5–(B2O3/Nd2O3) glasses: Structural, optical, and thermal characterization. J. Mater. Sci. Mater. Electron. 2020, 31, 12892–12902. [Google Scholar] [CrossRef]
- Kilic, G.; Issever, U.G.; Ilik, E. Characterization of Er 3+ doped ZnTeTa semiconducting oxide glass. J. Mater. Sci. Mater. Electron. 2019. [Google Scholar] [CrossRef]
- Naseer, K.A.; Arunkumar, S.; Marimuthu, K. The impact of Er3+ ions on the spectroscopic scrutiny of Bismuth bariumtelluroborate glasses for display devices and 1.53 μm amplification. J. Non Cryst. Solids 2019, 520, 119463. [Google Scholar] [CrossRef]
- Kiliç, G.; İşsever, U.G.; İlik, E. The synthesis and characterization of zinc-tellurite semiconducting oxide glasses containing Ta2O5. Mater. Res. Express 2019, 6, 065907. [Google Scholar] [CrossRef]
- Chakraborty, S.; Satou, H.; Sakata, H. Direct current conductivity and oxygen gas-sensing properties of iron-antimony-tellurite glasses. J. Appl. Phys. 1997, 82, 5520–5525. [Google Scholar] [CrossRef]
- Prashant Kumar, M.; Sankarappa, T. DC conductivity in some alkali doped vanadotellurite glasses. Solid State Ion. 2008, 178, 1719–1724. [Google Scholar] [CrossRef]
- Işsever, U.G.; Kilic, G.; Peker, M.; Ünaldi, T.; Aybek, A.Ş. Effect of low ratio V5+ doping on structural and optical properties of borotellurite semiconducting oxide glasses. J. Mater. Sci. Mater. Electron. 2019, 30, 15156–15167. [Google Scholar] [CrossRef]
- Balaji Rao, R.; Veeraiah, N. Study on some physical properties of Li2O-MO-B2O3: V2O5 glasses. Phys. B Condens. Matter 2004, 348, 256–271. [Google Scholar] [CrossRef]
- Ali, A.M.; Issa, S.A.M.; Rashad, M.; Saddeek, Y.B.; Zaid, M.H.M.; Sayed, M.A.; Somaily, H.H.; Tekin, H.O.; Sidek, H.A.A.; Matori, K.A.; et al. Promising applicable heterometallic Al2O3/PbO2 nanoparticles in shielding properties. J. Mater. Res. Technol. 2020. [Google Scholar] [CrossRef]
- Zakaly, H.M.; Abouhaswa, A.S.; Issa, S.A.M.; Mostafa, M.Y.A.; Pyshkina, M.; El-Mallawany, R. Optical and nuclear radiation shielding properties of zinc borate glasses doped with lanthanum oxide. J. Non Cryst. Solids 2020, 543, 120151. [Google Scholar] [CrossRef]
- Issa, S.A.M.; Rashad, M.; Zakaly, H.M.H.; Tekin, H.O.; Abouhaswa, A.S. Nb2O5-Li2O-Bi2O3-B2O3 novel glassy system: Evaluation of optical, mechanical, and gamma shielding parameters. J. Mater. Sci. Mater. Electron. 2020. [Google Scholar] [CrossRef]
- Zakaly, H.M.H.; Saudi, H.A.; Issa, S.A.M.; Rashad, M.; Elazaka, A.I.; Tekin, H.O.; Saddeek, Y.B. Alteration of optical, structural, mechanical durability and nuclear radiation attenuation properties of barium borosilicate glasses through BaO reinforcement: Experimental and numerical analyses. Ceram. Int. 2020. [Google Scholar] [CrossRef]
- Elmahroug, Y.; Almatari, M.; Sayyed, M.I.; Dong, M.G.; Tekin, H.O. Investigation of radiation shielding properties for Bi2O3–V2O5-TeO2 glass system using MCNP5 code. J. Non Cryst. Solids 2018, 499, 32–40. [Google Scholar] [CrossRef]
- Tekin, H.O.; Kilicoglu, O. The influence of gallium (Ga) additive on nuclear radiation shielding effectiveness of Pd/Mn binary alloys. J. Alloys Compd. 2020, 815, 152484. [Google Scholar] [CrossRef]
- Tekin, H.O.; Kassab, L.R.P.; Issa, S.A.M.; Bordon, C.D.S.; Altunsoy Guclu, E.E.; da Silva Mattos, G.R.; Kilicoglu, O. Synthesis and nuclear radiation shielding characterization of newly developed germanium oxide and bismuth oxide glasses. Ceram. Int. 2019, 45, 24664–24674. [Google Scholar] [CrossRef]
- Elazaka, A.I.; Zakaly, H.M.H.; Issa, S.A.M.; Rashad, M.; Tekin, H.O.; Saudi, H.A.; Gillette, V.H.; Erguzel, T.T.; Mostafa, A.G. New approach to removal of hazardous Bypass Cement Dust (BCD) from the environment: 20Na2O-20BaCl2-(60-x)B2O3-(x)BCD glass system and Optical, mechanical, structural and nuclear radiation shielding competences. J. Hazard. Mater. 2021, 403, 123738. [Google Scholar] [CrossRef] [PubMed]
- Mostafa, A.M.A.; Zakaly, H.M.H.; Pyshkina, M.; Issa, S.A.M.; Tekin, H.O.; Sidek, H.A.A.; Matori, K.A.; Zaid, M.H.M. Multi-objective optimization strategies for radiation shielding performance of BZBB glasses using Bi2O3: A FLUKA Monte Carlo code calculations. J. Mater. Res. Technol. 2020, 9, 12335–12345. [Google Scholar] [CrossRef]
- Rashad, M.; Tekin, H.O.; Zakaly, H.M.; Pyshkina, M.; Issa, S.A.M.; Susoy, G. Physical and nuclear shielding properties of newly synthesized magnesium oxide and zinc oxide nanoparticles. Nucl. Eng. Technol. 2020, 52, 2078–2084. [Google Scholar] [CrossRef]
- Şakar, E.; Özpolat, Ö.F.; Alım, B.; Sayyed, M.I.; Kurudirek, M. Phy-X/PSD: Development of a user friendly online software for calculation of parameters relevant to radiation shielding and dosimetry. Radiat. Phys. Chem. 2020, 166, 108496. [Google Scholar] [CrossRef]
- Tekin, H.O. MCNP-X Monte Carlo Code Application for Mass Attenuation Coefficients of Concrete at Different Energies by Modeling 3 × 3 Inch NaI(Tl) Detector and Comparison with XCOM and Monte Carlo Data. Sci. Technol. Nucl. Install. 2016, 2016. [Google Scholar] [CrossRef]
- Tekin, H.O.; Singh, V.P.; Manici, T.; Altunsoy, E.E. Validation of MCNPX with Experimental Results of Mass Attenuation Coefficients for Cement, Gypsum and Mixture. J. Radiat. Prot. Res. 2017, 42, 154–157. [Google Scholar] [CrossRef]
- RSICC Computer Code Collection. MCNPX User’s Manual Version 2.4.0. Monte Carlo N-Particle Transport Code System for Multiple and High Energy Applications; Radiation Safety Information Computational Center: Oak Ridge, TN, USA, 2002. [Google Scholar]
- Mostafa, A.M.A.; Zakaly, H.M.; Al-Ghamdi, S.A.; Issa, S.A.; Al-Zaibani, M.; Ramadan, R.M.; El Agammy, E.F. PbO–Sb2O3–B2O3–CuO glassy system: Evaluation of optical, gamma and neutron shielding properties. Mater. Chem. Phys. 2021, 258, 123937. [Google Scholar] [CrossRef]
- Issa, S.A.M.; Zakaly, H.M.H.; Pyshkina, M.; Mostafa, M.Y.A.; Rashad, M.; Soliman, T.S. Structure, optical, and radiation shielding properties of PVA–BaTiO3 nanocomposite films: An experimental investigation. Radiat. Phys. Chem. 2020, 180, 109281. [Google Scholar] [CrossRef]
- Tekin, H.O.; Sayyed, M.I.; Altunsoy, E.E.; Manici, T. Shielding properties and effects of WO3 and PbO on mass attenuation coefficients by using MCNPX code. Dig. J. Nanomater. Biostruct. 2017, 12, 861–867. [Google Scholar]
- Tekin, H.O.; Singh, V.P.; Manici, T. Effects of micro-sized and nano-sized WO3 on mass attenauation coefficients of concrete by using MCNPX code. Appl. Radiat. Isot. 2017, 121, 122–125. [Google Scholar] [CrossRef] [PubMed]
- Issa, S.A.M.; Uosif, M.A.M.; Michel, R.; Flament, J.-L.; David, J.-C.; Leray, S.; Herpers, U. The production of residual nuclides via 211, 1000, 1400 and 2530 MeV protons irradiation of natural uranium. J. Radioanal. Nucl. Chem. 2015, 305. [Google Scholar] [CrossRef]
- Saddeek, Y.B.; Issa, S.A.M.; Alharbi, T.; Elsaman, R.; Abd elfadeel, G.; Mostafa, A.M.A.; Aly, K.; Ahmad, M. Synthesis and characterization of lead borate glasses comprising cement kiln dust and Bi2O3 for radiation shielding protection. Mater. Chem. Phys. 2019, 122510. [Google Scholar] [CrossRef]
- El-Bialy, H.A.; El-Gamal, M.S.; Elsayed, M.A.; Saudi, H.A.; Khalifa, M.A. Microbial melanin physiology under stress conditions and gamma radiation protection studies. Radiat. Phys. Chem. 2019, 162, 178–186. [Google Scholar] [CrossRef]
- Henaish, A.M.A.; Mostafa, M.; Salem, B.I.; Zakaly, H.M.H.; Issa, S.A.M.; Weinstein, I.A.; Hemeda, O.M. Spectral, electrical, magnetic and radiation shielding studies of Mg-doped Ni–Cu–Zn nanoferrites. J. Mater. Sci. Mater. Electron. 2020, 1–13. [Google Scholar] [CrossRef]
- Sallam, O.I.; Madbouly, A.M.; Elalaily, N.A.; Ezz-Eldin, F.M. Physical properties and radiation shielding parameters of bismuth borate glasses doped transition metals. J. Alloys Compd. 2020, 843, 156056. [Google Scholar] [CrossRef]
- Sallam, O.I.; Alhodaib, A.; Abd El Aal, S.; Ezz-Eldin, F.M. Influence of gamma ray on optical and structural properties of commercial glass enriched with copper oxide. Inorg. Chem. Commun. 2021, 124, 108388. [Google Scholar] [CrossRef]
Publisher’s Note: MDPI stays neutral with regard to jurisdictional claims in published maps and institutional affiliations. |
© 2021 by the authors. Licensee MDPI, Basel, Switzerland. This article is an open access article distributed under the terms and conditions of the Creative Commons Attribution (CC BY) license (http://creativecommons.org/licenses/by/4.0/).