Article

Synthesis of Cobalt Oxide on FTO by Hydrothermal Method for Photoelectrochemical Water Splitting Application

by
Siti Nurul Falaein Moridon
1,
Mohd Nur Ikhmal Salehmin
1,
Khuzaimah Arifin
1,*,
Lorna Jeffery Minggu
1 and
Mohammad B. Kassim
1,2
1
Fuel Cell Institute, Universiti Kebangsaan Malaysia, Bangi 43600, Malaysia
2
Department of Chemical Sciences, Faculty of Science and Technology, Universiti Kebangsaan Malaysia, Bangi 43600, Malaysia
*
Author to whom correspondence should be addressed.
Appl. Sci. 2021, 11(7), 3031; https://doi.org/10.3390/app11073031
Submission received: 20 February 2021 / Revised: 24 March 2021 / Accepted: 25 March 2021 / Published: 29 March 2021
(This article belongs to the Special Issue Photoelectrochemistry Energy Applications and Materials)

Abstract

:
Cobalt oxide thin films were successfully grown directly on fluorine-doped tin oxide glass substrates through a simple, green, and low-cost hydrothermal method. An investigation into the physicochemical characteristics and photoelectrochemical (PEC) properties of the developed cobalt oxide thin film was comprehensively performed. At various annealing temperatures, different morphologies and crystal phases of cobalt oxide were observed. Microflowers (Co3O4) and microflowers with nanowire petals (Co3O4/CoO) were produced at 450 °C and 550 °C, respectively. Evaluation of the PEC performance of the samples in KOH (pH 13), Na2SO4 (pH 6.7), and H2SO4 (pH 1) revealed that the highest photocurrent −2.3 mA cm−2 generated at −0.5 V vs. reversible hydrogen electrode (RHE) was produced by Co3O4 (450 °C) in H2SO4 (pH 1). This photocurrent corresponded to an 8-fold enhancement compared with that achieved in neutral and basic electrolytes and was higher than the results reported by other studies. This promising photocurrent generation was due to the abundant source of protons, which was favorable for the hydrogen evolution reaction (HER) in H2SO4 (pH 1). The present study showed that Co3O4 is photoactive under acidic conditions, which is encouraging for HER compared with the mixed-phase Co3O4/CoO.

1. Introduction

Hydrogen (H2) is an ideal future energy carrier to replace fossil fuels. H2 as fuel in a fuel cell system has been proven to be safe, clean, and environmentally friendly, and its only byproduct is pure water [1]. H2 can be extracted from water molecules through photoelectrochemical (PEC) water-splitting using direct solar energy, which has been actively studied globally [2,3]. Both components, water and sunlight, are abundant and available everywhere. PEC water-splitting requires a semiconductor material as a photoelectrode. This photoelectrode is exposed to sunlight and is the site for the initiation of the catalytic reaction. The results depend on the nature of the semiconductor. The n-type semiconductors, such as titanium dioxide (TiO2), act as a photoanode; the water molecule is oxidized to produce oxygen (O2) gas. Meanwhile, p-type semiconductors, such as Cu2O, act as a photocathode. The proton (H+) is reduced, and H2 is generated [4].
A few requirements need to be fulfilled by photoelectrodes to achieve an efficient PEC water-splitting process. The bandgap energy should be greater than 1.23 eV and less than 3 eV to allow the utilization of the spectral range of visible light [5]. To electrochemically split the water molecule, the band edges of the photoelectrode need to be in straddle position to the water molecule redox potential, which means the conduction band (CB) of the material should lay at a more negative potential than the water reduction potential. Meanwhile, the valence band (VB) position should lay at a more positive potential to the water oxidation potential. Furthermore, a stable and highly photoactive photoelectrode is required to achieve an efficient PEC performance [6].
TiO2 [7,8], Cu2O [9], WO3 [9], Fe2O3 [10], and perovskites [11] are among the semiconductor materials that have been extensively investigated as photoelectrodes, because these materials are highly abundant and require simple fabrication techniques and low-cost preparation processes. However, recently, cobalt oxide itself has also received considerable attention as a photocatalyst material. Cobalt oxide is attractive because of its suitable optical band gap of ~2.00 eV, which falls within the favorable band gap range for visible light absorption [9,12,13,14,15]. Co3O4 and CoO are reportedly the most stable phases of cobalt oxide and are the most investigated materials for PEC water-splitting applications [13]. Hong et al. (2017) reported that photocurrent densities produced by Co3O4 for PEC performance at −0.4 V bias vs. Ag/AgCl could be achieved at −0.50 mA cm−2, approximately [9]. Liao et al. (2016) revealed that CoO can cleave water molecules without the addition of cocatalysts or sacrificial reagents. The photocatalytic process achieved ~5% efficiency of solar to hydrogen, which is the highest efficiency for a single material.
Cobalt oxide can be synthesized using various methods through a chemical or physical route [16]. The chemical route includes the sol–gel method [17], hydrothermal method [12], solvothermal method [18], cathodic reduction [19], and chemical vapor deposition (CVD) [20]. Meanwhile, a physical approach includes sputtering and physical vapor deposition (PVD) [19,21]. Cobalt (II) salts, such as cobalt (II) chloride hexahydrate, cobalt acetate tetrahydrate, and cobalt (II) nitrate hexahydrate are most used as starting materials [22,23]. The purity of the cobalt oxide phase depends on the preparation methods and the annealing temperature. The good crystallinity properties of Co3O4 thin films with preferred orientation along [111] direction were reported by El Bachiri et al. (2019) using spray pyrolysis technique of an aqueous solution of hydrated cobalt chloride salt. Prabaharan et al. (2017) synthesized Co3O4 nanoparticles by using a cheap and easy sol gel precipitation method producing nanoparticles agglomerated with spherical-shaped particles [24].
Cobalt oxide is a temperature-dependent material; when the cobalt compound is annealed at a low temperature with abundant air, Co3O4 is produced. In an adequate amount of oxygen, the Co2O3 changes to Co3O4 without any change in the lattice structure [25]. A cobalt compound forms CoO as the final product at a high annealing temperature (>900 °C) and under inert conditions [12,26,27]. In this study, the cobalt oxide thin film was directly grown on fluorine-doped tin oxide (FTO) glass through a hydrothermal method. The phase transformation of directly grown on the FTO will be studied based on the different annealing temperatures. We realize that the study of phase transformation directly grown on fluorine-doped tin oxide (FTO) glass through a hydrothermal method rarely been reported. The annealing temperatures of 450 °C and 550 °C were chosen based on our previous study on powder photocatalysts. The high crystalline Co3O4 produced at an annealing temperature of 450 °C was then transformed to mixed-phase Co3O4/CoO or pure CoO at higher temperature [12]. This study’s highest temperature was 550 °C because of the temperature limitation of FTO glass. The photoelectrode performance was then evaluated based on photocurrent generation, which reflected PEC water-splitting application’s response to an electrolyte.

2. Materials and Methods

2.1. Synthesis of Cobalt Oxide

Cobalt oxides were synthesized on FTO by a hydrothermal method according to a previous study [15]. Cobalt nitrate hexahydrate (2.90 g) with 99% purity from R & M Chemical, United Kingdom and urea (0.72 g) from Quality Reagent Chemical (QREC), Malaysiawere dissolved in 50 mL of deionized water. Subsequently, the homogeneous solution was placed into a 100 mL volume autoclave made of stainless steel. The autoclaves were maintained at 100 °C for 6 h and naturally cooled to room temperature. Next, the thin film was rinsed with distilled water prior to annealing in N2 gas at 450 °C and 550 °C for 3 h.

2.2. Characterization

The crystallinity of the sample was determined using X-ray diffraction (XRD) with Cu Kα radiation at a wavelength of 0.15406 Å (Siemens X-ray Diffractometer D5000, Munich, Germany). The surface morphology of the samples was observed using a field emission scanning electron microscope (FESEM) (JEOL JSM-7600F, Tokyo, Japan) and high-resolution transmission electron microscopy (HRTEM) (JEOL JEM- 2100F, Japan). The optical properties of the samples were examined using a UV-Vis-NIR spectrophotometer (UV-3101PC Shidmadzu, Kyoto, Japan). Details of the chemical composition and binding energy were obtained with an X-ray photoelectron spectrometer (Fourier Kratos Analytical Axis Ultra DLD/2009, Manchester, UK).

2.3. Photoelectrochemical Measurement and Stability Test

Photochemical (PEC) measurements were performed with a three-electrode configuration that comprised the samples, saturated Ag/AgCl, and platinum as the working, reference, and counter electrodes, respectively. These cables were connected to a potentiostat (Versa stat, Ametex, Oak Ridge, TN, USA). To evaluate the effect of the pH of the electrolytes on the photocurrent generation, different solutions of 0.5 M KOH (pH 13), 0.5 M Na2SO4 (pH 7), and 0.5 M H2SO4 (pH 1) were prepared as the electrolytes. Prior to PEC measurement, the electrolytes were degassed with N2 for 10 min. The photocurrent measurements were conducted under simulated solar light illumination at a power density of 100 mW cm−2 with a Xenon lamp as the light source (ORIEL). Under similar conditions, Mott–Schottky data were collected under illumination at a frequency of 1000 Hz. The electrochemical impedance of the samples was evaluated using electrochemical impedance spectroscopy (EIS) by scanning from 1 Hz to 100,000 Hz using a similar potentiostat. The applied potential was converted into the reversible hydrogen electrode (RHE) scale using the Nernst equation; ERHE = EAg/AgCl + 0.05196pH + 0.1976.

3. Results and Discussion

3.1. Phase and Crystal Structure Analysis

The cobalt oxide thin film on FTO was fabricated using a sequential hydrothermal method and annealed under inert conditions. The product from the hydrothermal process that was not annealed (named as a pre-annealed sample) was also analyzed to confirm the first product produced by the hydrothermal method. XRD analysis was utilized in this study to fully understand the phase of cobalt oxide produced according to the annealing temperature. The XRD chromatogram in Figure 1 shows that cobalt (III) oxide (Co3O4) was formed on the FTO after the hydrothermal reaction (pre-annealed), as indicated by the diffracted peaks of (111), (220), (311), (511), and (440), which corresponded to the plane of the cubic crystal structure with the spinel Co3O4 phase (JSPD NO 00-042-1467). In addition, as the sample was later subjected to an annealing treatment of 450 °C, the intensity of the peaks belonging to the Co3O4 phase markedly increased, indicating an increase in crystallinity. Interestingly, at 550 °C, a mixed phase of Co3O4 and CoO was observed at approximately 36°, 45°, and 59°, indicating that oxidation of Co3O4 to CoO occurred. According to previous studies [28], increasing the annealing temperature decreases the amount of oxygen in the films, which might be explained by the increase in purity and crystallinity of the as-deposited Co3O4 (pre-annealed) and after annealing at 450 °C, and by the loss of oxygen in the form of water vapor during the annealing treatment.
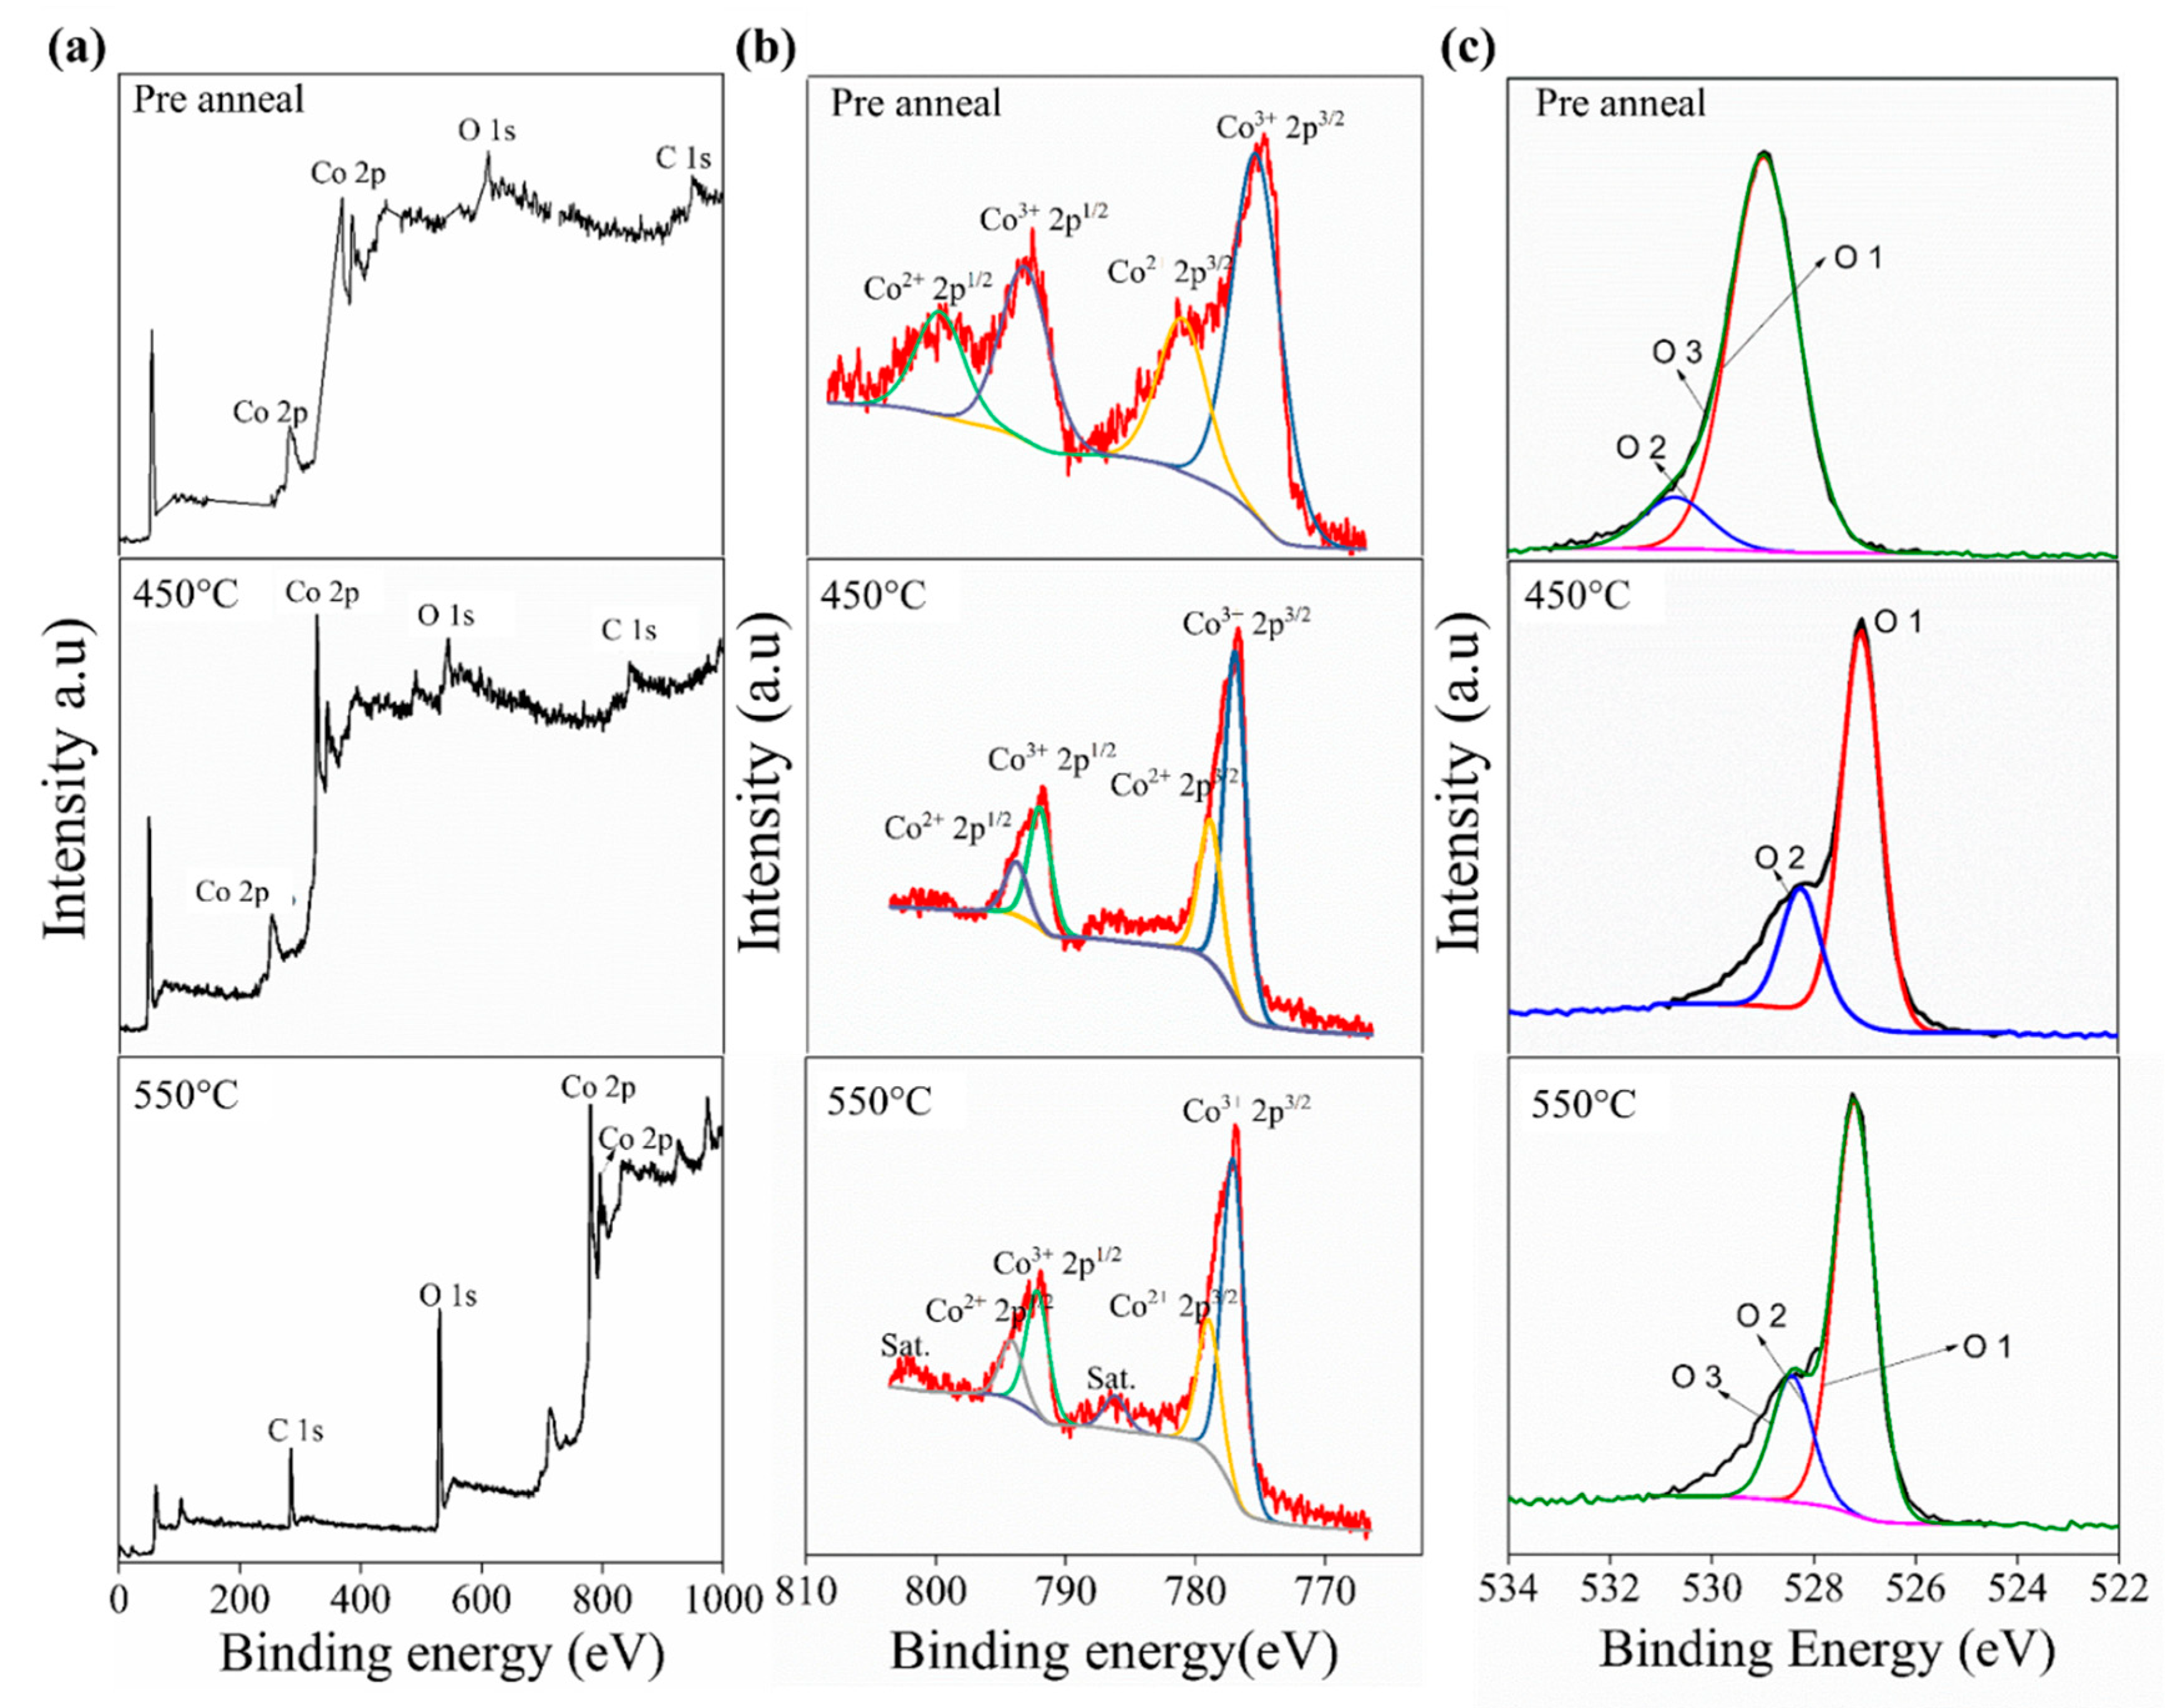
To confirm the composition of pre-annealed 450 °C and 550 °C samples, X-ray photoelectron spectroscopy (XPS) analysis was performed as displayed in Figure 2. The pre-annealed and the annealed 450 °C samples have similar full survey spectra. The Co 2p spectra for the pre-annealed appeared at the value of binding energy for 778 ± 0.5 and 800 ± 0.5 eV, whereas the annealed 450 °C appeared at the value of binding energy for 778 ± 0.5 and 793 ± 0.5 eV. The spectra of the pre-annealed are present in a broad area compared to the Co 2p spectra for the annealed 450 °C. The broad value of the pre-annealed perhaps is caused by water or solvent contaminant. A similar trend was also reported by Chen et al. (2020) on the annealing effect on MoS2 [29]. The 2p3/2 and 2p1/2 peaks separation for both pre-annealed and annealed 450 °C samples are around ± 10 eV. According to H. Jadhav et al., between the 2p3/2 and 2p1/2 peaks, an energy difference of ~15 eV is characteristic of the Co3O4 phase [30]. The major peak in Co 2p3/2 for the sample annealed at 450 °C de-convoluted into two peaks centered at 776.96 and 778.90 eV, which corresponded to Co3+ and Co2+ species, respectively. For the Co 2p spectrum of the 550 °C thin film, the Co3+ and Co2+ species were located at 777.07 and 778.95 eV, respectively. In addition, the presence of CoO was confirmed by the indication of a low appearance of satellites [31]. The Co 2p spectrum of single-phase Co3O4 showed a clear image of weaker peaks compared with that associated with CoO in the mixed phase of Co3O4/CoO [32]. Figure 2c shows the O 1s XPS spectra of the pre-annealed, annealed 450 °C, and annealed 550 °C samples. All samples produce oxygen peaks in different binding energy and height. The oxygen peaks of pre-anneal sample present at 529 and 530.6 eV. Meanwhile, the position oxygen peaks of annealed 450 °C and 550 °C samples are in lower binding energy, that is, at 527 and 528.6 eV. They differed only in the slight shifting in intensity and the peak position, thereby indicating that some oxygen atoms bind with different oxidation states of Co.

3.2. Structure and Morphology Characterization

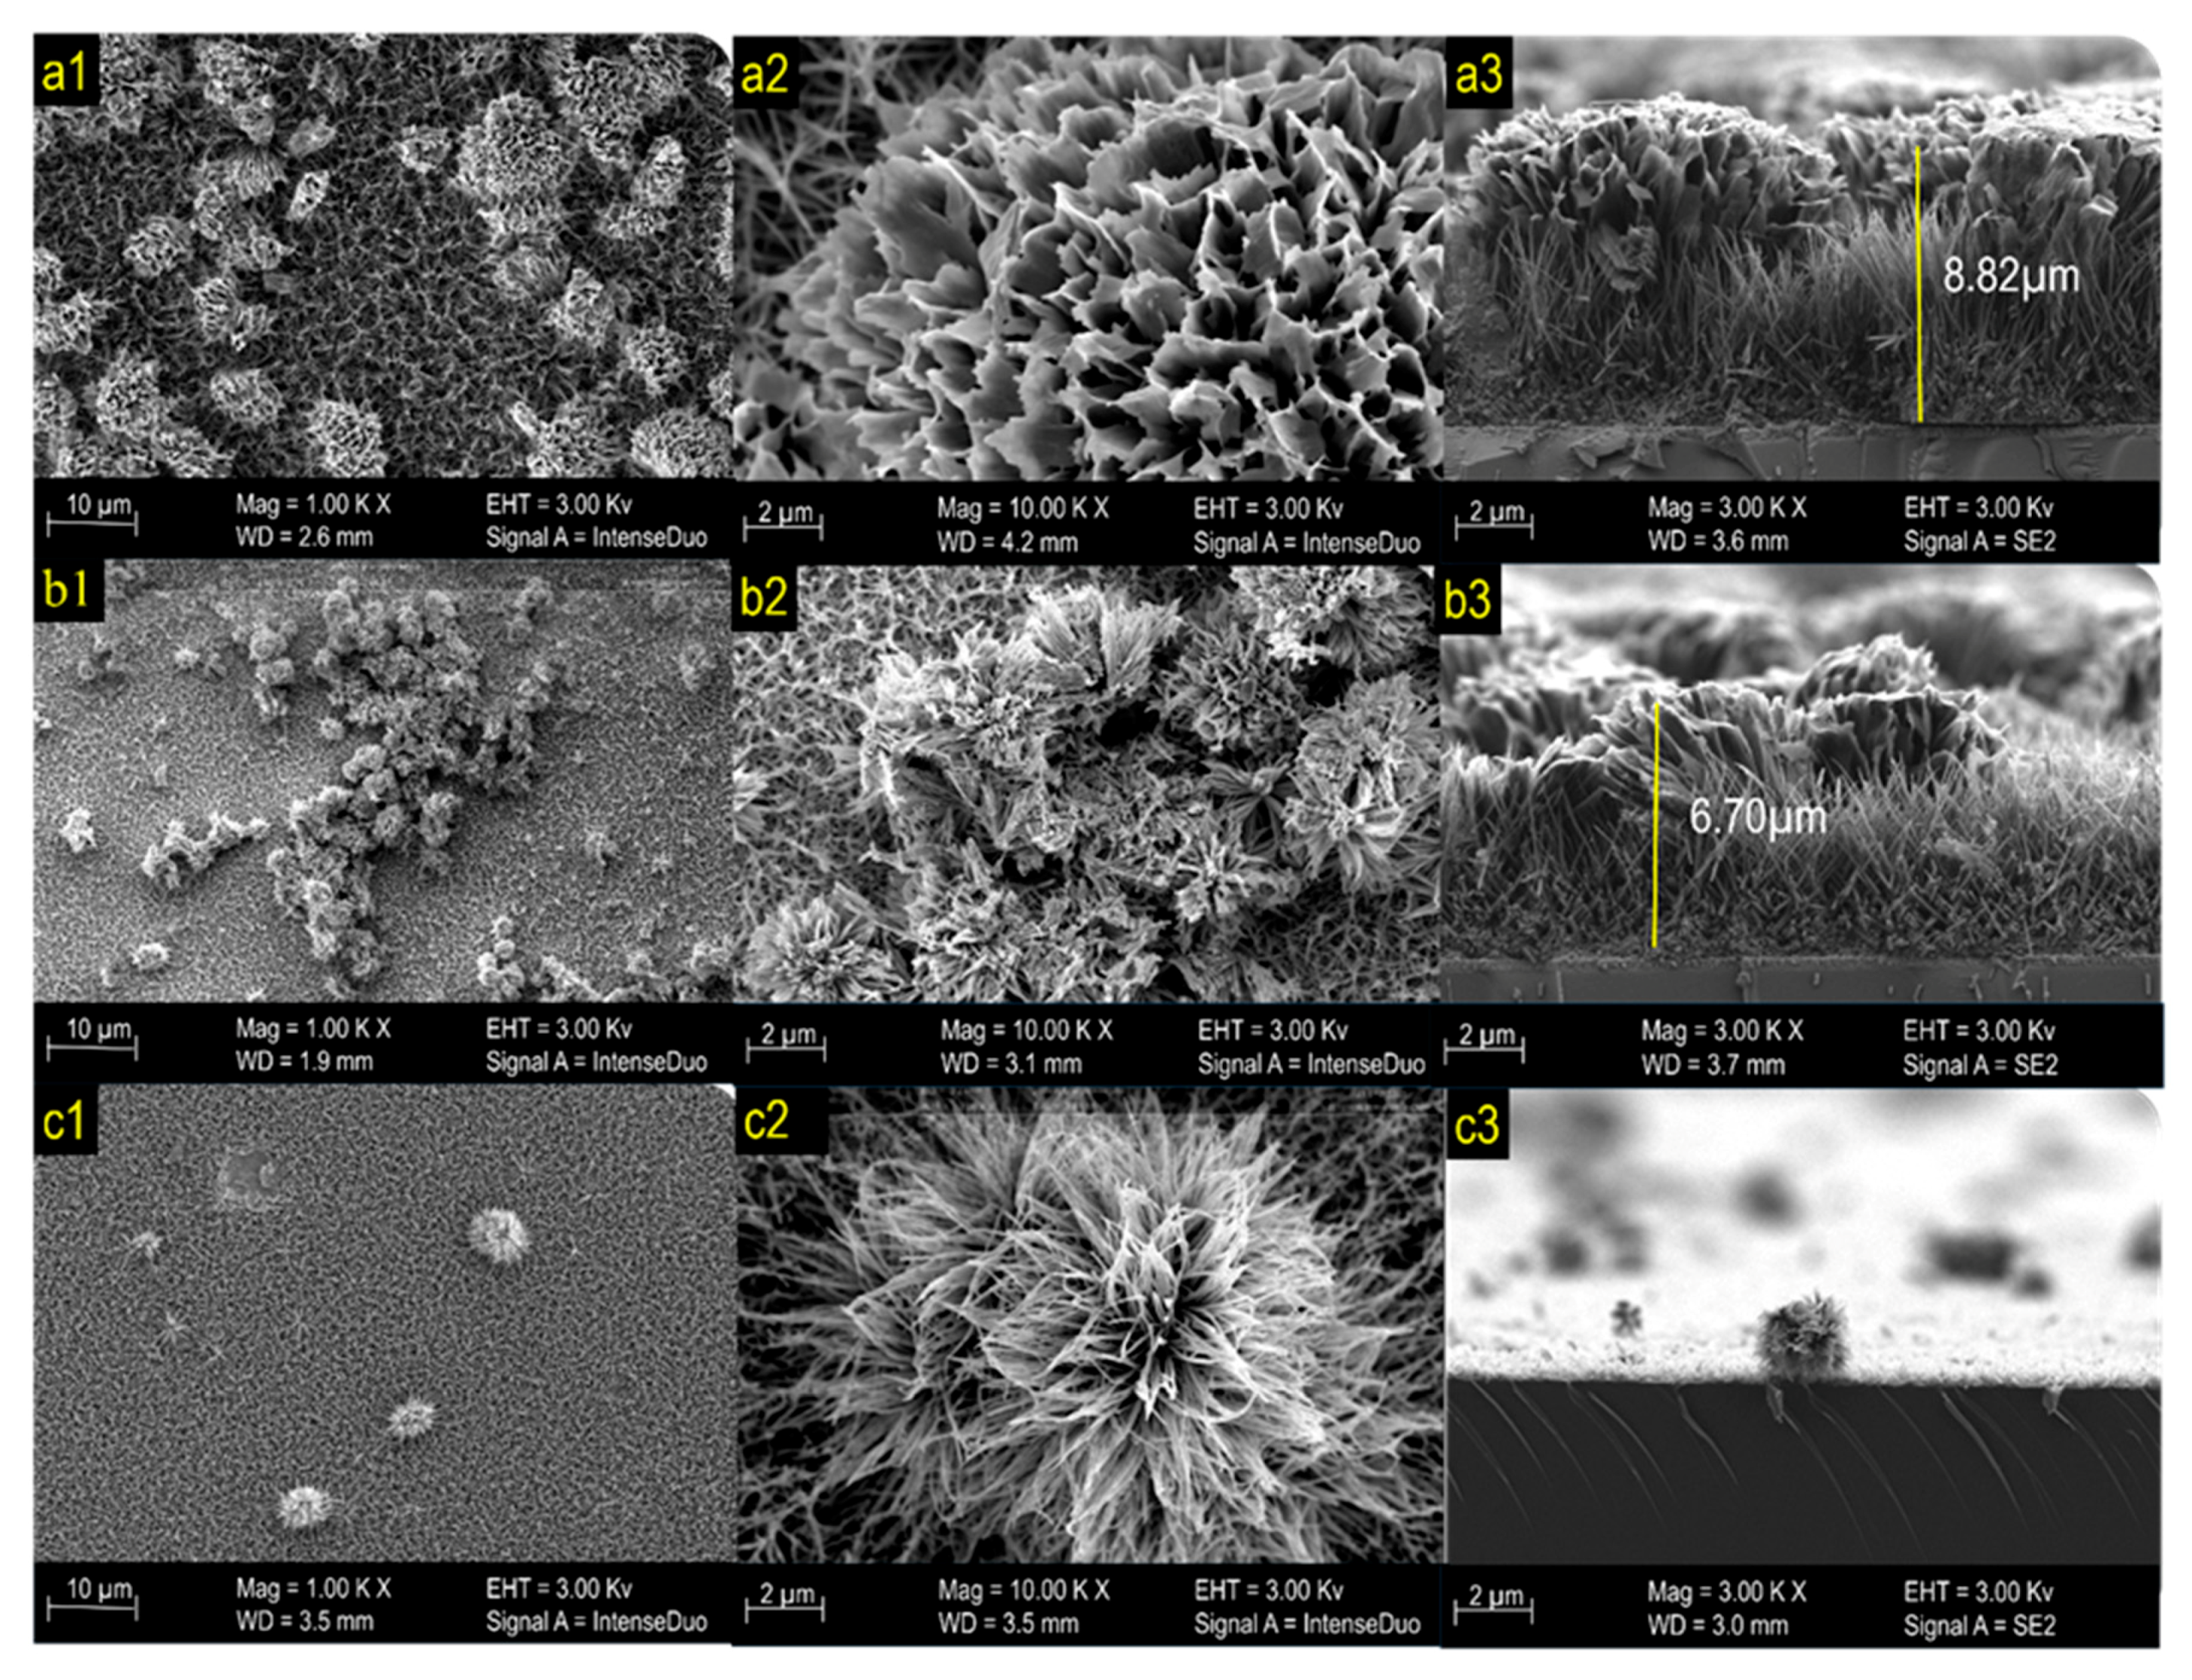
The structure and morphology of the formed thin films were tested and confirmed by FESEM analysis. Figure 3 shows the morphology of the photoelectrode prepared at different annealing temperatures, namely, (a) pre-annealing, (b) 450 °C, and (c) 550 °C. The pre-annealed photoelectrode surface formed a uniformly grown flower-like structure. The high magnification FESEM images in Figure 3a revealed the formation of microscale flowers, which are composed of micro-sized petals with an average thickness of ~6 µm. According to Zhu et al., urchin-like spheres are composed of Co3O4. When the annealing temperature increased to 450 °C, the color of the photoelectrode changed from purple to black. FESEM observation revealed that the Co3O4 produced a microflower that started to decompose (Figure 3b). With increasing annealing temperature, the Co3O4 changed to mixed phase Co3O4·CoO, and the morphology of the sample changed to microflowers with less thick nanowire petals (Figure 3c) [33].
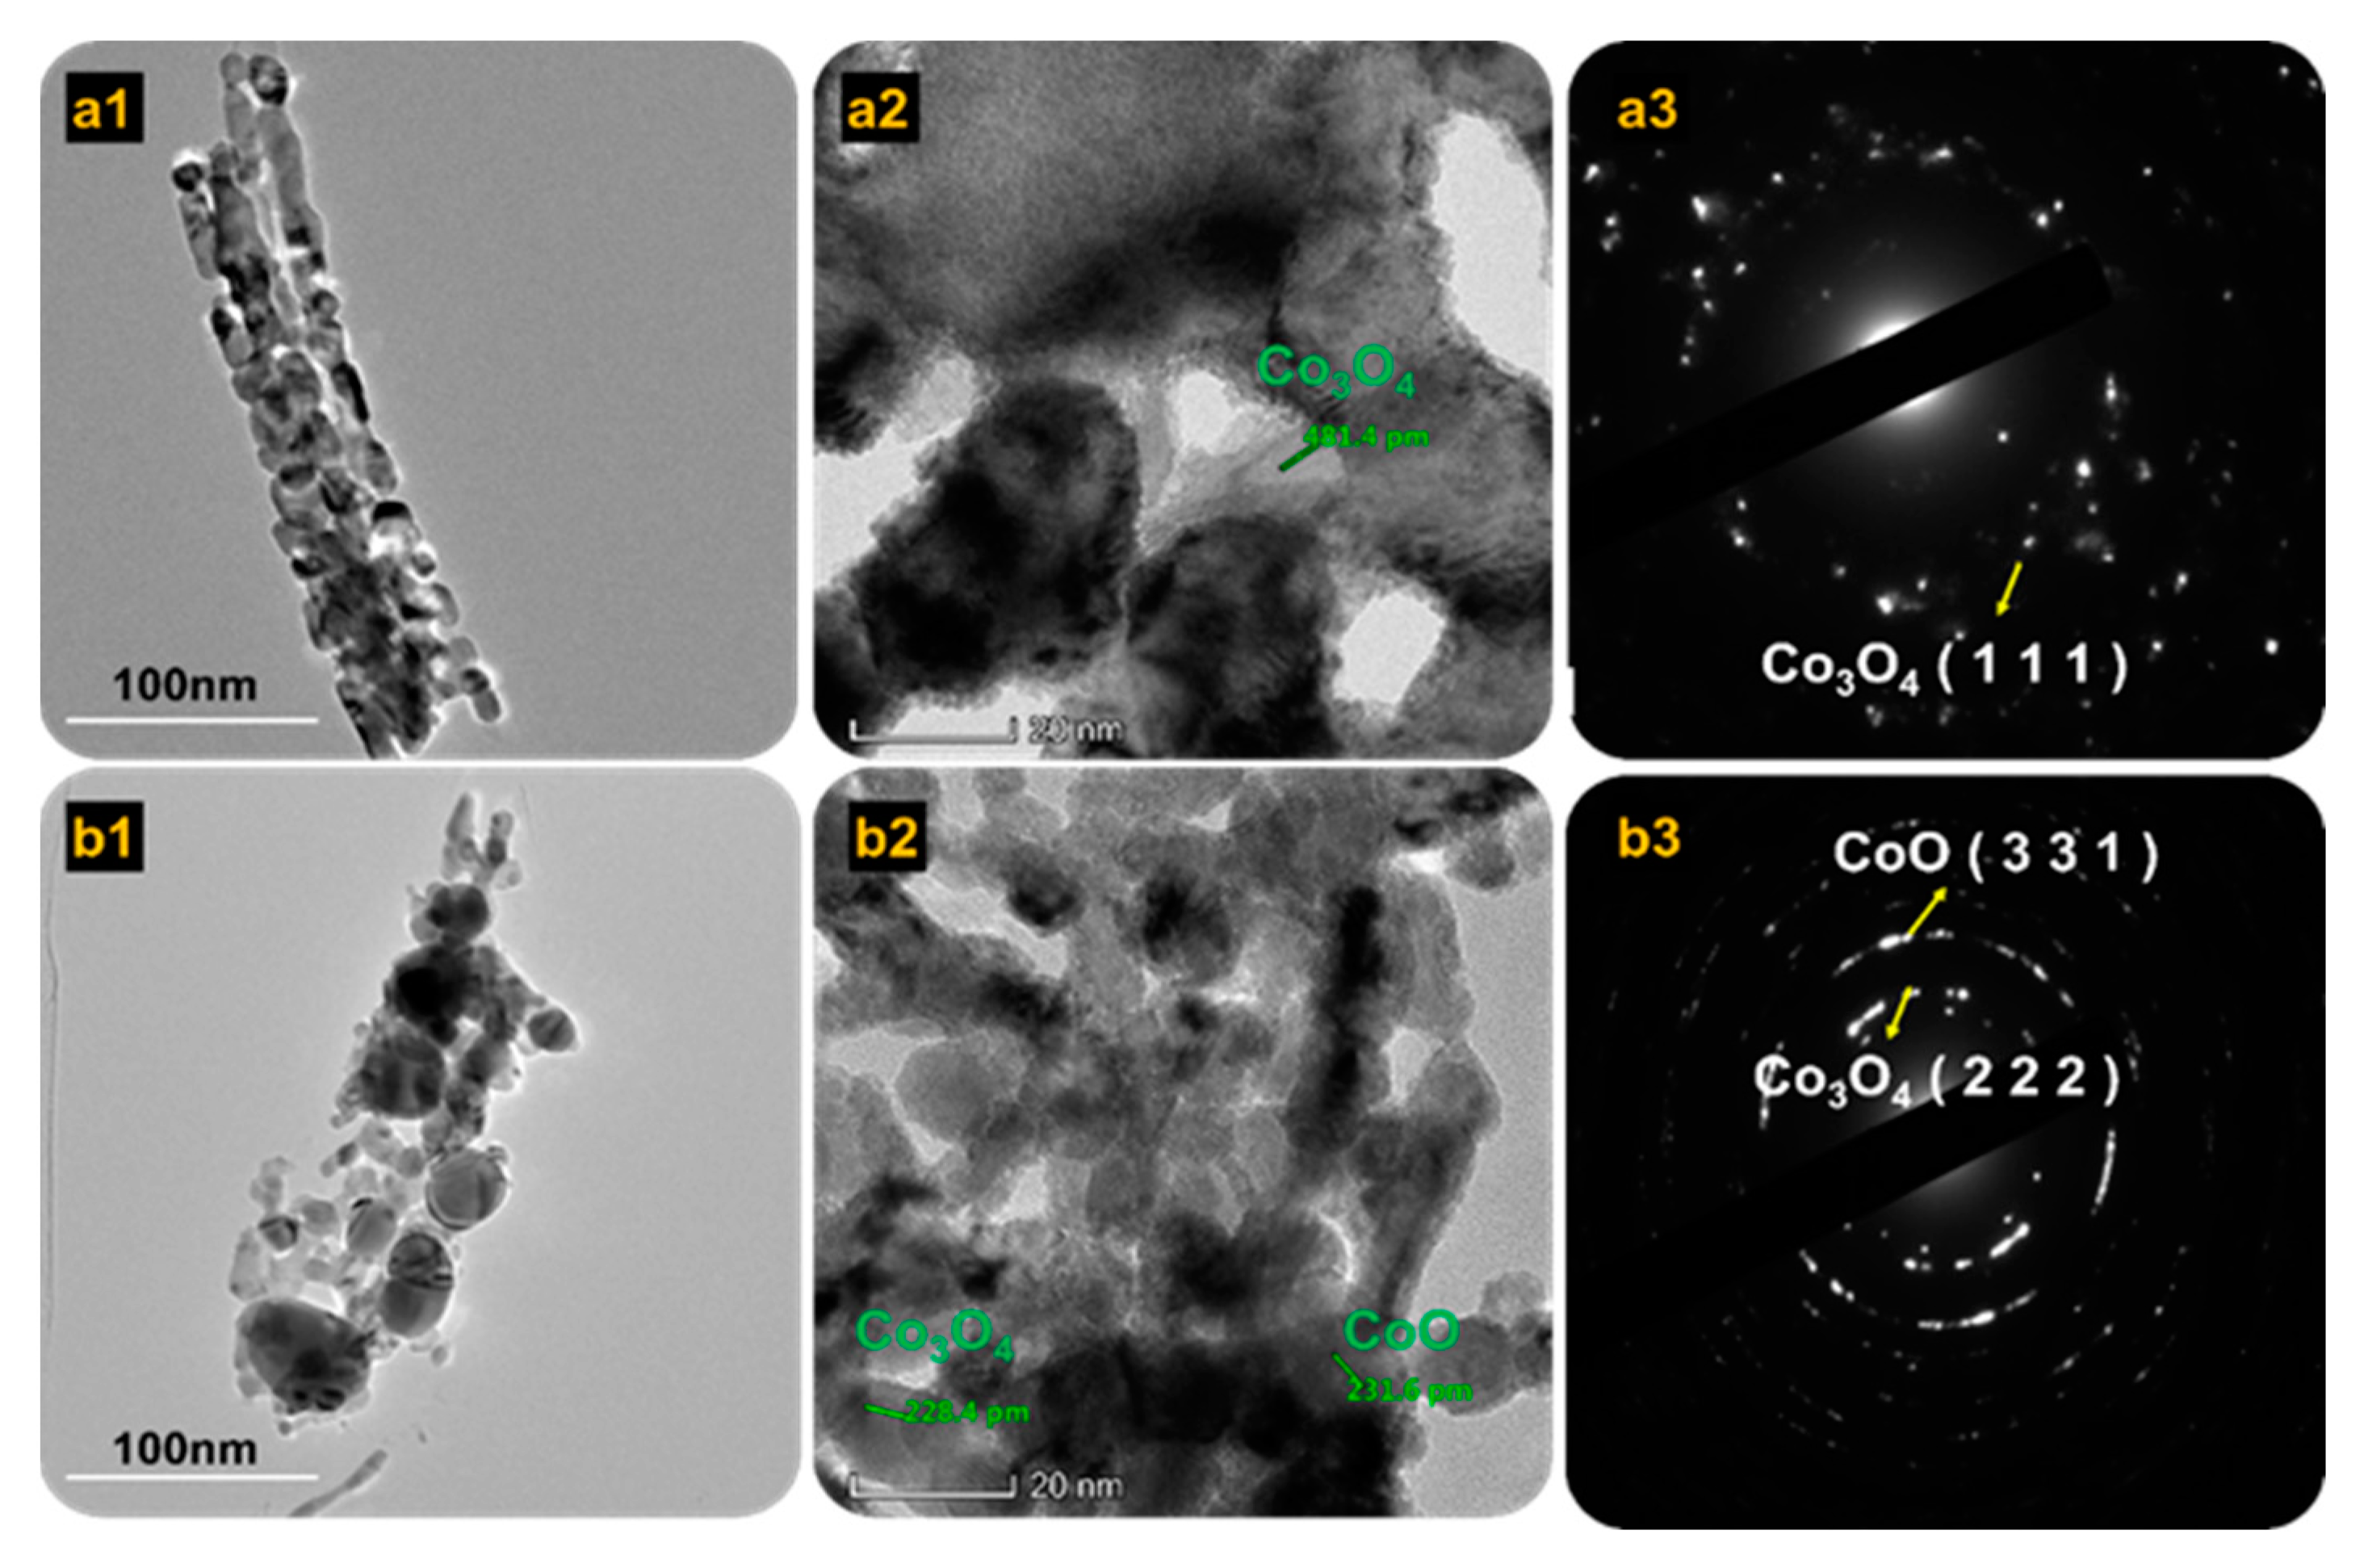
Details of the microstructures of Co3O4 and mixed Co3O4·CoO were examined using HRTEM, and specifics were examined with selected area electron diffraction (SAED) (Figure 4). Lattice fringes of Co3O4 annealed at 450 °C are shown in Figure 4(a1–a3). The SAED of Co3O4 shown in Figure 4(a3) reveals the ring and spot pattern in a well-defined manner, demonstrating that the Co3O4 sample was highly crystalline. However, for the mixed Co3O4·CoO annealed at 550 °C, the SAED showed a small spot that made rings, which were designated as polycrystalline. According to Andrews et al., (1971) each spot arising from brag was reflected from individual crystalline [34]. As shown in Figure 4(b3), a SAED ring demonstrated the presence of a mixed phase that was well-blended at this phase. The first ring indicated Co3O4, whereas the second ring indicated CoO.

3.3. Optical Measurements

The optical properties of the photoelectrode samples were analyzed using a UV-Vis-NIR spectrophotometer. The optical absorption of the prepared photoelectrode samples and their corresponding Kubelka–Munk plots are shown in Figure 5, in which the pre-annealed samples showed an absorption region at 400–600 nm. Accordingly, the corresponding K-M plots exhibited a band gap value of 4.30 eV (Figure 5b). The pre-annealed sample exhibited absorption at much lower wavelengths and a large band gap, because the pre-annealed sample was not activated. For the sample prepared at 450 °C, the intensity of the light absorption was greater than that of the pre-annealed sample, which covered a wider range of the light spectrum, ranging from 200 to 900 nm (Figure 5a). Within this light spectrum range, two main broad peaks were identified, between 200–500 and 580–900 nm. Correspondingly, two main broad peaks were identified with two band gaps of 2.00 and 2.50 eV (Figure 5b). This observation suggested that a higher temperature was required to affect the phase transformation of the pre-annealed sample. This suggestion was supported by the XRD analysis result, in which an identical phase of Co3O4, as identified in the pre-annealed sample, was also detected in the sample prepared at 450 °C. However, after annealing, the band gap values significantly shifted to smaller values. This shifting pattern of the band gap value could be an indication of the intermediate phase transformation. In general, Co3O4 is known as “Co2O3/CoO,” which represents two constituents in the material. Therefore, these constituents might contribute to the creation of two optical absorption peaks. The first band (500–700 nm) can be referred to as the O2− → Co2+ charge transfer process of CoO, whereas the second absorption band (250–500 nm) can be attributed to the O2− → Co2+ charge transfer of Co2O3 [35,36].
As the annealing temperature was increased to 550 °C, the intensity of absorption significantly decreased; only one absorption peak that signaled between 200 and 450 nm remained. Extrapolation of K-M plots on the x-axis found that the band gap value was narrowed to a single band gap value of 3.1 eV (Figure 5b). When the as-prepared Co3O4 was annealed with a nitrogen gas flow, and the temperature was increased, Co2+ was protected against oxidation, thereby ensuring the production of CoO nanowire. Oxygen vacancies occurred during annealing in an oxygen-deficient atmosphere, and this formation was associated with the energy band gap. A narrowing of the band gap was the result of the increase in oxygen vacancies, and hence, the increase in the visible light absorption.

3.4. Photoelectrochemical Testing

3.4.1. The Effect of the Type of Electrolyte on the Photocurrent Generation

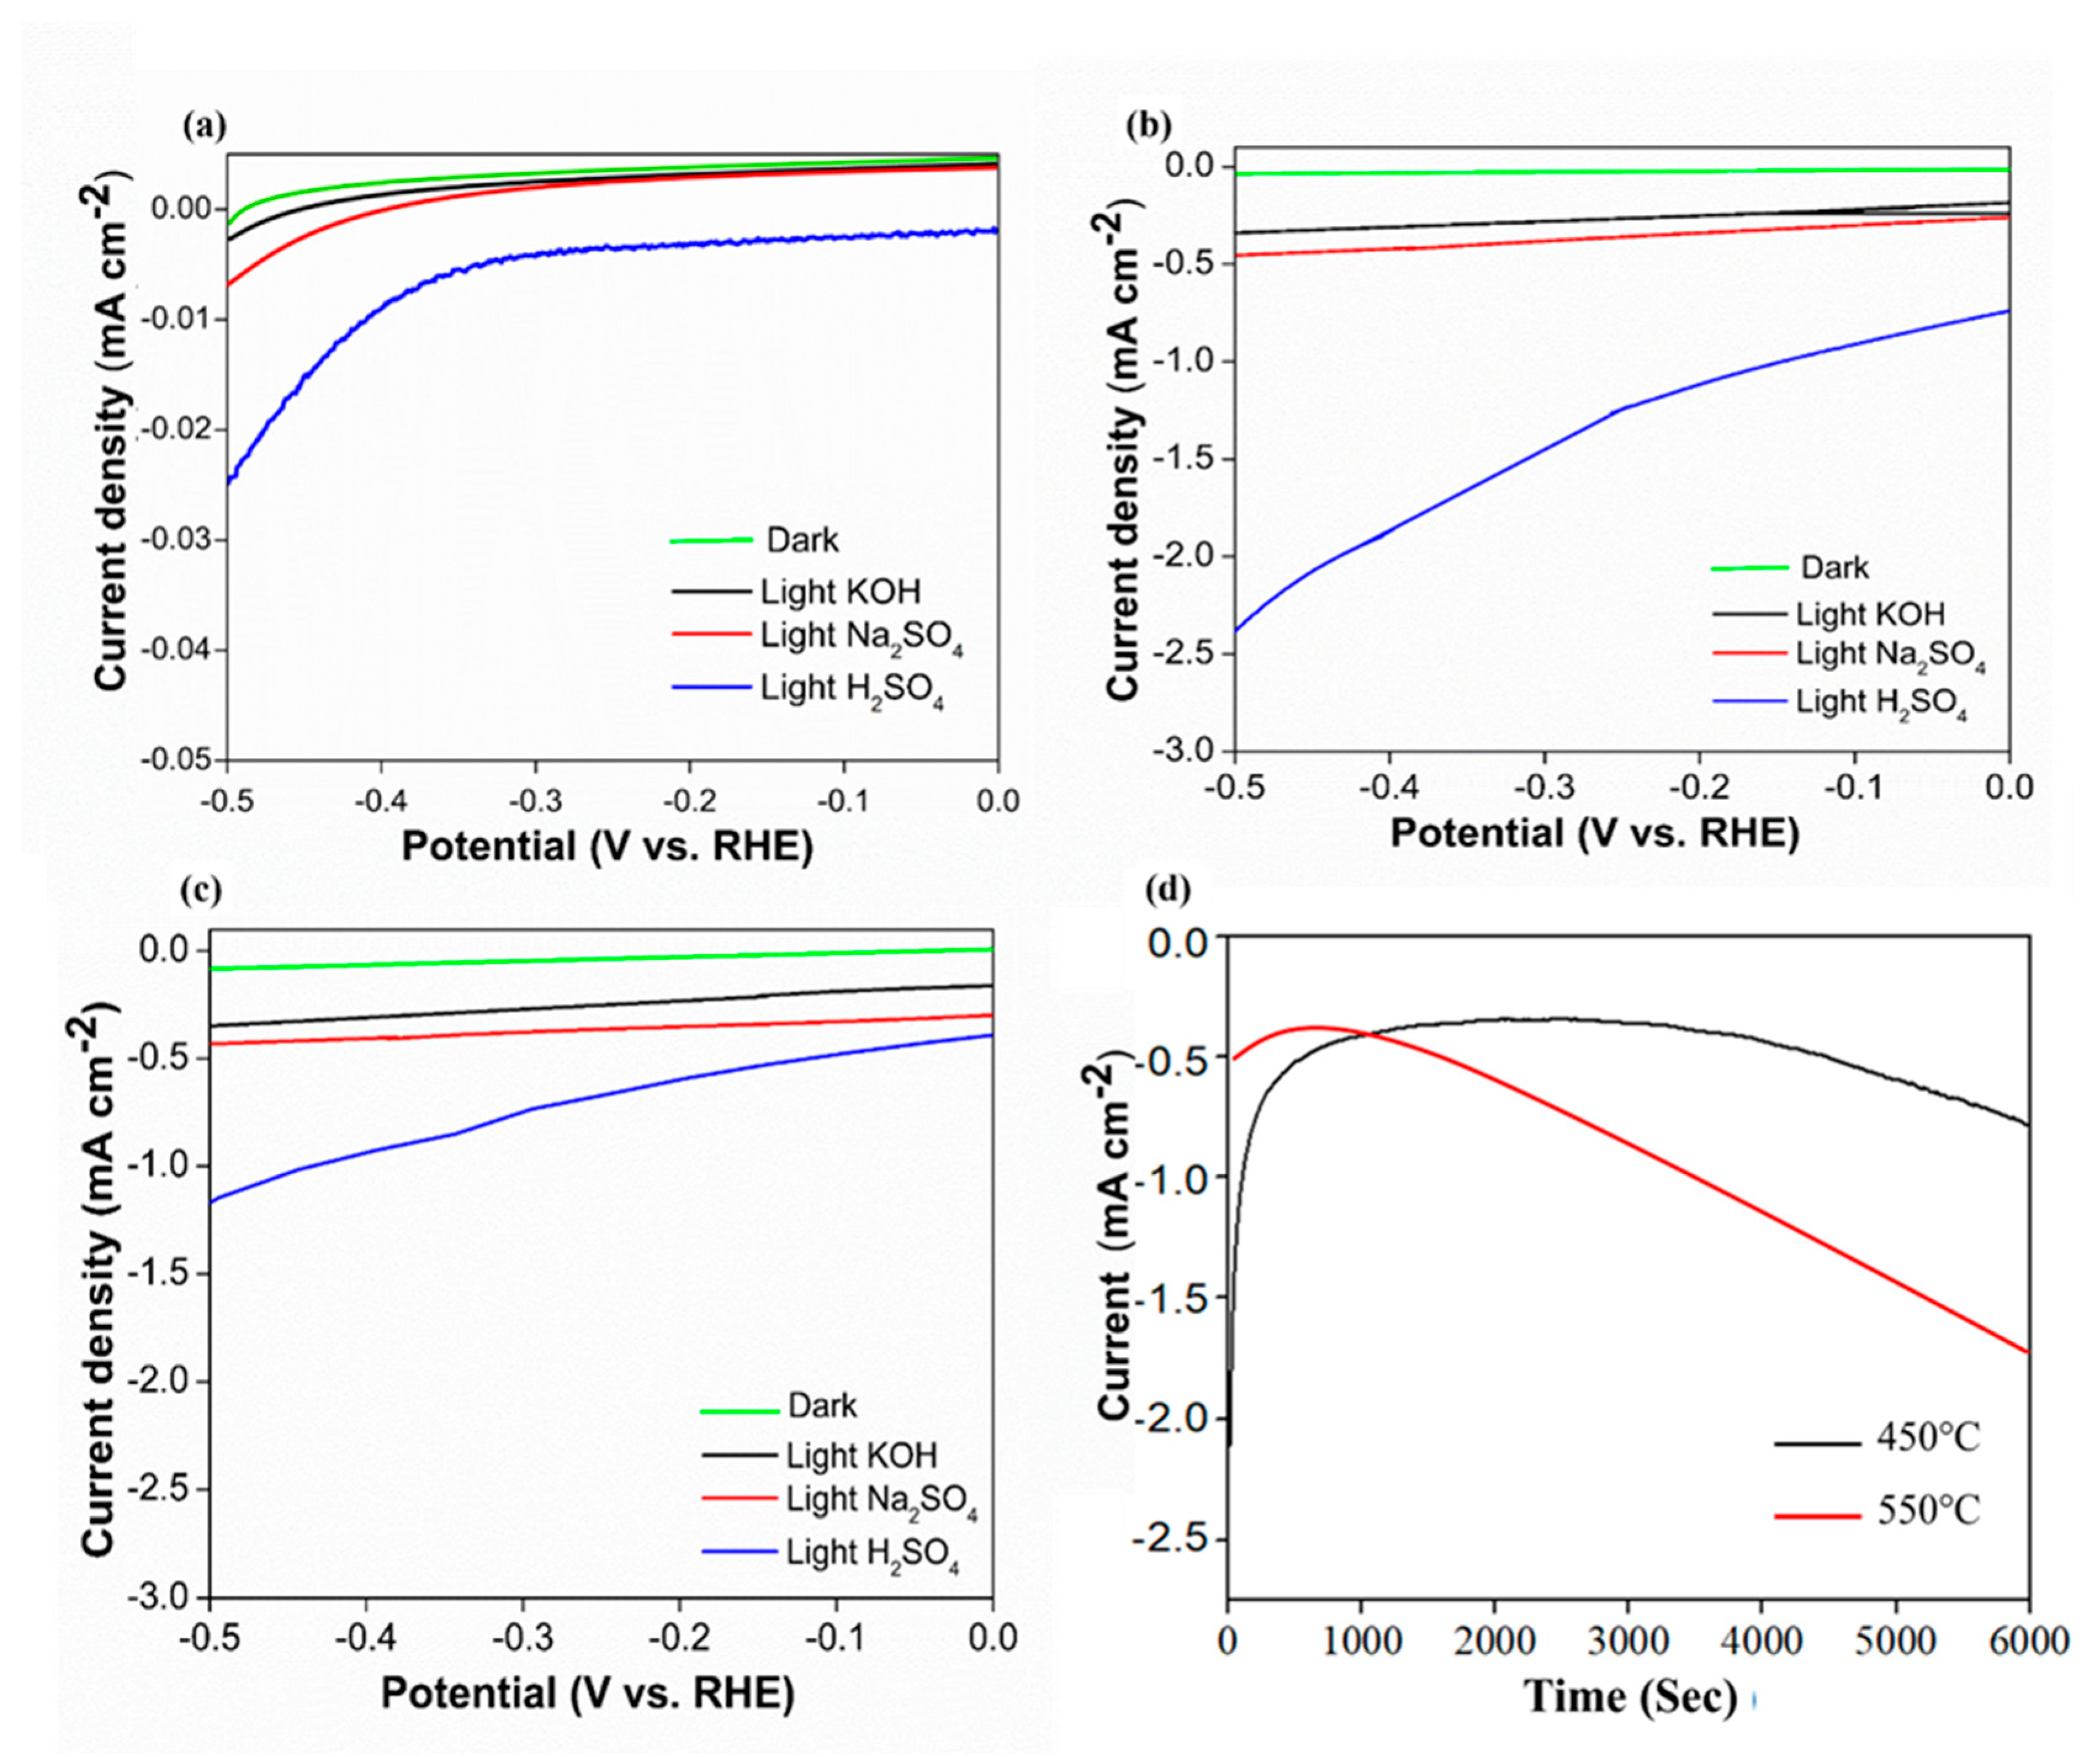
The photoelectrochemical activity of the samples was measured based on different types of electrolytes that represented different pH values, namely, 0.5 M Na2SO4 (pH 6.7), 0.5 M KOH (pH 13), and 0.5 M H2SO4 (pH 1) (Figure 6). Based on the linear sweep voltammetry data, both photocathode samples exhibited similar patterns of photocurrent generation with similar photocurrent density values in all types of electrolytes. Based on Figure 6a–c among the electrolytes under investigation, the photocurrent generation measured in H2SO4 solution was the highest. Photocurrent produced by the pre-annealed sample is ~−0.023 mA cm−2. This photocurrent value was approximately four-fold greater than that achieved in neutral and basic electrolytes. Meanwhile, the highest photocurrent produced by sample 450 °C (~−2.3 mA cm−2 at −0.5 V vs. RHE) was much higher than the Co3O4 pre-annealed sample. According to Zhao et al. (2012) increasing annealing temperature may improve catalytic activity because high temperature may increase the structural defects and the number of active sites, which would have positive impacts on the catalytic activity. However, at sample 550 °C, the photocurrent degreased to ~−1.2 mA cm−2 at −0.5 V vs. RHE because the phase of the sample has changes. These results suggest that H2SO4 electrolyte solution enriched with protons (H+) could sufficiently attract opposite-charged electrons. The present study suggested that the recombination rates of electrons and holes were remarkably reduced, leading to enhanced photocurrent generation. Furthermore, a chronoamperometry stability test was conducted for samples of 450 °C and 550 °C in 0.5 M H2SO4 electrolyte (Figure 6c). Sample 450 °C shows better stability compared to sample 550 °C. Under constant simulated solar illumination and fixed current density of 0.4 mA cm−2, the 450 °C sample was stable until 4000 s of irradiation time before slowly decreasing. Meanwhile, the 550 °C sample was only stable for less than 500 s and decreased drastically.

3.4.2. Electrochemical Impedance Studies

Electrochemical impedance analyses (EIS) of the as-prepared samples were conducted to qualitatively examine the charge transfer resistance (Rct) through Nyquist plotting, as shown in Figure 7a. The pre-annealed sample had high resistance compared to the annealed samples at 450 °C and 550 °C. The Rct was evaluated based on the size of the semicircle, wherein the smallest size of the semicircle represented the lowest Rct. The effect of electrolyte on the Rct was further conducted to the annealed 450 °C sample, where the smallest semicircle was produced when EIS testing was conducted in H2SO4 solution. Correspondingly, the extent of Rct evaluated herein explained the results obtained in the measurement of photocurrent generation, as shown in Figure 6. In this case, the lowest Rct improved the efficiency of charge transfer from the semiconductor to the electrolyte and vice versa, consequently yielding the highest photocurrent.

3.4.3. Mott-Schottky (M-S) Plot

M-S Analysis was done to study the charge carrier concentration of samples. The implementation of M-S analysis on annealed samples of 450 °C and 550 °C was performed in H2SO4 (pH 1). The charge carrier was analyzed from the flat band, wherein flat band is the potential at which the potential drop between the electrode surface and the bulk is zero. This can establish the position of semiconductor energy band with respect to the redox potential. The intrinsic value of flat band (VFB) and carrier density (NA) for both samples can be extracted from the x-intercept and slope of the plot between the reciprocal of the square 1/C2 and the bias potential (Figure 7c), in accordance with the Mott–Schottky equation, as follows (Equation (1)) [37]
1 C 2 =   ( 2 e ε ε o N A ) [ V V F B K b T e ]
where e is the electronic charge, ε is the relative permittivity of CoO (12.9), εo is the permittivity of vacuum, Kb is Boltzmann’s constant, and T is the absolute temperature [38]. A negative slope from all samples implied a p-type semiconductor. The extrapolation of slopes from the M-S plot (Figure 7) when integrated into the gradient of Equation (1) gives the NA. The interception of slopes at x-axis represents the VFB. In this case, the calculated value of NA was 1.24 × 10¹¹ and 3.99 × 10¹⁶ for 450 °C and 550 °C samples.
However, the valence band (VB) of the samples was determined using the following equation (Equation (2))
E F B E V B =   k B T ln N V N A
where NV is the effective density of states in the valence band (VB). The NV can be expressed as follows (Equation (3))
N V = 2 ( 2 π m * k B T h 2 ) 3 2                
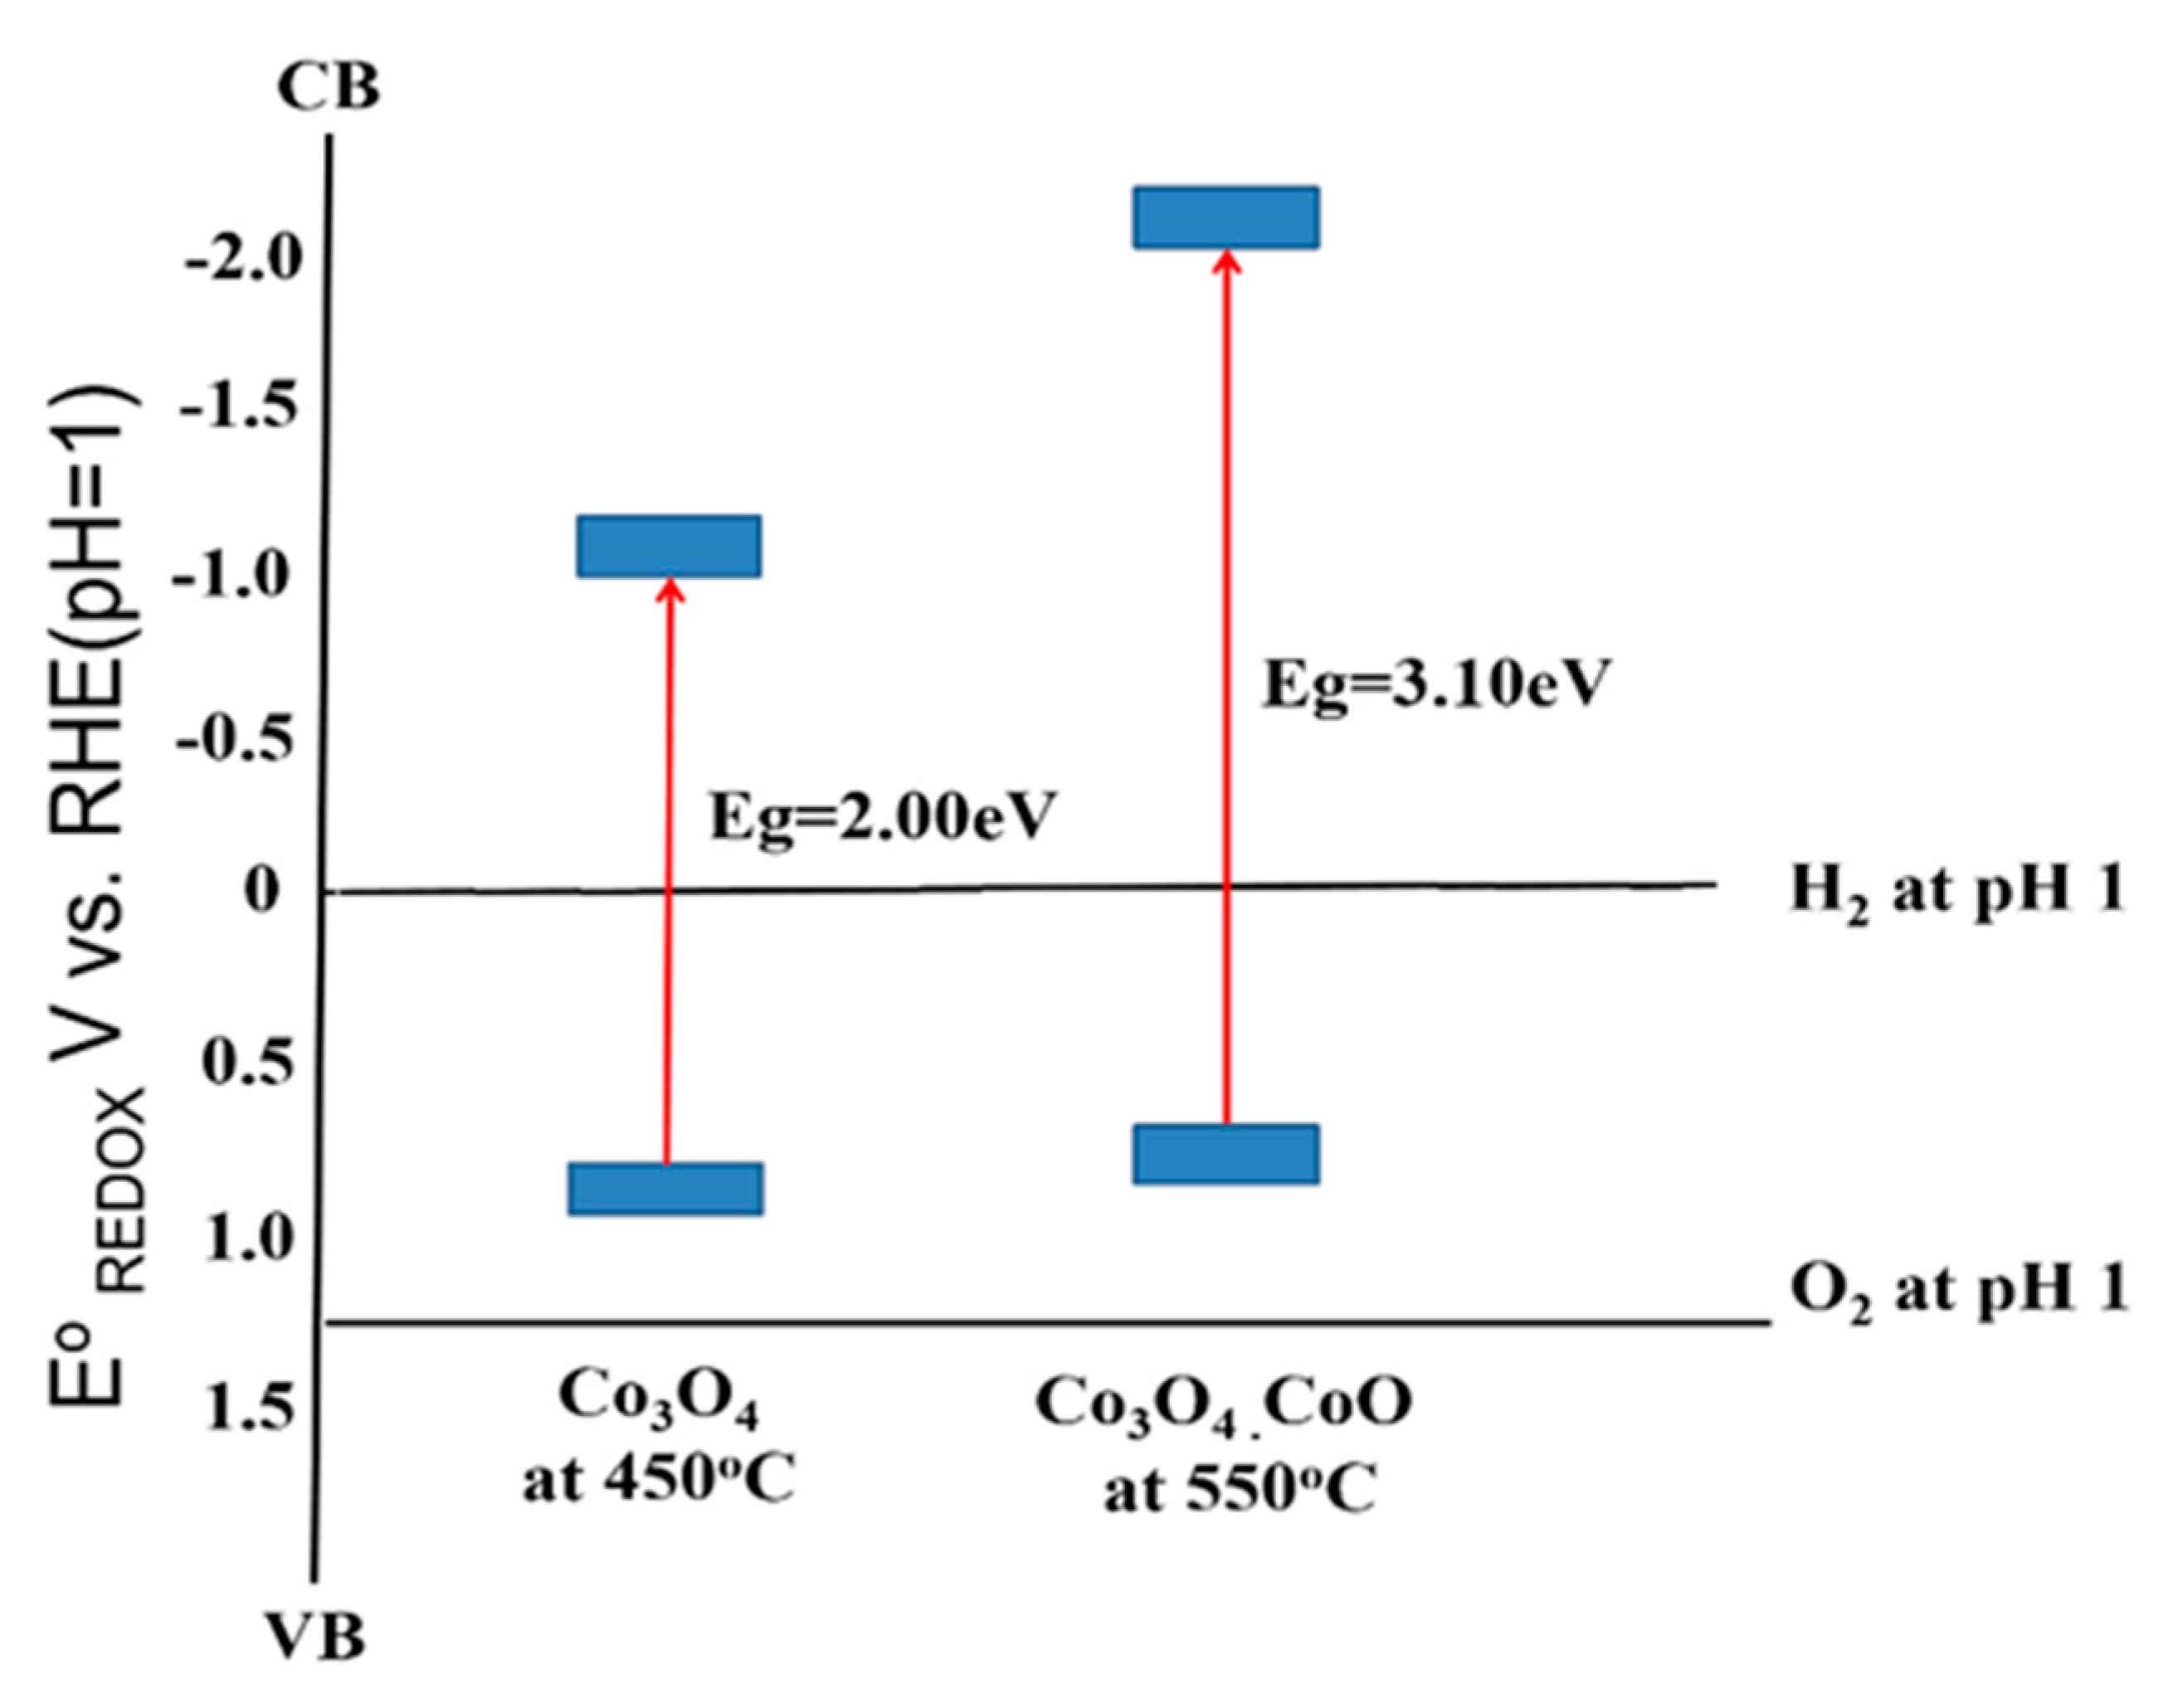
Incorporating the band gap energy (Eg) determined earlier (Figure 7), the conduction band (CB) of the samples can be determined [39]. The analyzed data of VFB, VB, Eg, and CB are arranged as depicted in Figure 8. For this purpose, the potential measurements in Ag/AgCl were converted to the RHE using the following equation (Equation (4))
E RHE = E Ag / AgCl +   E Ag / Agcl 0 +   0.059 pH
where     E Ag / AgCl 0 = 0.197   V at 25 °C.
To electrochemically split the water molecule, the band edges of the photoelectrode need to be in straddle position to the water molecule redox potential, which means the CB of the material should lie at a more negative potential than the water reduction potential. Meanwhile, the VB position should lie at a more positive potential to the water oxidation potential. Based on the calculation, the resultant band edges of CB and VB of both samples are as illustrated in Figure 8. The energy band structure of sample prepared at 450 °C (Co3O4) is shown in Figure 8; the CB and VB are −1.04 eV and 0.98 eV. The band edges in this study were found at the more negative potential of our previous study; the CB and VB of Co3O4 are estimated to be −0.55 and 1.10 eV, respectively [12]. Both the CB and VB located were at a more negative potential of H+ to H2 and oxidation potential of H2O to O2, respectively [35]. A similar trend was also found in the sample prepared at 550 °C. Given that the bandgap of the sample prepared at 550 °C was bigger than the sample prepared at 450 °C, the CB position falls at more negative potential than the 450 °C sample. Meanwhile, the VB position is not much different. This result showed that both cobalt oxides resulting in this study do not straddle to the redox potential of water splitting, but it can be used to produce hydrogen only [40].

4. Conclusions

This work provided the necessary support for the direct growth of cobalt oxide on FTO thin films, the effect of annealing on the phase transformation of cobalt oxide, and the effect of electrolyte on the PEC water-splitting application. The annealing temperature affected the phase of cobalt oxide thin films and changed the morphology from microflower Co3O4 to urchin-like Co3O4/CoO mixed phase. A single phase of CoO could not be produced by direct growth on FTO through the hydrothermal method due to the sensitivity of FTO to temperatures higher than 550 °C. In addition, the electrolyte affected the performance of PEC water splitting. H2SO4 resulted in a higher photocurrent density than Na2SO4 and KOH. According to the measured photocurrent generation, the highest value was contributed by the single-phase sample of Co3O4 from the annealed at 450 °C. The stability test also showed that the Co3O4 from the annealed at 450 °C is more stable than the mixed-phase produced by the annealed at 550 °C. This study found that the bandgap and band edges of the cobalt oxide thin films produced from the direct hydrothermal method slightly different from the powder results, in which powder cobalt oxide produces a more appropriate band structure to the PEC water-splitting application.

Author Contributions

Conceptualization, K.A.; methodology, K.A. and S.N.F.M.; investigation, S.N.F.M.; formal analysis, S.N.F.M., M.N.I.S. and K.A.; resources and supervision, K.A., L.J.M., M.B.K.; writing—original draft preparation, S.N.F.M.; writing—review and editing, K.A. All authors have read and agreed to the published version of the manuscript.

Funding

This research received funding from The Ministry of Education, Malaysia, through the FRGS/1/2019/STG01/UKM/03/2 Research grant and Universiti Kebangsaan Malaysia for Publication Acceleration Fund PP-SELFUEL-2020.

Institutional Review Board Statement

Not applicable.

Informed Consent Statement

Not applicable.

Data Availability Statement

Data is contained within the article.

Conflicts of Interest

The authors declare no conflict of interest.

References

  1. Staffell, I.; Scamman, D.; Velazquez Abad, A.; Balcombe, P.; Dodds, P.E.; Ekins, P.; Shah, N.; Ward, K.R. The role of hydrogen and fuel cells in the global energy system. Energy Environ. Sci. 2019, 12, 463–491. [Google Scholar] [CrossRef] [Green Version]
  2. Joy, J.; Mathew, J.; George, S.C. Nanomaterials for photoelectrochemical water splitting–review. Int. J. Hydrogen Energy 2018, 43, 4804–4817. [Google Scholar] [CrossRef]
  3. Rosman, N.N.; Mohamad Yunus, R.; Jeffery Minggu, L.; Arifin, K.; Salehmin, M.N.I.; Mohamed, M.A.; Kassim, M.B. Photocatalytic properties of two-dimensional graphene and layered transition-metal dichalcogenides based photocatalyst for photoelectrochemical hydrogen generation: An overview. Int. J. Hydrogen Energy 2018, 43, 18925–18945. [Google Scholar] [CrossRef]
  4. Jiang, C.; Moniz, S.J.A.; Wang, A.; Zhang, T.; Tang, J. Photoelectrochemical devices for solar water splitting–materials and challenges. Chem. Soc. Rev. 2017, 46, 4645–4660. [Google Scholar] [CrossRef] [Green Version]
  5. Sathre, R.; Greenblatt, J.B.; Walczak, K.; Sharp, I.D.; Stevens, J.C.; Ager, J.W.; Houle, F.A. Opportunities to improve the net energy performance of photoelectrochemical water-splitting technology. Energy Environ. Sci. 2016, 9, 803–819. [Google Scholar] [CrossRef] [Green Version]
  6. Bin Adnan, M.A.; Arifin, K.; Minggu, L.J.; Kassim, M.B. Titanate-based perovskites for photochemical and photoelectrochemical water splitting applications: A review. Int. J. Hydrogen Energy 2018, 43, 23209–23220. [Google Scholar] [CrossRef]
  7. Dong, Z.; Ding, D.; Li, T.; Ning, C. Ni-doped TiO2 nanotubes photoanode for enhanced photoelectrochemical water splitting. Appl. Surf. Sci. 2018, 443, 321–328. [Google Scholar] [CrossRef]
  8. Arifin, K.; Yunus, R.M.; Minggu, L.J.; Kassim, M.B. Improvement of TiO2 nanotubes for photoelectrochemical water splitting: Review. Int. J. Hydrogen Energy 2020. [CrossRef]
  9. Hong, T.; Liu, Z.; Zheng, X.; Zhang, J.; Yan, L. Efficient photoelectrochemical water splitting over Co3O4 and Co3O4/Ag composite structure. Appl. Catal. B 2017, 202, 454–459. [Google Scholar] [CrossRef]
  10. Ng, K.H.; Minggu, L.J.; Mark-Lee, W.F.; Arifin, K.; Jumali, M.H.H.; Kassim, M.B. A new method for the fabrication of a bilayer WO3/Fe2O3 photoelectrode for enhanced photoelectrochemical performance. Mater. Res. Bull. 2018, 98, 47–52. [Google Scholar] [CrossRef]
  11. Dang, T.C.; Le, H.C.; Pham, D.L.; Nguyen, S.H.; Nguyen, T.T.O.; Nguyen, T.T.; Nguyen, T.D. Synthesis of perovskite Cs2SnI6 film via the solution processed approach: First study on the photoelectrochemical water splitting application. J. Alloys Compd. 2019, 805, 847–851. [Google Scholar] [CrossRef]
  12. Moridon, S.N.F.; Salehmin, M.I.; Mohamed, M.A.; Arifin, K.; Minggu, L.J.; Kassim, M.B. Cobalt oxide as photocatalyst for water splitting: Temperature-dependent phase structures. Int. J. Hydrogen Energy 2019, 44, 25495–25504. [Google Scholar] [CrossRef]
  13. Dong, G.; Hu, H.; Huang, X.; Zhang, Y.; Bi, Y. Rapid activation of Co3O4 cocatalysts with oxygen vacancies on TiO2 photoanodes for efficient water splitting. J. Mater. Chem. 2018, 6, 21003–21009. [Google Scholar] [CrossRef]
  14. Liao, L.; Zhang, Q.; Su, Z.; Zhao, Z.; Wang, Y.; Li, Y.; Lu, X.; Wei, D.; Feng, G.; Yu, Q.; et al. Efficient solar water-splitting using a nanocrystalline CoO photocatalyst. Nat. Nanotechnol. 2014, 9, 69–73. [Google Scholar] [CrossRef] [PubMed]
  15. Liu, Z.; Ma, C.; Cai, Q.; Hong, T.; Guo, K.; Yan, L. Promising cobalt oxide and cobalt oxide/silver photocathodes for photoelectrochemical water splitting. Sol. Energy Mater. Sol. Cells 2017, 161, 46–51. [Google Scholar] [CrossRef]
  16. Martínez-Gil, M.; Cabrera-German, D.; Pintor-Monroy, M.; García-Valenzuela, J.; Cota-Leal, M.; De la Cruz, W.; Quevedo-Lopez, M.; Pérez-Salas, R.; Sotelo-Lerma, M. Effect of annealing temperature on the thermal transformation to cobalt oxide of thin films obtained via chemical solution deposition. Mater. Sci. Semicond. Process. 2020, 107, 104825. [Google Scholar] [CrossRef]
  17. El Bachiri, A.; Soussi, L.; Karzazi, O.; Louardi, A.; Rmili, A.; Erguig, H.; El Idrissi, B. Electrochromic and photoluminescence properties of cobalt oxide thin films prepared by spray pyrolysis. Spectrosc. Lett. 2019, 52, 66–73. [Google Scholar] [CrossRef]
  18. Wang, X.; Hu, A.; Meng, C.; Wu, C.; Yang, S.; Hong, X. Recent advance in Co3O4 and Co3O4-containing electrode materials for high-performance supercapacitors. Molecules 2020, 25, 269. [Google Scholar] [CrossRef] [PubMed] [Green Version]
  19. Jirátová, K.; Perekrestov, R.; Dvořáková, M.; Balabánová, J.; Topka, P.; Koštejn, M.; Olejníček, J.; Čada, M.; Hubička, Z.; Kovanda, F. Cobalt Oxide Catalysts in the Form of Thin Films Prepared by Magnetron Sputtering on Stainless-Steel Meshes: Performance in Ethanol Oxidation. Catalysts 2019, 9, 806. [Google Scholar] [CrossRef] [Green Version]
  20. Babar, P.; Lokhande, A.; Pawar, B.; Gang, M.; Jo, E.; Go, C.; Suryawanshi, M.; Pawar, S.; Kim, J.H. Electrocatalytic performance evaluation of cobalt hydroxide and cobalt oxide thin films for oxygen evolution reaction. Appl. Surf. Sci. 2018, 427, 253–259. [Google Scholar] [CrossRef]
  21. Dvořáková, M.; Perekrestov, R.; Kšírová, P.; Balabánová, J.; Jirátová, K.; Maixner, J.; Topka, P.; Rathouský, J.; Koštejn, M.; Čada, M. Preparation of cobalt oxide catalysts on stainless steel wire mesh by combination of magnetron sputtering and electrochemical deposition. Catal. Today 2019, 334, 13–23. [Google Scholar] [CrossRef]
  22. Deori, K.; Deka, S. Morphology oriented surfactant dependent CoO and reaction time dependent Co3O4 nanocrystals from single synthesis method and their optical and magnetic properties. CrystEngComm 2013, 15, 8465–8474. [Google Scholar] [CrossRef]
  23. Chou, S.-C.; Tso, K.-C.; Hsieh, Y.-C.; Sun, B.-Y.; Lee, J.-F.; Wu, P.-W. Facile Synthesis of Co3O4@CoO@Co Gradient Core@Shell Nanoparticles and Their Applications for Oxygen Evolution and Reduction in Alkaline Electrolytes. Materials 2020, 13, 2703. [Google Scholar] [CrossRef] [PubMed]
  24. Prabaharan, D.D.M.; Sadaiyandi, K.; Mahendran, M.; Sagadevan, S. Precipitation method and characterization of cobalt oxide nanoparticles. Appl. Phys. A 2017, 123, 264. [Google Scholar] [CrossRef]
  25. Al-Tuwirqi, R.M.; Al-Ghamdi, A.A.; Al-Hazmi, F.; Alnowaiser, F.; Al-Ghamdi, A.A.; Aal, N.A.; El-Tantawy, F. Synthesis and physical properties of mixed Co3O4/CoO nanorods by microwave hydrothermal technique. Superlattices Microstruct. 2011, 50, 437–448. [Google Scholar] [CrossRef]
  26. Godillot, G.; Guerlou-Demourgues, L.; Croguennec, L.; Shaju, K.M.; Delmas, C. Effect of Temperature on Structure and Electronic Properties of Nanometric Spinel-Type Cobalt Oxides. J. Phys. Chem. C 2013, 117, 9065–9075. [Google Scholar] [CrossRef]
  27. Mapelli, C.; Casalino, C.; Strada, A.; Gruttadauria, A.; Barella, S.; Mombelli, D.; Longaretti, E.; Perego, F. Comparison of the combined oxidation and sulphidation behavior of nickel- and cobalt-based alloys at high temperature. J. Mater. Res. Technol 2020, 9, 15679–15692. [Google Scholar] [CrossRef]
  28. Balouria, V.; Samanta, S.; Singh, A.; Debnath, A.K.; Mahajan, A.; Bedi, R.K.; Aswal, D.K.; Gupta, S.K. Chemiresistive gas sensing properties of nanocrystalline Co3O4 thin films. Sens. Actuators B Chem. 2013, 176, 38–45. [Google Scholar] [CrossRef]
  29. Chen, G.; Lu, B.; Cui, X.; Xiao, J. Effects of Deposition and Annealing Temperature on the Structure and Optical Band Gap of MoS2 Films. Materials 2020, 13, 5515. [Google Scholar] [CrossRef] [PubMed]
  30. Jadhav, H.; Suryawanshi, S.; More, M.A.; Sinha, S. Field emission study of urchin like nanostructured cobalt oxide films prepared by pulsed laser deposition. J. Alloys Compd. 2018, 744, 281–288. [Google Scholar] [CrossRef]
  31. Cabrera-German, D.; Gomez-Sosa, G.; Herrera-Gomez, A. Accurate peak fitting and subsequent quantitative composition analysis of the spectrum of Co 2p obtained with Al Kα radiation: I: Cobalt spinel. Surf. Interface Anal. 2016, 48, 252–256. [Google Scholar] [CrossRef]
  32. Díaz-Fernández, D.; Méndez, J.; Yubero, F.; Domínguez-Cañizares, G.; Gutiérrez, A.; Soriano, L. Study of the early stages of growth of Co oxides on oxide substrates. Surf. Interface Anal. 2014, 46, 975–979. [Google Scholar] [CrossRef]
  33. Zhu, C.; Saito, G.; Akiyama, T. Urchin-like hollow-structured cobalt oxides with excellent anode performance for lithium-ion batteries. J. Alloys Compd. 2015, 646, 639–646. [Google Scholar] [CrossRef] [Green Version]
  34. William, A.K.; John, D.D.; Robert, K.S. Interpretation of Electron Diffraction Patterns, 202nd ed.; Springer: Berlin/Heidelberg, Germany, 1971. [Google Scholar] [CrossRef]
  35. Farhadi, S.; Safabakhsh, J.; Zaringhadam, P. Synthesis, characterization, and investigation of optical and magnetic properties of cobalt oxide (Co3O4) nanoparticles. J. Nanostruct. Chem. 2013, 3, 69. [Google Scholar] [CrossRef] [Green Version]
  36. Wang, G.; Shen, X.; Horvat, J.; Wang, B.; Liu, H.; Wexler, D.; Yao, J. Hydrothermal Synthesis and Optical, Magnetic, and Supercapacitance Properties of Nanoporous Cobalt Oxide Nanorods. J. Phys. Chem. C 2009, 113, 4357–4361. [Google Scholar] [CrossRef]
  37. Lu, C.; Qi, L.; Yang, J.; Zhang, D.; Wu, N.; Ma, J. Simple Template-Free Solution Route for the Controlled Synthesis of Cu(OH)2 and CuO Nanostructures. J. Phys. Chem. B 2004, 108, 17825–17831. [Google Scholar] [CrossRef]
  38. Rao, K.V.; Smakula, A. Dielectric Properties of Cobalt Oxide, Nickel Oxide, and Their Mixed Crystals. J. Appl. Phys. 1965, 36, 2031–2038. [Google Scholar] [CrossRef]
  39. Read, C.G.; Park, Y.; Choi, K.-S. Electrochemical Synthesis of p-Type CuFeO2 Electrodes for Use in a Photoelectrochemical Cell. J. Phys. Chem. Lett. 2012, 3, 1872–1876. [Google Scholar] [CrossRef]
  40. Mohamed Reda, G.; Fan, H.; Tian, H. Room-temperature solid state synthesis of Co3O4/ZnO p–n heterostructure and its photocatalytic activity. Adv. Powder Technol. 2017, 28, 953–963. [Google Scholar] [CrossRef]
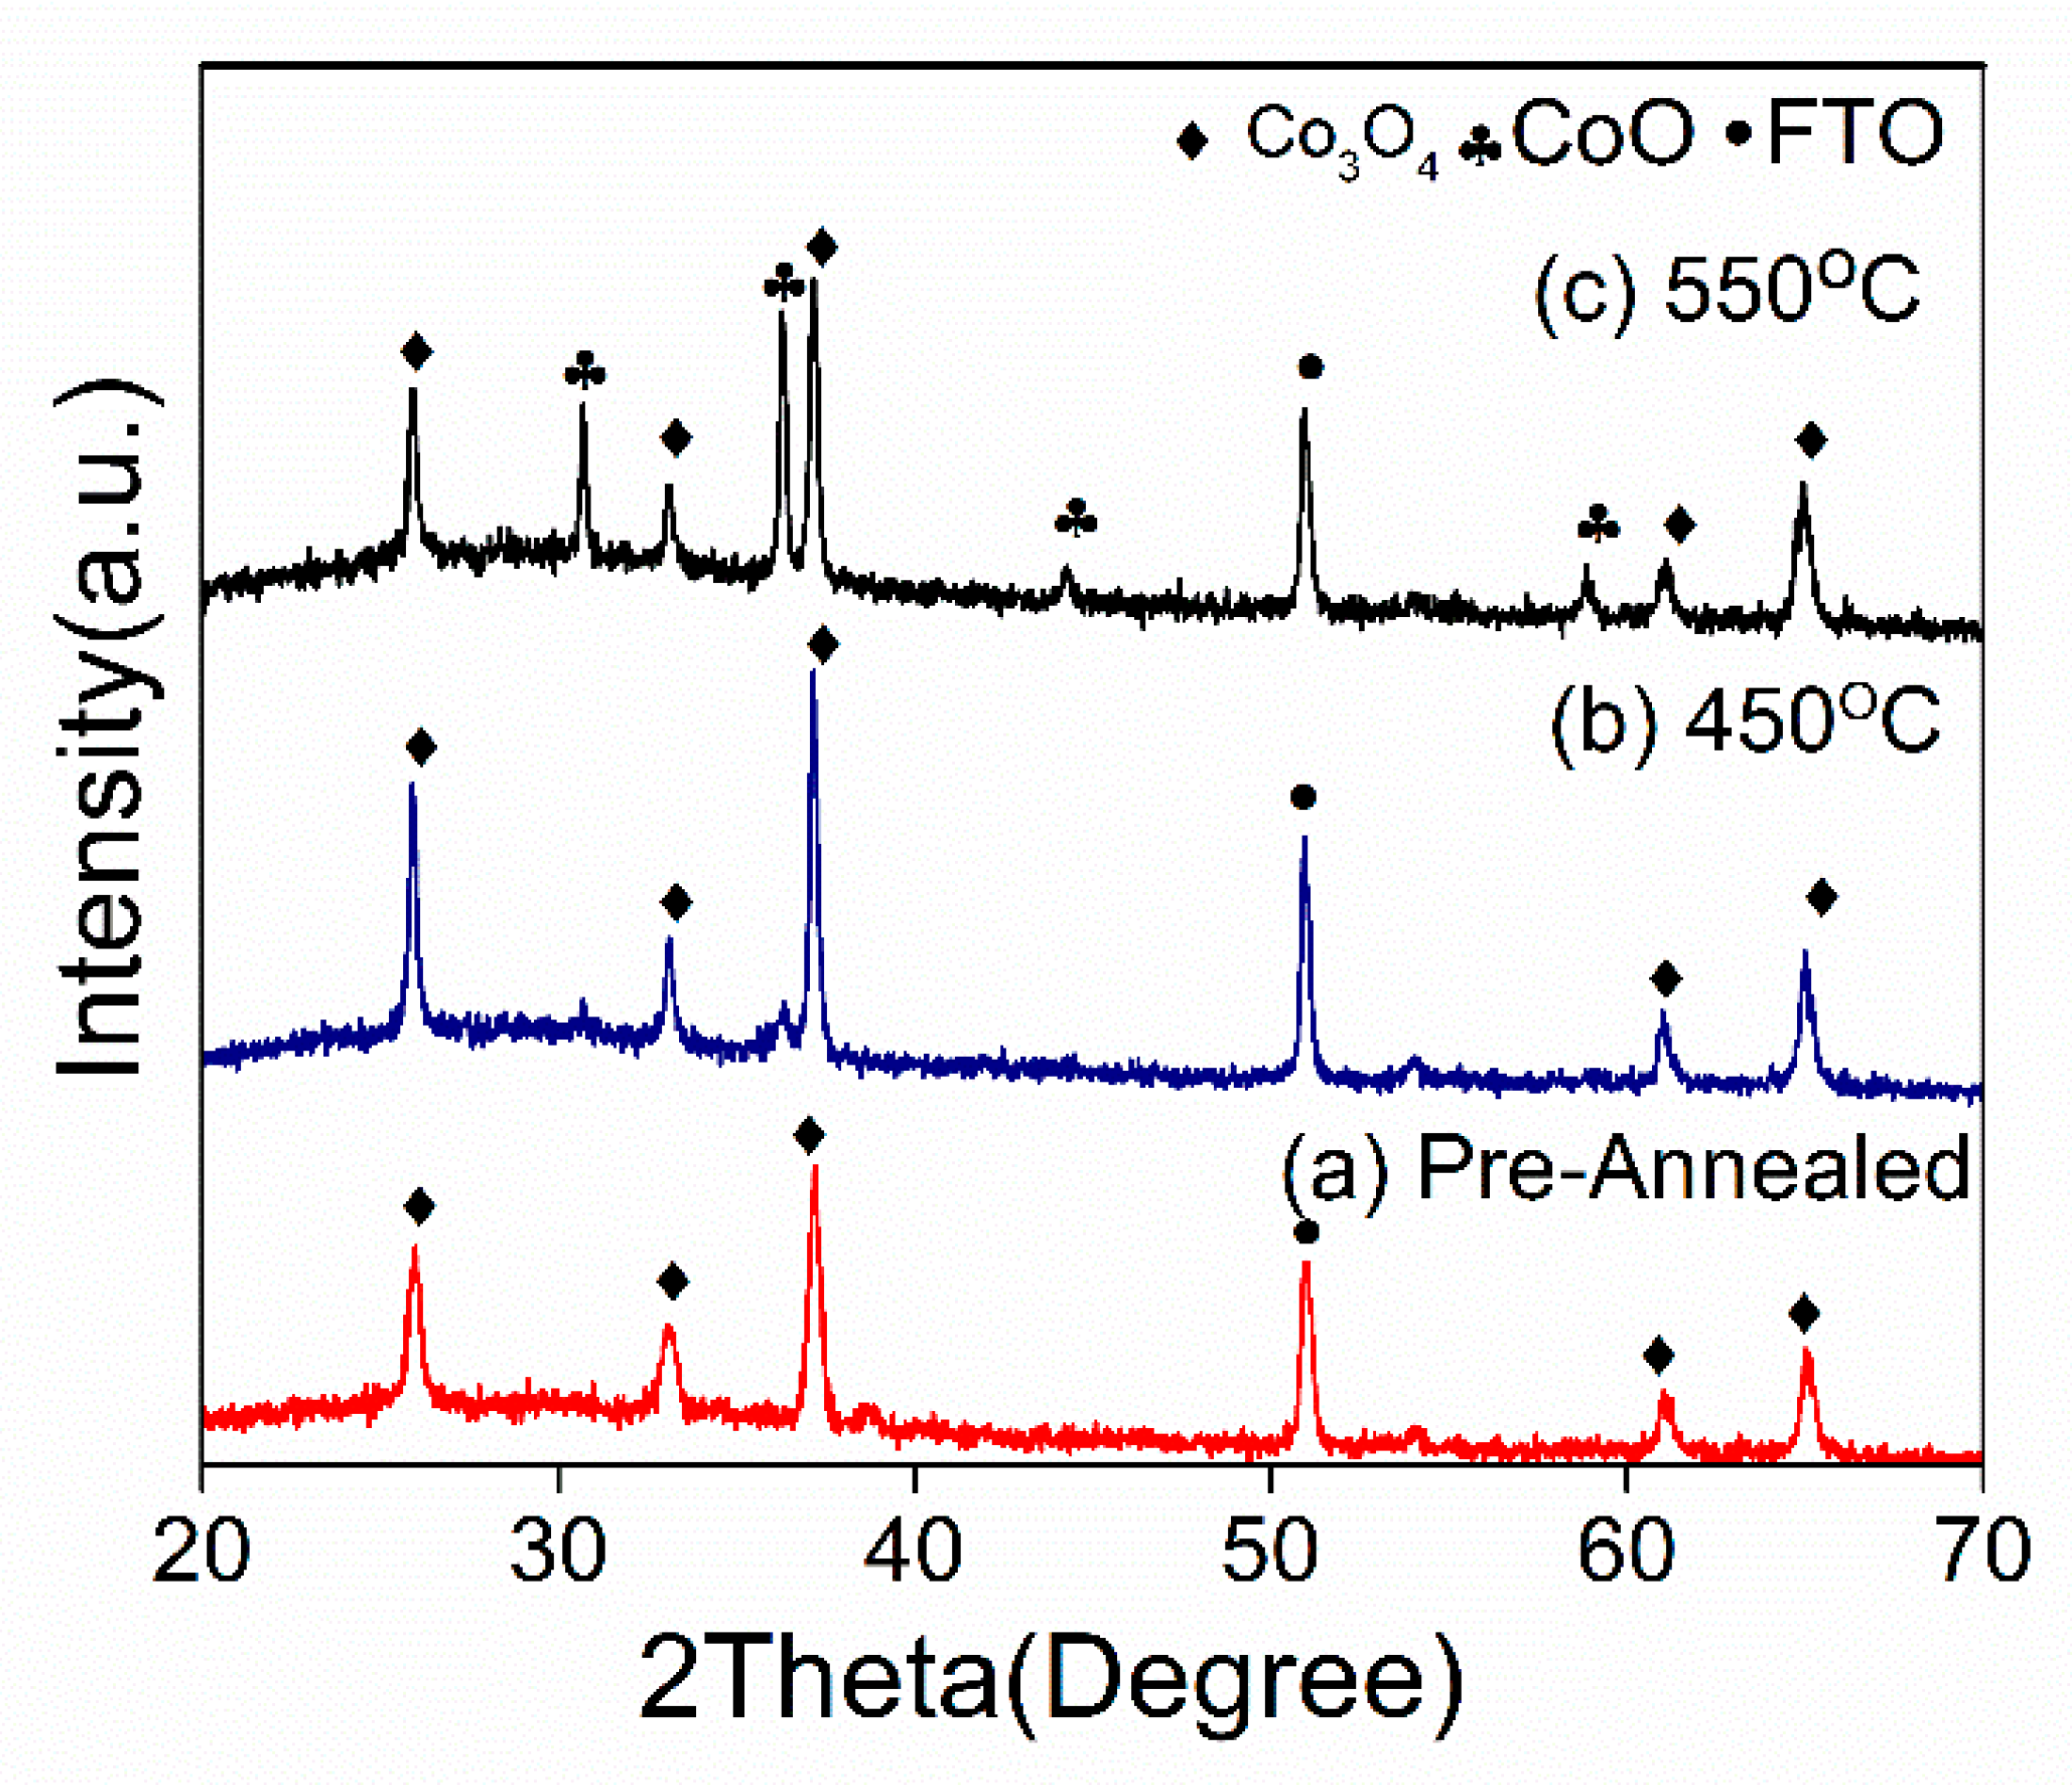
Figure 1. X-ray diffraction patterns of (a) the pre-annealed Co3O4, (b) the post-annealed Co3O4 at 450 °C, and (c) the post-annealed Co3O4 at 550 °C.
Applsci 11 03031 g001
Figure 2. XPS analysis of the pre-annealed, 450 °C and 550 °C, thin films samples. (a) Full spectra (b) Co 2p spectra (c) O spectra.
Applsci 11 03031 g002
Figure 3. FESEM images of (a1a3) pre-annealed sample, (b1b3) 450 °C sample, and (c1c3) 550 °C sample.
Applsci 11 03031 g003
Figure 4. HRTEM images of (a1a3) 450 °C and (b1b3) 550 °C samples inserted with SAED and lattice fringes.
Applsci 11 03031 g004
Figure 5. (a) UV-Vis absorption, and (b) curves band gap determination by Kubelka-Munk plot of samples pre-annealed and annealed at 450 °C and 550 °C.
Applsci 11 03031 g005
Figure 6. Photocurrent density curve for samples annealed at (a) Pre-annealed, (b) 450 °C, (c) 550 °C using different electrolytes, and (d) The chronopotentiometric stability of annealed 450 °Cand 550 °C samples in H2SO4 electrolyte.
Applsci 11 03031 g006
Figure 7. The derivation of charge transfer resistance (Rct) from Nyquist plot through EIS analysis for (a) 450 °C in different electrolytes, (b) the evaluation of different samples prepared at 450 °C and 550 °C using H2SO4 at pH 1, and (c,d) Mott–Schottky plots of the thin films annealed at 450 °C and 550 °C in 0.5 M H2SO4.
Applsci 11 03031 g007
Figure 8. Band alignment of Cobalt Oxide thin film annealed at 450 °C and 550 °C against potential redox of water molecule.
Applsci 11 03031 g008
Publisher’s Note: MDPI stays neutral with regard to jurisdictional claims in published maps and institutional affiliations.