
Cellulose and Vanadium Plasmonic Sensor to Measure Ni2+ Ions


 , , , and
Abstract
1. Introduction
2. Materials and Methods
2.1. Reagents and Materials
2.2. Deposition of MPA/V–CNCs Composite Thin Film
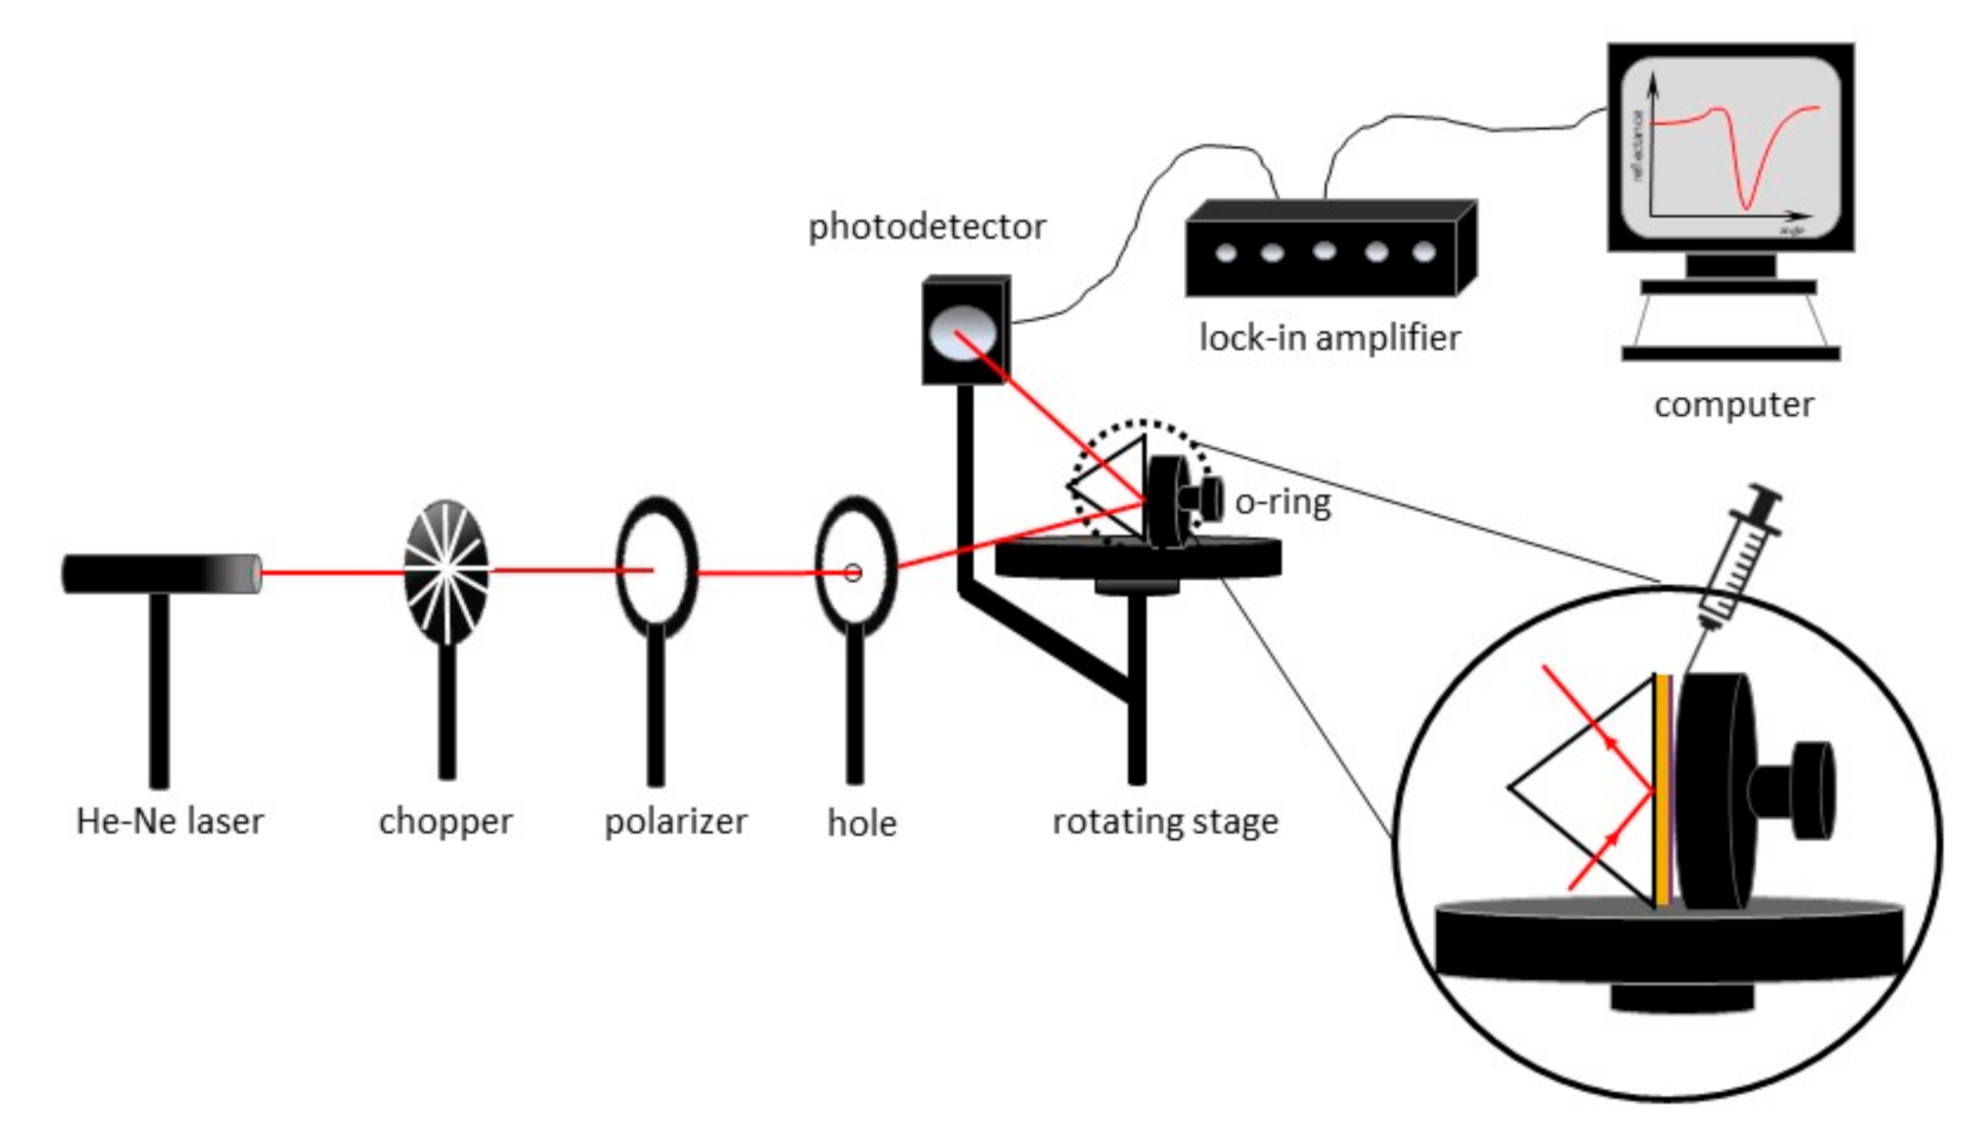
2.3. Experimental of SPR Setup
3. Results and Discussion
3.1. Sensor Surface Functionalization
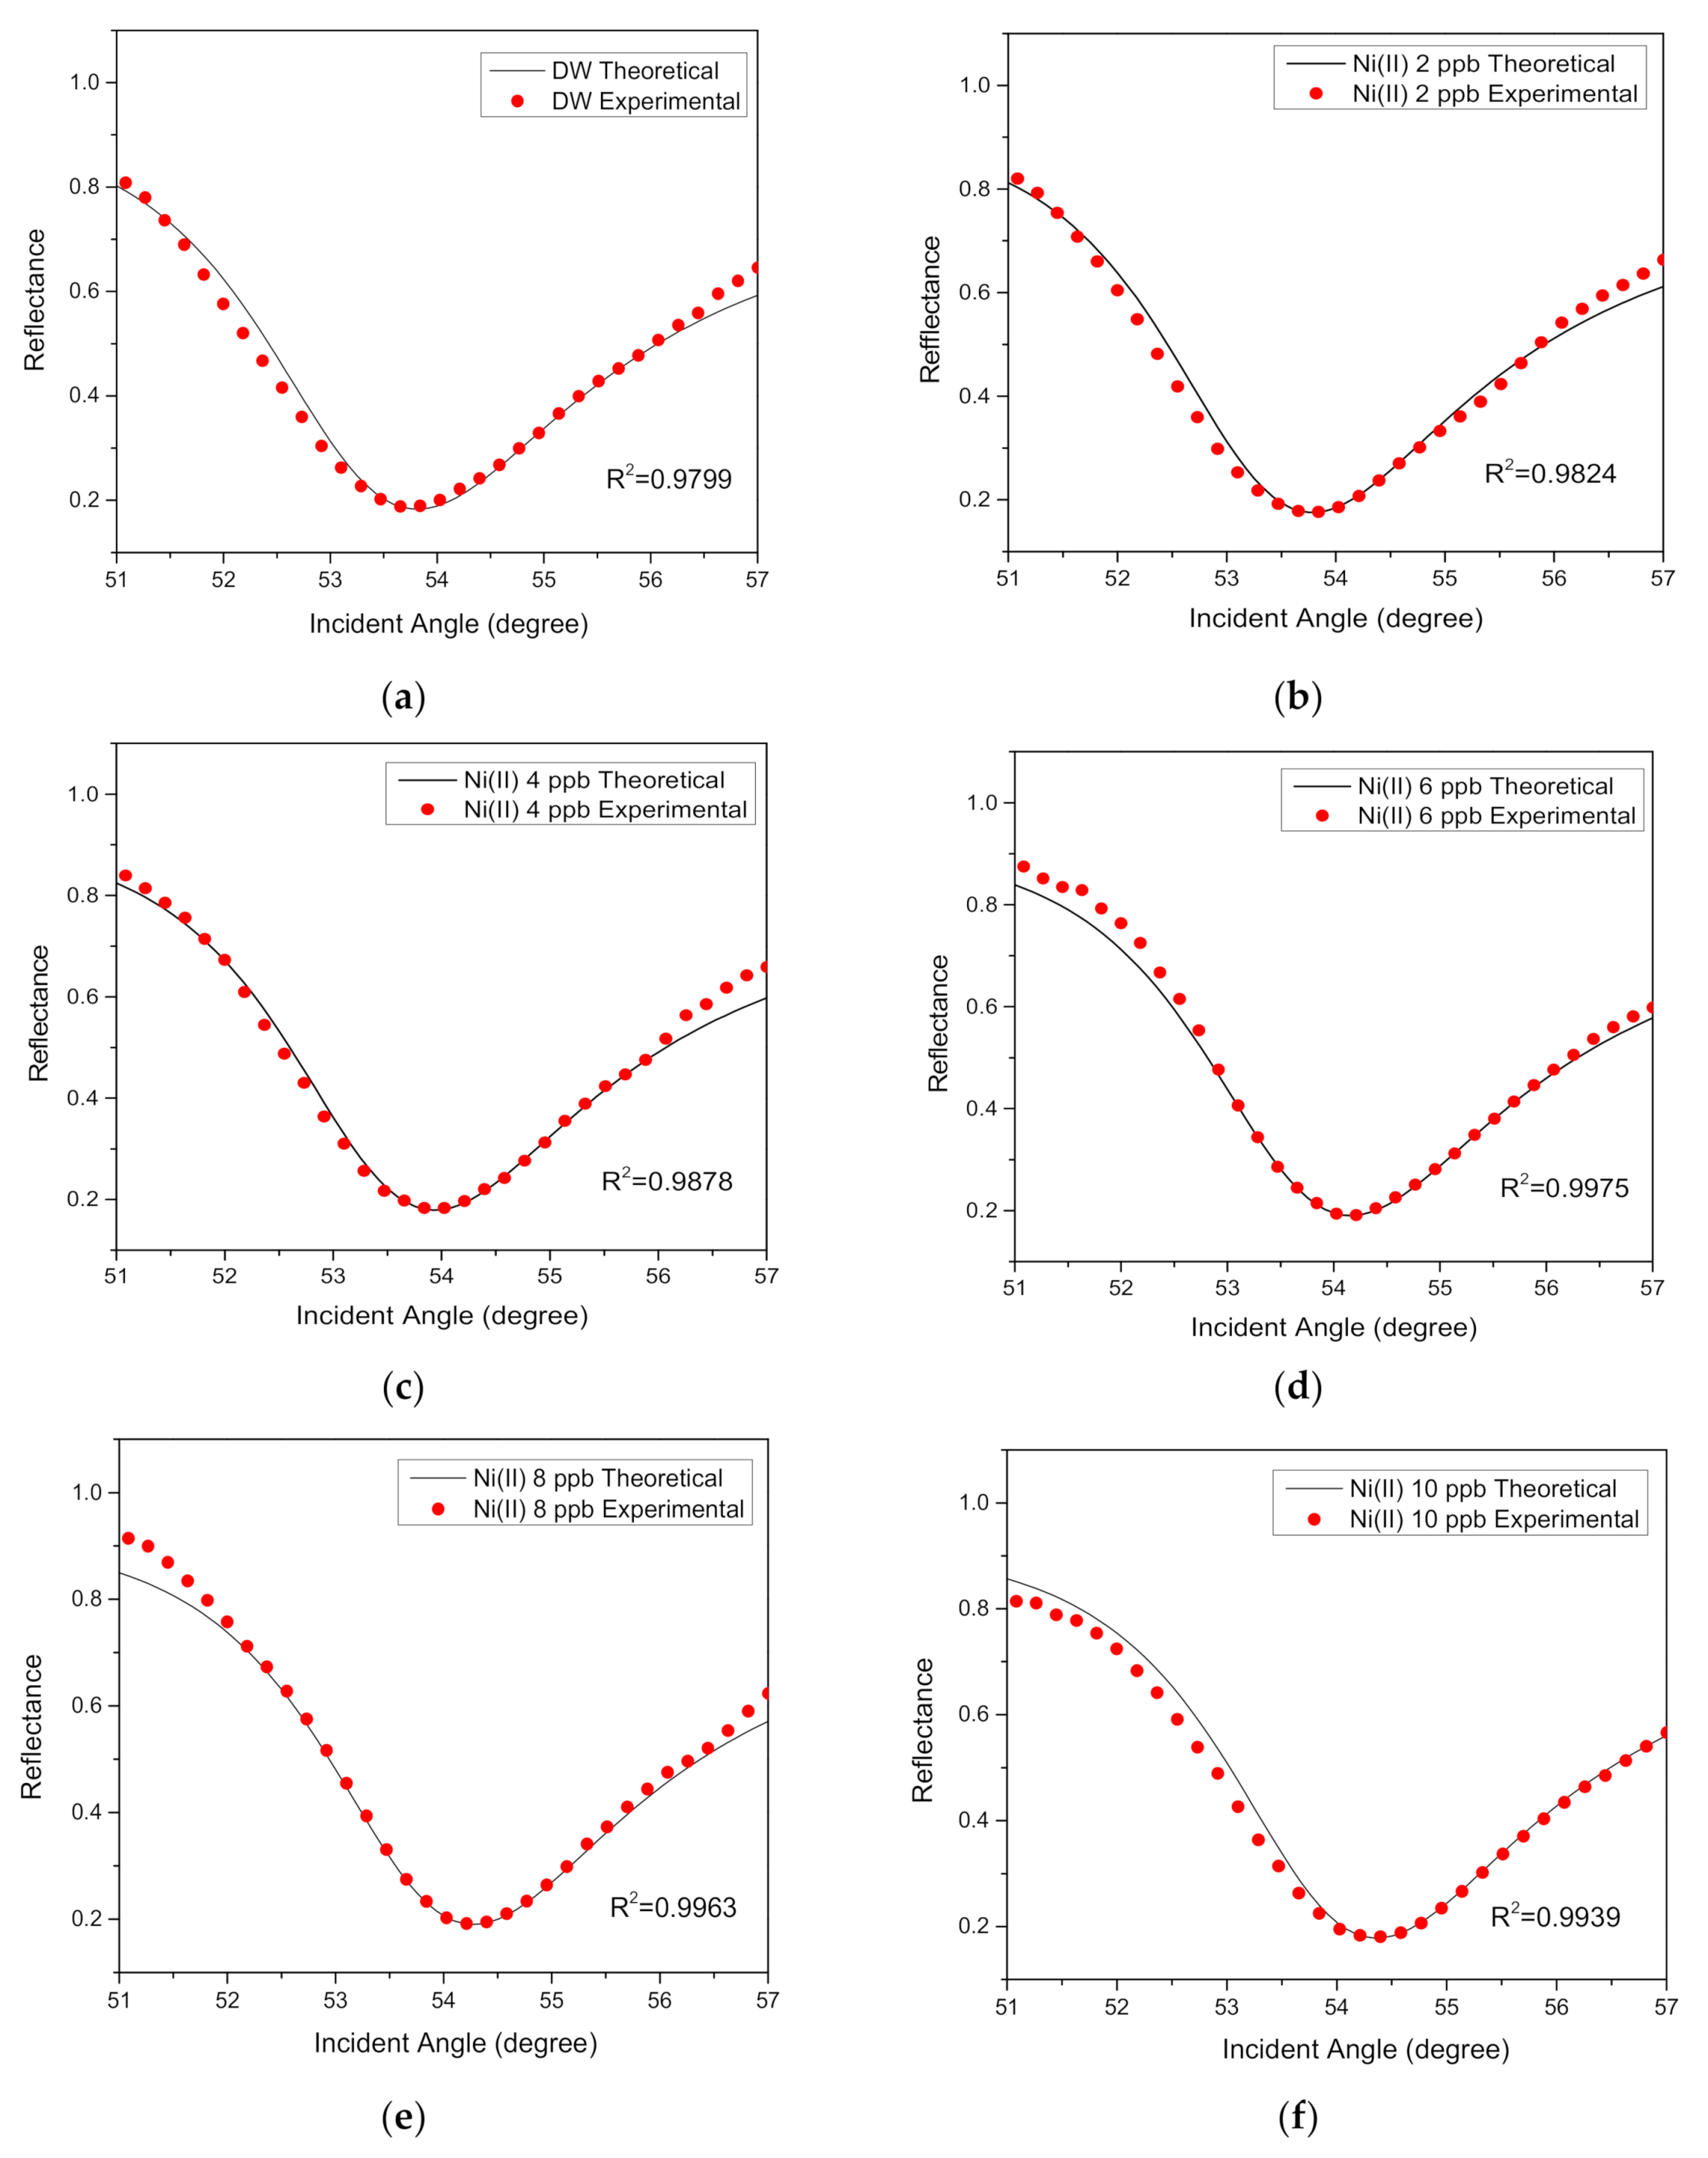
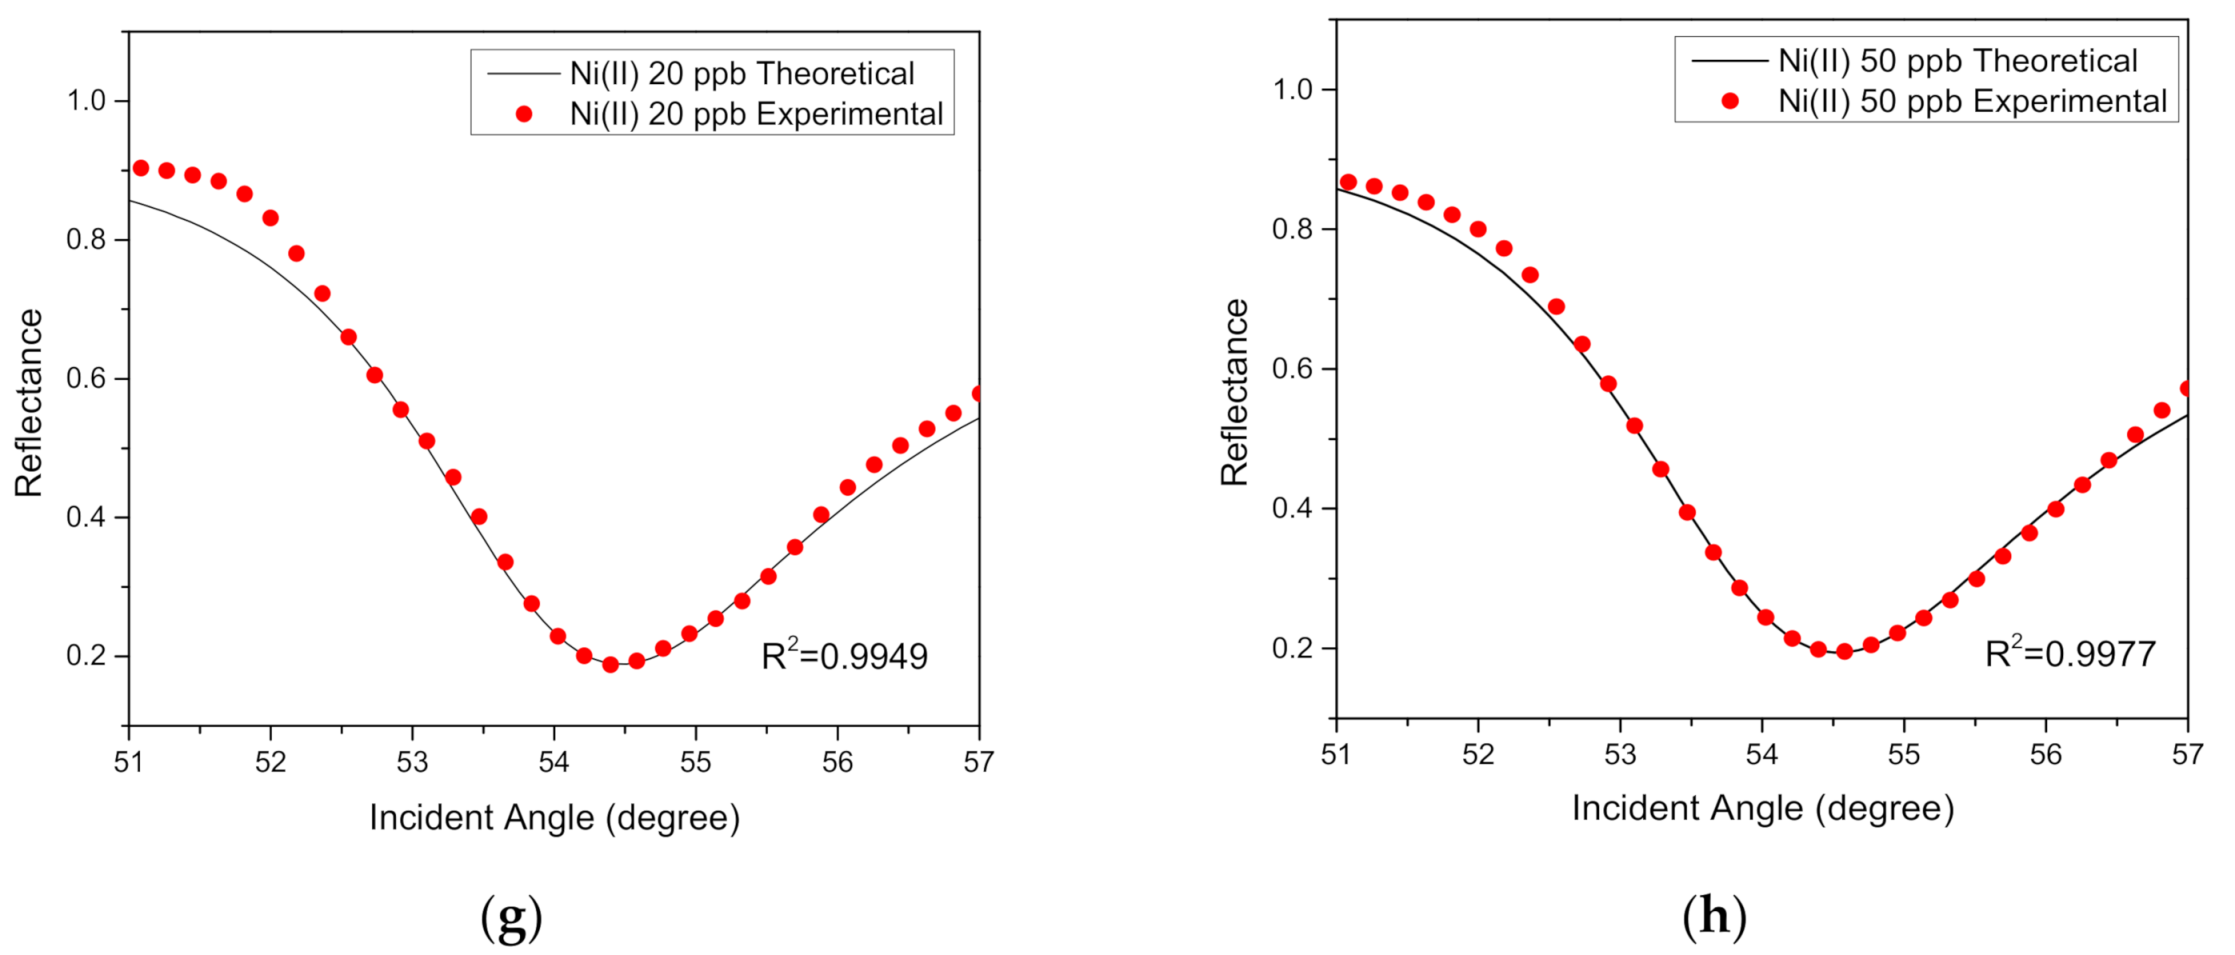
3.2. SPR Reflectance Curve for Au/MPA/V–CNCs–CTA Thin Film
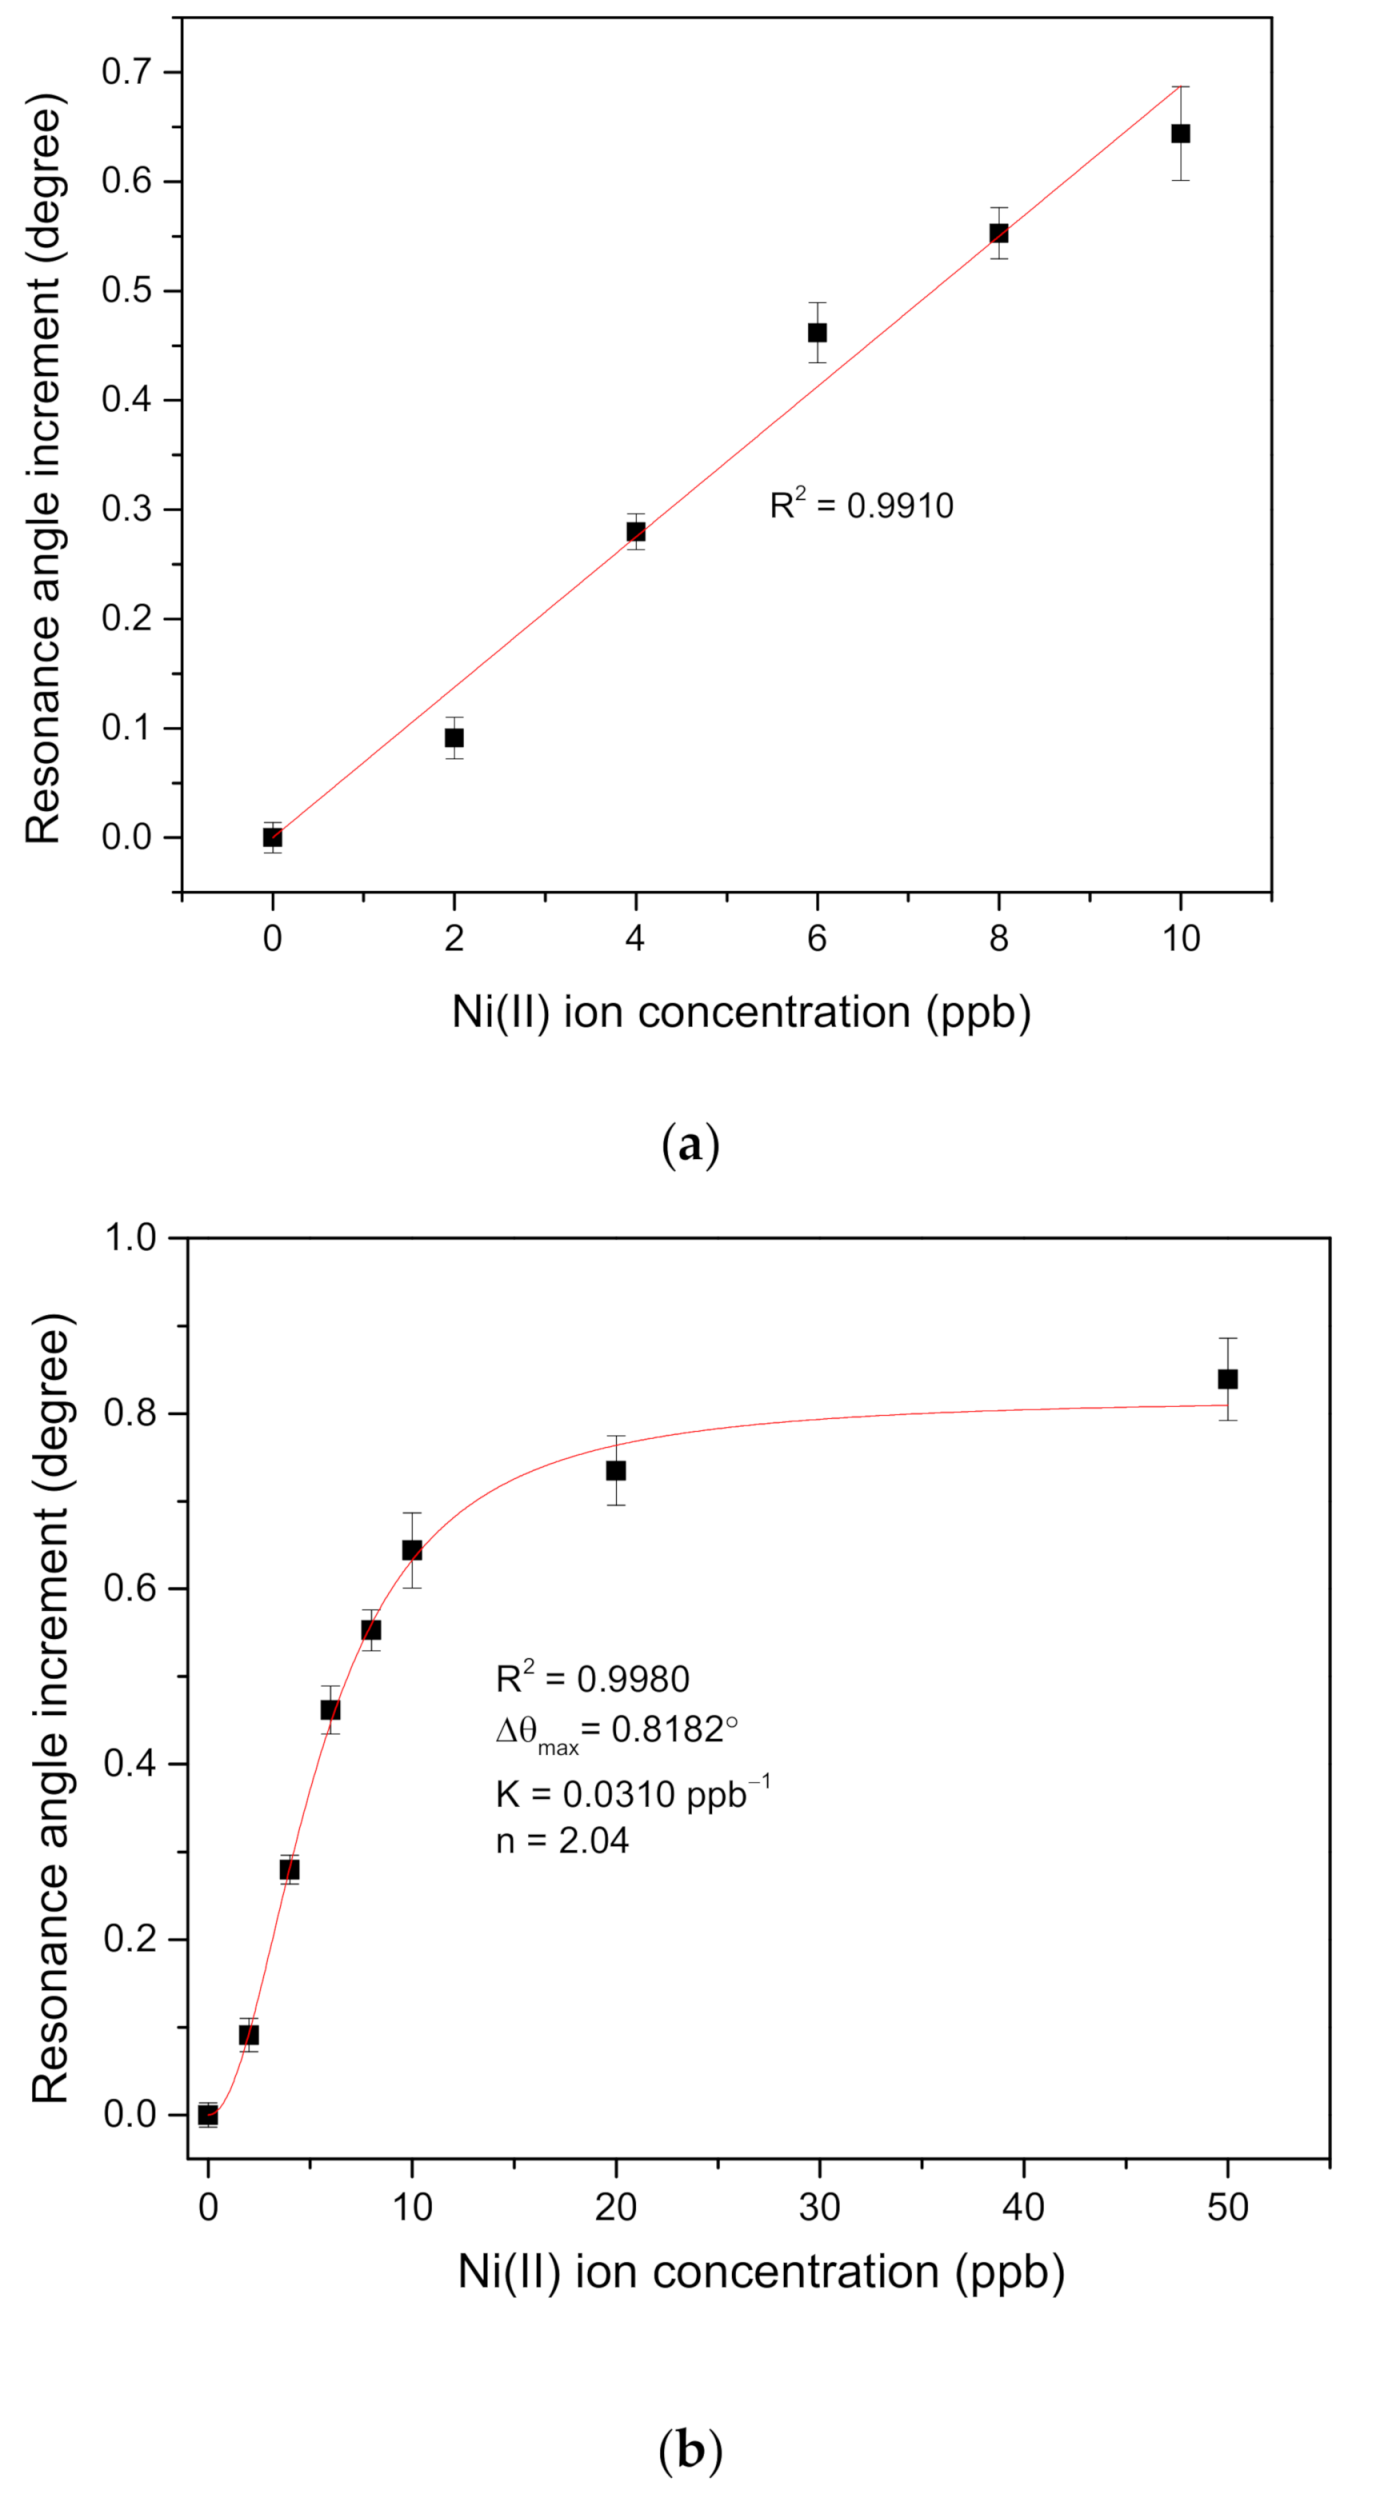
3.3. Sensitivity and Binding Affinity
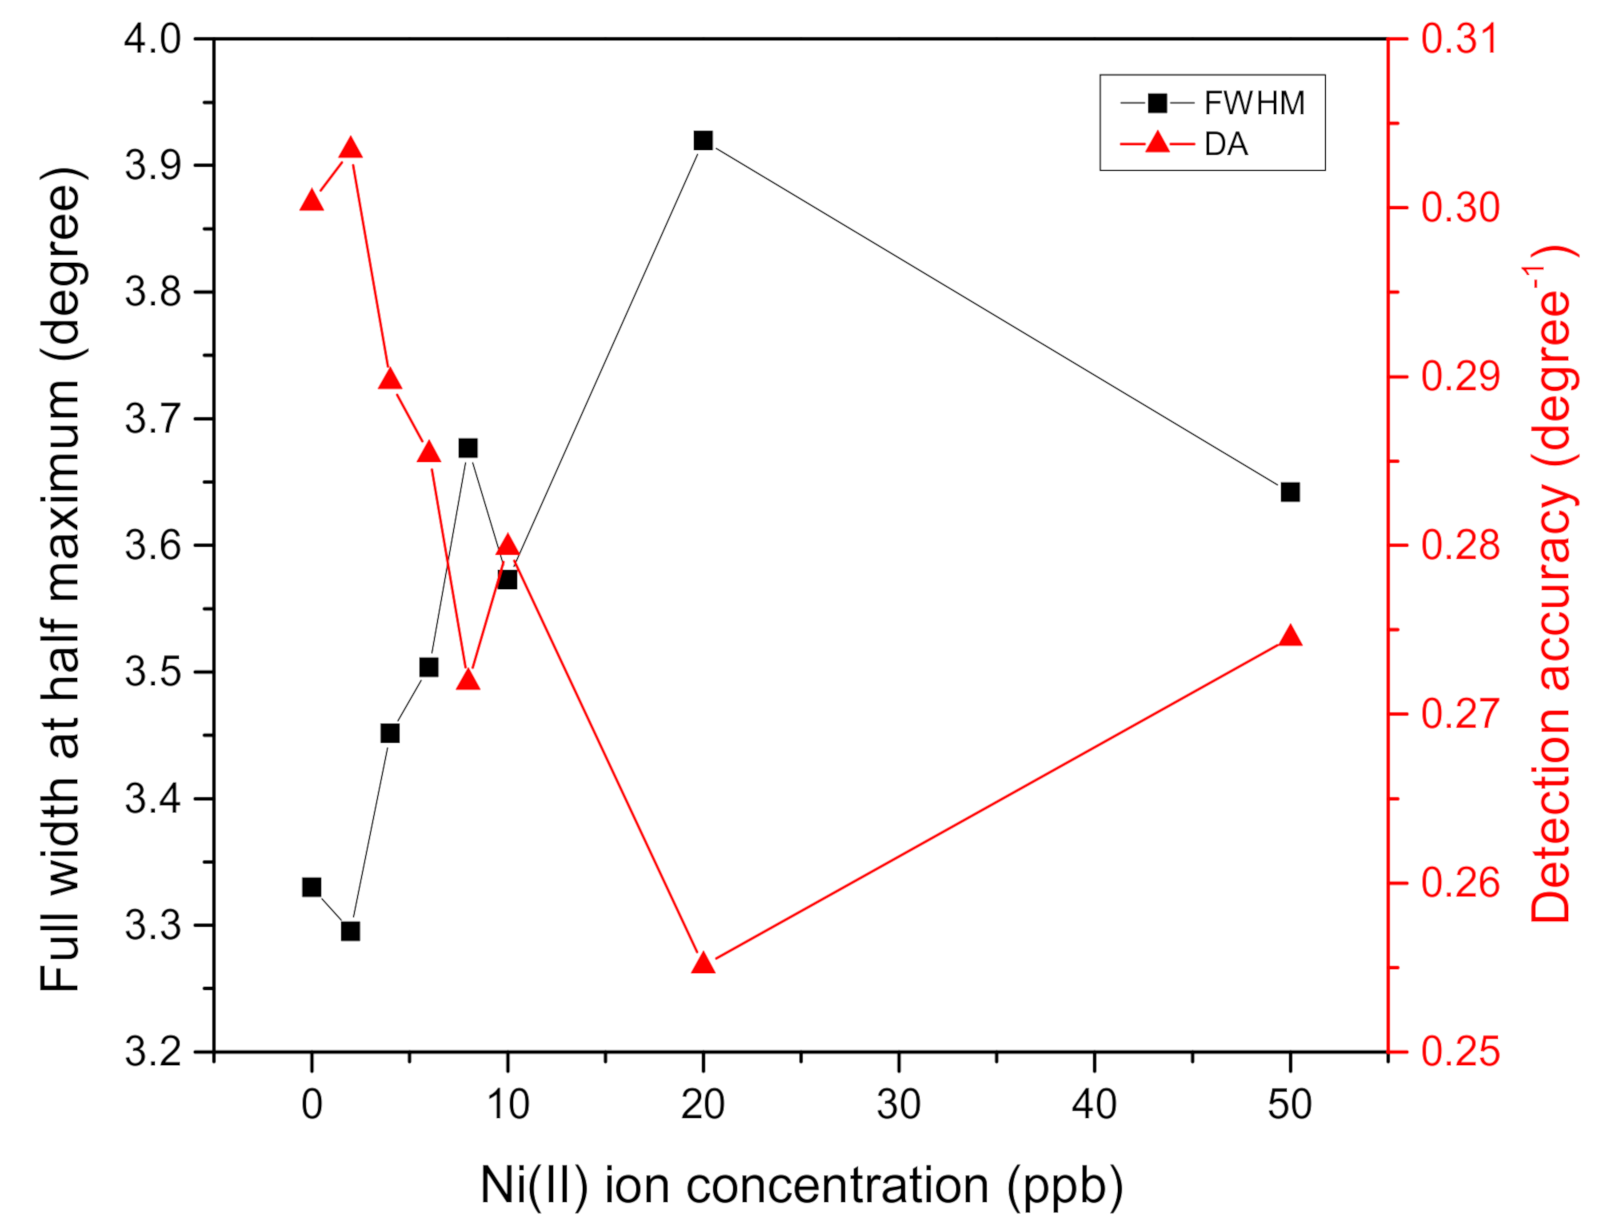
3.4. SPR parameters
4. Conclusions
Author Contributions
Funding
Institutional Review Board Statement
Informed Consent Statement
Data Availability Statement
Acknowledgments
Conflicts of Interest
References
- Loto, C.A. Electroless nickel plating—A review. Silicon 2016, 8, 177–186. [Google Scholar] [CrossRef]
- Costa, C.M.; Gonçalves, R.; Lanceros-Méndez, S. Advances in Cathode Nanomaterials for Lithium-Ion Batteries. In Nanostructured Materials for Next-Generation Energy Storage and Conversion; Springer: Berlin/Heidelberg, Germany, 2019; pp. 105–145. [Google Scholar]
- Li, W.; Erickson, E.M.; Manthiram, A. High-nickel layered oxide cathodes for lithium-based automotive batteries. Nat. Energy 2020, 5, 26–34. [Google Scholar] [CrossRef]
- Pavesi, T.; Moreira, J.C. A comprehensive study of nickel levels in everyday items in Brazil. Contact Dermat. 2020, 83, 1–6. [Google Scholar] [CrossRef] [PubMed]
- Torres, F.; das Gracas, M.; Melo, M.; Tosti, A. Management of contact dermatitis due to nickel allergy: An update. Clin. Cosmet. Investig. Dermatol. 2009, 2009, 39–48. [Google Scholar]
- Salimi, A.; Jamali, Z.; Atashbar, S.; Khezri, S.; Ghorbanpour, A.M.; Etefaghi, N. Pathogenic Mechanisms and Therapeutic Implication in Nickel-Induced Cell Damage. Endocr. Metab. Immune Disord. Drug Targets 2020, 20, 968–984. [Google Scholar] [CrossRef]
- Wen, W.L.; Wang, C.W.; Wu, D.W.; Chen, S.C.; Hung, C.H.; Kuo, C.H. Associations of heavy metals with metabolic syndrome and anthropometric indices. Nutrients 2020, 12, 2666. [Google Scholar] [CrossRef]
- Genter, M.B.; Doty, R.L. Toxic exposures and the senses of taste and smell. Handb. Clin. Neurol. 2019, 164, 389–408. [Google Scholar]
- Genchi, G.; Doty, R.L. Nickel: Human health and environmental toxicology. Int. J. Environ. Res. Public Health 2020, 17, 679. [Google Scholar] [CrossRef]
- Buxton, S.; Garman, E.; Heim, K.E.; Lyons-Darden, T.; Schlekat, C.E.; Taylor, M.D.; Oller, A.R. Concise review of nickel human health toxicology and ecotoxicology. Inorganics 2019, 7, 89. [Google Scholar] [CrossRef]
- Salnikow, K.; Zhitkovich, A. Genetic and epigenetic mechanisms in metal carcinogenesis and cocarcinogenesis: Nickel, arsenic, and chromium. Chem. Res. Toxicol. 2008, 21, 28–44. [Google Scholar] [CrossRef]
- Shovon, M.N.H.; Majumdar, B.C.; Rahman, Z. Heavy metals (Lead, Cadmium and Nickel) concentration in different organs of three commonly consumed fishes in Bangladesh. Fish. Aquac. J. 2017, 8, 1–5. [Google Scholar]
- Kamerud, K.L.; Hobbie, K.A.; Anderson, K.A. Stainless steel leaches nickel and chromium into foods during cooking. J. Agric. Food Chem. 2013, 61, 9495–9501. [Google Scholar] [CrossRef]
- Trumbo, P.; Yates, A.A.; Schlicker, S.; Poos, M. Dietary reference intakes: Vitamin A, vitamin K, arsenic, boron, chromium, copper, iodine, iron, manganese, molybdenum, nickel, silicon, vanadium, and zinc. J. Acad. Nutr. Diet. 2001, 101, 294. [Google Scholar]
- Aliasgharpour, M. Trace elements in human nutrition (II)—An update. Int. J. Prev. Med. 2020, 1, 11–12. [Google Scholar]
- Gebeyehu, H.R.; Bayissa, L.D. Levels of heavy metals in soil and vegetables and associated health risks in Mojo area, Ethiopia. PLoS ONE 2020, 15, 1–22. [Google Scholar] [CrossRef]
- Muhammad, A.; Bilal, S. Effective adsorption of hexavalent chromium and divalent nickel ions from water through polyaniline, iron oxide, and their composites. Appl. Sci. 2020, 10, 2882. [Google Scholar] [CrossRef]
- Tchounwou, P.B.; Yedjou, C.G.; Patlolla, A.K.; Sutton, D.J. Heavy metal toxicity and the environment. Exp. Suppl. 2012, 101, 133–164. [Google Scholar] [PubMed]
- Chowdhury, S.; Mazumder, M.J.; Al-Attas, O.; Husain, T. Heavy metals in drinking water: Occurrences, implications, and future needs in developing countries. Sci. Total Environ. 2016, 569, 476–488. [Google Scholar] [CrossRef]
- Bulska, E.; Ruszczyńska, A. Analytical techniques for trace element determination. Phys. Sci. Rev. 2017, 2, 1–14. [Google Scholar] [CrossRef]
- Helaluddin, A.B.M.; Khalid, R.S.; Alaama, M.; Abbas, S.A. Main analytical techniques used for elemental analysis in various matrices. Trop. J. Pharm. Res. 2016, 15, 427–434. [Google Scholar] [CrossRef]
- Shah, M.T.; Balouch, A.; Alveroglu, E. Sensitive fluorescence detection of Ni2+ ions using fluorescein functionalized Fe3O4 nanoparticles. J. Mater. Chem. C 2018, 6, 1105–1115. [Google Scholar] [CrossRef]
- Cardoso, P.; Amaro, P.; Santos, J.P.; de Assis, J.T.; Carvalho, M.L. Determination of nickel and manganese contaminants in pharmaceutical iron supplements using energy dispersive X-ray fluorescence. Appl. Spectrosc. 2016, 71, 432–437. [Google Scholar] [CrossRef]
- Fen, Y.W.; Yunus, W.M.M. Surface plasmon resonance spectroscopy as an alternative for sensing heavy metal ions: A review. Sens. Rev. 2013, 33, 305–314. [Google Scholar]
- Eddaif, L.; Shaban, A.; Telegdi, J. Sensitive detection of heavy metals ions based on the calixarene derivatives-modified piezoelectric resonators: A review. Int. J. Environ. Anal. Chem. 2019, 99, 824–853. [Google Scholar] [CrossRef]
- Anas, N.A.A.; Fen, Y.W.; Omar, N.A.S.; Daniyal, W.M.E.M.M.; Ramdzan, N.S.M.; Saleviter, S. Development of graphene quantum dots-based optical sensor for toxic metal ion detection. Sensors 2019, 19, 3850. [Google Scholar] [CrossRef]
- Malik, L.A.; Bashir, A.; Qureashi, A.; Pandith, A.H. Detection and removal of heavy metal ions: A review. Environ. Chem. Lett. 2019, 17, 1495–1521. [Google Scholar] [CrossRef]
- Sarmanova, O.E.; Laptinskiy, K.A.; Burikov, S.A.; Isaev, I.V.; Trifonov, N.D.; Dolenko, T.A.; Dolenko, S.A. Determination of heavy metal ions concentration in aqueous solutions using adaptive data analysis methods. Int. Soc. Opt. Photonics 2020, 11354. [Google Scholar]
- Gong, Y.; Liang, H. Nickel ion detection by imidazole modified carbon dots. Spectrochim. Acta Part A Mol. Biomol. Spectrosc. 2019, 211, 342–347. [Google Scholar] [CrossRef]
- Li, J.J.; Hou, C.J.; Huo, D.Q.; Shen, C.H.; Luo, X.G.; Fa, H.B.; Yang, M.; Zhou, J. Detection of trace nickel ions with a colorimetric sensor based on indicator displacement mechanism. Sens. Actuators B Chem. 2017, 241, 1294–1302. [Google Scholar] [CrossRef]
- Altintas, Z. Surface plasmon resonance based sensor for the detection of glycopeptide antibiotics in milk using rationally designed nanoMIPs. Sci. Rep. 2018, 8, 1–12. [Google Scholar] [CrossRef]
- Peltomaa, R.; Glahn-Martínez, B.; Benito-Peña, E.; Moreno-Bondi, M.C. Optical biosensors for label-free detection of small molecules. Sensors 2018, 18, 4126. [Google Scholar] [CrossRef] [PubMed]
- Omar, N.A.S.; Fen, Y.W.; Saleviter, S.; Daniyal, W.M.E.M.M.; Anas, N.A.A.; Ramdzan, N.S.M.; Roshidi, M.D.A. Development of a graphene-based surface plasmon resonance optical sensor chip for potential biomedical application. Materials 2019, 12, 1928. [Google Scholar] [CrossRef] [PubMed]
- Ramdzan, N.S.M.; Fen, Y.W.; Anas, N.A.A.; Omar, N.A.S.; Saleviter, S. Development of biopolymer and conducting polymer-based optical sensors for heavy metal ion detection. Molecules 2020, 25, 2548. [Google Scholar] [CrossRef] [PubMed]
- Hashim, H.S.; Fen, Y.W.; Omar, N.A.S.; Daniyal, W.M.E.M.M.; Saleviter, S.; Abdullah, J. Structural, optical and potential sensing properties of tyrosinase immobilized graphene oxide thin film on gold surface. Optik 2020, 212, 1–11. [Google Scholar] [CrossRef]
- Daniyal, W.M.E.M.M.; Fen, Y.W.; Abdullah, J.; Sadrolhosseini, A.R.; Saleviter, S.; Omar, N.A.S. Label-free optical spectroscopy for characterizing binding properties of highly sensitive nanocrystalline cellulose-graphene oxide-based nanocomposite towards nickel ion. Spectrochim. Acta Part A Mol. Biomol. Spectrosc. 2019, 212, 25–31. [Google Scholar] [CrossRef]
- Daniyal, W.M.E.M.M.; Fen, Y.W.; Abdullah, J.; Saleviter, S.; Omar, N.A.S. Preparation and characterization of hexadecyltrimethyl-ammonium bromide modified nanocrystalline cellulose/graphene oxide composite thin film and its potential in sensing copper ion using surface plasmon resonance technique. Optik 2018, 173, 71–77. [Google Scholar] [CrossRef]
- Daniyal, W.M.E.M.M.; Fen, Y.W.; Anas, N.A.A.; Omar, N.A.S.; Ramdzan, N.S.M.; Nakajima, H.; Mahdi, M.A. Enhancing the sensitivity of a surface plasmon resonance-based optical sensor for zinc ion detection by the modification of a gold thin film. RSC Adv. 2019, 9, 41729–41736. [Google Scholar] [CrossRef]
- Kamal, M.R.; Khoshkava, V. Effect of cellulose nanocrystals (CNC) on rheological and mechanical properties and crystallization behavior of PLA/CNC nanocomposites. Carbohydr. Polym. 2015, 123, 105–114. [Google Scholar] [CrossRef]
- George, J.; Sabapathi, S.N. Cellulose nanocrystals: Synthesis, functional properties, and applications. Nanotechnol. Sci. Appl. 2015, 2015, 45–54. [Google Scholar] [CrossRef] [PubMed]
- Mahmoud, K.A.; Male, K.B.; Hrapovic, S.; Luong, J.H. Cellulose nanocrystal/gold nanoparticle composite as a matrix for enzyme immobilization. ACS Appl. Mater. Interfaces 2009, 1, 1383–1386. [Google Scholar] [CrossRef] [PubMed]
- Omar, N.A.S.; Fen, Y.W.; Abdullah, J.; Chik, C.E.N.C.E.; Mahdi, M.A. Development of an optical sensor based on surface plasmon resonance phenomenon for diagnosis of dengue virus E-protein. Sens. Bio-Sens. Res. 2018, 7, 16–21. [Google Scholar] [CrossRef]
- Daniyal, W.M.E.M.M.; Fen, Y.W.; Abdullah, J.; Sadrolhosseini, A.R.; Saleviter, S.; Omar, N.A.S. Exploration of surface plasmon resonance for sensing copper ion based on nanocrystalline cellulose-modified thin film. Opt. Express 2018, 26, 34880–34893. [Google Scholar] [CrossRef] [PubMed]
- Peng, B.L.; Dhar, N.; Liu, H.L.; Tam, K.C. Chemistry and applications of nanocrystalline cellulose and its derivatives: A nanotechnology perspective. Can. J. Chem. Eng. 2011, 89, 1191–1206. [Google Scholar] [CrossRef]
- Ding, H.; Wang, Y.; Liang, Y.; Qin, F. Preparation and characterization of cetyl trimethylammonium intercalated sericite. Adv. Mater. Sci. Eng. 2014, 2014, 1–9. [Google Scholar] [CrossRef]
- Jin, Y.; Liu, F.; Tong, M.; Hou, Y. Removal of arsenate by cetyltrimethylammonium bromide modified magnetic nanoparticles. J. Hazard. Mater. 2012, 227, 461–468. [Google Scholar] [CrossRef]
- Rosddi, N.N.M.; Fen, Y.W.; Anas, N.A.A.; Omar, N.A.S.; Ramdzan, N.S.M.; Daniyal, W.M.E.M.M. Cationically modified nanocrystalline cellulose/carboxyl-functionalized graphene quantum dots nanocomposite thin film: Characterization and potential sensing application. Crystals 2020, 10, 875. [Google Scholar] [CrossRef]
- Prześniak-Welenc, M.; Nadolska, M.; Kościelska, B.; Sadowska, K. Tailoring the size and shape—New path for ammonium metavanadate synthesis. Materials 2019, 12, 3446. [Google Scholar] [CrossRef]
- Wang, M.; Huo, Y.; Jiang, S.; Zhang, C.; Yang, C.; Ning, T.; Liu, X.; Li, C.; Zhang, W.; Man, B. Theoretical design of a surface plasmon resonance sensor with high sensitivity and high resolution based on graphene–WS2 hybrid nanostructures and Au–Ag bimetallic film. RSC Adv. 2017, 7, 47177–47182. [Google Scholar] [CrossRef]
- de Souza, N.W.P.; Costa, J.S.; Santos, R.C.; da Cruz, A.F.S.; Rosso, T.D.; da Costa, K.Q. Modal Analysis of Surface Plasmon Resonance Sensor Coupled to Periodic Array of Core-Shell Metallic Nanoparticles. In Resonance; InTech Open: London, UK, 2017; Chapter 9. [Google Scholar]
- Nisha, A.; Maheswari, P.; Anbarasan, P.M.; Rajesh, K.B.; Jaroszewicz, Z. Sensitivity enhancement of surface plasmon resonance sensor with 2D material covered noble and magnetic material (Ni). Opt. Quantum Electron. 2019, 51, 1–12. [Google Scholar] [CrossRef]
- Fen, Y.W.; Yunus, W.M.M.; Yusof, N.A. Optical properties of crosslinked chitosan thin film as copper ion detection using surface plasmon resonance technique. Opt. Appl. 2011, 41, 999–1013. [Google Scholar]
- Usman, F.; Dennis, J.O.; Seong, K.C.; Ahmed, A.Y.; Ferrell, T.L.; Fen, Y.W.; Sadrolhosseini, A.R.; Ayodele, O.B.; Meriaudeau, F.; Saidu, A. Enhanced sensitivity of surface plasmon resonance biosensor functionalized with doped polyaniline composites for the detection of low-concentration acetone vapour. J. Sens. 2019, 2019, 1–14. [Google Scholar] [CrossRef]
- Ouyang, Q.; Zeng, S.; Jiang, L.; Hong, L.; Xu, G.; Dinh, X.Q.; Qian, J.; He, S.; Qu, J.; Coquet, P.; et al. Sensitivity enhancement of transition metal dichalcogenides/silicon nanostructure-based surface plasmon resonance biosensor. Sci. Rep. 2016, 6, 1–13. [Google Scholar] [CrossRef]
- Omar, N.A.S.; Fen, Y.W.; Abdullah, J.; Kamil, Y.M.; Daniyal, W.M.E.M.M.; Sadrolhosseini, A.R.; Mahdi, M.A. Sensitive detection of dengue virus type 2 E-proteins signals using self-assembled monolayers/reduced graphene oxide-PAMAM dendrimer thin film-SPR optical sensor. Sci. Rep. 2020, 10, 1–15. [Google Scholar] [CrossRef]
- Sadrolhosseini, A.; Noor, A.; Bahrami, A.; Lim, H.N.; Talib, Z.A.; Mahdi, M.A. Application of polypyrrole multi-walled carbon nanotube composite layer for detection of mercury, lead and iron ions using surface plasmon resonance technique. PLoS ONE 2014, 9, e93962. [Google Scholar] [CrossRef]
- Fen, Y.W.; Yunus, W.M.M.; Talib, Z.A. Analysis of Pb(II) ion sensing by crosslinked chitosan thin film using surface plasmon resonance spectroscopy. Optik 2013, 124, 126–133. [Google Scholar] [CrossRef]
- Choi, K.; Kim, H.; Lim, Y.; Kim, S.; Lee, B. Analytic design and visualization of multiple surface plasmon resonance excitation using angular spectrum decomposition for a Gaussian input beam. Opt. Express 2005, 13, 8866–8874. [Google Scholar] [CrossRef] [PubMed]
- Mudgal, N.; Saharia, A.; Agarwal, A.; Ali, J.; Yupapin, P.; Singh, G. Modeling of highly sensitive surface plasmon resonance (SPR) sensor for urine glucose detection. Opt. Quantum Electron. 2020, 52, 1–14. [Google Scholar] [CrossRef]
- Sharma, A.K.; Gupta, B.D. On the performance of different bimetallic combinations in surface plasmon resonance based fiber optic sensors. J. Appl. Phys. 2007, 101, 1–6. [Google Scholar] [CrossRef]
- Kumar, V.K.; Srinivas, G.; Wood, B.; Ramisetty, K.A.; Stewart, A.A.; Howard, C.A.; Brett, D.; Rodriquez-Reinoso, F. Characterization of adsorption site energies and heterogeneous of porous materials. J. Mat. Chem. A 2019, 1–35. [Google Scholar] [CrossRef]
- Bizi, M. Activated carbon and the principal mineral constituents of a natural soil in the presence of carbamazepine. Water 2019, 11, 2290. [Google Scholar] [CrossRef]
- Saleviter, S.; Fen, Y.W.; Daniyal, W.M.E.M.M.; Abdullah, J.; Sadrolhosseini, A.R.; Omar, N.A.S. Design and analysis of surface plasmon resonance optical sensor for determining cobalt ion based on chitosan-graphene oxide decorated quantum dots-modified gold active layer. Opt. Express 2019, 27, 32294–32307. [Google Scholar] [CrossRef]
- Keren, Y.; Borisover, M.; Bukhanovsky, N. Sorption interactions of organic compounds with soils affected by agricultural olive mill wastewater. Chemosphere 2015, 138, 462–468. [Google Scholar] [CrossRef]
- Sadrolhosseini, A.R.; Noor, A.S.M.; Moksin, M.M.; Abdi, M.M.; Mohammadi, A. Application of polypyrrole-chitosan layer for detection of Zn (II) and Ni (II) in aqueous solutions using surface plasmon resonance. Int. J. Polym. Mater. 2013, 62, 284–287. [Google Scholar] [CrossRef]
- Mochi, F.; Burratti, L.; Fratoddi, I.; Venditti, I.; Battocchio, C.; Carlini, L.; Iucci, G.; Casalboni, M.; De Matteis, F.; Casciardi, S.; et al. Plasmonic sensor based on interaction between silver nanoparticles and Ni2+ or Co2+ in water. J. Nanomater. 2018, 8, 488. [Google Scholar] [CrossRef]
- Hashim, H.S.; Fen, Y.W.; Omar, N.A.S.; Omar, N.A.S.; Abdullah, J.; Daniyal, W.M.E.M.M.; Saleviter, S. Detection of phenol by incorporation of gold modified-enzyme based graphene oxide thin film with surface plasmon resonance technique. Opt. Express 2020, 28, 9738–9752. [Google Scholar] [CrossRef] [PubMed]
- Omar, N.A.S.; Fen, Y.W.; Saleviter, S.; Kamil, Y.M.; Daniyal, W.M.E.M.M.; Abdullah, J.; Mahdi, M.A. Experimental evaluation on surface plasmon resonance sensor performance based on sensitive hyperbranched polymer nanocomposite thin films. Sens. Actuators A Phys. 2020, 303, 111830. [Google Scholar] [CrossRef]
- Anas, N.A.A.; Fen, Y.W.; Yusof, N.A.; Omar, N.A.S.; Daniyal, W.M.E.M.M.; Ramdzan, N.S.M. Highly sensitive surface plasmon resonance optical detection of ferric ion using CTAB/hydroxylated graphene quantum dots thin film. J. Appl. Phys. 2020, 128, 083105. [Google Scholar] [CrossRef]
- Bijalwan, A.; Singh, B.K.; Rastogi, V. Surface plasmon resonance-based sensors using nano-ribbons of graphene and WSe2. Plasmonics 2020, 15, 1015–1023. [Google Scholar] [CrossRef]
- Pal, S.; Verma, A.; Prajapati, Y.K.; Saini, J.P. Influence of black phosphorous on performance of surface plasmon resonance biosensor. Opt. Quantum Electron. 2017, 49, 1–13. [Google Scholar] [CrossRef]
- Fen, Y.W.; Yunus, W.M.M.; Moksin, M.M.; Talib, Z.A.; Yusof, N.A. Surface plasmon resonance optical sensor for mercury ion detection by crosslinked chitosan thin film. J. Optoelectron. Adv. Mater. 2011, 13, 279–285. [Google Scholar]
- Fen, Y.W.; Yunus, W.M.M. Utilization of chitosan-based sensor thin films for the detection of lead ion by surface plasmon resonance optical sensor. IEEE Sens. J. 2013, 13, 1413–1418. [Google Scholar] [CrossRef]
- Jana, J.; Ganguly, M.; Pal, T. Enlightening surface plasmon resonance effect of metal nanoparticles for practical spectroscopic application. RSC Adv. 2016, 6, 86174–86211. [Google Scholar] [CrossRef]


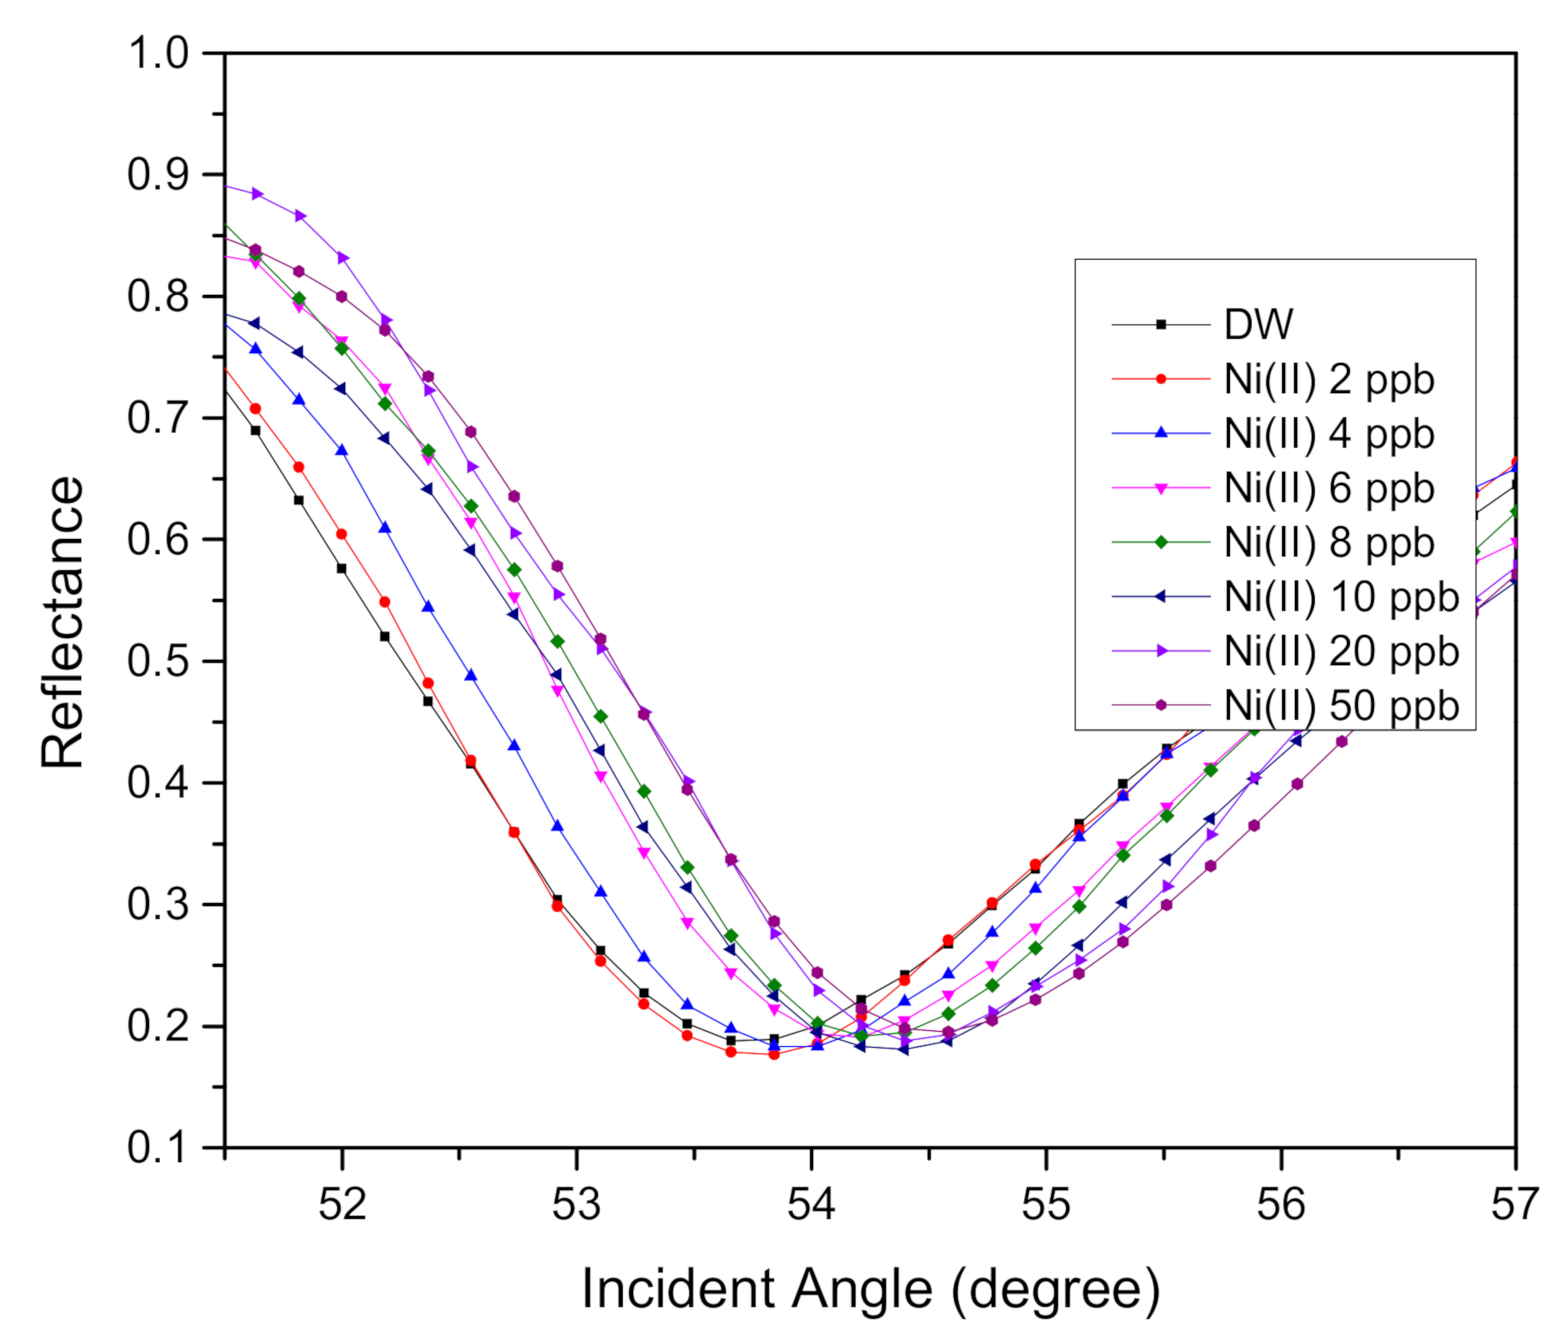
| Ni(II) ion Concentration (ppb) | Resonance Angle (Degree) | Resonance Angle Increment (Degree) |
|---|---|---|
| 0 | 53.6592 | 0 |
| 2 | 53.7502 | 0.0910 |
| 4 | 53.9389 | 0.2797 |
| 6 | 54.1210 | 0.4618 |
| 8 | 54.2120 | 0.5528 |
| 10 | 54.3031 | 0.6439 |
| 20 | 54.3941 | 0.7349 |
| 50 | 54.4982 | 0.8390 |
| Ni(II) Ion | Au Film | V-CTA-CNC Layer | ||||||
|---|---|---|---|---|---|---|---|---|
| Concentration (ppb) | Refractive Index | Refractive Index | Thickness (nm) | Refractive Index | Thickness (nm) | |||
| n | k | n | k | n | k | |||
| 0 | 1.3330 | 0 | 0.17501 | 3.6796 | 47 | 1.340 | 0.176 | 7.30 |
| 2 | 1.3332 | 0.001 | 0.17501 | 3.7126 | 47 | 1.349 | 0.148 | 7.33 |
| 4 | 1.3338 | 0.001 | 0.17501 | 3.7256 | 47 | 1.380 | 0.148 | 7.73 |
| 6 | 1.3339 | 0.001 | 0.17501 | 3.7566 | 47 | 1.436 | 0.148 | 8.59 |
| 8 | 1.3345 | 0.001 | 0.17501 | 3.7766 | 47 | 1.453 | 0.138 | 9.10 |
| 10 | 1.3348 | 0.001 | 0.17501 | 3.7766 | 47 | 1.475 | 0.138 | 9.10 |
| 20 | 1.3350 | 0.001 | 0.17501 | 3.7776 | 47 | 1.483 | 0.136 | 9.59 |
| 50 | 1.3353 | 0.001 | 0.17501 | 3.7776 | 47 | 1.487 | 0.136 | 9.79 |
| Materials Used | LOD 1 | Sensitivity | Binding Affinity | SNR 2 | Ref. |
|---|---|---|---|---|---|
| CTA-NCC/GO 3 | 10 ppb | 0.001° ppb−1 | 1.620 × 10³ M−1 | 0.0191 | [36] |
| PPy-CHI 4 | 10 ppb | - | 1.672 × 10⁴ M−1 | - | [65] |
| AgNPs-3MPS 5 | 500 ppb | - | - | - | [66] |
| V–CNCs–CTA 6 | 2 ppb | 0.068° ppb−1 | 1.819 × 10⁶ M−1 | 0.0276 | This work |
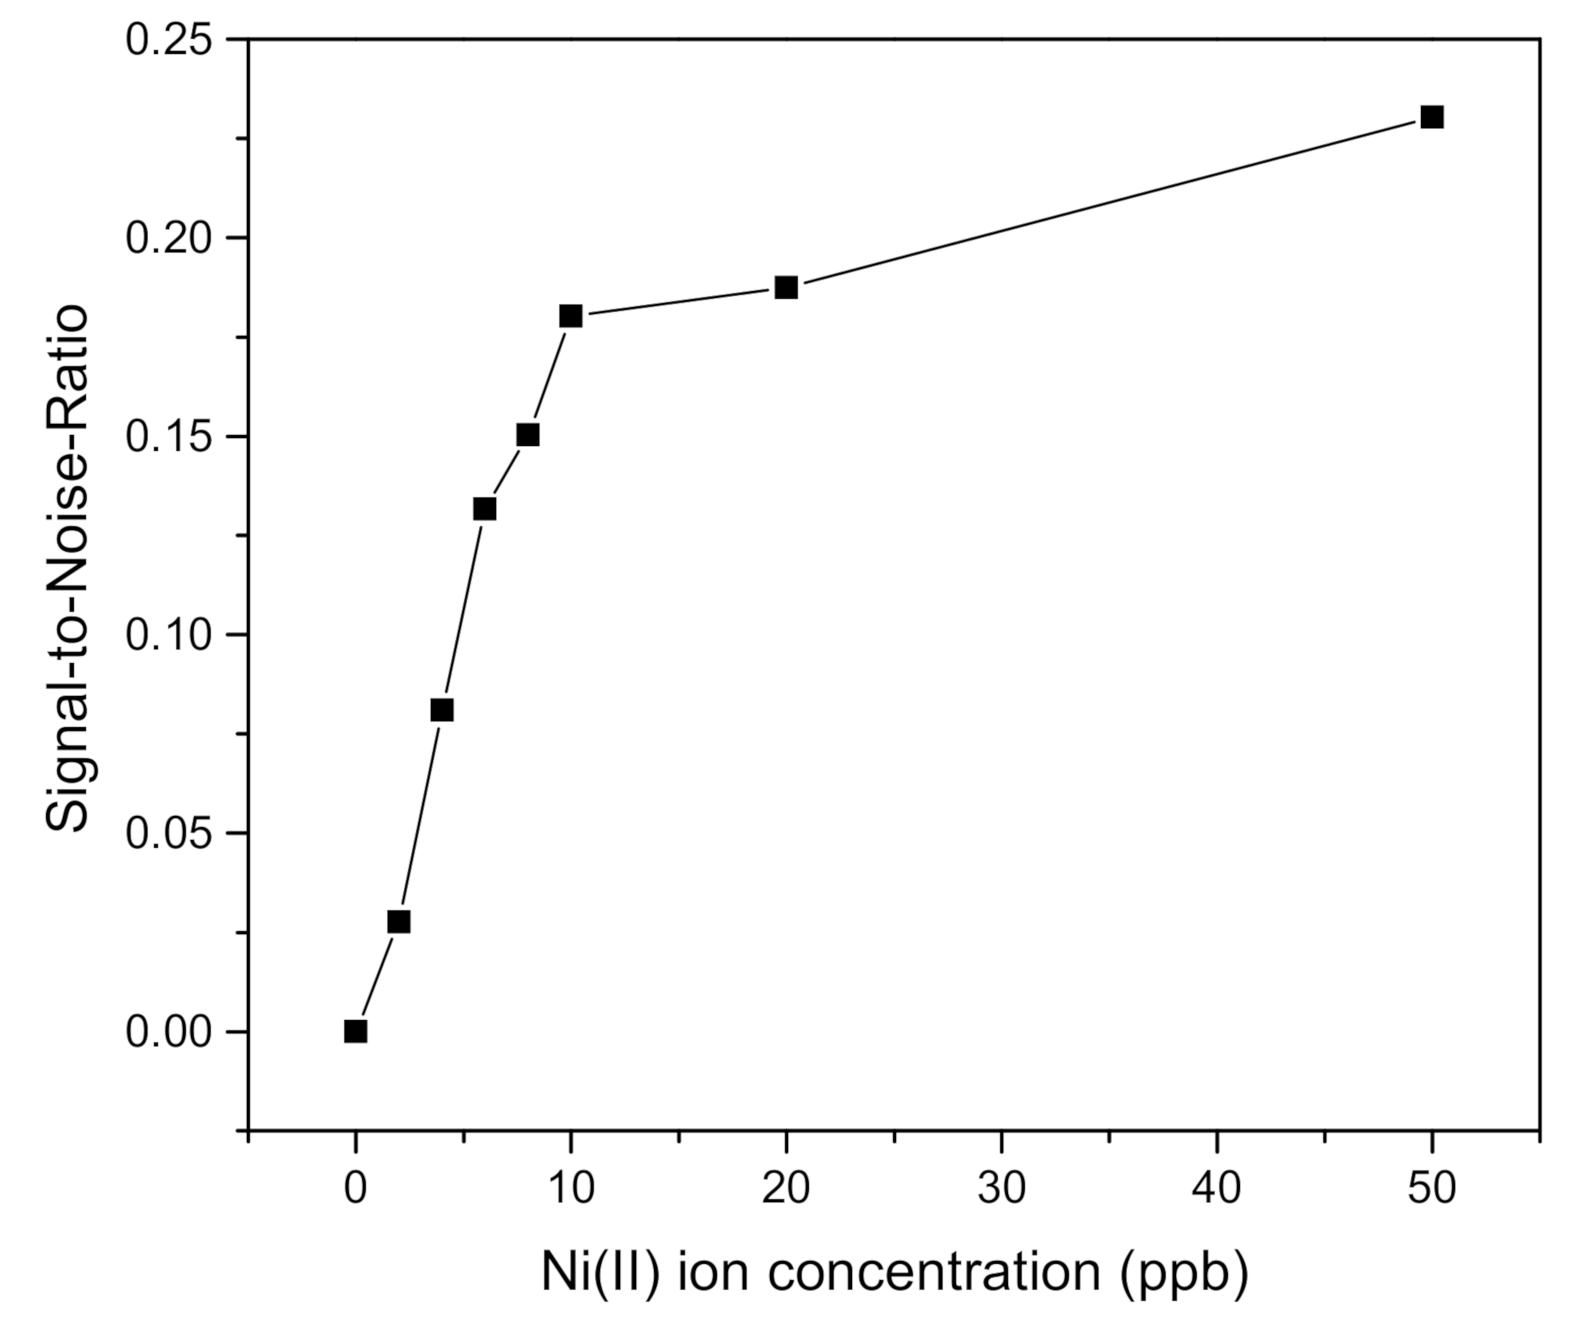
| Ni(II) Ion Concentration (ppb) | FWHM (Degree) | DA (Degree−1) | SNR |
|---|---|---|---|
| 0 | 3.3299 | 0.3003 | 0 |
| 2 | 3.2952 | 0.3034 | 0.0276 |
| 4 | 3.4513 | 0.2897 | 0.0810 |
| 6 | 3.5033 | 0.2854 | 0.1317 |
| 8 | 3.6767 | 0.2719 | 0.1503 |
| 10 | 3.5727 | 0.2799 | 0.1802 |
| 20 | 3.9195 | 0.2551 | 0.1874 |
| 50 | 3.6420 | 0.2745 | 0.2303 |
Publisher’s Note: MDPI stays neutral with regard to jurisdictional claims in published maps and institutional affiliations. |
© 2021 by the authors. Licensee MDPI, Basel, Switzerland. This article is an open access article distributed under the terms and conditions of the Creative Commons Attribution (CC BY) license (http://creativecommons.org/licenses/by/4.0/).
Share and Cite
Omar, N.A.S.; Fen, Y.W.; Ramli, I.; Azmi, U.Z.M.; Hashim, H.S.; Abdullah, J.; Mahdi, M.A. Cellulose and Vanadium Plasmonic Sensor to Measure Ni2+ Ions. Appl. Sci. 2021, 11, 2963. https://doi.org/10.3390/app11072963
Omar NAS, Fen YW, Ramli I, Azmi UZM, Hashim HS, Abdullah J, Mahdi MA. Cellulose and Vanadium Plasmonic Sensor to Measure Ni2+ Ions. Applied Sciences. 2021; 11(7):2963. https://doi.org/10.3390/app11072963
Chicago/Turabian StyleOmar, Nur Alia Sheh, Yap Wing Fen, Irmawati Ramli, Umi Zulaikha Mohd Azmi, Hazwani Suhaila Hashim, Jaafar Abdullah, and Mohd Adzir Mahdi. 2021. "Cellulose and Vanadium Plasmonic Sensor to Measure Ni2+ Ions" Applied Sciences 11, no. 7: 2963. https://doi.org/10.3390/app11072963
APA StyleOmar, N. A. S., Fen, Y. W., Ramli, I., Azmi, U. Z. M., Hashim, H. S., Abdullah, J., & Mahdi, M. A. (2021). Cellulose and Vanadium Plasmonic Sensor to Measure Ni2+ Ions. Applied Sciences, 11(7), 2963. https://doi.org/10.3390/app11072963