1. Introduction
In recent decades, an increase in free trade across all regions of the world has allowed for the global distribution of products. Products that are produced for domestic markets now face the challenge of having to compete in international markets. Current global manufacturing and distribution systems force products and materials to be moved through poorly understood distribution environments [
1].
In most cases, damage to products and packages can be attributed to the various vibration forces that occur during distribution. Vibration is an important factor for product survivability. Truck vibration during transport has been recognized as a source of product damage [
2,
3].
Vibration is a mechanical phenomenon produced by transport vehicles, forklifts, conveyors, etc., that affects every packaged product during the handling and transportation process. This phenomenon consists of a periodic motion that repeats itself after a certain interval of time. Vibration produced by these types of material handling equipment is not a smooth oscillatory motion; it is a shaped mix of frequencies and amplitudes that are constantly changing. Since vibration is a continuously occurring phenomenon, it may produce mechanical failures, fatigue failure, cosmetic damages, undesirable settling of contents, the breaking of solid/liquid suspensions, static charge buildup, or bottle-closure cap back-off, causing leak of fluids and powdered products [
4].
In most of the studies conducted, vibration data are often collected in a time-domain, where the horizontal axis is the time. However, it is difficult to describe the characteristics of the motion or use it as a control target for the random vibration test system. Thus, the power spectral density (PSD) plots are used for data analysis instead. PSD plots chart the average intensity of the vibration against the frequency of the vibration [
2]. This form is called frequency-domain representation, where the horizonal axis is frequency. Random vibration PSD plots are also specified in terms of their “overall G
rms”. This root-mean-square (RMS) calculation is used to average the PSD plots to obtain a number which gives the intensity, in G, over the frequency spectrum of interest.
Many studies have been conducted previously to study the vibration levels produced by different modes of transport in multiple countries, such as heavy trailer-truck and railcars [
5,
6,
7,
8,
9], and medium and small trucks [
10,
11,
12]. Some of the previous studies measured the effect of distribution circumstances on vibration as a function of road conditions, truck speeds, suspension systems, or payloads [
13,
14,
15,
16]. In addition, these studies revealed that intensity of vibration in transportation is related to various factors such as speed and driving performance, road conditions and quality, load conditions, and truck suspension systems.
Materials and products are also moved around within warehouses. Warehousing is becoming a critical activity in trade enterprises in order to outperform competitors in productivity, lead time, and customer service [
17]. The most common type of material handling equipment in a warehouse is the forklift [
18,
19].
Forklifts play an important role in the global distribution of packaged products. Moreover, they have a major impact in the economic growth of the industry. There are more than 540,000 powered industrial truck operators currently employed in the United States alone, operating in all 50 states, and working in more than 300 different industries. According to the needs of the user, forklifts can come in a variety of designs, sizes, engine types, and load capacities. Forklift vibration levels are mainly dependent on the type of forklift structure, speed, payload, and road roughness, respectively.
Although many published papers have focused on the exposure of vibration to the human body in forklift operators, these papers primarily observed and analyzed the vibration circumstances over the seat location [
20,
21,
22]. There are no studies that have been conducted with the aim of packaging testing purposes that have obtained vibration data at or around the fork tines. Therefore, the purpose of this study was to measure and analyze the vibration levels of common forklifts types using different handling conditions. The research was developed in a laboratory environment that simulated different handling environments. The main objective of this project was to analyze the vibration levels experienced by different industrial forklifts under different conditions.
Specific objectives included: (1) Measure vibration levels experienced by a gas-powered forklift, an electric-powered forklift, and a reach truck; (2) Determine the effects of road condition, unit load weight, speed, forklift type, and sensor location on the vibration levels.
2. Materials and Methods
2.1. Forklifts
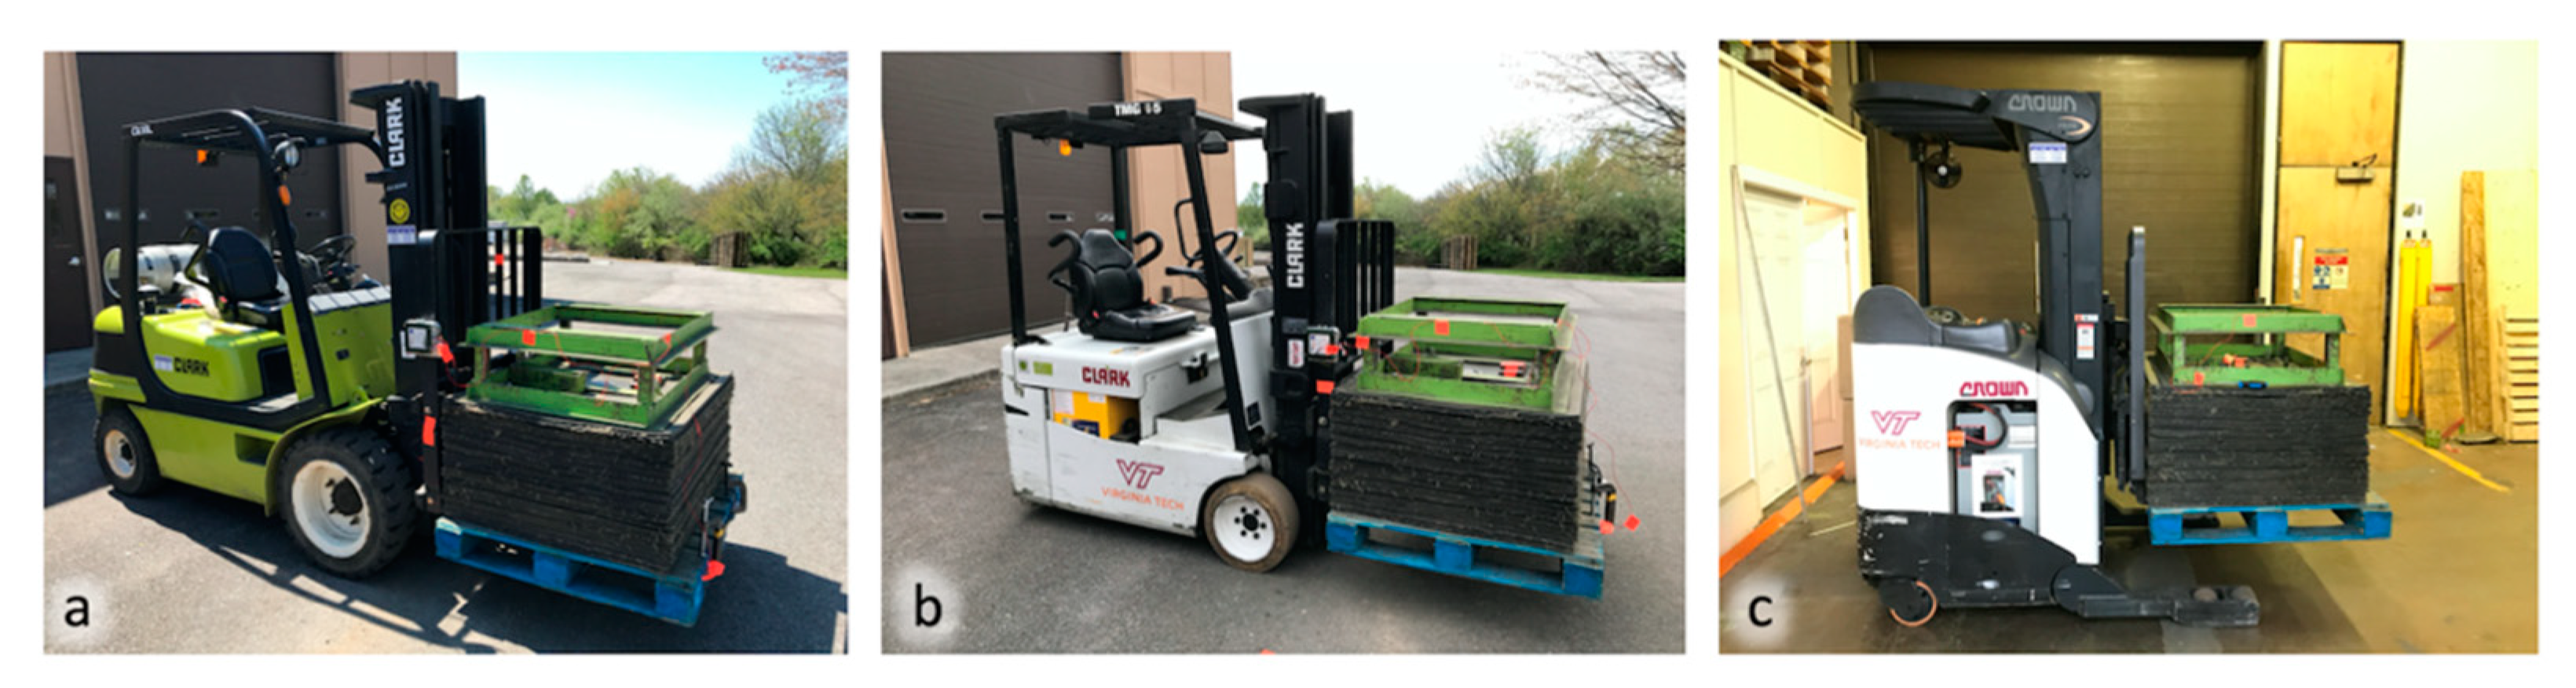
Three types of forklifts were investigated including a CLARK CQ30L, a CLARK TMG15, and a CROWN 5200 Series (
Figure 1). The CLARK CQ30L is a four-wheeled, sit-down cantilever, gas-propane-powered forklift with pneumatic tires and 2177 kg maximum load capacity. The CLARK TMG15 is a three-wheeled, sit-down cantilever, electric-powered forklift with solid tires and 1179 kg maximum load capacity. The CROWN 5200 Series is an electric-powered reach truck with solid tires and 1588 kg maximum load capacity. The study was conducted using 1.07 m long fork tines on each of the industrial forklifts.
2.2. Road Conditions
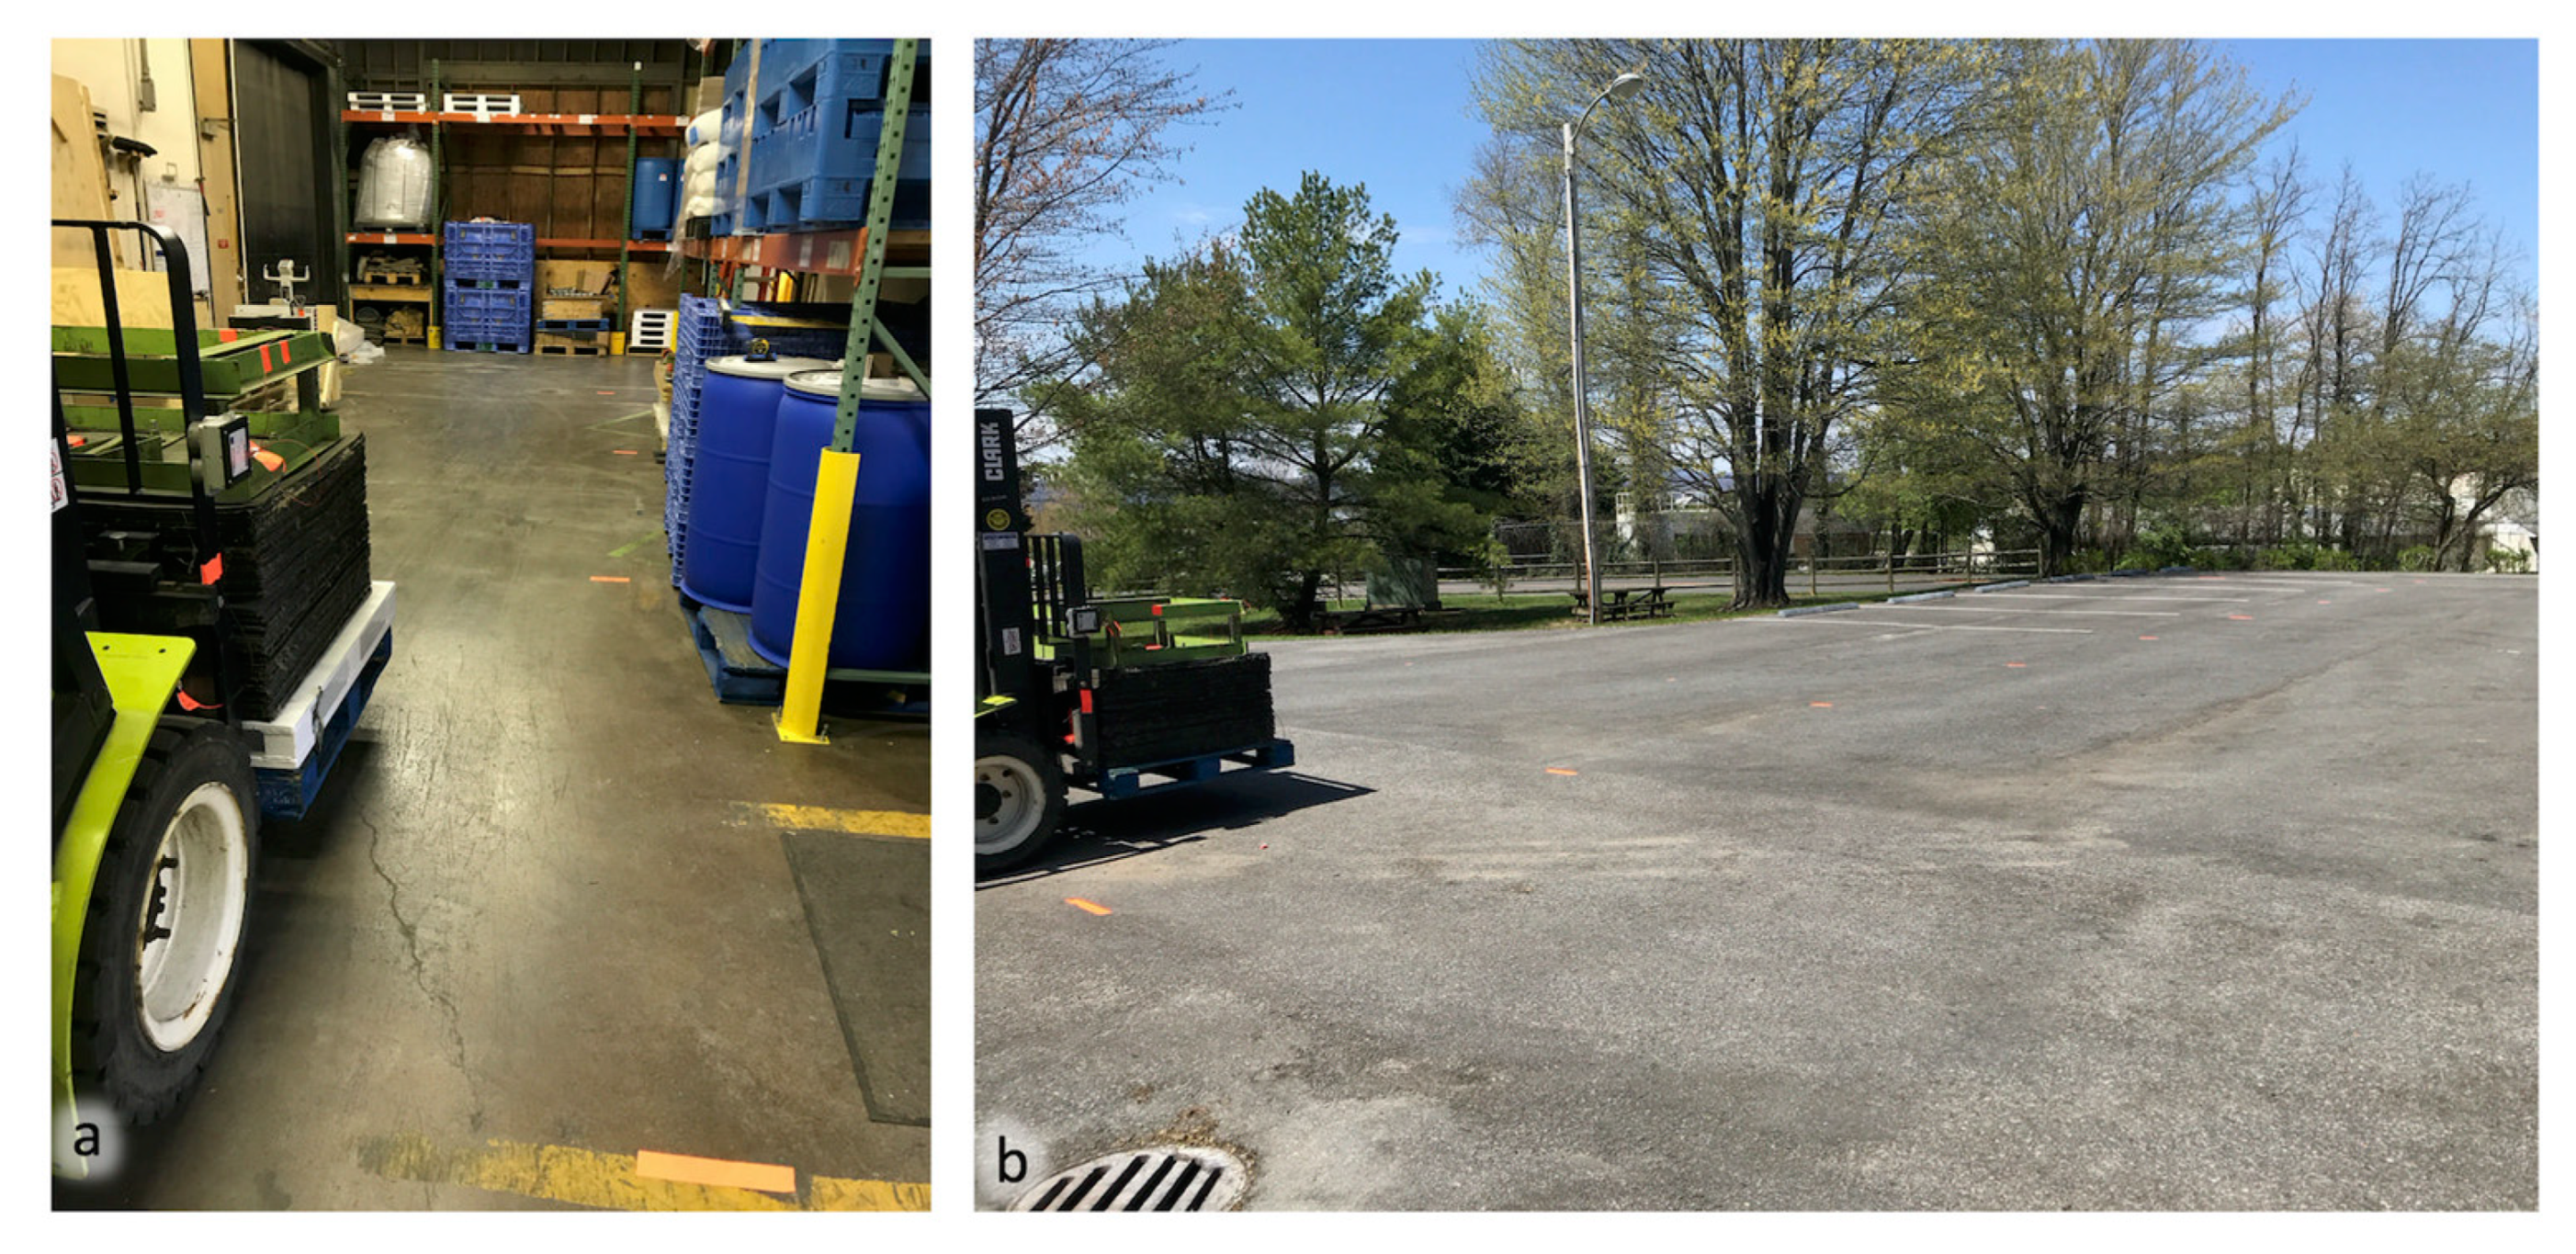
To capture the vibration levels experienced by the three types of forklifts on different operational surfaces, the study was conducted both inside and outside the laboratory facility. The internal floor surface used for this study comprised of concrete flooring. On the other hand, the external surface analyzed comprised of asphalt flooring (
Figure 2).
2.3. Load Conditions and Forklift Speed
The vibration levels of the forklifts were recorded according to the load carried. Two levels of semi rigid payloads were used in this study (680 kg and 1134 kg). The load was carried on top of a 1.219 m × 1.016 m block class, 4-way, non-reversible, perimeter base wooden pallet. Each of these were driven at two different travel speeds (3.22 km/h and 4.82 km/h).
2.4. Measurement System and Setup
The intensity of vibration caused by the forklifts was measured using a Lansmont SAVER 9X30 data logger (Lansmont Corporation, Monterey, CA, USA) under the different handling scenarios. The data recorder is a battery-powered instrument capable of measuring and recording the vibration environment. Two three-axis accelerometers (DYTRAN 3443C, Chatsworth, CA, USA) were connected to the Saver 9X30 data logger to record data in three different positions on the forklift. All SAVER 9X30s were configured with the following recording setup:
- -
Sampling rate: 1000 Hz
- -
Recording window for PSD: 15 s
- -
Total recording period: 15 min
- -
Anti-Aliasing filter frequency: 200 Hz
- -
Sample size: 15,000
- -
PSD resolution: 0.066 Hz
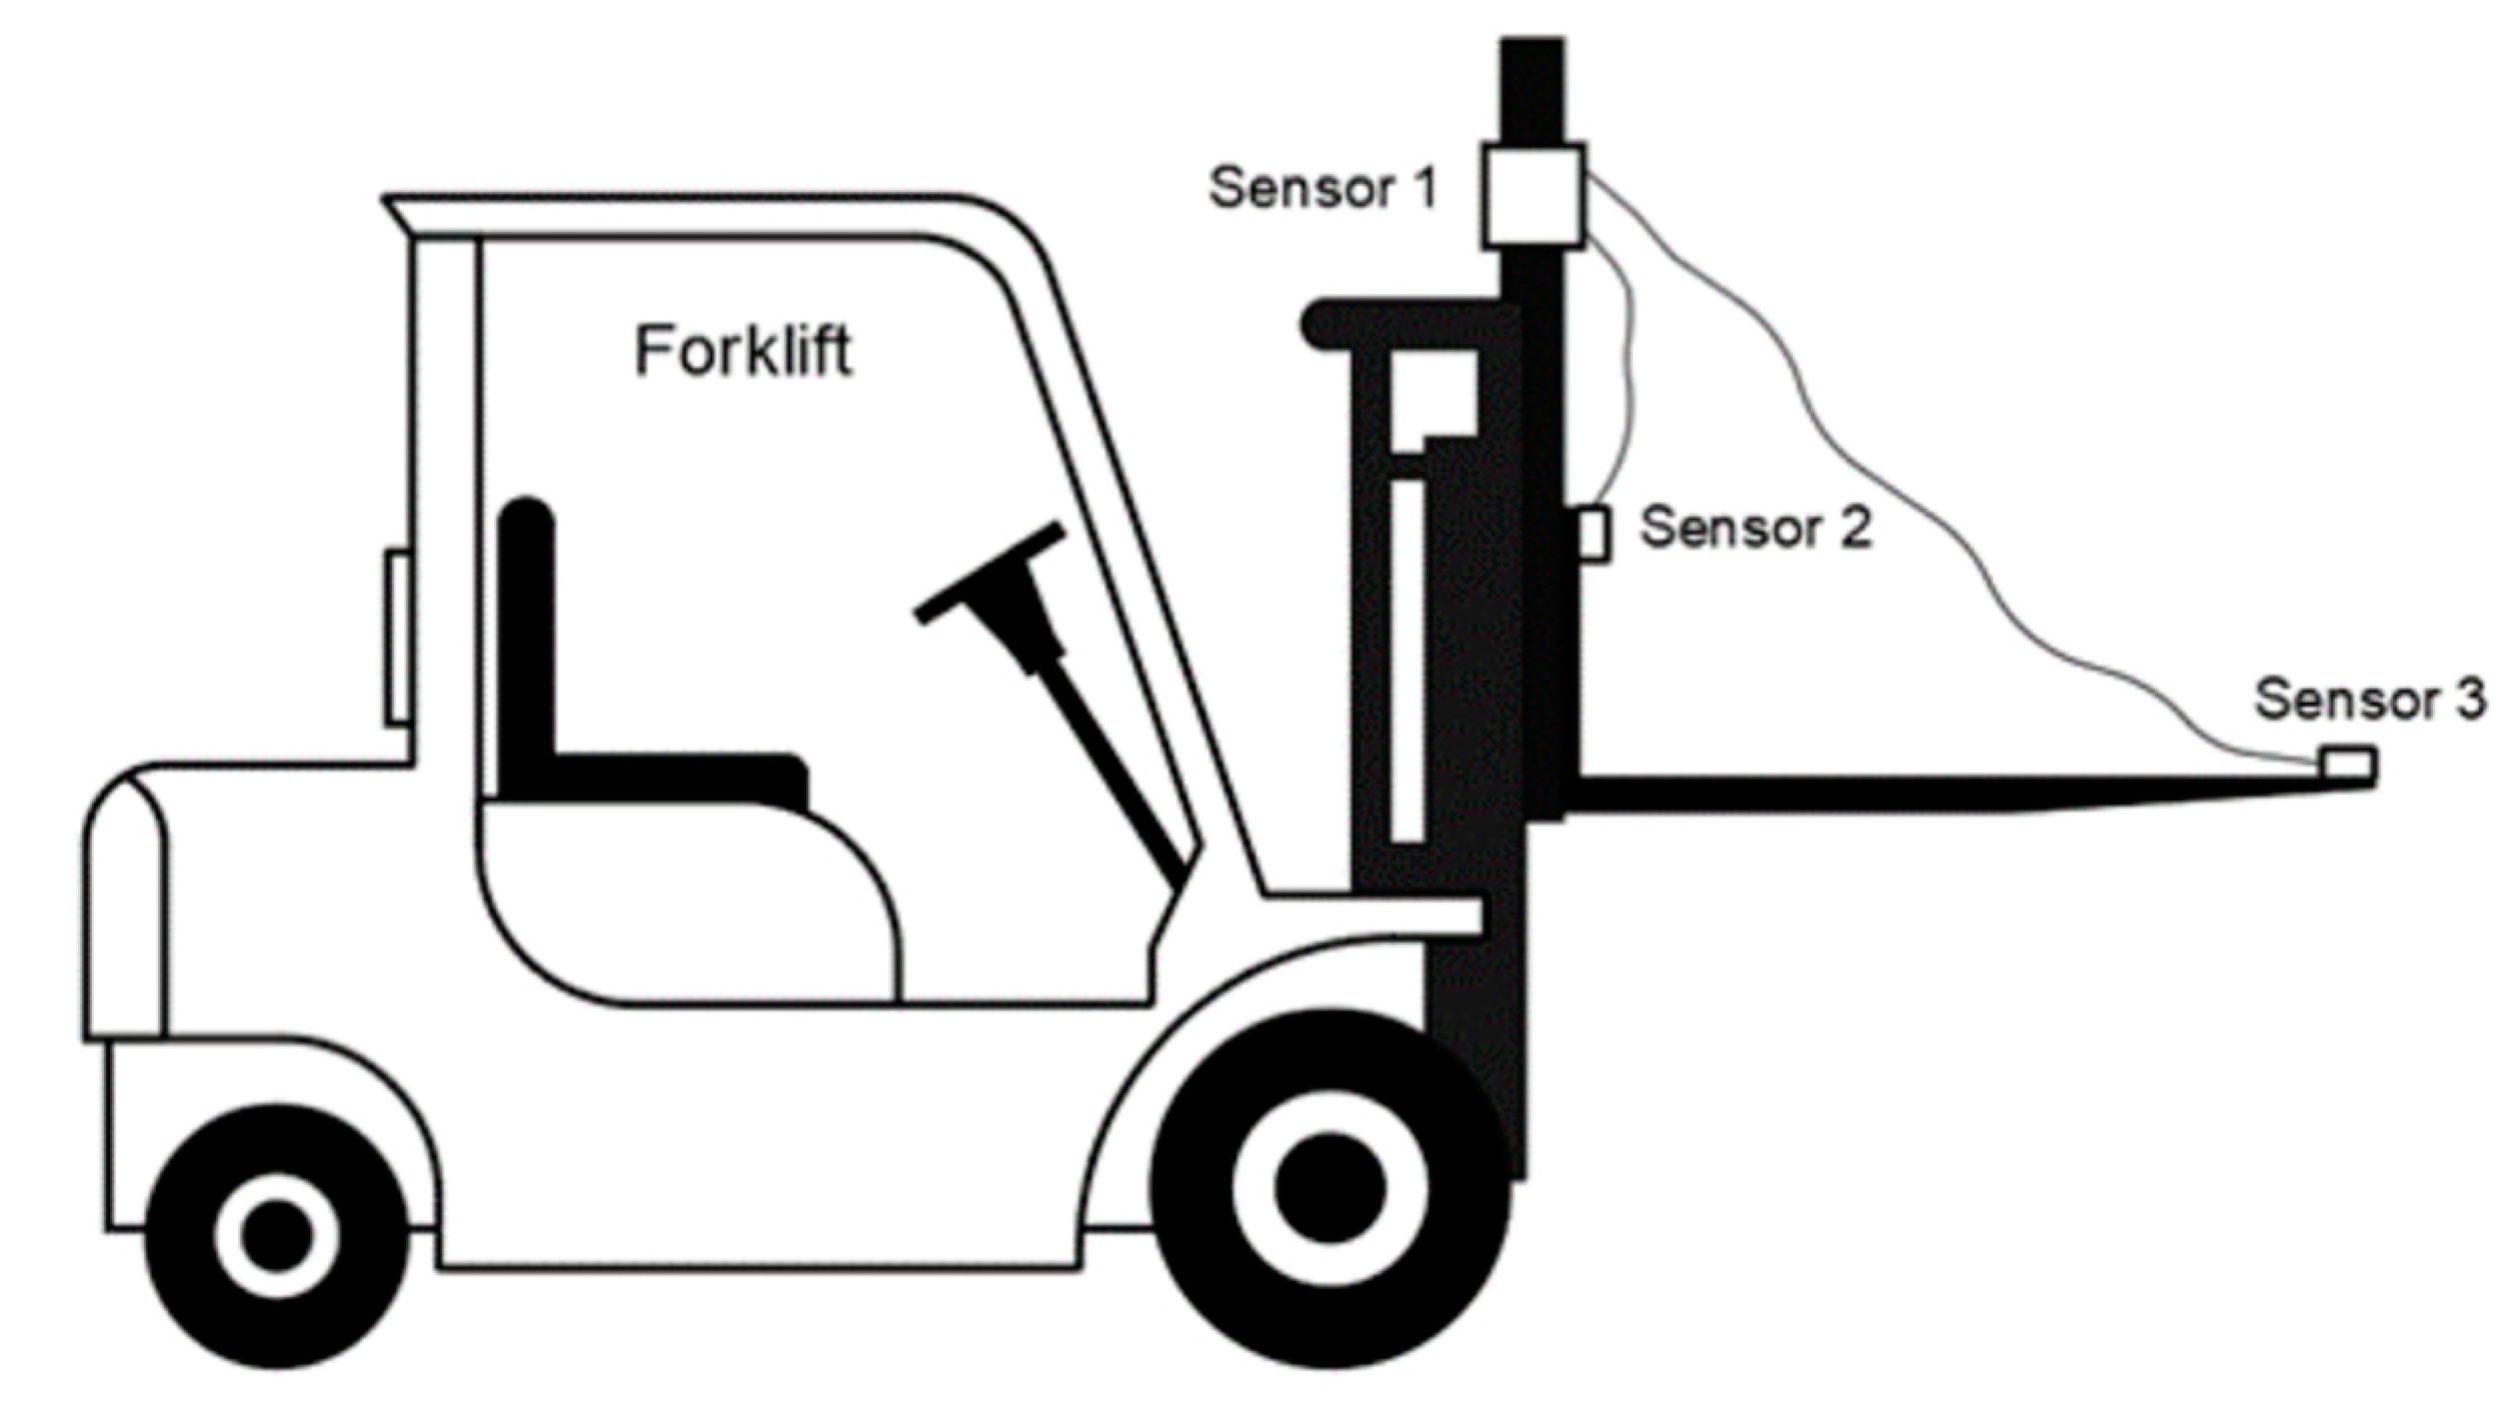
Vibration profiles were collected from three different positions (
Figure 3). Sensor 1 was placed on the carriage of the forklift. Sensor 2 was placed on the back of the heel of the fork tines, and sensor 3 was placed on the tip of the fork tines. The Saver 9X30 was mounted to the carriage using a magnetic mount. The two three-axis accelerometers were connected to the back of the fork tine heel and the fork tine tip using wax and tape to provide extra security. To collect the vibration data, the forklifts were driven on the different road conditions for 15 min, and recording was conducted only when the forklifts were in motion.
2.5. Data Analysis
The analysis was done using power spectral density (PSD) plots to analyze the effects of speed, road quality, forklift type, unit load weight, and sensor location on forklift vibration levels in more detail. PSD plots were prepared from the measured vibration data using fast Fourier transformation (FFT) of Xware software and MATLAB R2014a (MathWorks Inc, Natick, MA, USA). The values of the power density (PD) levels are presented between 1–200 Hz. This frequency range represents the vibration events that do not have enough intensity to influence the integrity of the product-package systems in general industry use. For easier comparability, the spectrum of the International Safe Transport Association (ISTA) 3B test procedure’s [
23] vibration profile is also shown in the figures.
Furthermore, this frequency range contains vibration responses that can be observed in small vehicle delivery from the vehicle body structure, suspension system, tire type, etc. Additionally, the overall Grms were calculated from the PSD spectra in each case and layer between 1–200 Hz. This way each vibration environment could be compared by the vibration intensity in the frequency range between 1–200 Hz that was generated by each of the three industrial forklifts under the different handling scenarios.
Statistical analyses of the collected vibration events were performed with the MATLAB R2014a software to find the calculated Grms values, which helped to more thoroughly understand the nature of the vibrations. These statistical characteristics show the kurtosis (K) of the probability distribution functions for these events using a 95% confidence interval (CI). The definition of kurtosis is as follows: when the standard normal distribution has a kurtosis of zero, then a positive kurtosis indicates a “heavy-tailed” distribution, compared to a normal Gaussian distribution. Presenting kurtosis values is very important because the random vibration testing controller in the laboratory, when engineers want to simulate vibration circumstances, mostly generates a control signal from normal distribution so that field measured kurtosis can be used as an input parameter to perform realistic variability for the random signal during vibration simulation in the laboratory.
3. Results and Discussion
The overall G
rms (1–200 Hz) and the kurtosis values for distributions of G
rms values are presented in
Table 1 while the trends in overall G
rms for the carriage and the tip of the forklift tines are presented in
Figure 4 and
Figure 5. Out of the three locations investigated, the data obtained for the carriage and the back of the fork tine heel were identical. Thus, only the data obtained for the carriage and the tip of the fork tines were further analyzed. Based on the overall G
rms values, forklifts experience higher vibrations on the tip of the fork tine compared to the carriage.
The maximum acceleration level observed while recording measurements was 1.73 G (with a duration of 8 ms); it was observed for the electric forklift on asphalt while carrying a payload of 1134 kg and driven at 4.8 km/h. The kurtosis values of the probability distribution functions of recorded acceleration events at the back of the fork tine heel, fork tine tips, and forklift carriage were 0.51 to 6.59, 1.05 to 13.81, and 1.26 to 10.28, respectively. It should be noted that timer-triggered data should not automatically be considered random vibration with normal distributions as stated in previous studies [
24,
25,
26,
27,
28]. This study revealed that, similar to other modes of transportation, the random vibration observed for forklifts was non-Gaussian in nature.
A second analysis was done using the PSD plots to analyze the effects of speed, road quality, forklift type, unit load weight, and sensor location on forklift vibration levels in more detail. Furthermore, a comparison of vibration levels was performed between the ISTA truck vibration profile and these forklifts (
Figure 6). The PSD plot with the highest G
rms value for each forklift type is also presented in
Figure 6. The highest intensity peaks were observed for the gas and electric forklifts and were between 3–4 Hz. Meanwhile, the peak shifted to 4–5 Hz for the reach truck, indicating that its suspension system is much stiffer than the suspension of the other two forklifts. When compared to the PSD plot of the ISTA-recommended vibration test spectrum, it was observed that trucks experienced higher vibration levels compared to forklifts, especially for the higher frequency regions above 10 Hz.
Additionally, based on the PSD profiles and the overall G
rms values, it was observed that the gas-powered forklift presented the highest vibration intensity. The electric forklift presented the second highest vibration intensity, and the reach truck showed the least intensity. Forklifts driven on asphalt were found to experience higher levels of vibration compared to forklifts driven on concrete. These findings are similar to other truck and rail vibration measurement studies that have been done in the past [
7,
8,
9,
13,
14].
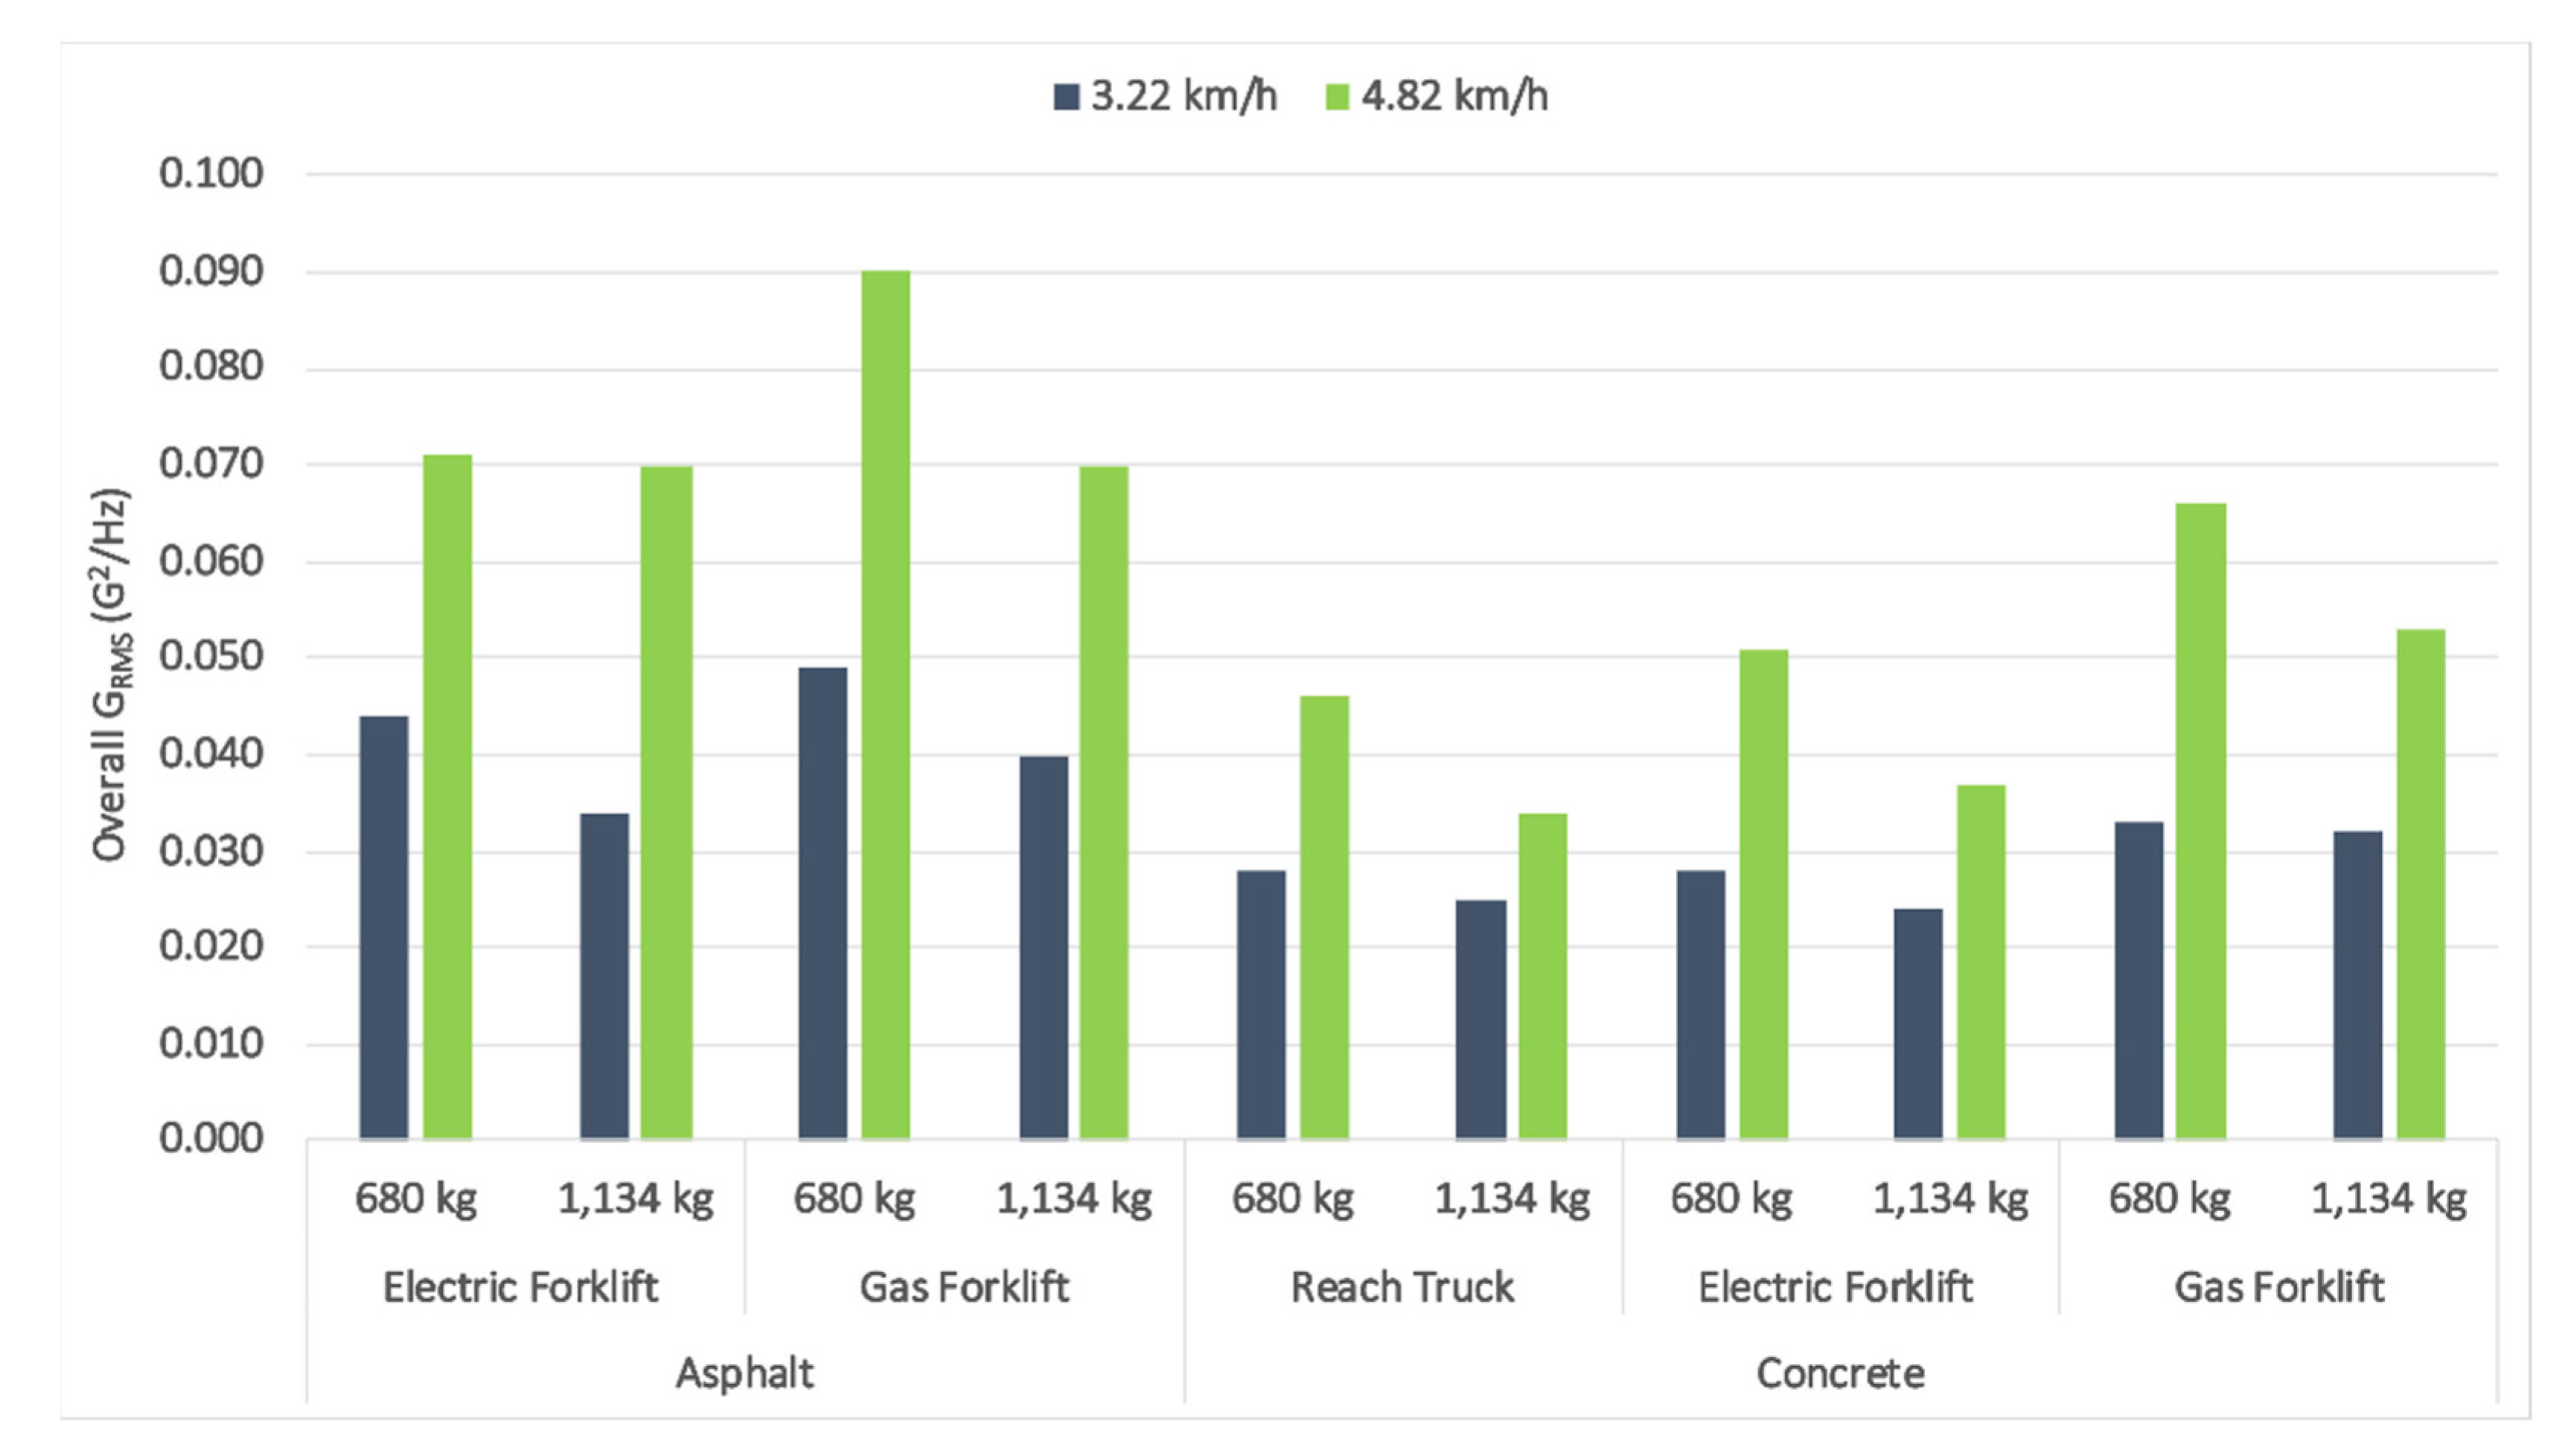
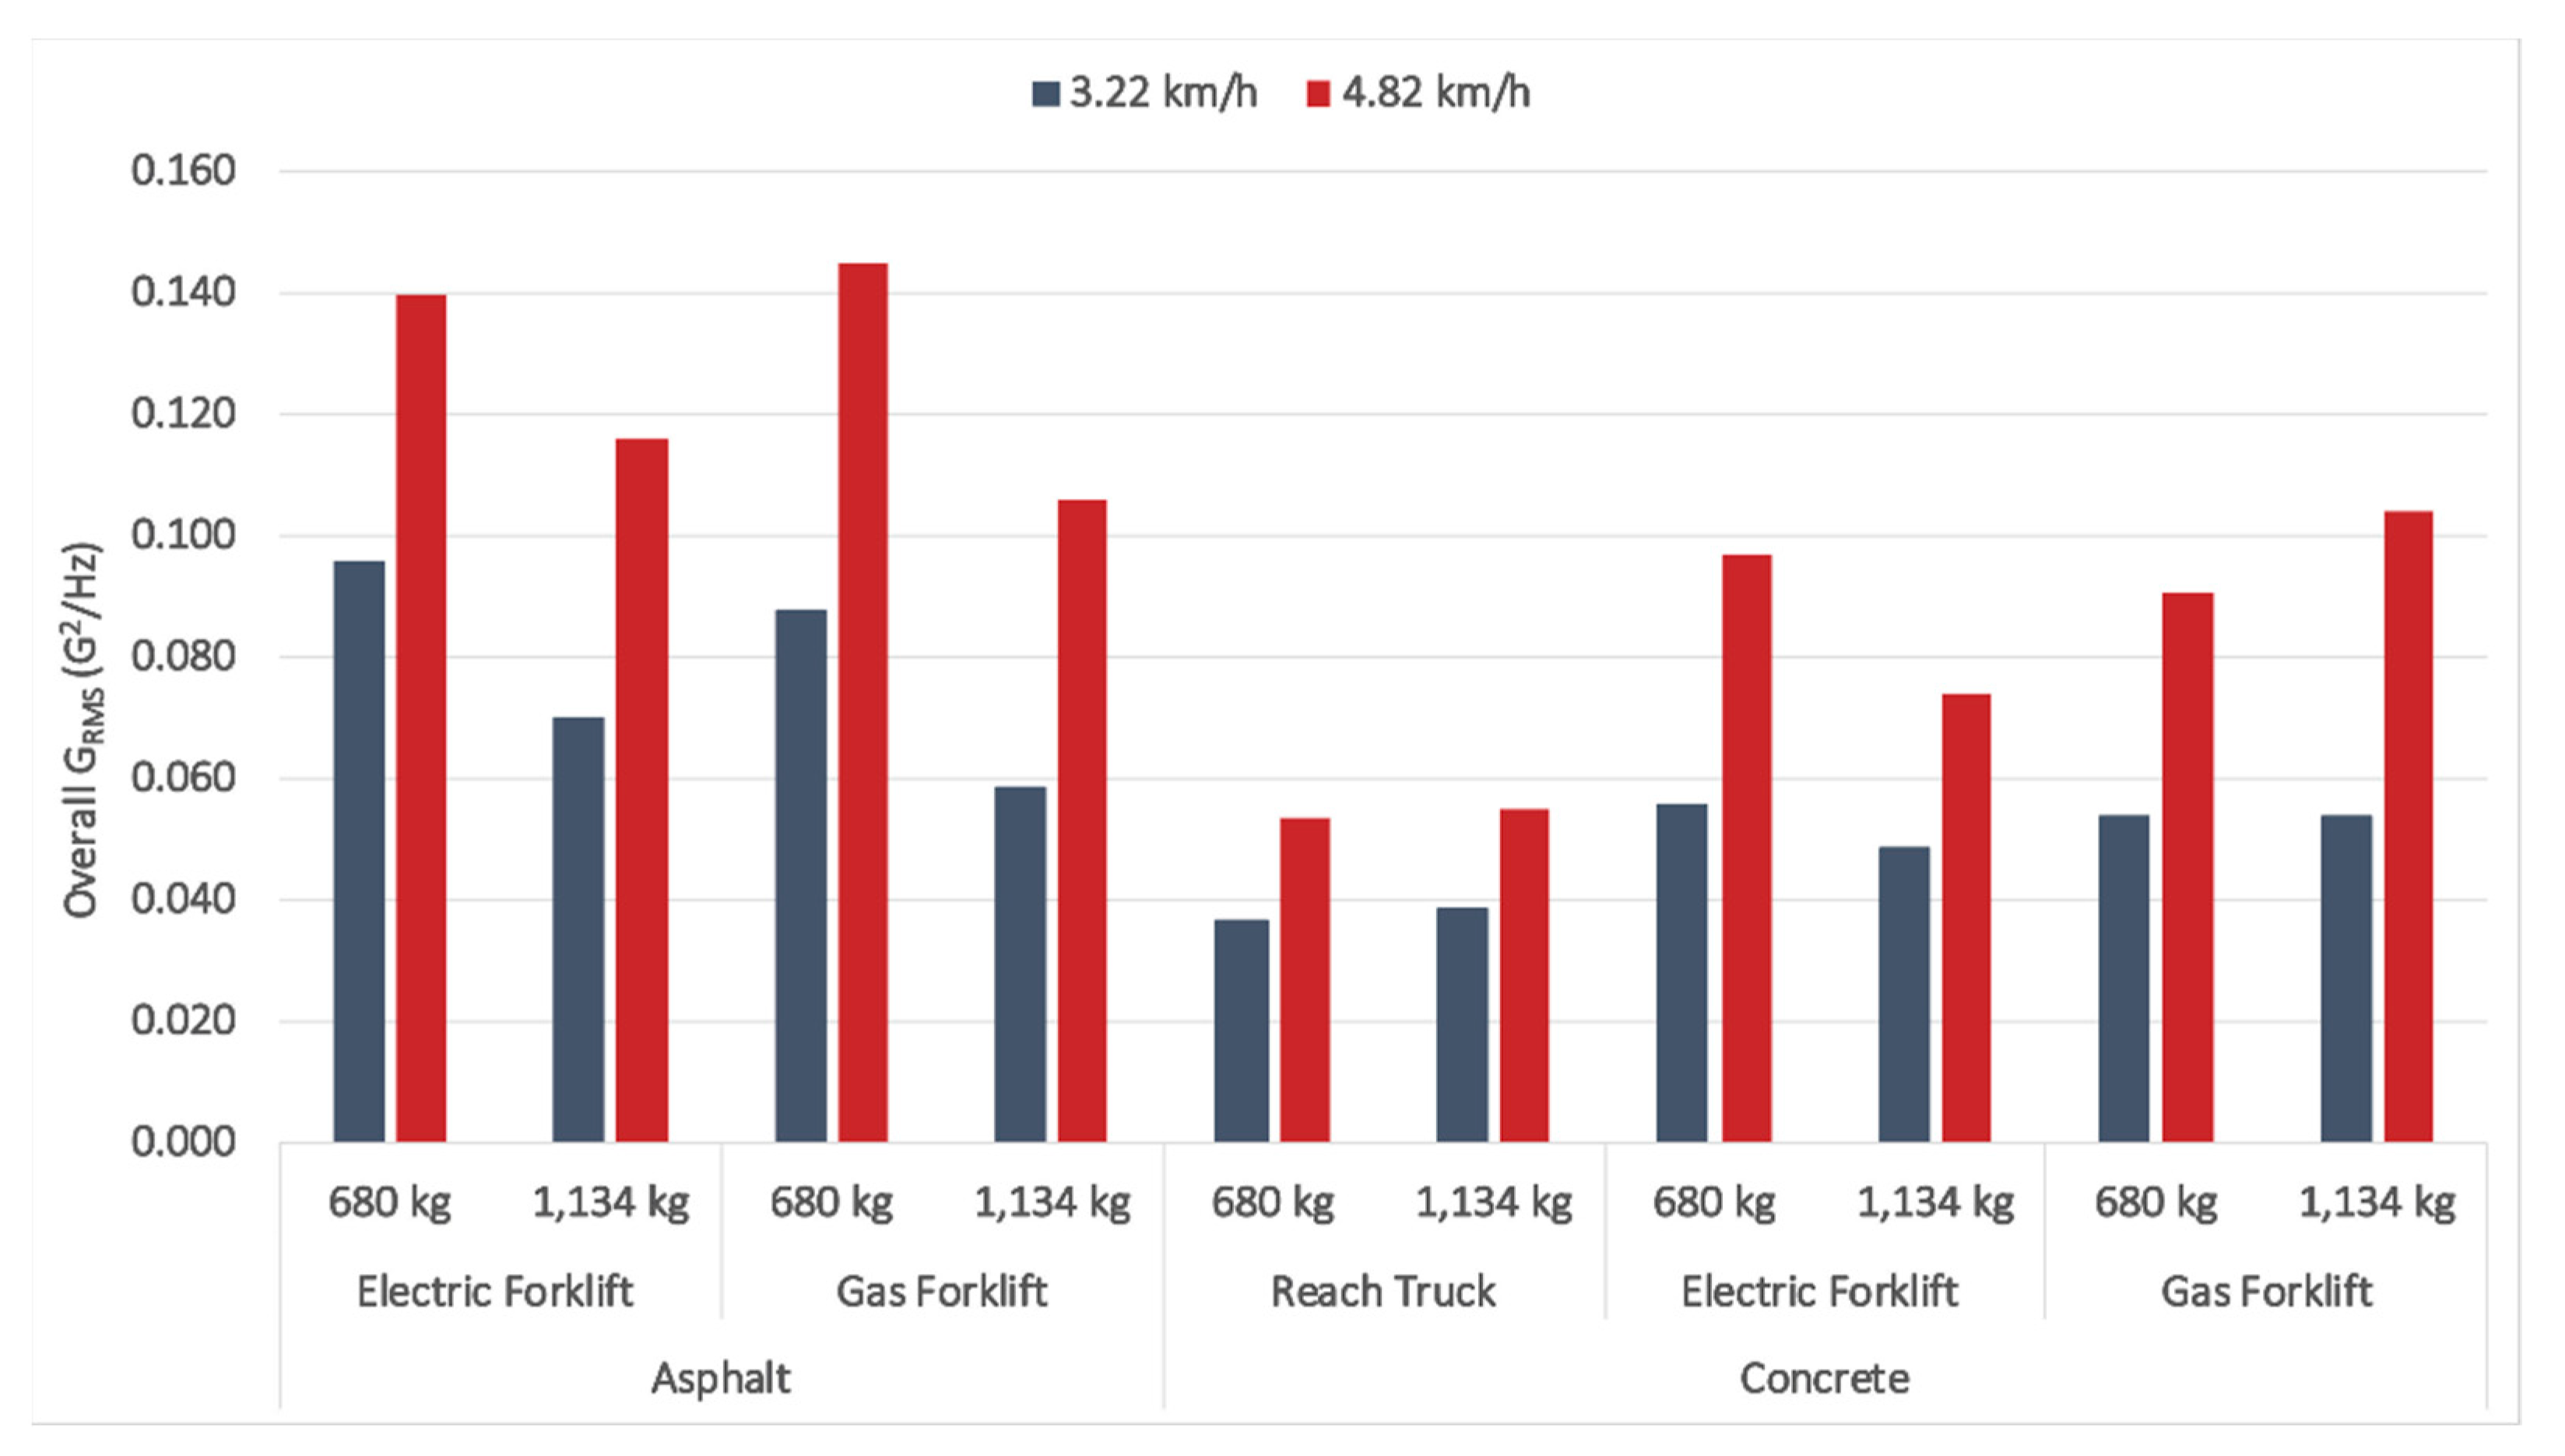
The results revealed that, for both the carriage and the fork tine tip, vibration levels increased with increasing speed. The highest Grms observed at 3.22 km/h was 0.096, while the lowest overall Grms was 0.024. Similarly, the highest Grms observed at 4.82 km/h was 0.145, while the lowest Grms was 0.034.
Additionally, it was observed that the vibration levels decreased with the unit load weight carried by the forklift. The highest overall Grms observed at 680 kg was 0.145, while the lowest overall Grms was 0.028. Similarly, the highest overall Grms observed at 1134 kg was 0.116, while the lowest Grms was 0.024.
Overall, the gas-powered forklift driving on the asphalt condition at 4.82 km/h, while supporting a 680 kg payload, experienced the highest vibration among the three forklifts studied, with an overall Grms of 0.145. This Grms level is much smaller than what is generally observed for trucks and small vehicles such vans or motor cars; however, it is only marginally smaller than what is observed for railcars.
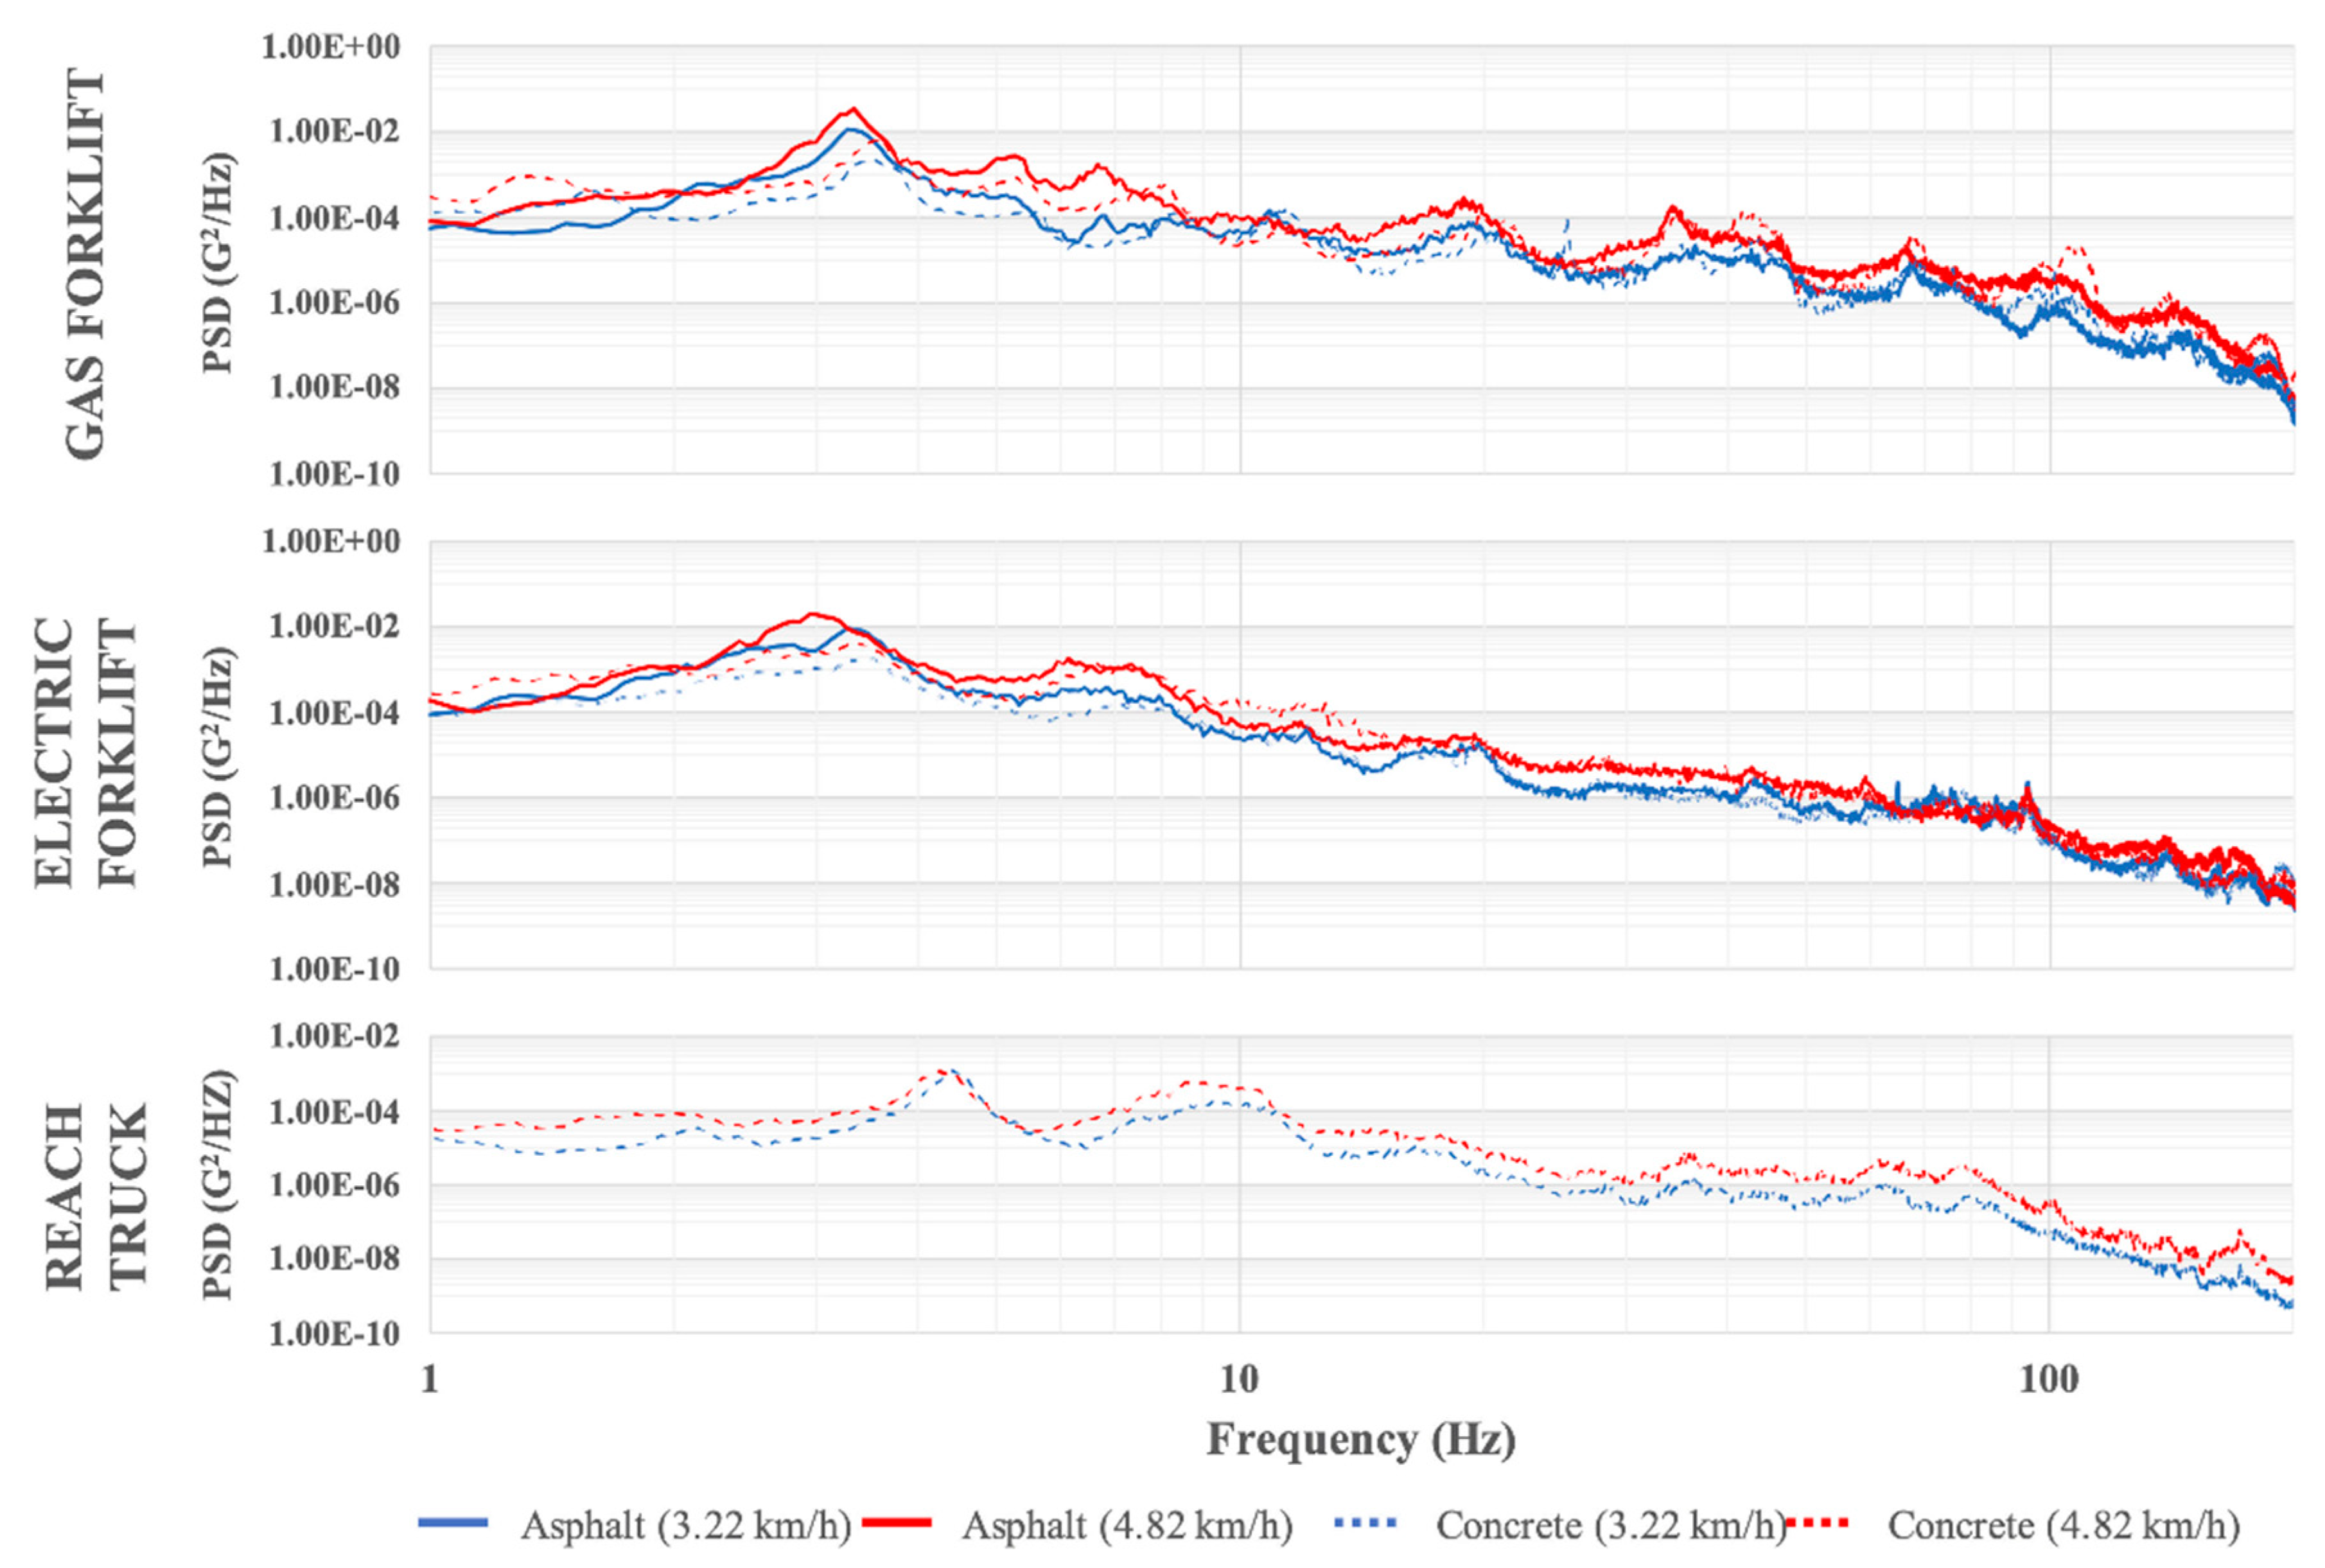
3.1. The Effect of Speed on the PSD
To determine the effect of speed on the vibration levels, PSD spectra were collected and analyzed for the three forklifts (
Figure 7). A comparison of the speed effect was conducted based on the forklift and road type. The highest intensity vibration was observed at the fork tine tips, therefore data analysis was conducted using vibration levels obtained at the tips of the fork tines, while carrying a 680 kg payload.
For all three types of forklifts, it was observed that increasing the speed of the forklift increases the vibration intensity by around 2 dB. This change was consistent for both investigated road types.
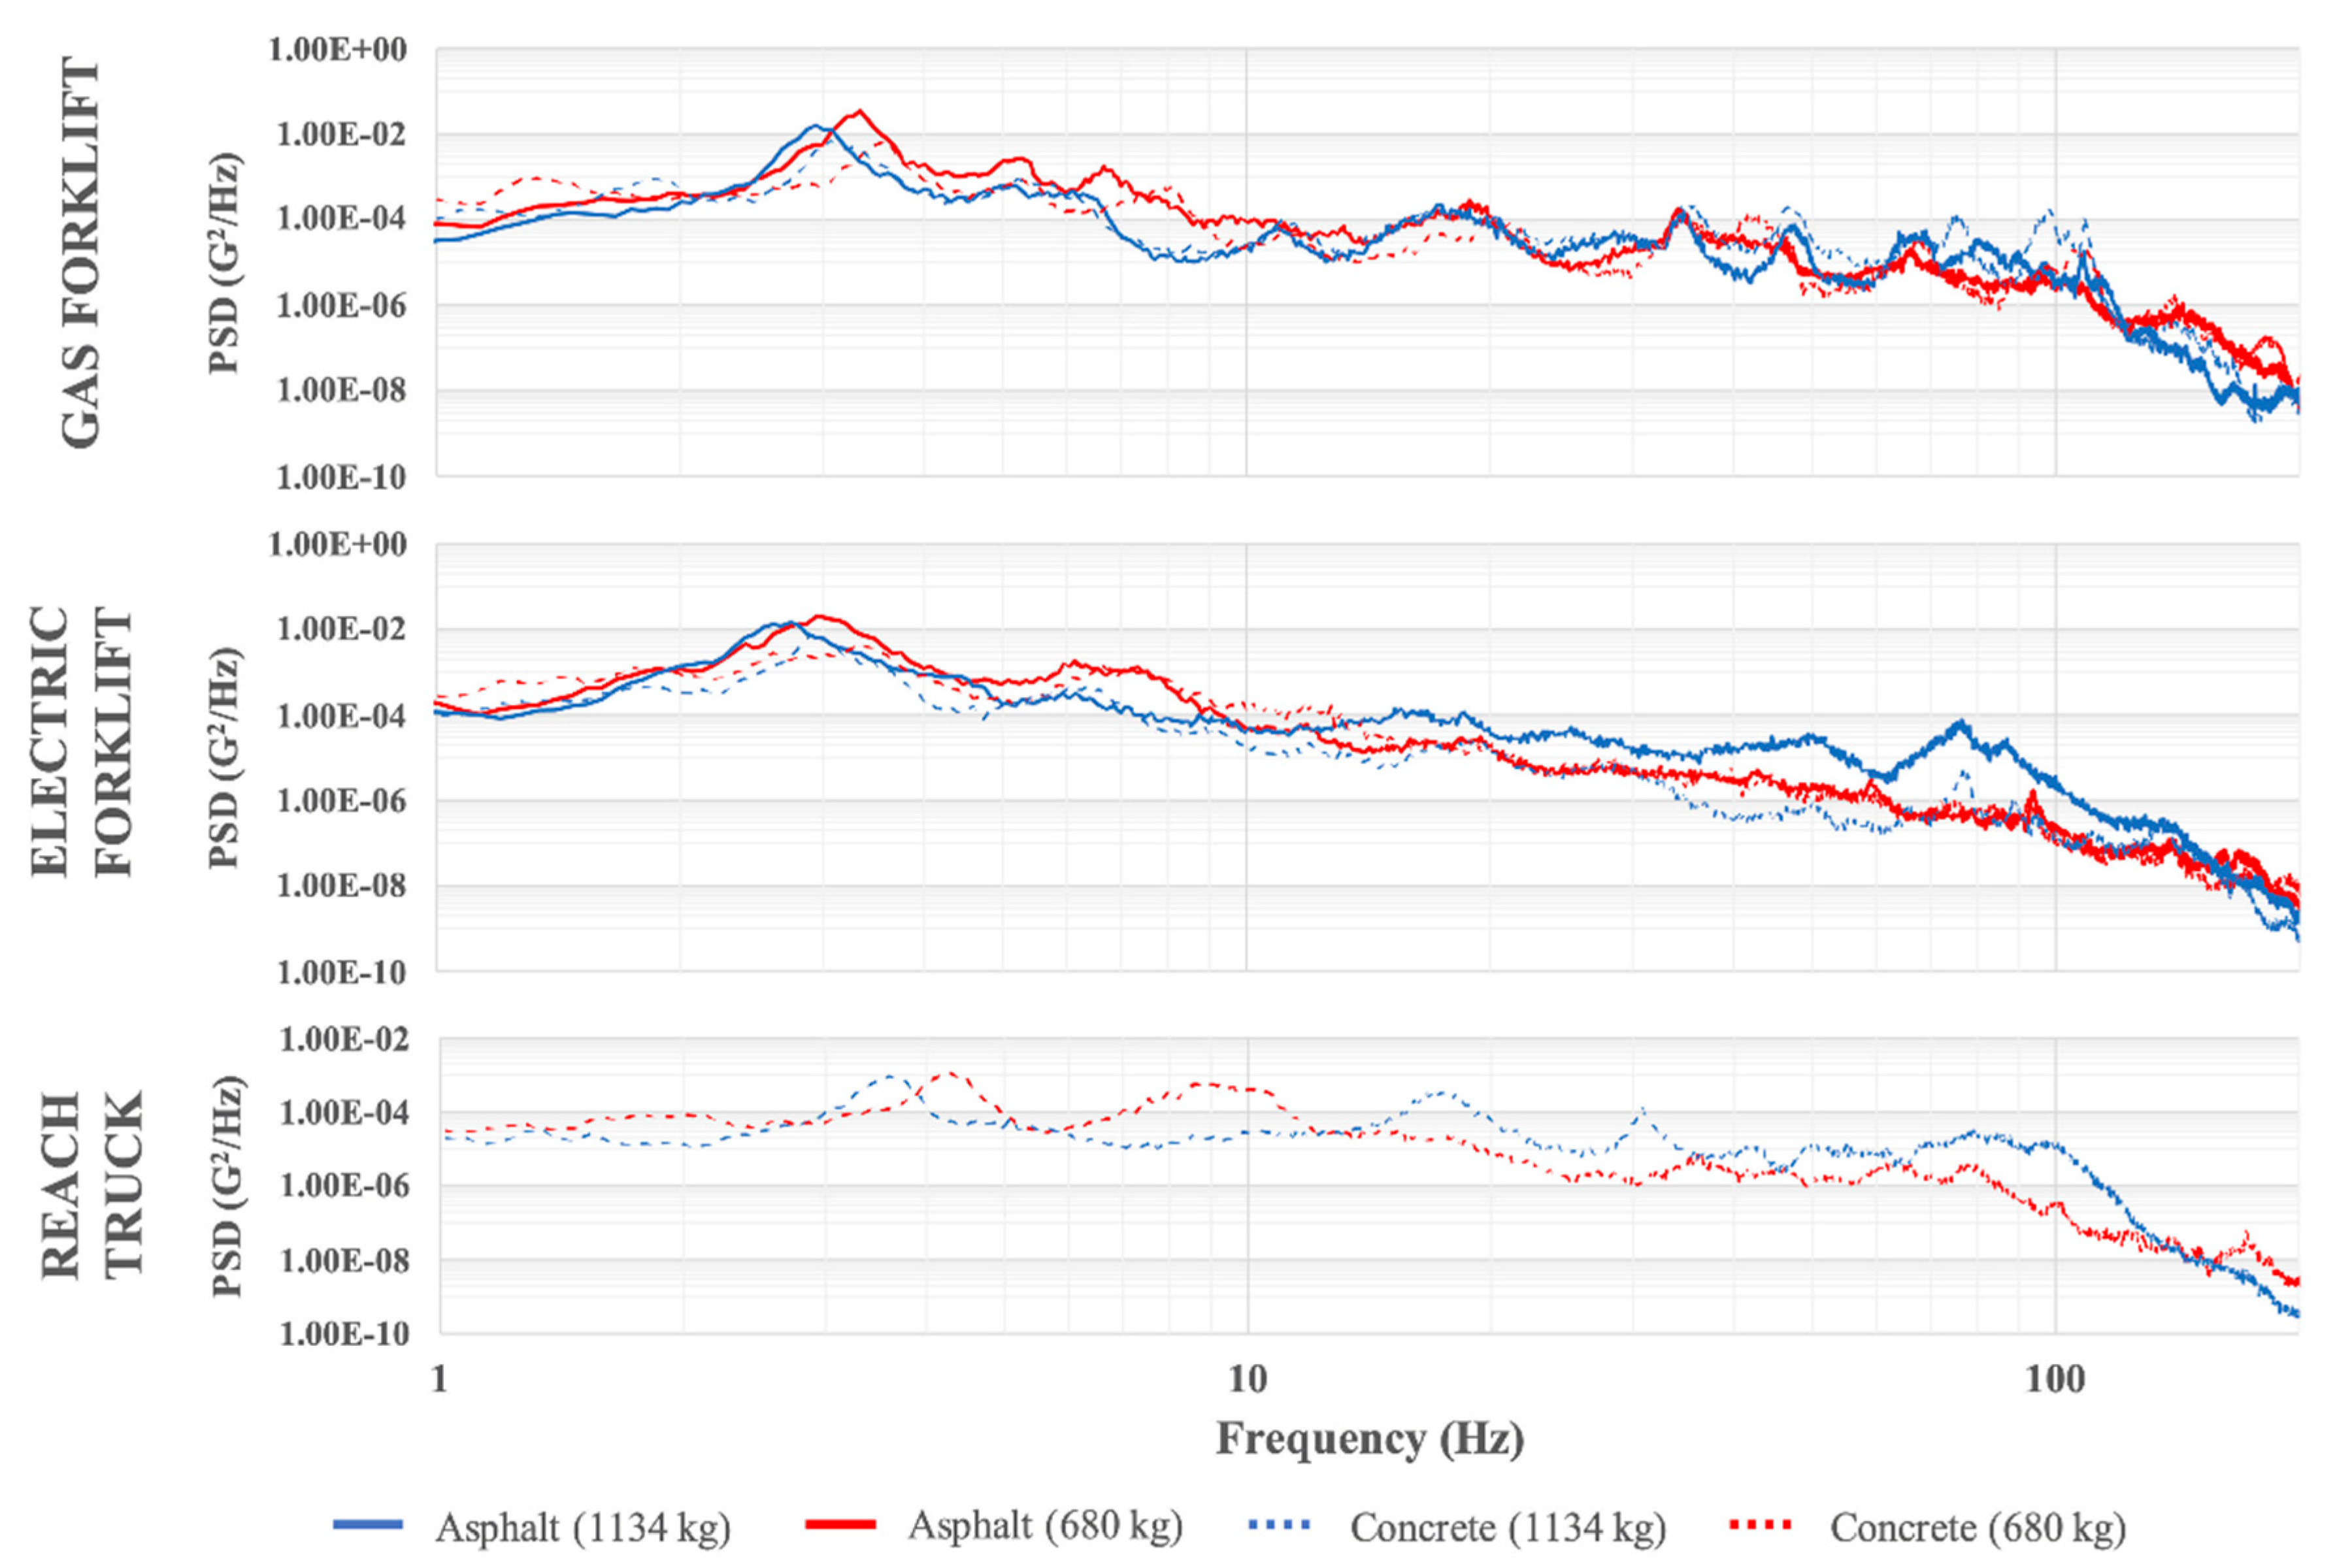
3.2. The Effect of Payload on the PSD
To determine the payload weight’s effect on the vibration levels, PSD profiles were collected and analyzed for the three forklifts (
Figure 8). The comparison was conducted using vibration data measured at the fork tine tip while traveling at a speed of 4.82 km/h, because this speed created the highest intensity vibration. The results showed that for the investigated forklifts, more payload probably suppressed the vibration to lower levels, predominately at lower speeds. It was also found that the 3–4 Hz peak, which is generally attributed to the suspension system of the vehicles, shifted to a lower frequency as a consequence of the increase in weight. It was observed that the peaks for overloaded trucks shifted to a lower frequency in comparison to normally loaded trucks. This observed behavior is expected because the natural frequency of an object tends to decrease with the increasing weight of the spring mass system. In addition, increases in the high frequency region were observed for the electric forklift and the reach truck, but not for the gas forklift.
3.3. The Effect of Road Condition on the PSD
To determine how the road surface affects vibration levels, PSD profiles were collected and analyzed for only two of the forklifts types (
Figure 9). Because the reach truck is generally not driven outside, and thus was not part of this analysis. The comparison was conducted using vibration data measured at the fork tine tips using the parameters that resulted in the highest vibration intensity, which was a speed of 4.82 km/h and a weight of 680 kg. The intensity of vibration increased with the increasing roughness of the road (
Figure 4 and
Figure 5). The greatest change was observed for the first peak of the PSD observed at 3–4 Hz. The intensity of the peak increased and slightly shifted towards the lower frequency region when the forklift was driven on asphalt, compared to concrete.
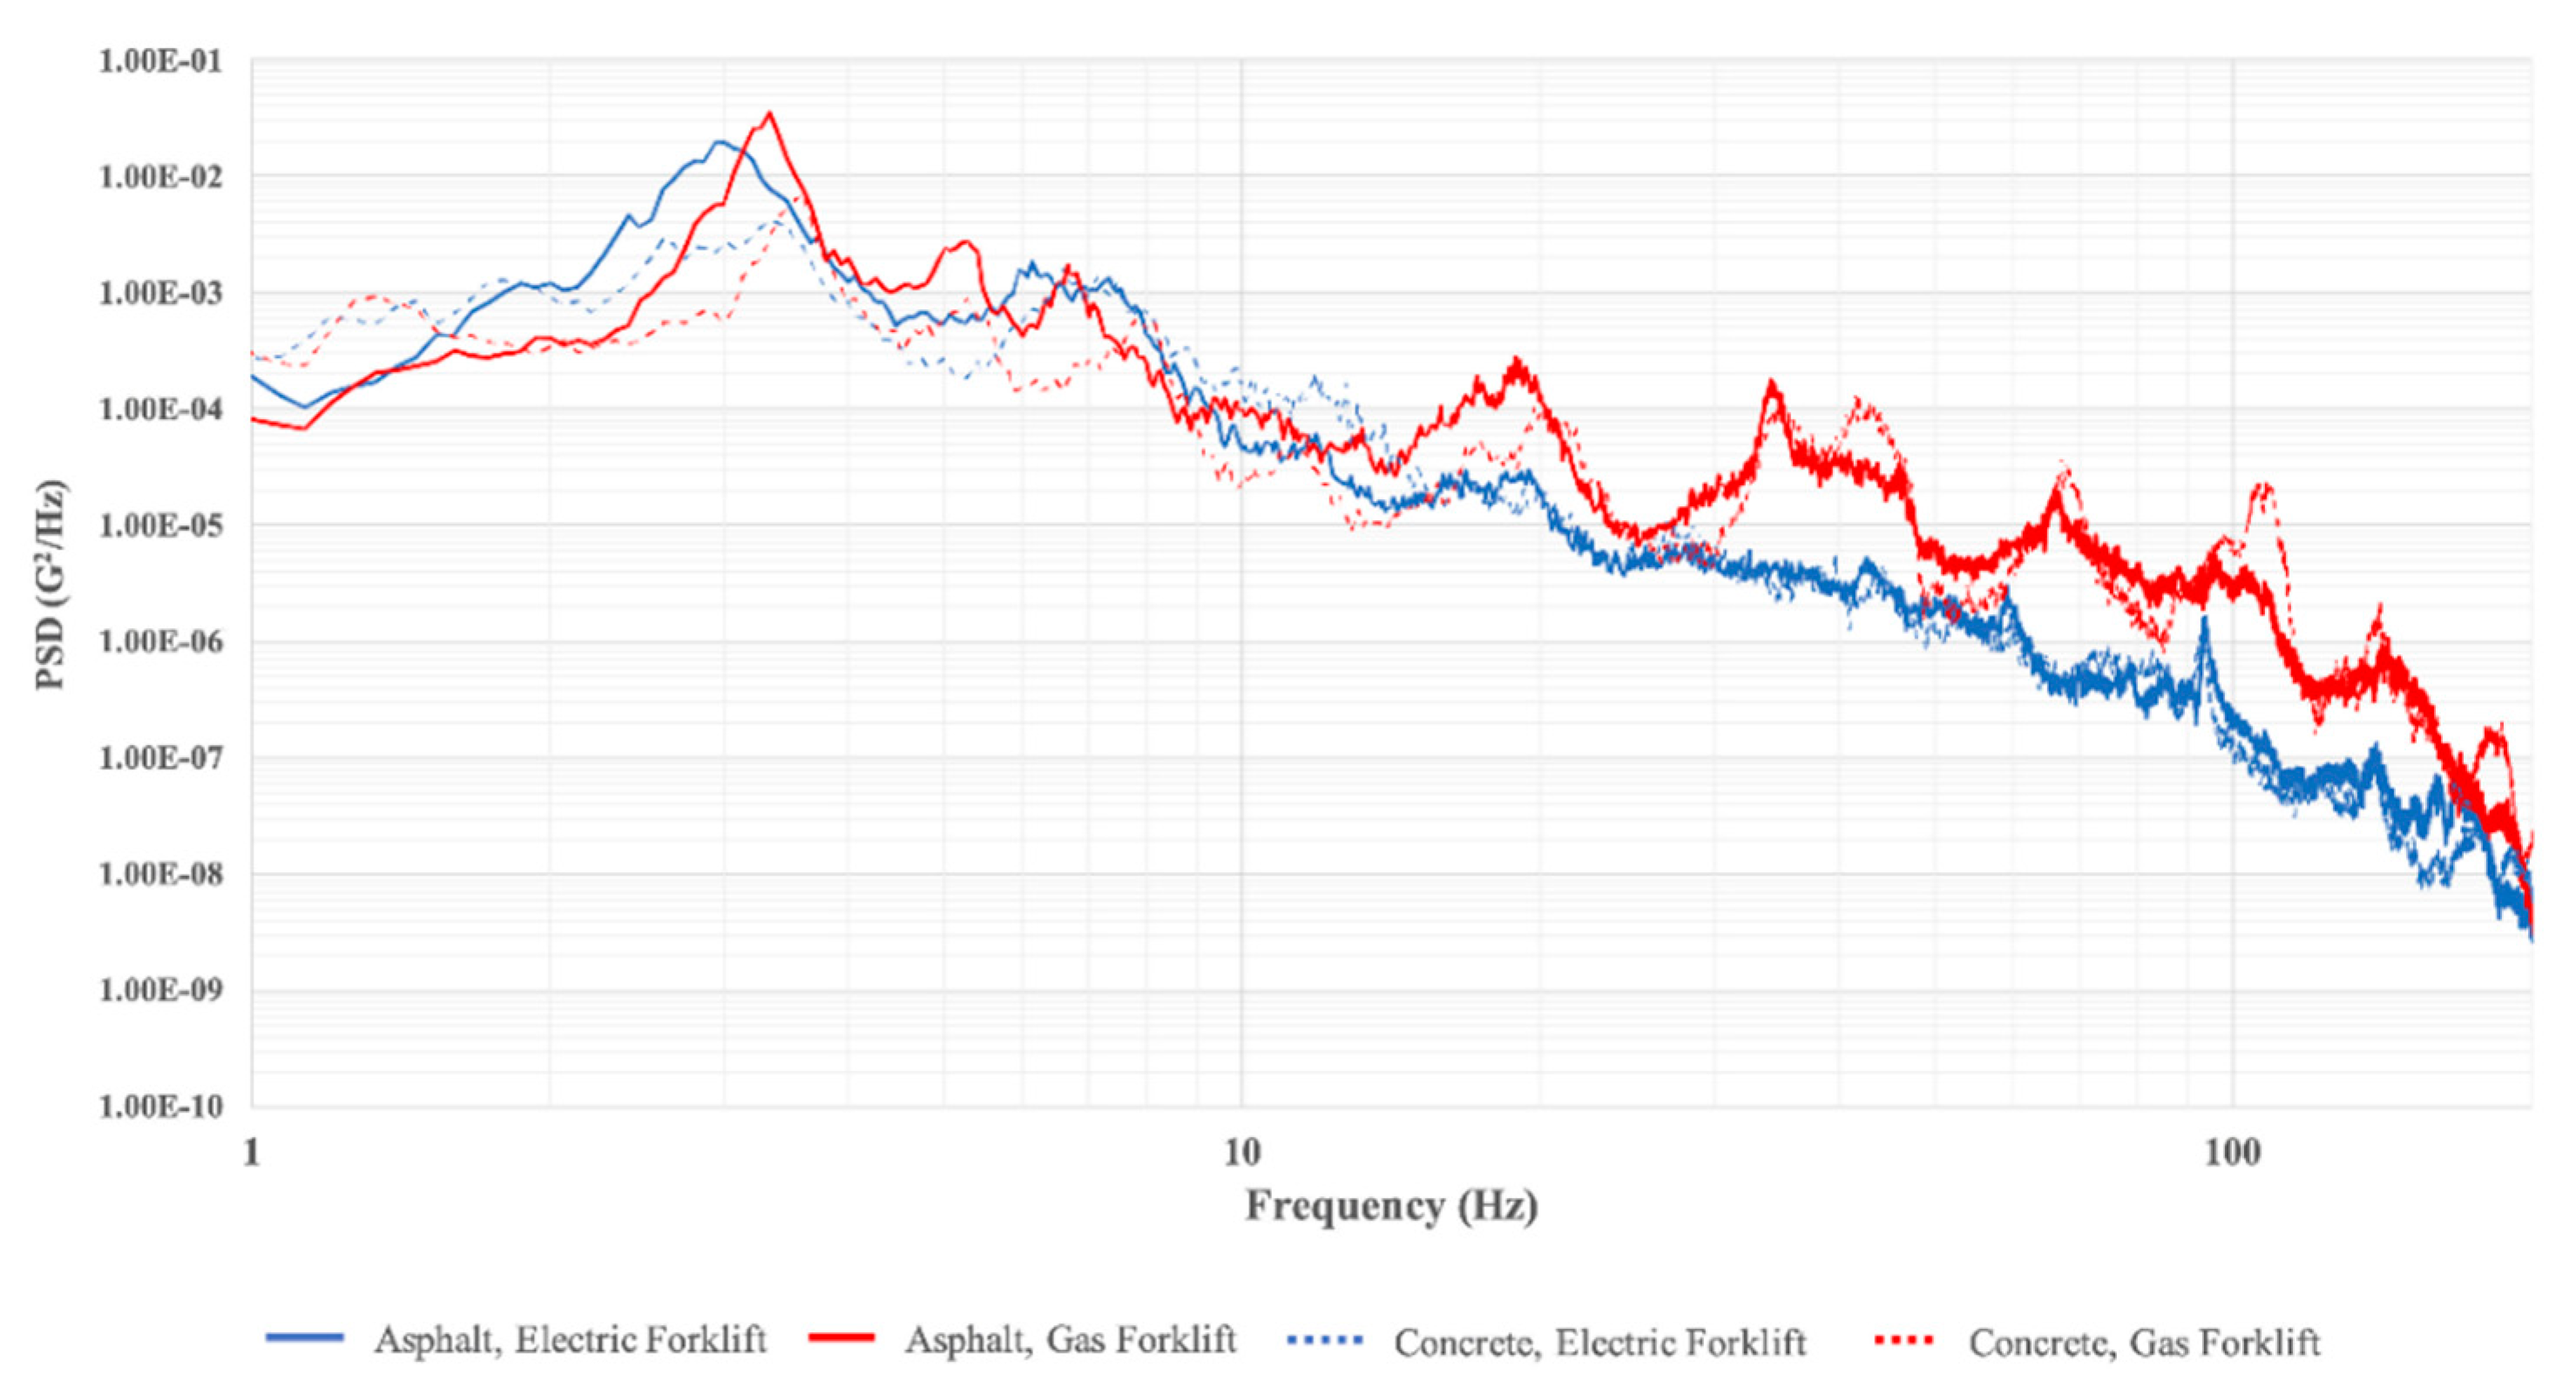
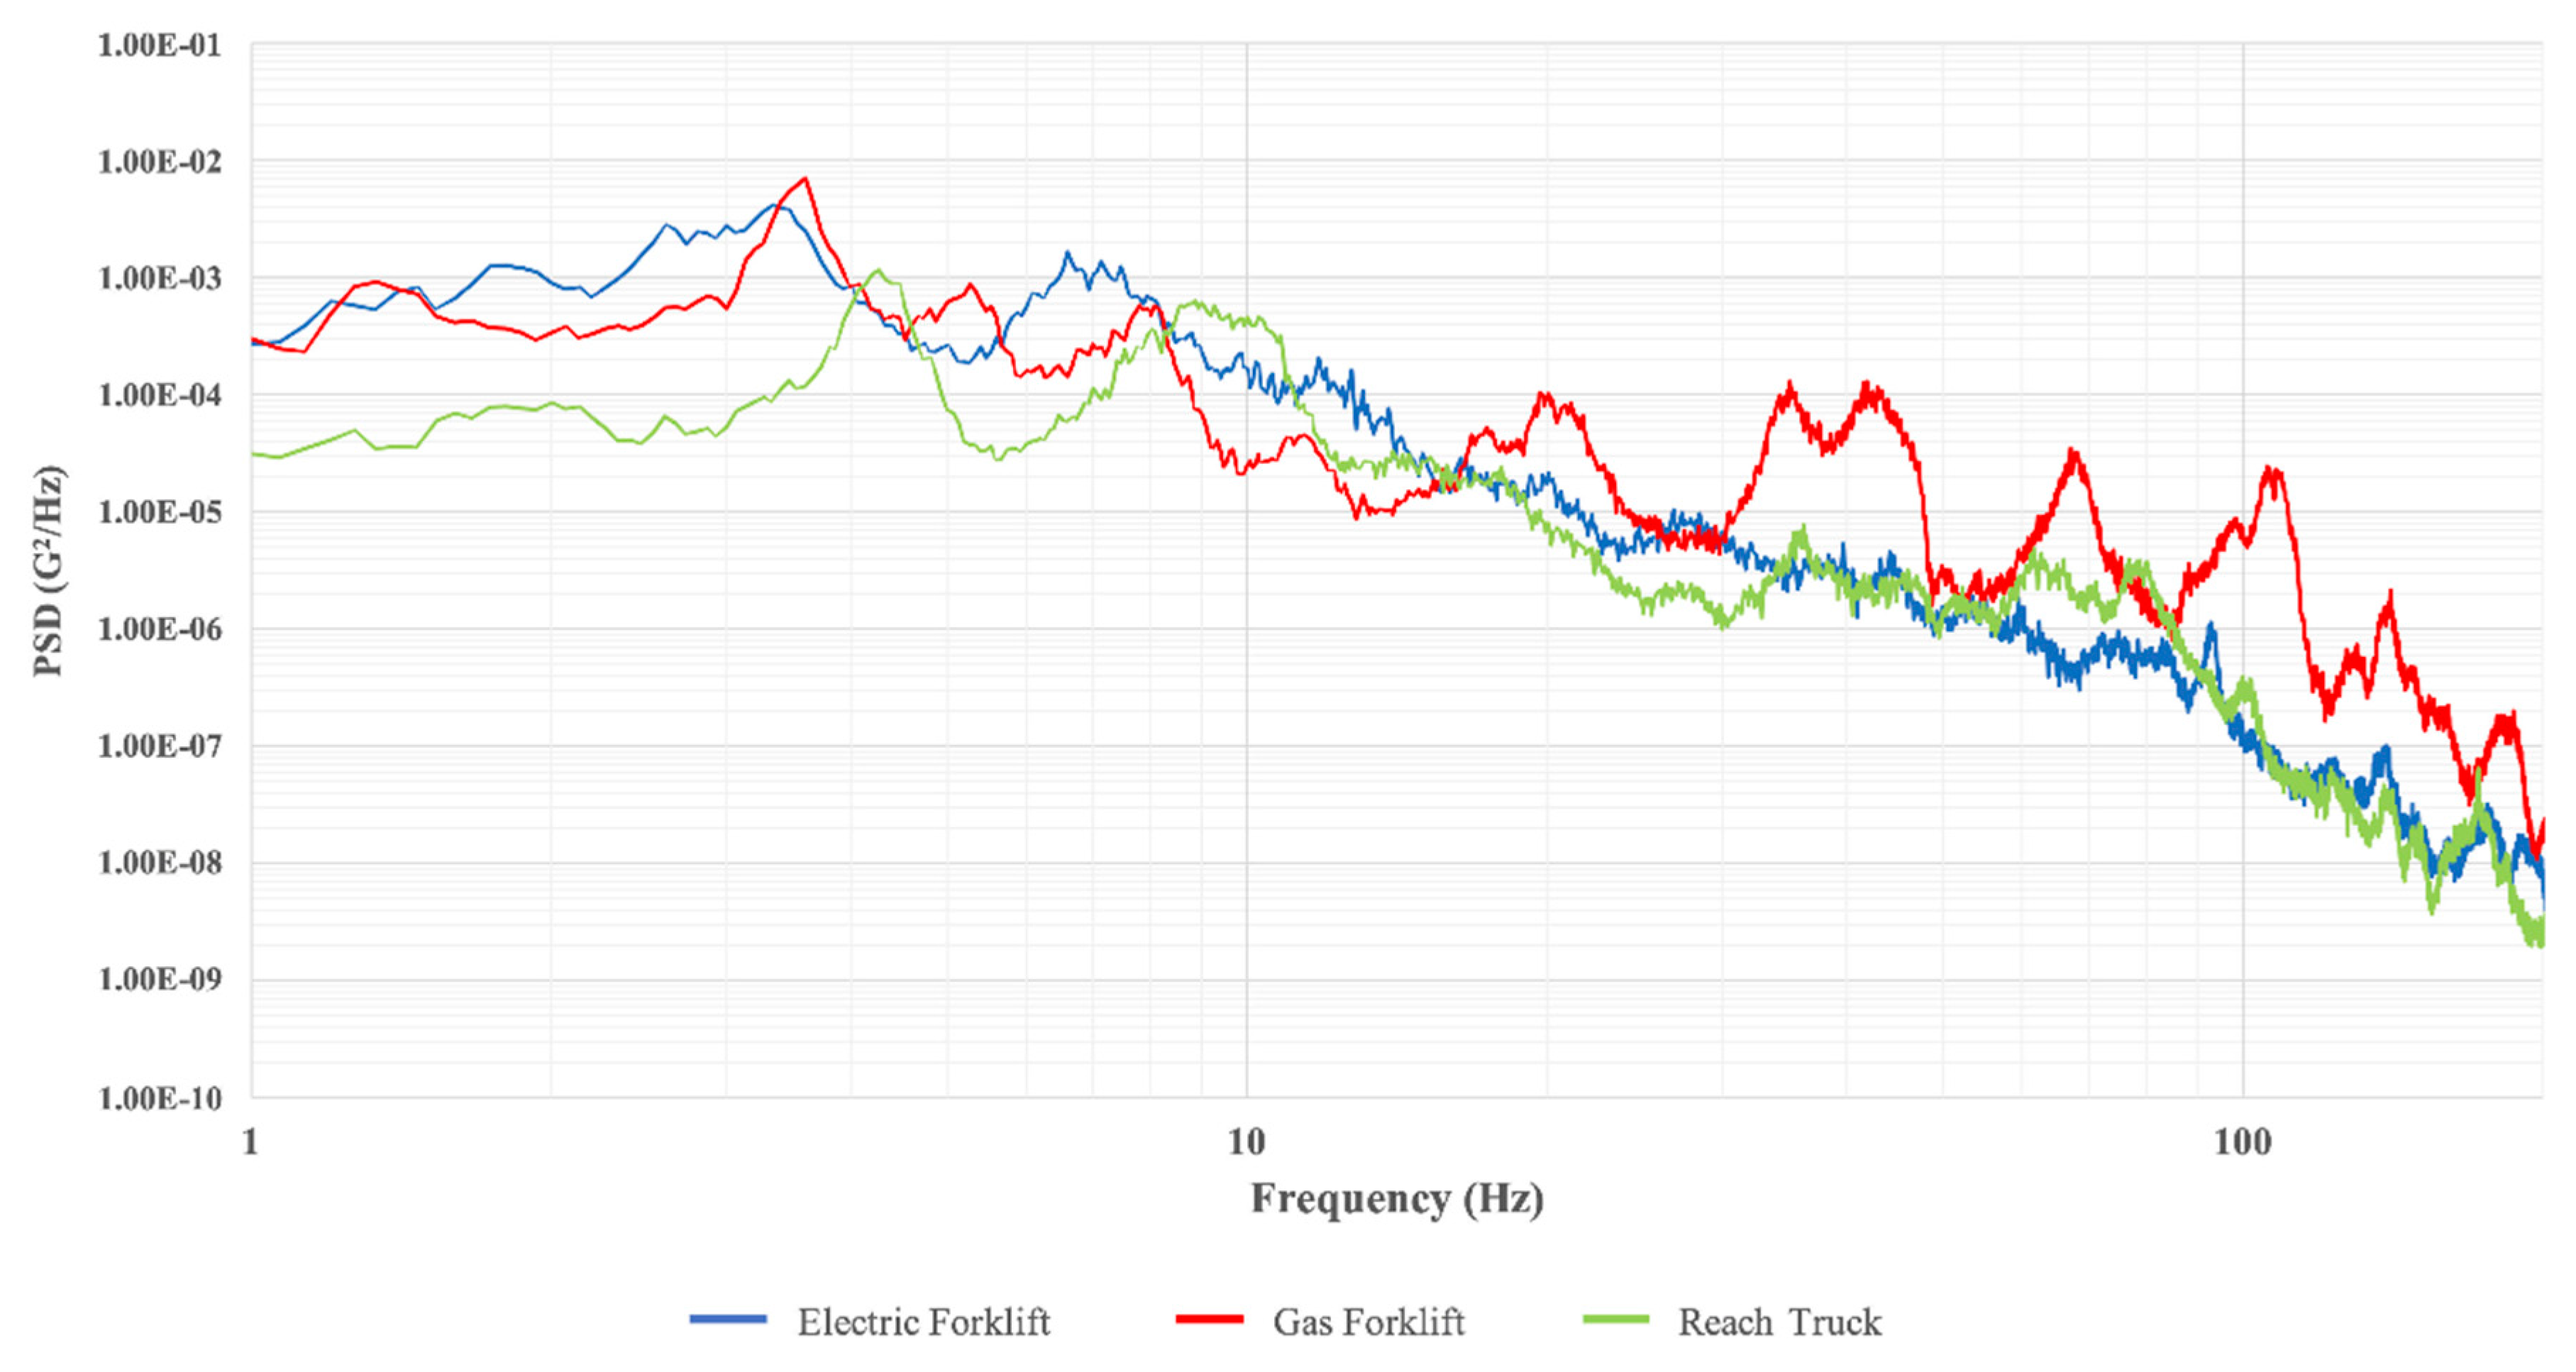
3.4. Effect of Forklift Type on the PSD
To determine how vibration levels varied due to the type of forklift, PSD profiles were collected and analyzed for all three forklifts (
Figure 10). The comparison was conducted using vibration data measured at the fork tine tips, using the parameters that resulted in the highest vibration intensity, which was a speed of 4.82 km/h and a weight of 680 kg. The concrete road condition was chosen for the comparison because the reach truck was not driven on the asphalt during this study. The gas forklift presented the highest vibration intensity (
Figure 10). The electric forklift presented the second highest vibration intensity, while the reach truck showed the least intensity. The highest peak was observed at around 3–4 Hz, while the presence of a second peak was observed in the 5–8 Hz region for both the gas and the electric forklifts. Meanwhile, for the reach truck, the peaks were shifted to 4–5 Hz and 8–11 Hz, indicating that the reach truck had a stiffer suspension and/or tires. Similar results were observed in a study conducted in the United States that measured truck vibration for both leaf spring and air ride suspensions [
15]. It was observed that, for trucks with air ride suspensions, peaks occurred at lower frequencies in comparison to trucks with leaf spring suspensions.
In addition, both the gas and the electric forklift have wheels under the mast, while the reach truck does not (
Figure 1). The wheels of the outrigger arms of the reach truck are also smaller, which could have contributed to the shifting of the peaks to the higher frequency region.
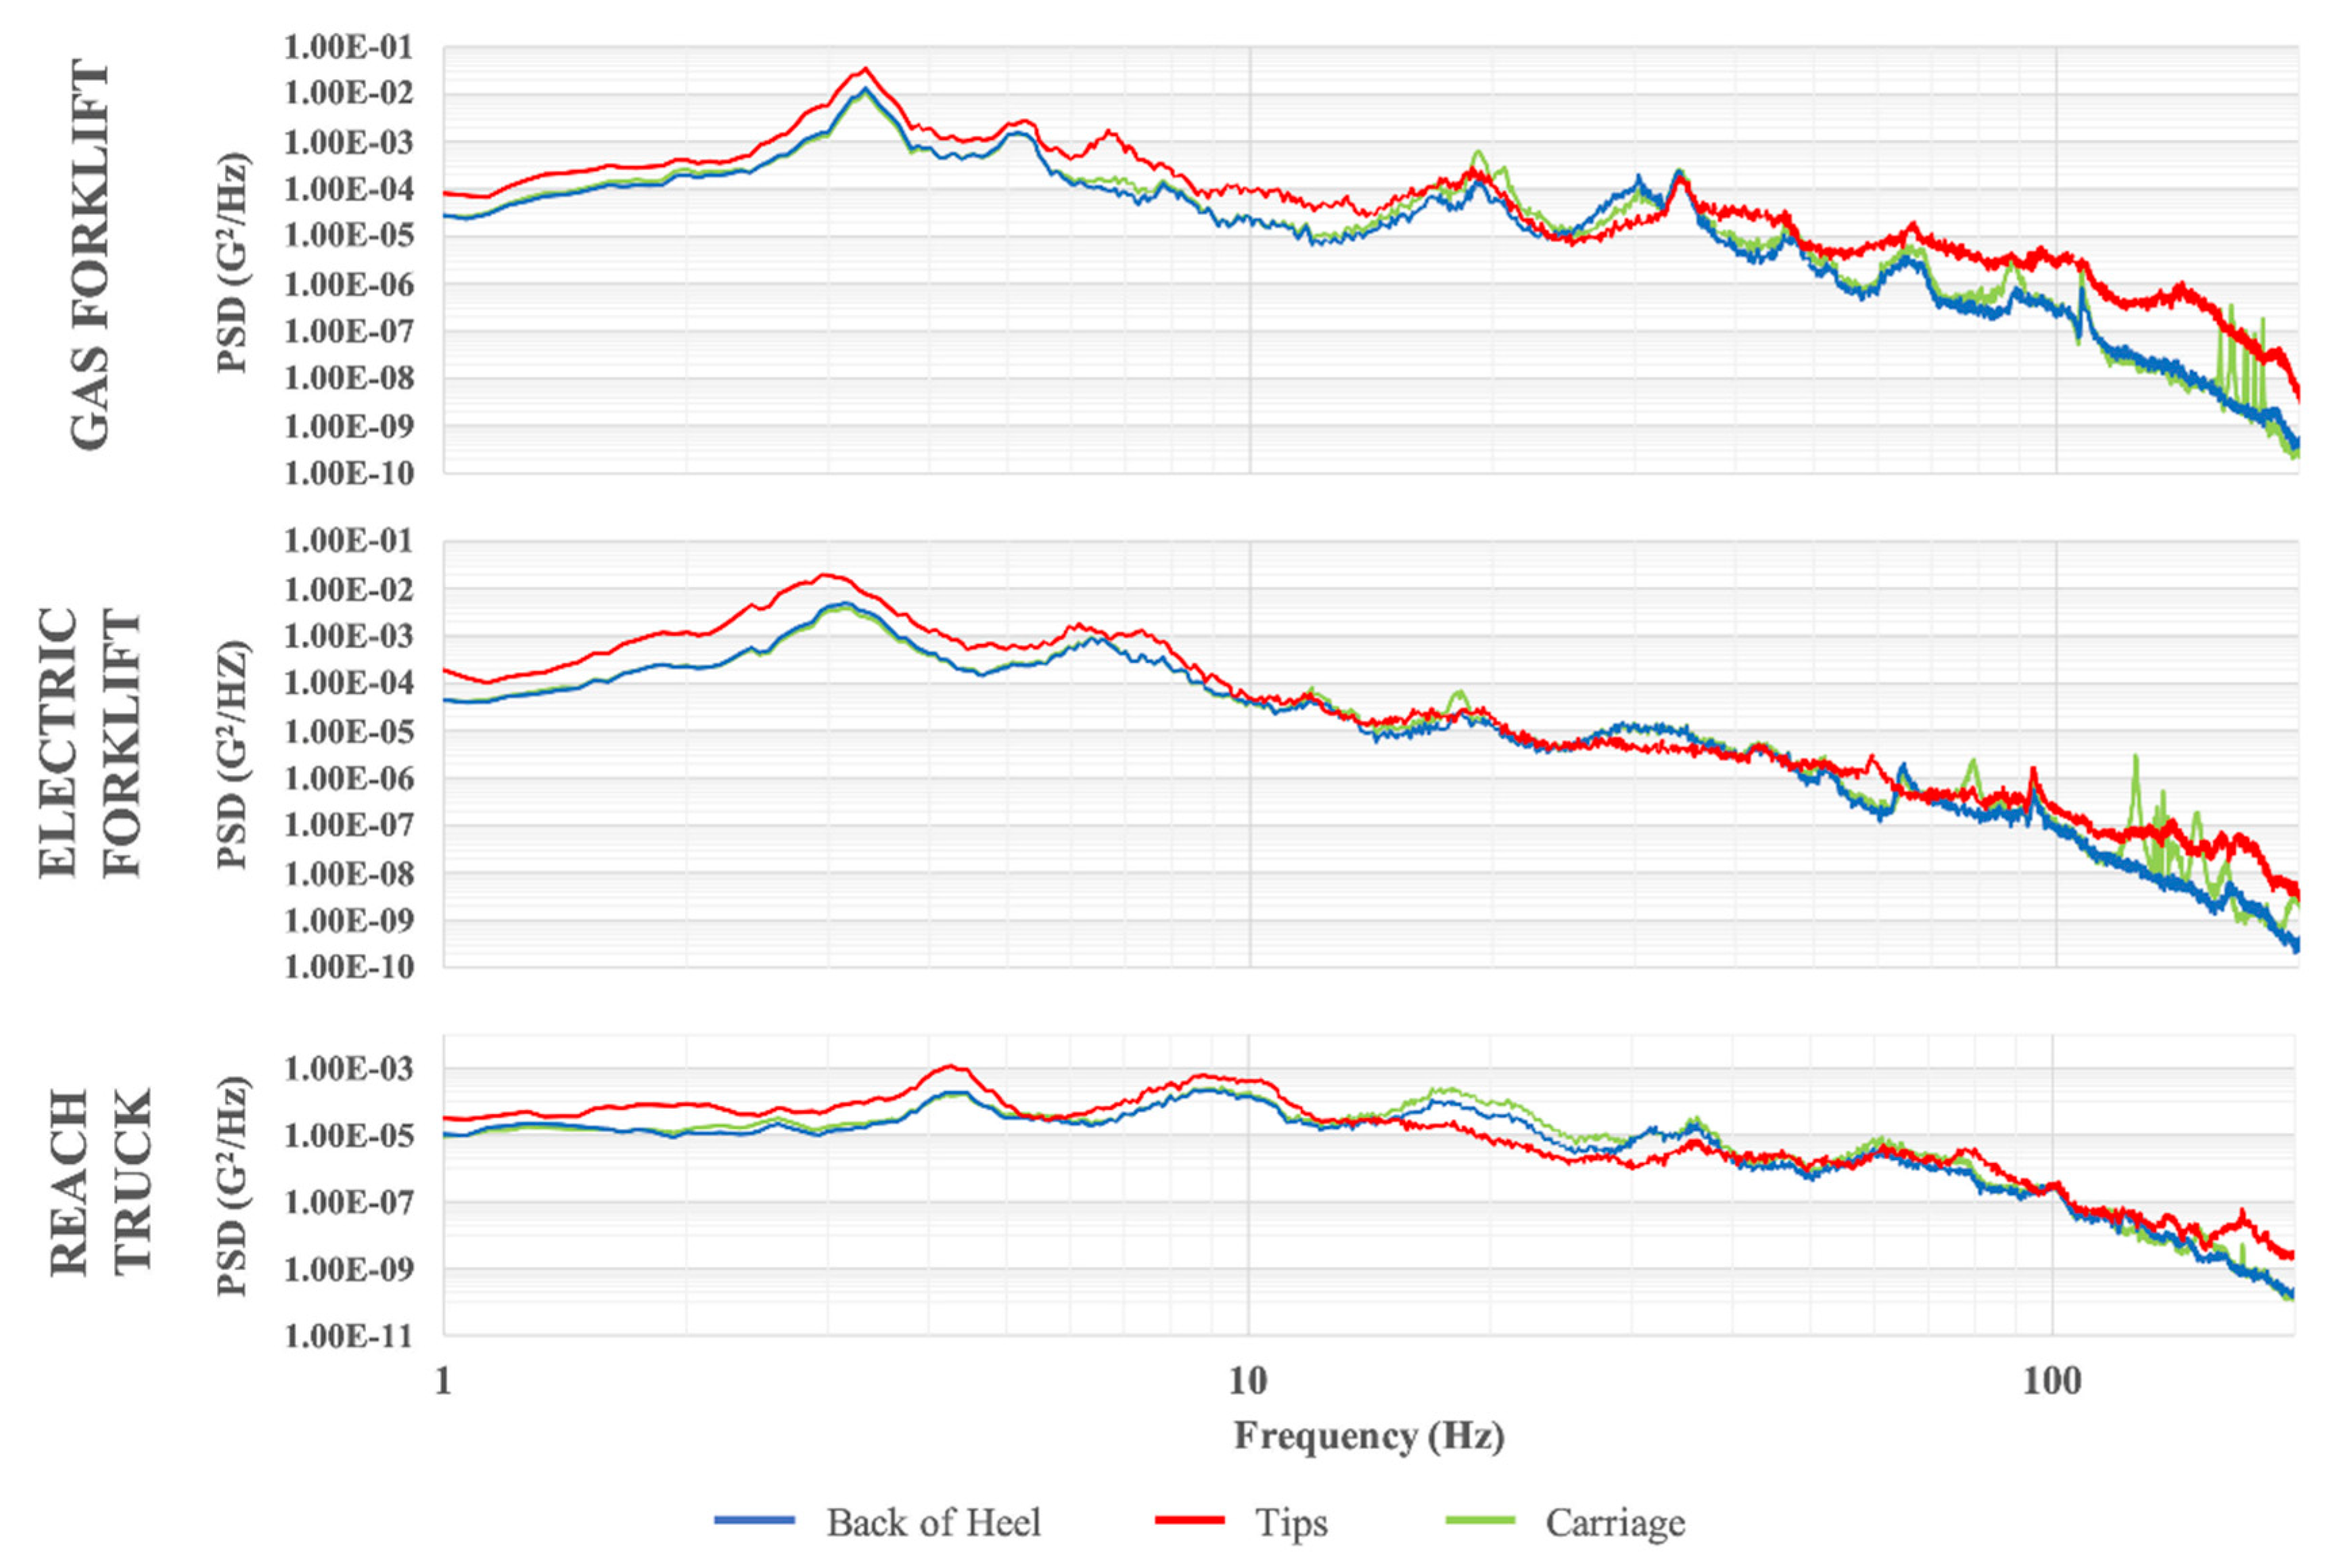
3.5. The Effect of Sensor Location on the PSD
To determine if there was a difference in vibration that occurs at the fork tine tip, the heel of the fork tines, and at the carriage of the forklift, PSD profiles were collected and analyzed for the three forklifts (
Figure 11). The comparison was conducted using the parameters that resulted in the highest vibration intensity, which was a speed of 4.82 km/h and a weight of 680 kg. It was observed that the PSD plots at the carriage and at the back of the fork tine heel were almost identical. The PSD measured at the tip of the fork tines showed a higher intensity, especially in the lower frequency region. The location of the peaks did not change as a function of the measurement location.
3.6. Limitations
It must be noted that in laboratory processes, the vibration tests are time-accelerated, with an artificial increase in intensity to shorten the tests’ duration. At the same time, forklift transport is in fact short in nature. Therefore, if the laboratory simulation is time-compressed, the test time will be even shorter, so the kurtosis value set during the test time can have little effect on the test results due to the time that it takes for the signal generation to occur in the vibration controller. Time-acceleration is therefore not recommended.
4. Conclusions
Based on this study’s results the following conclusions can be drawn:
The highest vibration intensity occurred at low frequencies of around 3–4 Hz. Vibration levels at the tip of the fork tines were higher than those at the carriage and the fork tine heels.
An increase in speed of the forklift resulted in an increase in the vibration intensity, while an increase in the weight carried by the forklift resulted in a decrease in the vibration intensity. Vibration levels were higher on asphalt compared to concrete, and this was due to the surface irregularities. The gas-powered forklift presented the highest vibration intensity, followed by the electric forklift, followed by the reach truck.
The highest vibration intensity in the frequency range of 1–200 Hz was 0.145 Grms which is much lower than vibrations observed during truck transport. The maximum acceleration level observed was 1.73 G with a duration of 8 ms.
Random vibration events observed for forklifts followed a non-Gaussian distribution.


