1. Introduction
The European Commission promotes industrial competitiveness through many initiatives. The goal of these initiatives is to empower workers and regions, and to have the best technologies for the smart and innovative industry of the future [
1]. In fact, the European industrial structure is undergoing a transformation in the management of digital and other new technologies and new business models. Smart manufacturing systems (SMS) attempt to maximize productivity, agility, sustainability, and quality of manufacturing through intensive use of advanced contemporary technologies, especially information and communication technologies, along with intelligent software applications [
2]. In the course of development, workplace innovations can be recognized as a change in business structure, human resource management, customer and supplier relationships, and as an improvement in the working environment [
3]. The objective is an improvement of working conditions for employees, leading to overall business improvement and increased competitiveness.
Sustainable smart manufacturing has been enabled with the integration of information and communication technology (ICT) in all segments of manufacturing. The new trend in Industry 4.0 is the development of smart and easy to change manufacturing systems that enable mass production and mass customization, and inspired by living systems and nature [
4]. These systems are operated by human workers that enable the systems’ efficient adaptation to disturbances and smooth running. New trends in Industry 4.0 put great demands on the workforce, who need to improve their organizational, communication, cognitive, and physical skills in order to work safely and efficiently in the new digitalized manufacturing. However, according to Kadir et al. [
5], Industry 4.0 research is relatively new and mainly focused on technical and technological aspects, neglecting the human factor. Therefore, there is a need for additional research on the human factors and the conditions of their work within smart manufacturing environments, especially for workers in high-risk working conditions [
6].
Continuous changes in working environments bring new challenges and several risks related to safety and health at work in the 21st century. According to the European Agency for Safety and Health at Work, these risks are roughly classified as physical, psychosocial, chemical, and biological. Based on the expert opinions collected through an expert survey [
7], the most important physical risks relate to musculoskeletal disorders, noise, thermal risks, vibration, and radiation. Several chemical risks, or exposure to chemical materials in the work place lead to work-related diseases, whose number is much higher than the number of accidents at work. The number of deaths caused by cancers related to working conditions is very high in Europe [
8]. These facts indicate the importance of forming safe and healthy working conditions for workers. Industry 4.0 brings new paradigm shifts in manufacturing, with an impact on the management of occupational health and safety (OHS) [
9]. Adverse working conditions often occur in industrial environments, which require the monitoring of environmental parameters such as metallic dust, noise, and environmental temperature or heat, which may have negative effects on the health of manufacturing workers [
10]. However, the development of industrialization has led to deplorable working conditions, with many risks for worker health and safety, and which requires better supervision and control of working environments and conditions. Working conditions, especially in production systems based on different technologies, should be monitored and controlled in order to protect workers.
Contemporary working environments are constantly changing and becoming much more complex, which introduces new occupational hazards and many risk factors into the workplace. According to Magnavita and Chirico [
11], these factors may be classified as: traditional (physical, chemical, and biological), current (repetitive work, manual material handling, and psychosocial hazards), and new (interaction with robots). The development of technology introduces new hazards and risks in the workspace, but the progress in smart technologies with new technological solutions can be effectively and promptly used for identifying and resolving risky conditions. In addition, condition monitoring in smart manufacturing settings can be used for implementing predictive maintenance of the production system, leading to increased system safety, availability, and reliability [
12,
13], reduced unplanned downtime [
14], as well as to the intelligent and flexible configurability and evolution of control architectures [
15]. Condition monitoring through the collection of large amount of heterogeneous data in smart manufacturing enables more appropriate decision making and management of the whole enterprise, leading to intelligent condition monitoring systems [
16]. While inquiring into occupational exposure to vibration in manufacturing environments, Lorente-Pedreille et al. [
17] pointed out the importance of reliable measurements of working conditions, followed by documenting and tracking measured values in order to increase understanding and create knowledge about them. According to Kruzhilko et al. [
18] the monitoring and measurement of workplace environmental factors should be minimal, but sufficient to detect the potential risks for workers.
Sensor-based systems integrated with information systems enable capturing large-scale and fine-grained data for effective real-time monitoring of equipment and manufacturing conditions [
14]. The use of wireless technologies, especially wireless sensor networks (WSN) in industry is mostly focused on the operation, monitoring, and maintenance of processes and equipment, while aspects of the use in mobile sensing applications for monitoring and improving worker safety and health conditions is neglected [
19]. According to Podgórski et al. [
20] various physical, chemical, or spatial characteristics of real objects and the working context within smart working environments can be sensed and measured easily, reliably, and at low cost by using recent sensor technologies. In addition, the use of contemporary technologies, such as body area networks, cloud computing, and smart clothing, big data, and business intelligence, or embedded and pervasive computing, allow the improvement of working condition monitoring and the quality of health services within manufacturing environments [
10]. The use of sensor-based systems with fixed and mobile sensors for monitoring in industrial environments means the need for human involvement in monitoring is reduced, which minimizes the possibility of getting imprecise monitoring data and the exposure of workers to additional risks [
21].
In modern times, the extensive application of modern technologies in industrial systems is extremely important [
22,
23]. A variety of emerging wireless technologies [
24] can be used in industrial systems, e.g., ZigBee [
25], LoRaWAN [
26], and Bluetooth low energy (BLE) [
27]. The usage of low-cost open-source hardware (OSHW) and single board computers (SBC), such as Raspberry Pi [
28], is also common in research papers and projects. Together with wireless technologies, open source hardware, and single board computers, the utilization of messaging protocols such as message queuing telemetry transport (MQTT) is equally integrated into the IoT, such as in the systems for supporting intelligent transport [
29]. Additionally, ICT can enhance the experience of disabled persons, e.g., visually impaired ones in industrial facilities [
30]. However, the implementation of ICT technologies in industrial environments is faced with various challenges, such as security, interoperability, alignment to the internal strategy, and the limitations of the technology to be implemented [
31].
As has been stated, a large amount of research is devoted to developing methods, tools, and technologies for smart manufacturing systems, but there is a need for more comprehensive research that will deepen our understanding of issues related to working conditions for humans. Our research aims to contribute to filling this gap by proposing a model and testing platform for working environment monitoring in smart manufacturing. The contribution of this paper is a model for the working environment in smart manufacturing systems. The model was designed with the idea of including emerging technologies and contemporary approaches in building complex cyber-physical systems. The model had to be easily developed in the form of testing platform. For that purpose, open-source hardware and software were used for platform development. The model and the platform were tested for their validity and applicability. The experimental environment and tools are described in the paper. The test results show that the platform is efficient and suitable for creating different scenarios for the particular use cases.
The rest of the paper is structured as follows.
Section 1 gives the introduction.
Section 2 outlines related work.
Section 3 gives the model overview, with the detailed description of its components. In the same section, a model of data analytics and usage of the proposed sensor network is given for indoor dust pollution monitoring.
Section 4 presents the experiment, the testing platform, and platform validation scenarios.
Section 5 gives the results and analyses, and
Section 6 gives the concluding remarks.
2. Related Work
A literature review indicated that the aim of condition monitoring in smart manufacturing environments is directed toward ensuring efficient operation and maintenance of manufacturing equipment and toward the monitoring of conditions that impact worker health and safety.
Palazon et al. [
19] presented two industrial cases related to use of wireless sensor networks (WSN) for improving worker safety and health conditions. These two cases relate to collision avoidance (between workers and fork-lift trucks, or between any types of industrial vehicles) and working at height. WSN motes were used for detecting the indoor position and speed of workers and industrial vehicles. Fixed nodes within the factory were used for localization of mobile vehicles and workers. The core of the system was the communications backbone that transmits information to a remote control center [
32]. MEMSIC IRIS motes working in the 2.4 GHz frequency band were used as WSN motes, while sensor data were processed by an onboard Atmega328P, which was preloaded with an Arduino bootloader. A barometer included in the PCB was used for the height measurements. Two tests were conducted in the TRW automotive factory in Pamplona (Spain). The system deployment included fixed and mobile WSN motes, a coordinator node, WiFi routers, and a WiMAX connection to a remote control center. The results revealed that WSNs supported by a heterogeneous wireless backbone can be used within industrial settings for preventing accidents and improving the safety and health of workers.
Cao et al. [
12] proposed an ontology-based intelligent smart condition monitoring for Industry 4.0 manufacturing. The ontology defines domain knowledge related to condition monitoring, which is used in an intelligent condition monitoring system (ICMS) for prognostics tasks in manufacturing processes. The domain ontology contains the following modules: (1) manufacturing module: contains the knowledge relevant to production activities and tasks; (2) context module: represents the concepts relevant for the context, such as activity, identity, time, and location; and (3) condition monitoring module: formalizes the knowledge related to machinery prognostics and health management. Condition monitoring was performed with an ICMS with three layers: (1) physical space layer: responsible for collecting data from the manufacturing environment; (2) cyber physical interface: responsible for storing and processing the collected sensor data; and (3) cyber space layer: responsible for decision making related to machine operation and maintenance. The proposed ontology and ICMS were evaluated for a conditional maintenance task of bearings in rotating machinery.
A five-layer architecture for health monitoring and management of manufacturing workers was presented in [
10]. The layers in the proposed architecture were: (1) data collection layer: responsible for data sensing, acquisition, and processing; (2) network and communication layer: responsible for end-to-end connectivity of the health monitoring applications; (3) data processing layer: responsible for necessary calculations and statistical measurements on received aggregated data; (4) management layer: responsible for dealing with results and outcomes of data processing; and (5) service layer: responsible for end-user connectivity for hospitals, emergency departments, ambulances, police stations, and insurance companies. The system implementation enabled monitoring of physical conditions in the working environment (metallic dust, noise, and temperature), as well as the physical condition parameters of manufacturing workers (heart rate, blood pressure, and body temperature). The evaluation of the proposed system was made from the perspective of insurance and compensation for manufacturing workers. The implementation results revealed that the proposed architecture contributed to the improvement of health monitoring and worker health in adverse working conditions.
Wu et al. [
14] presented an interactive visual analytics system for data driven equipment condition monitoring in smart production systems. The system helps managers and operators at manufacturing sites to use collected domain knowledge for their decisions and work. Experts from industry participated in the design of the system, and helped in closing the gap between the industrial needs and available technologies. The experts’ experience helped in determining the large volume of manufacturing data to be monitored and the appropriate sensors to be deployed for monitoring critical tasks. The sensors were grouped in modules, which enabled efficient monitoring and generation of vectors with the collected data. A condition reference library (a training set) was constructed based on previous experience and it enabled training of the monitoring model. The user can refine the monitoring model by inspecting and updating the training set in order to adapt to various changing conditions in the manufacturing system. This enables users to select the most appropriate sensors and use them in constructing the monitoring model. The monitoring model is based on a cluster with 19 data nodes and 342 cores that support collecting and processing a large amount of manufacturing data. The monitoring system was evaluated on a dataset with over 0.42 billion records collected from 791 sensors in a petrochemical plant.
A study presenting the measurement of harmful and hazardous factor values of noise, air dust in the production environment, vibration, and humidity in the workplace in glass product manufacturing was shown in [
18]. A set of data collected from sensors was used as an input for an algorithm for substantiating managerial decisions to minimize the negative impact of workplace physical factors. The authors presented the structure of the system for monitoring working conditions with sensors, analogy-frequency converters, and a data processing center. The data processing center hosted software with the following functions: administration and configuration of the whole monitoring system, storing collected data, data processing (visualization, reporting, verification, analysis, and modeling), interaction with other systems, and information security and data integrity. An algorithm was implemented for monitoring workplace physical factors in the workshops for the transportation, preparation, and mixing of materials in glass product manufacturing. Based on the evaluation results, the authors concluded that the proposed algorithm and system enabled the identification of deficiencies in the working environment and the development of action plans for their improvement.
Ghazal et al. [
21] proposed an edge-fog-cloud architecture for detecting thermal anomalies in aluminum factories. Sensing was performed with mobile IoT edge nodes carried on autonomous robots, while using drones as fog nodes increased the responsiveness of the system and reduced surveying costs. Analysis of thermal anomalies was performed in a cloud back-end. Limitations of the cloud computing part of the system were exceeded by use of mobile drones, which enabled a distributed computing architecture and improvement of the network utilization. Measurement of the temperature was performed at different locations in order to help in studying and analyzing the thermal balance of the potshell in the factory. The detections and localizations of thermal anomalies helped operators to activate a cooling system, and to increase the safety of workers and the factory. The system was tested in the laboratory and in the factory. Test results revealed that the proposed architecture based on mobile sensing with robots reduced operation costs and system response type, while increasing the accuracy of the detection of thermal anomalies compared to human surveyors or fixed IoT node monitoring.
3. Model of a System for Monitoring Working Environments in Smart Manufacturing
In this section the architecture of the proposed system is presented.
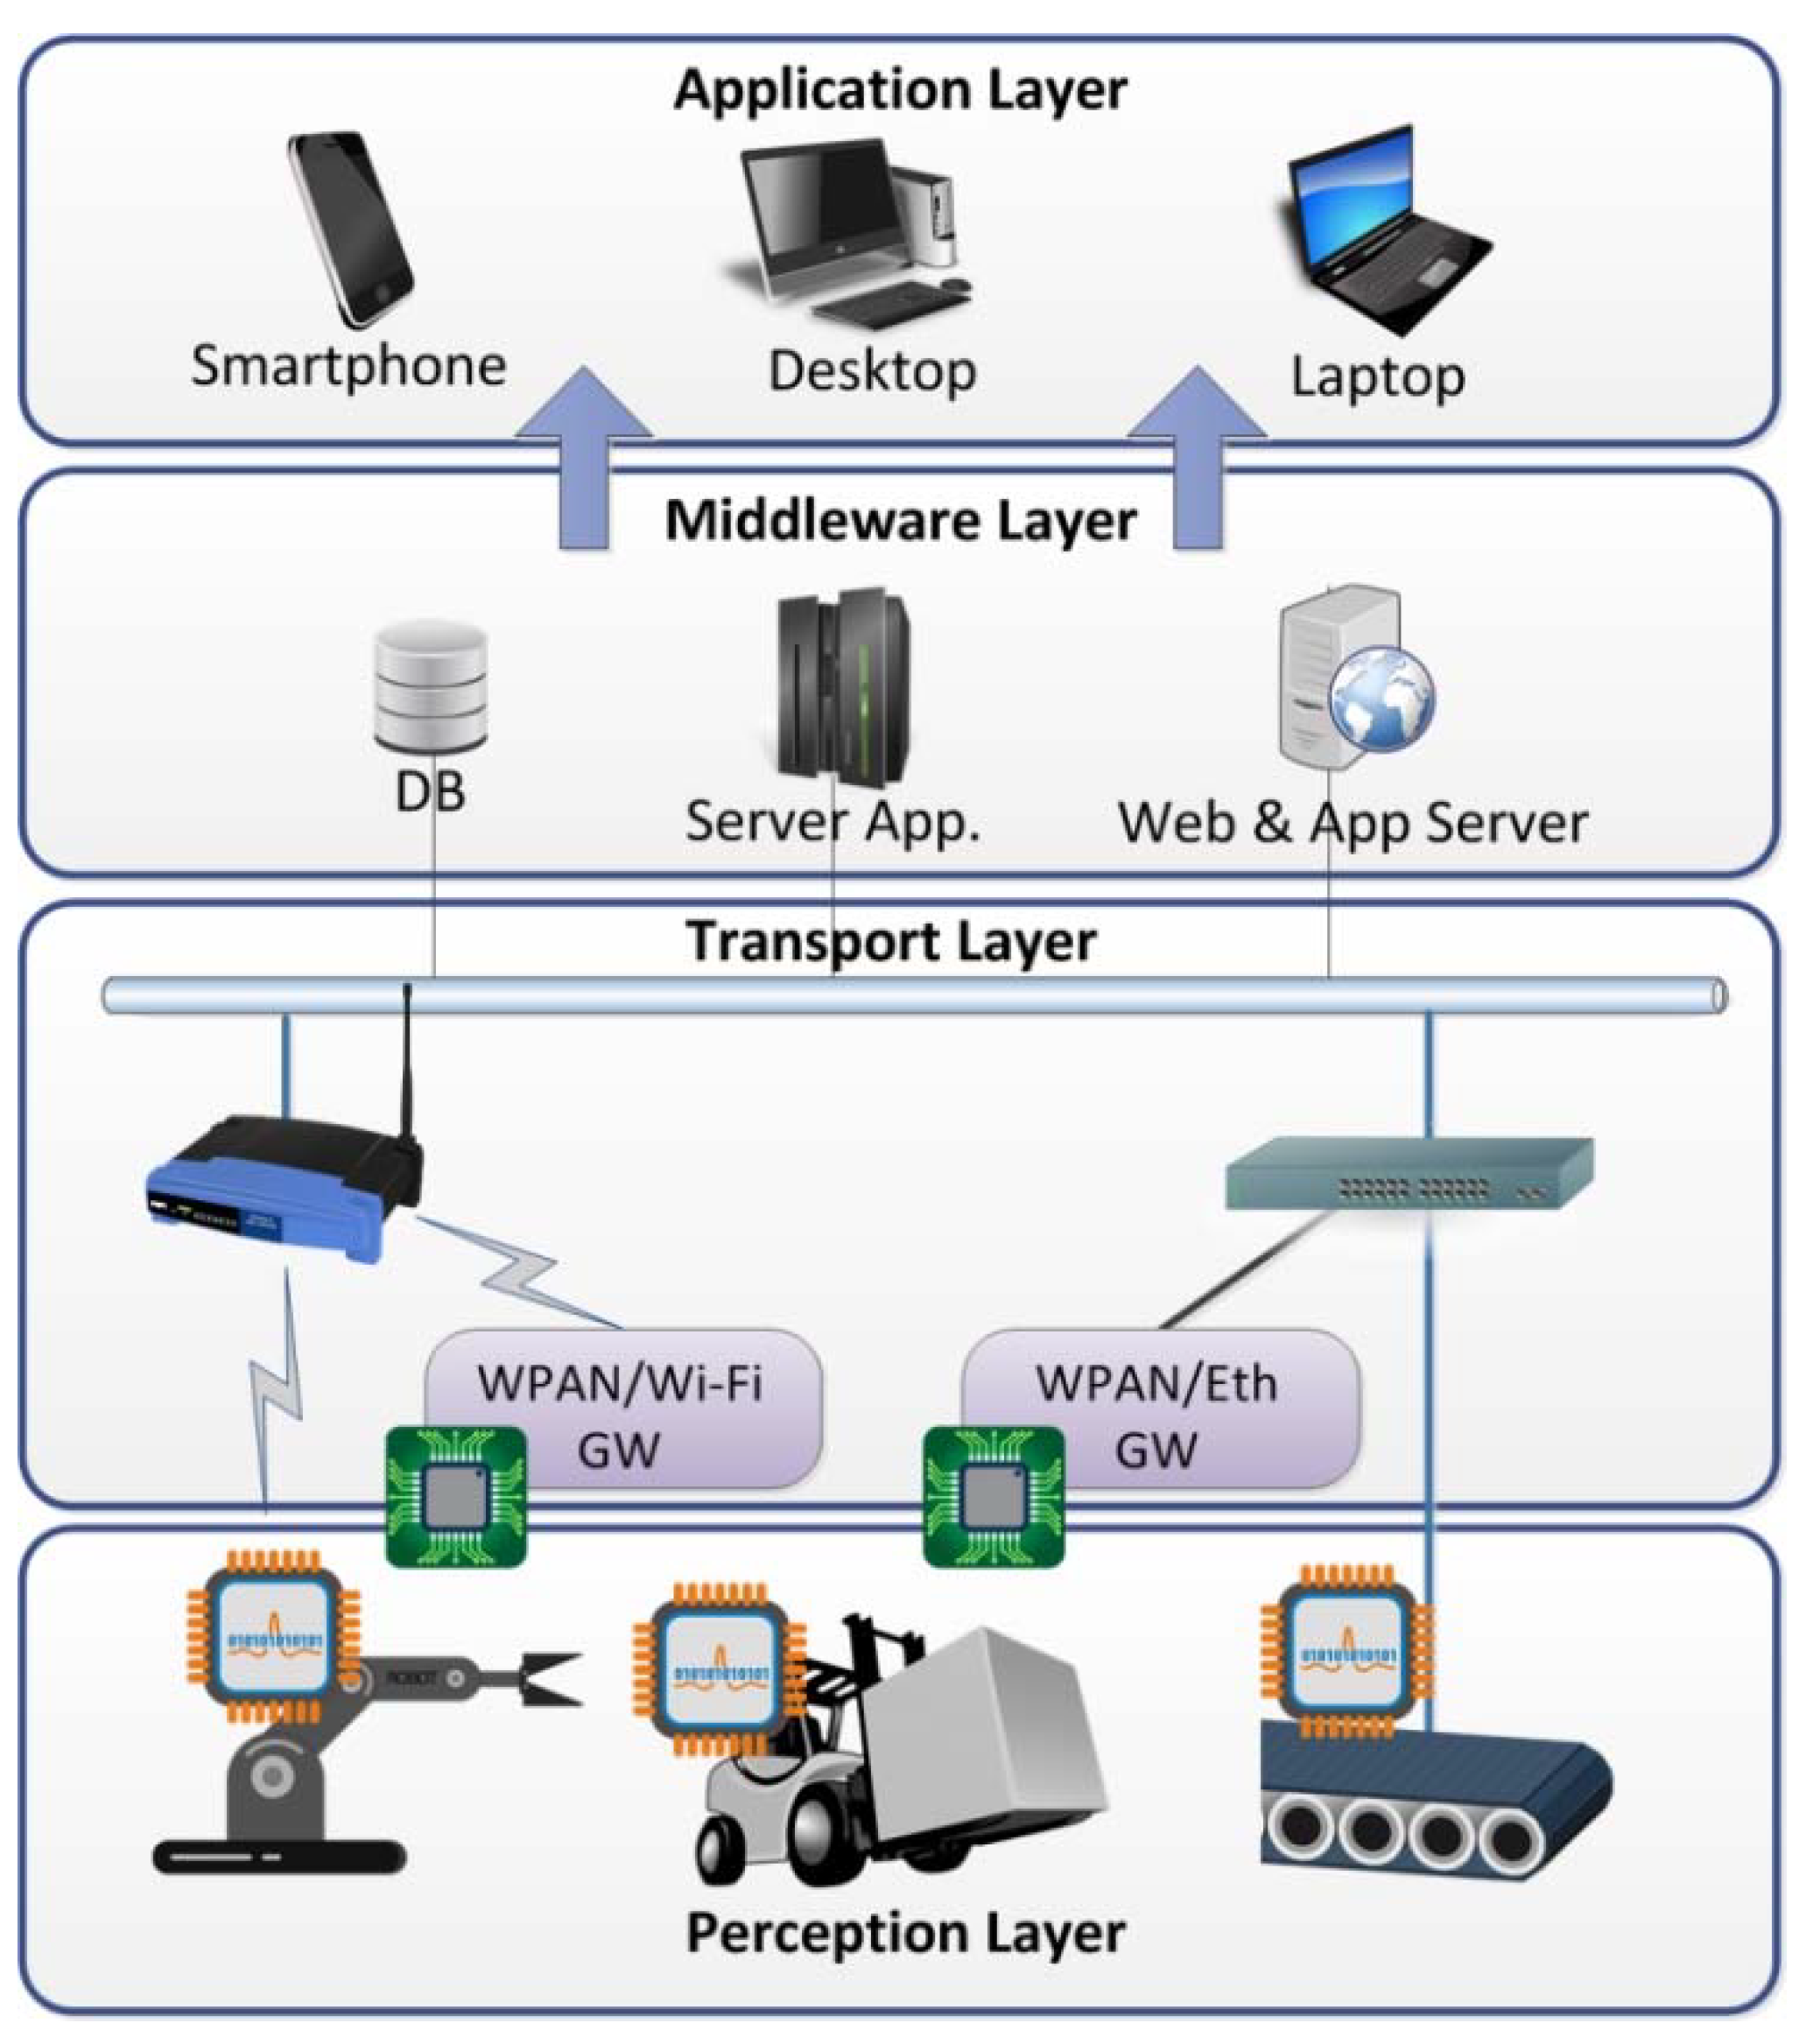
Figure 1 shows the architecture of the system designed in accordance with a five-layered IoT architecture.
Figure 1 also shows the components of the system and their deployment in the architecture layers. The model assumes that different sensor nodes utilizing different connecting technologies are included in this model. The sensor node type and the connecting technology depend on the purpose of the node and its placement. The purpose of the node is defined by the set of physical parameters that should be monitored by the node and the other specific functions, such as possible alarms, display board notifications, etc. Moreover, the location of the sensor node placement affects the connectivity technology used, e.g., wireless technology for sensors placed on moving objects, difficult to reach places, and locations with poor wired infrastructure. Locations with a highly developed wire architecture and with demands for a high data rate will have Ethernet connection. Due to the variety of potential wireless and wired technologies, one of the goals of the process of building the model is the flexibility in selecting components. This flexibility assumes the configuration of the sensor node can be adjustable and easy to change following the specific design requirements, deployment scenarios, and eventual technology trends.
Based on the previous discussion, we choose to build this model around open-source hardware platforms, such as Arduino/Genuino and similar platforms. The model originated from a student project created for the purpose of an international challenge in building a prototype system for industrial appliances. The model proposed in this section is upgraded with the inclusion of the MQTT protocol.
3.1. Model Description
As is presented in
Figure 1 sensor nodes are deployed at the Perception layer. These nodes can be classified into two categories: “light” and “heavy” nodes. The general difference between those two types of sensor nodes is in the smaller number of sensors for the “light” nodes. The “heavy” sensor nodes are designed to be used as fixed wireless sensor nodes, mounted on the walls, with a larger number of sensors, and LCD or OLED displays. The “light” sensor nodes are designed as lightweight fixed or wearable devices. Wearable devices can be mounted on helmets and suits or working clothes, or mounted on moving objects/vehicles such as forklifts, carts, and other inner transportation objects. These nodes are planned for deployment in locations without infrastructure and in the hard to reach places. Owing to this, the connectivity of these nodes is achieved with wireless technology.
The main building block for the sensor node prototyping was the Arduino/Genuino platform, mainly Arduino/Genuino UNO Rev3 and MEGA 2560 or their clones. Besides these platforms, Texas Instruments development boards such as MSP430 and MSP432, and CC3200 based Launchpads, were used.
The system was designed in accordance with a five-layered architecture (
Figure 1). In the perception layer the microcontrollers and sensors were deployed; the transport layer mediates between the devices and the core of the system and forwards the collected data to the servers and storages; the middleware layer is responsible for storing, processing, and analyzing data, and servicing the user applications; the application layer provides data to the users of the system; the business layer is designed for the decision making and management of the system, but is it omitted from the figure and it is not covered in the presented system.
Furthermore, considering the connectivity technology, sensor nodes can be classified into three different types of nodes. Those three types are:
WPAN sensor nodes
Wi-Fi sensor nodes
Ethernet sensor nodes
WPAN sensor nodes for connectivity use WPAN communication modules. Those modules can be: Digi XBee module for ZigBee and IEEE 802.15.4 technology, RFBee module for proprietary sub 1-GHz technologies, and HM-10 for Bluetooth low energy. Wi-Fi sensor nodes for connectivity used a variant of ESP8266 modules. The Ethernet sensor nodes had the Ethernet shield or Ethernet modules for connectivity.
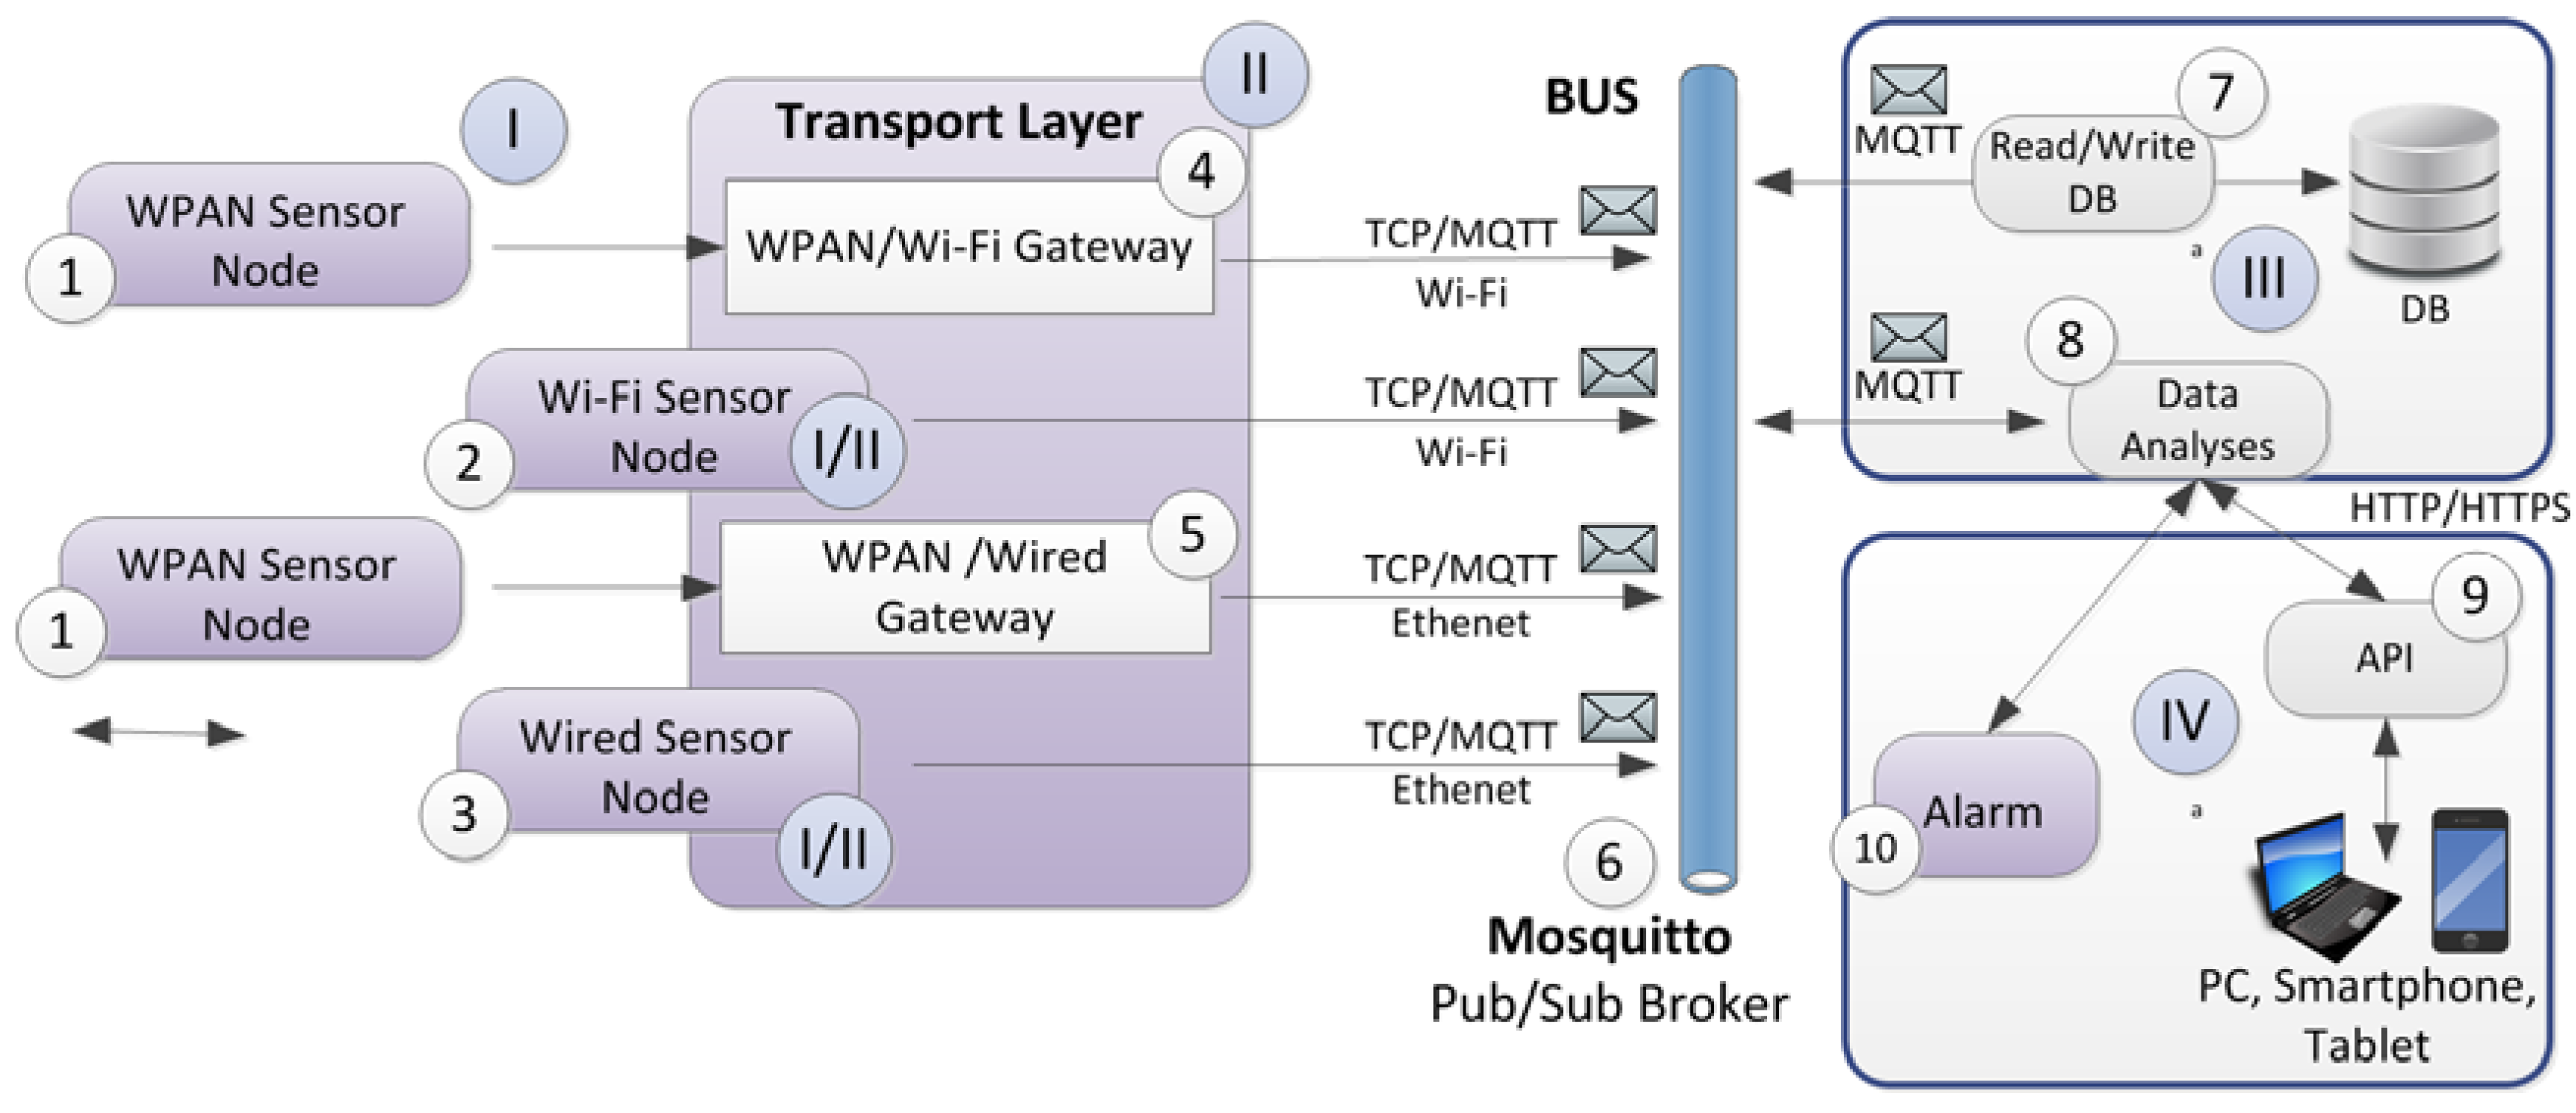
The transport layer serves for connectivity between the transport and application layers. Its primary functions are to enable the connectivity of nodes to the core of the system and to transfer the data collected by the sensors. The communication of WPAN nodes from the perception to the transport layers was realized primarily with WPAN protocols (ZigBee, BLE, or IEEE 802.15.4). In contrast, the communication of the Wi-Fi and Ethernet nodes with the core is directly realized with the Transmission Control Protocol (TCP), or more precisely the MQTT protocol. The MQTT protocol was chosen for the communication between the components within the core of the system. Therefore, the devices for WPAN/TCP conversion with MQTT support should be included in the model, at the edge of the transport layer.
The usage of the MQTT protocol assumes that the MQTT broker is used in the core of the system for managing the message publishing and subscription. The usage of Arduino based devices with ESP8266 and Ethernet modules enables support for TCP/MQTT connectivity. So the Arduino base platforms could be used as WPAN/Wi-Fi and WPAN/Ethernet gateways with MQTT support. The architecture of the software components is presented in
Figure 2 in more detail. The recommend Arduino board is Mega 2560 and the recommended TI board is CC3200 Launchpad because of the greater number of communication ports and the support for a higher number of communication devices and greater computational power.
The Arduino/Genuino and TI Launchpad platforms allow integration with the variety of sensors and other components. The advantage of using Arduino/Genuino and the enlisted TI boards lies in the huge supporting community and accessibility to a lot of code examples, wiring schemes, and low cost components. Sensor stations, particularly for application in smart industrial environments, can be different. The authors have had a positive experience in using sensors, such as: proximity sensors, dust sensors, and temperature (DHT11, DHT22, LM35, and TMP36), sound, photo, and a number of gas sensors (MQ-2, MQ-3, MQ-4, MQ-6, MQ-7, and MQ-135). For the testing platform the MQ-135 sensor was used in the majority of sensor nodes. This sensor can monitor gaseous ammonia (NH3), benzene, ethyl alcohol, and carbonic dioxide (CO2). The example of the data analyses module for dust monitoring, which is presented in the next subsection, assumes the usage of a dust sensor as a main component. Besides the sensors, the sensor nodes, can have OLED or LCD displays, LEDs, SD card loggers, real time clocks (RTC), actuators, and other components.
The transport layer components were designed on the basis and experience of the project 6th Sense, which started as a student project for the Texas Instruments competition TI Innovation Challenge 2016 [
33]. The prototype sensor nodes evolved from the sensor nodes used in the 6th Sense project, with the incorporation of emerging IoT protocols, such as MQTT [
34]. The model described in this paper presents the fusion of these two models, with the hierarchical architecture and heterogeneous connectivity technology based on the first model, and with the MQTT protocol, and messaging bus oriented architecture based on the second model, and with changes in the sensor data packet format. The experiment and measurement setting, measured values, measurement tools, and method of analyses were completely different from previous studies, and performed with greater number of devices, and different message formats.
The architecture of the software components of the system is shown in
Figure 2. At the perception layer (I) WPAN, Wi-Fi, and Ethernet (wired) sensor nodes are deployed; the transport layer (II) contains microcontroller boards and sensor nodes with the ability to convert data transfer protocol from the wireless protocol from the perception layer, to IoT protocols applicable for the core of the system, in this case the MQTT protocol. The middleware layer (III) contains components such as Mosquitto MQTT broker (6), which handles the messaging bus, DB read/write to data store module (7), and an analytics module (8); the application layer contains a user application API (9) and alarm module (10).
The other components of the system placed in the middleware layer (III) were a module for database reading and writing (7), a module for data analyses (8), and a database. The database considered for the full scale system model was NoSQL MongoDB. For the purpose of building the small scale system testing platform, SQLite was selected, because of its simplicity and functionality.
The application layer (IV) had an application API and alarm subsystem. The components were not included in the testing platform at this stage of research. The business layer was not included in the testing platform nor in the model of the system.
3.2. Indoor Dust Control Simulation
Since the middleware layer is intended for data storage, processing and analysis, it is interesting to examine the functionality of this layer. In this section, the example of the data analyses module (8) presented in
Figure 2 is given. This module assumes the usage of “light” or “heavy” sensor nodes with an integrated dust sensor.
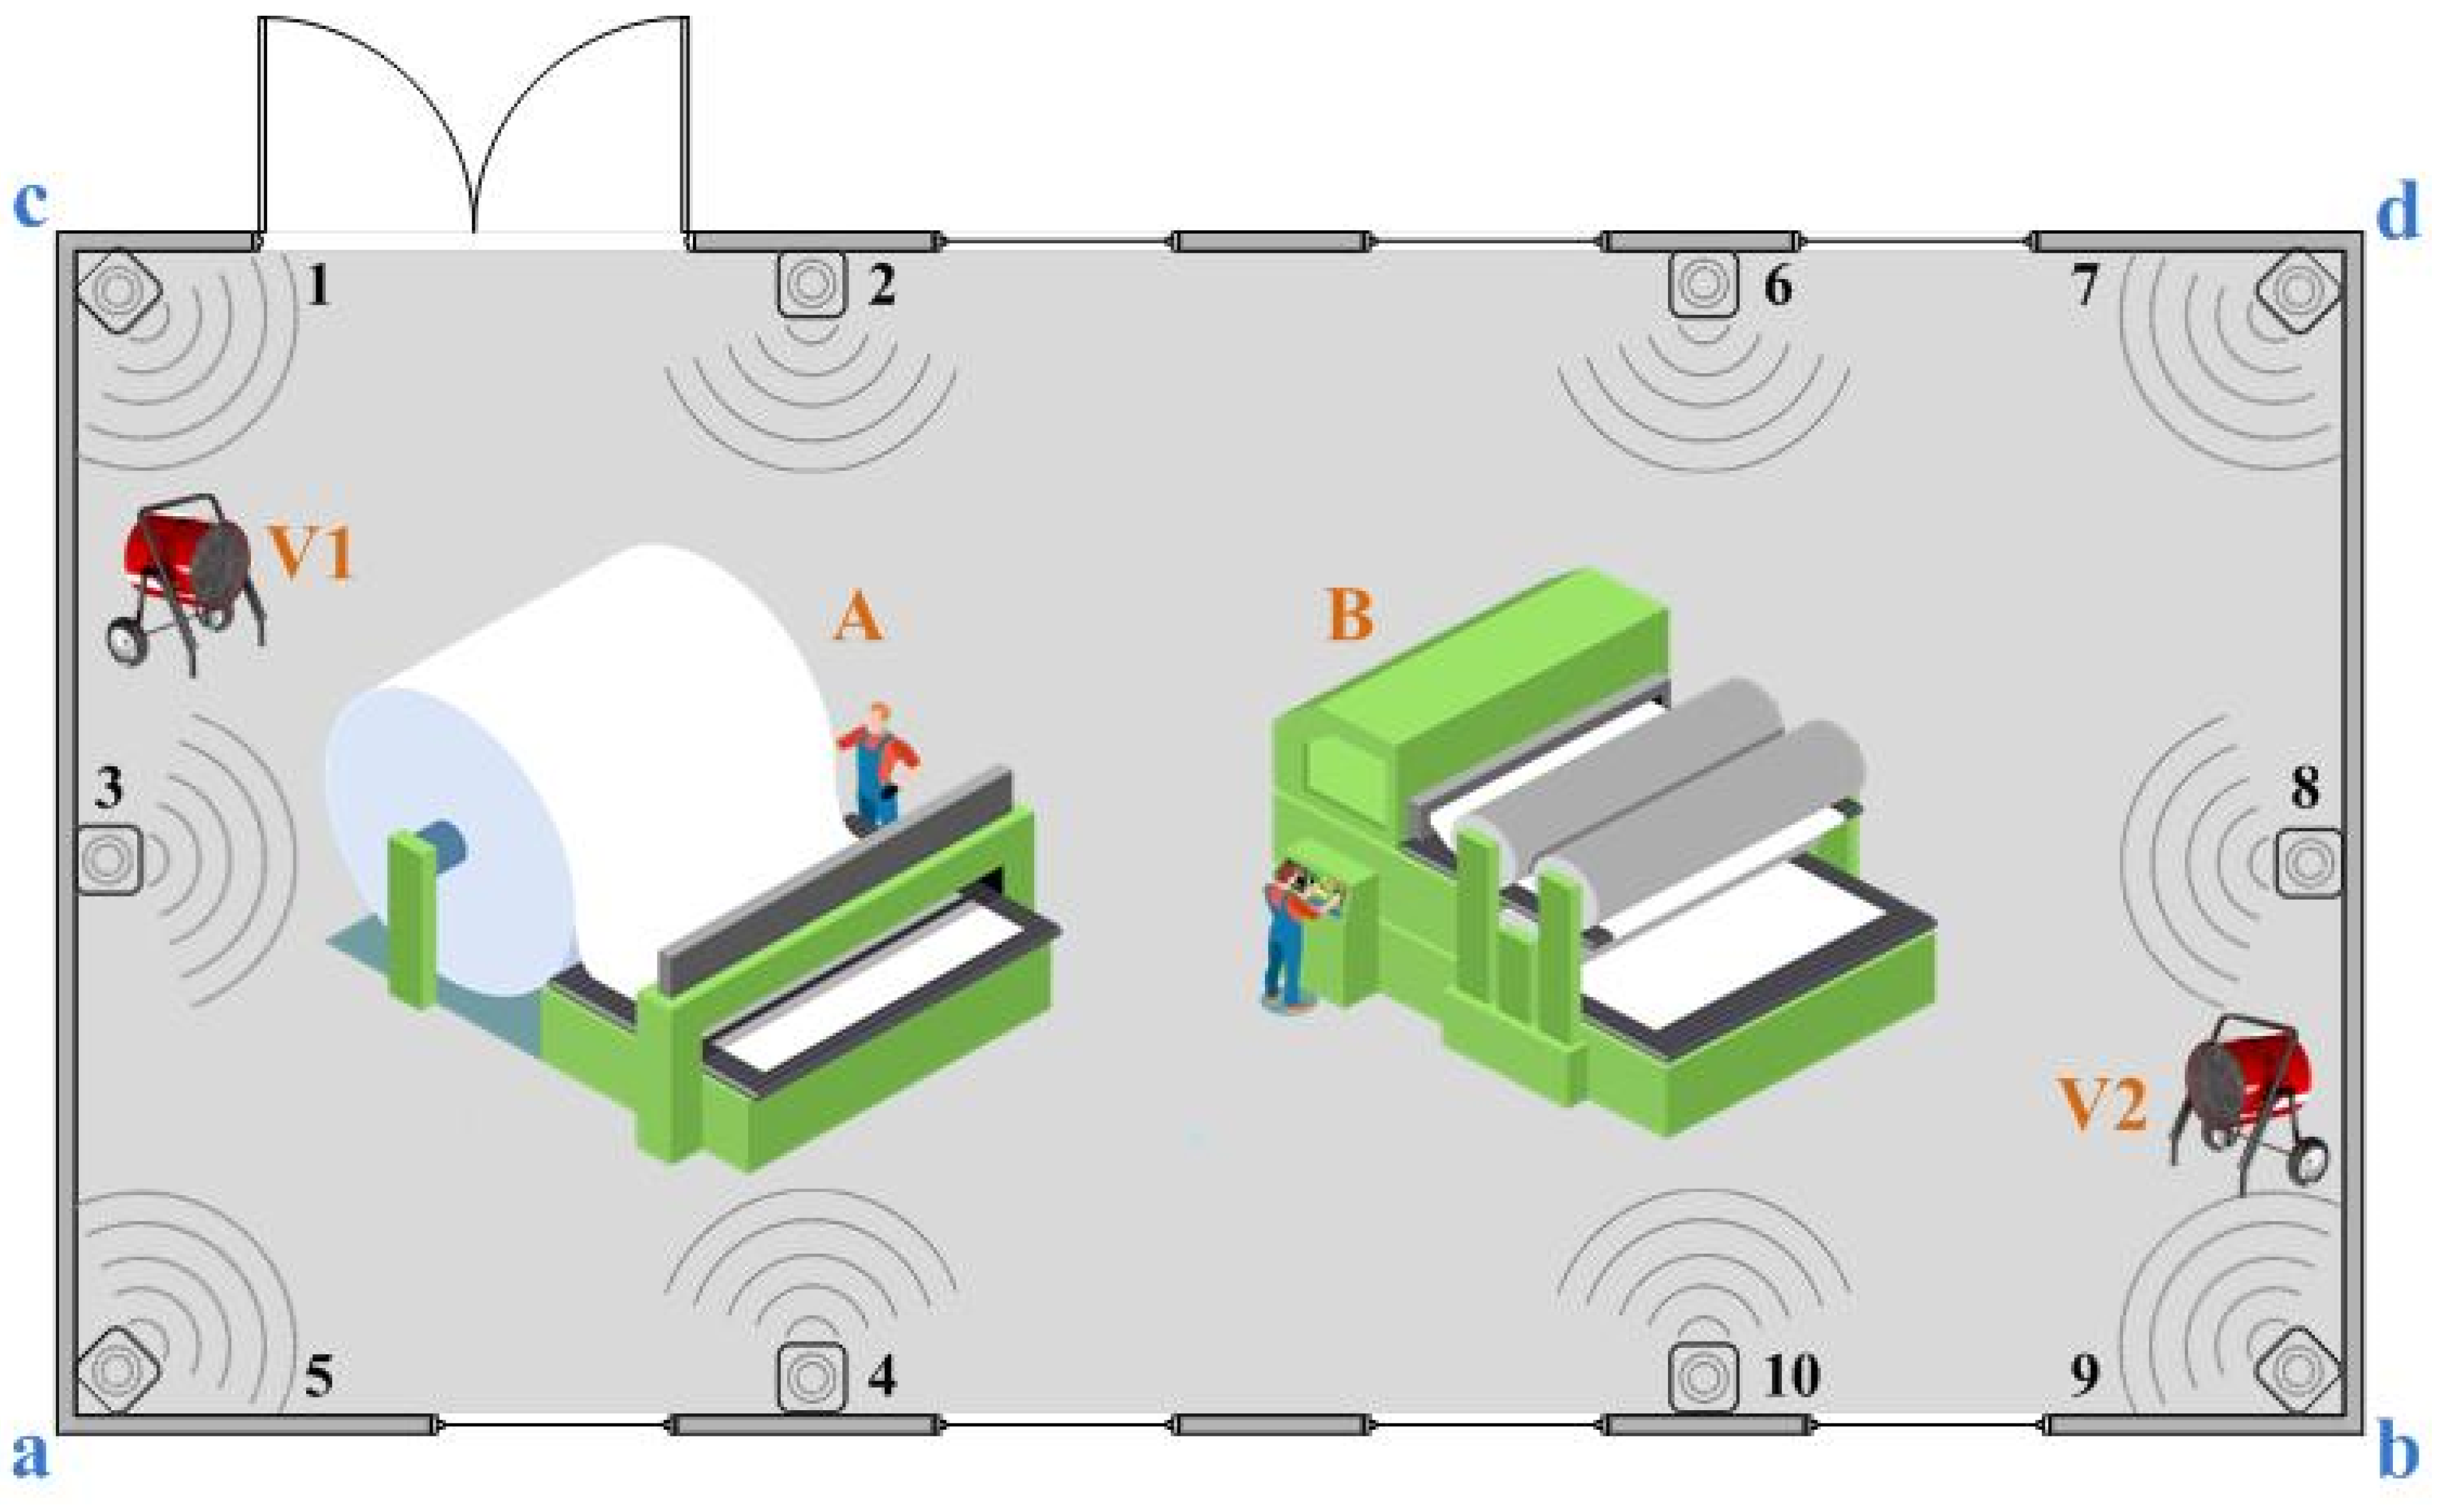
Analysis of the data collected by the sensors was done on data related to dust particle distribution and numerous harmful gases, so in the real system it is a mixture of harmful substances. Of course, dust is not the only type of pollution, but the presence of dust is one of the key parameters of the environment considered here. Bearing in mind that we were not able to deploy and use the sensors in a real environment for a long time, we used a simulation, with the aim of proving the validity of the concept. However, the simulation used the floor plan of a real plant of a paper haberdashery company, in fact one room with two machines for the preparation of paper materials for further processing. These machines generate large amounts of dust and other harmful substances, so this part of the plant is suitable for being simulated, in terms of generating and distributing harmful (primarily dust) particles. A high concentration of dust particles in the work environment is dangerous for workers. Therefore, their concentration in the work environment is regulated by legal acts. A schematic view of the floor plan is shown in
Figure 3.
There are two machines, A and B, located symmetrically in the room’s center, and which are dust pollution emitters; a large amount of dust particles are generated during the operation of these machines. Dust sensors are intended to be part of “heavy” nodes, which are stationary and located on the walls of the room in protected places. There are 10 wall-mounted sensor nodes (1–10,
Figure 3), and two vents V1 and V2, which can be operated separately.
First of all, we studied some of the previous research on indoor air quality assessment. The assessment of indoor air quality (IAQ) was of interest, which differs somewhat from the measurement and assessment of outdoor air quality index (AQI). IAQ is the air quality within and around buildings and structures, and it relates to the health and comfort of people [
35,
36]. As in [
36], IAQ is significantly affected by three primary factors: outdoor air quality, human activity, and construction materials (as well as equipment and furniture). The operation of ventilation systems also has a significant influence on IAQ. According to [
36,
37] the main indoor air pollutants include NOx, some volatile or non-volatile organic compounds (VOCs), SO2, O3, CO, PMs, radon, toxic metals, and microorganisms. PMs are carbonaceous particles associated with organic chemicals and reactive metals. By size, PMs are classified into PM10 of diameter <10 μm, PM2.5 of diameter <2.5 μm, and PM0.1 of diameter <0.1 μm. Indoor PM sources include particles that migrate from the outdoor environment and particles generated by cooking, fossil fuel combustion activities, smoking, machine operation, and various indoor activities. The list of common indoor pollutants, as well as IAQ guidelines and standards can be found in [
36]. Similarly to [
36], this research deals with devices that mimic the functionalities of mammals’ olfaction system. These devices are based on IoT, and are called “electronic noses” (E-noses). They consists of four basic components:
A multi-sensor array,
Software with digital pattern recognition algorithms,
An artificial neural network (ANN) or similar,
Reference library databases.
These devices have attracted great interest, because of their low-cost and portability. In [
38] a tiny air-quality monitoring system is presented, in order to monitor indoor air quality, and with CO and PM sensors installed. This real-time device proved to be capable of assessing IAQ values. In [
39] an assessment of the envelope air permeability of the room was obtained by the infiltration rate calculated by an equation. In both [
37,
38] the same linear interpolation formula was used in order to the calculate index value of pollutant. This formula included rounded pollutant concentration and pre-defined breakpoint values as standardized values. This suggests that it is possible to simulate pollution levels using a formula, which however does not have to include standardized pre-defined breakpoint values; which, are not strictly standardized, as these values vary in different countries. Furthermore, it is necessary to choose the exact method of simulating the levels of pollution and dispersion of particles (dust particles in this research).
Particle propagation models or physical simulation of particle dispersion are not suitable for this research because of their complexity, but bilinear interpolation on the unit square [
40,
41] is suitable in order to calculate dust concentration in any point (x,y) inside the square. Given four corner values (a,b,c,d), the dust-concentration value f(x,y) is calculated by:
where:
a is the dust-concentration value at (0,0), the lower left corner
b is the dust-concentration value at (1,0), the lower right corner
c is the dust-concentration value at (0,1), the upper left corner
d is the dust-concentration value at (1,1), the upper right corner
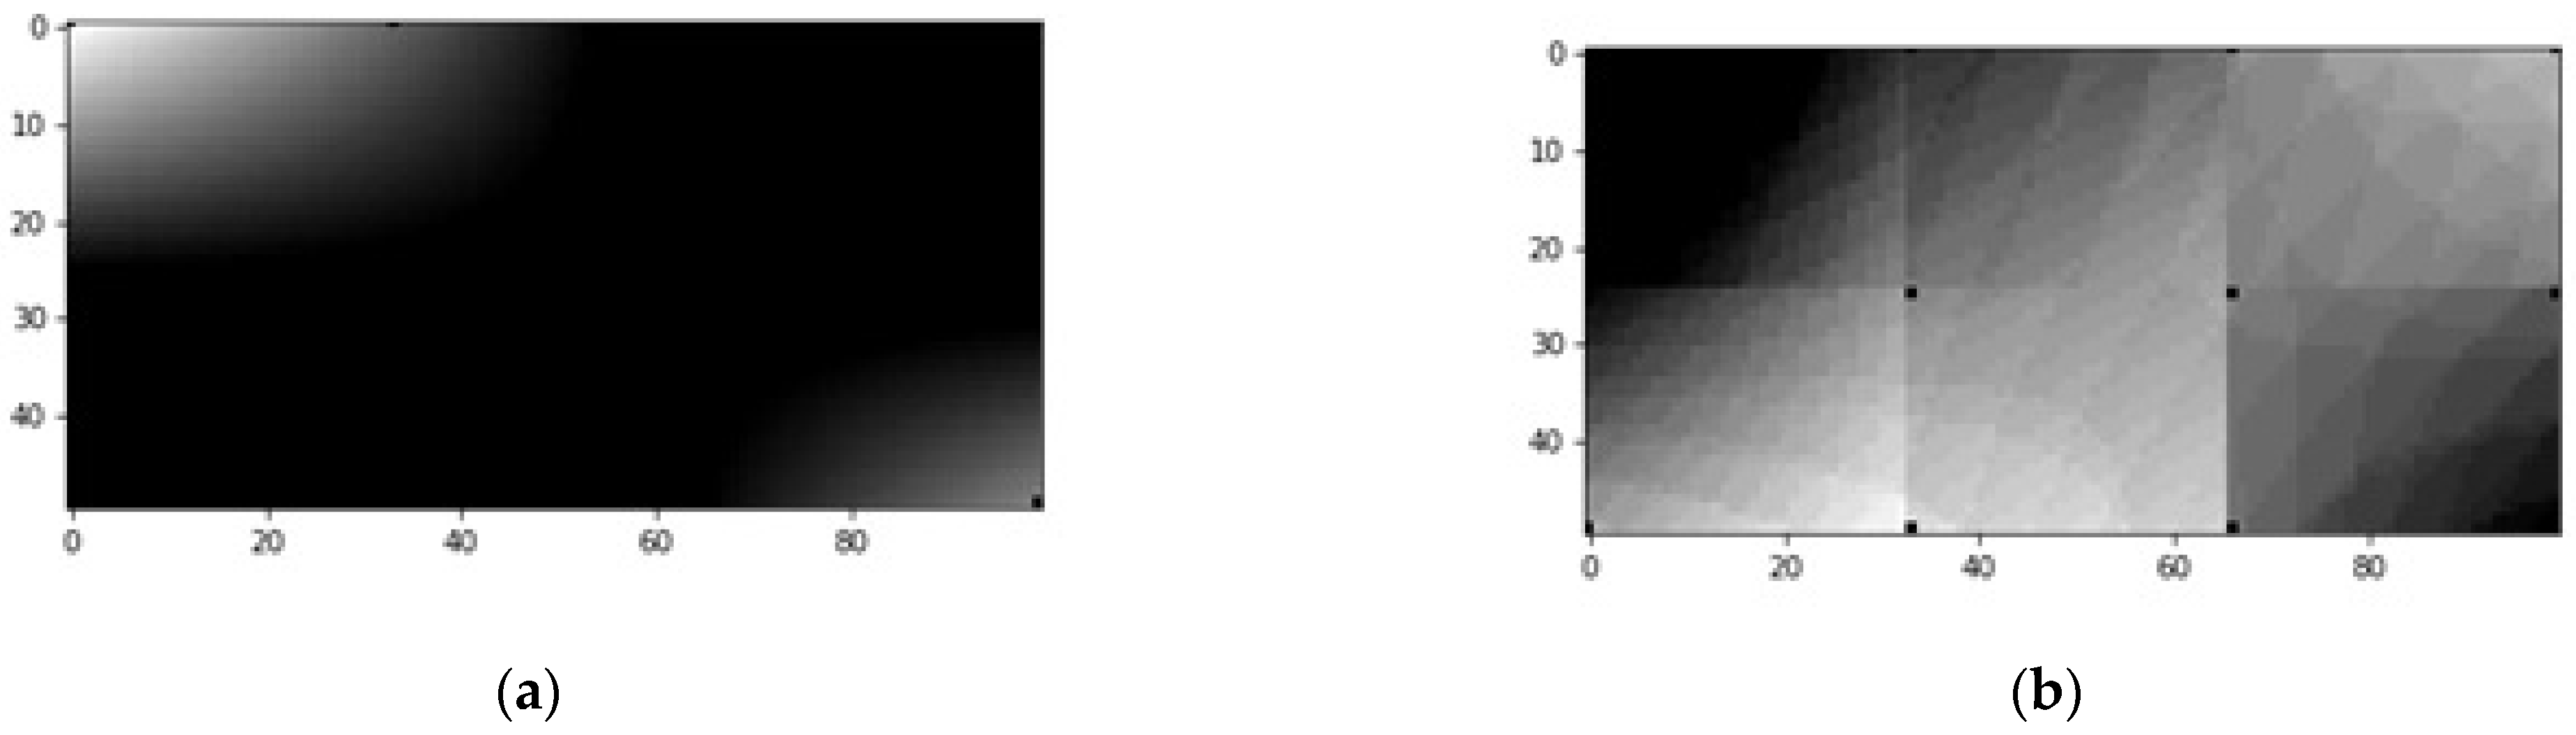
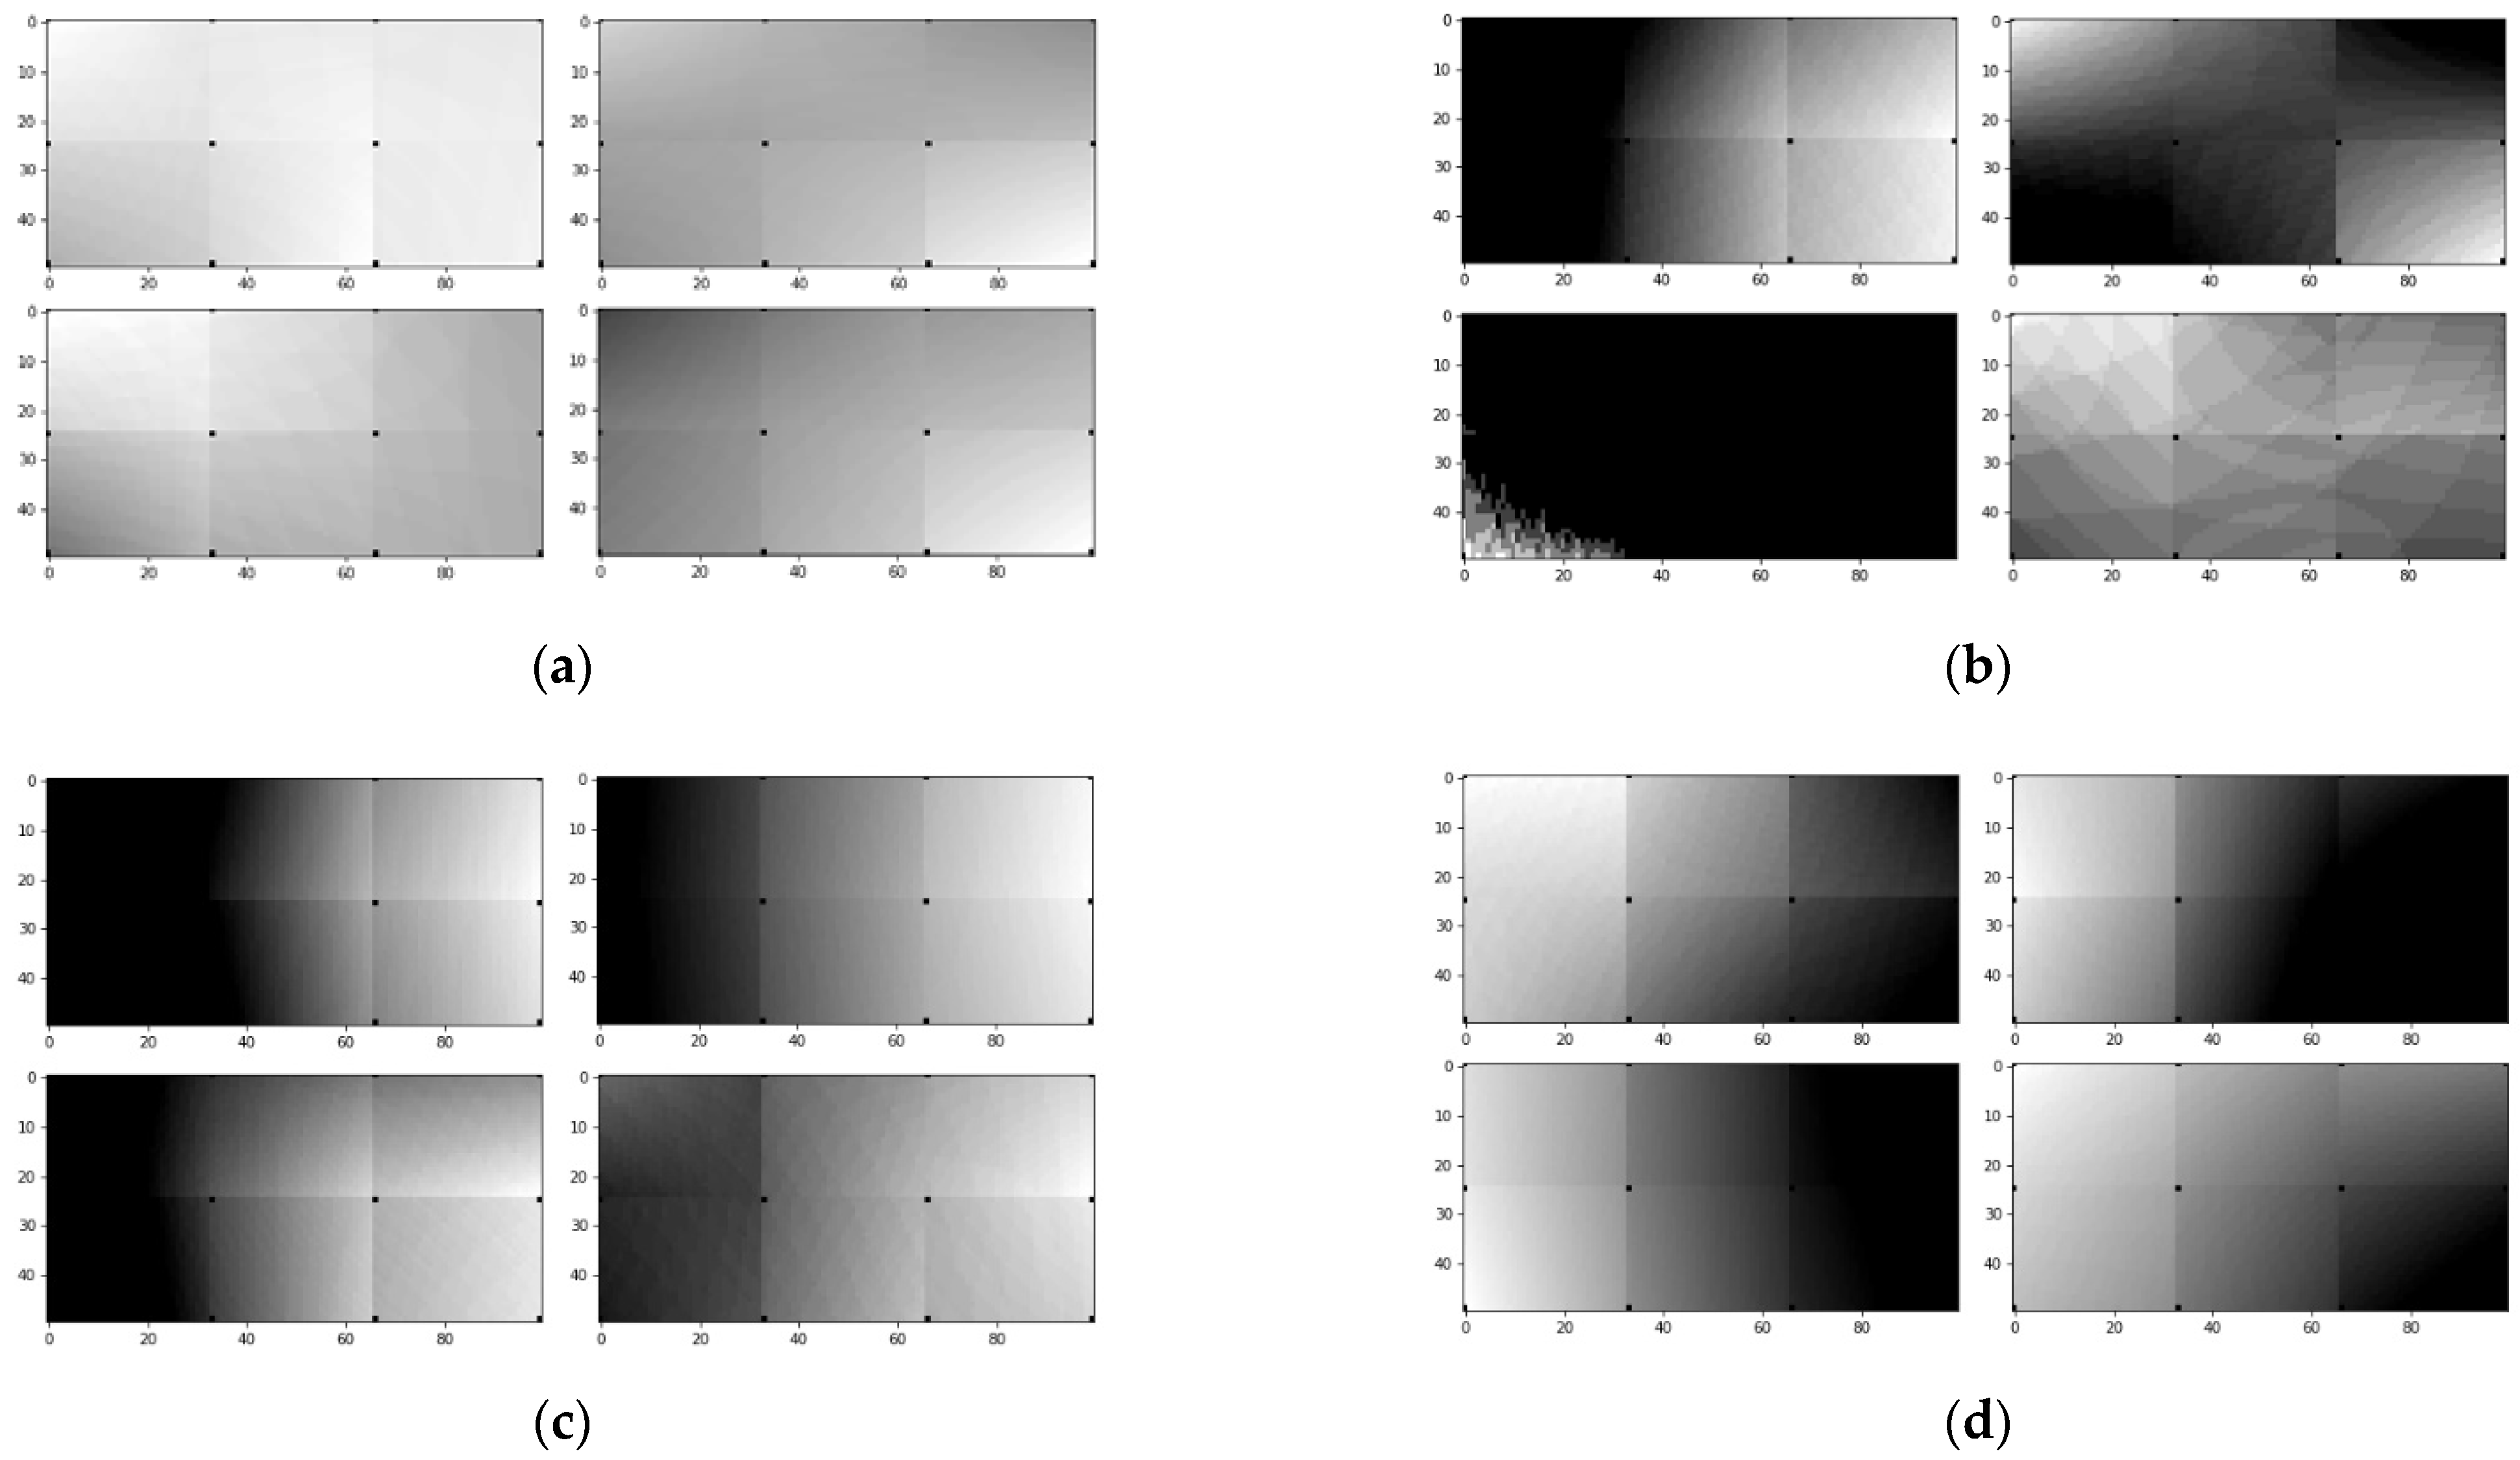
Now, by applying Equation (1) it is possible to simulate dust propagation in a plane (approximately 1.5 m above floor, this is the height of the sensor placement). The simulation was performed in three steps. The first step is to generate a large number of images representing various cases of dust particle distribution and classify them into four classes: none: neither vent is turned on, both: both vents are turned on, top-left: vent V1 is turned on, and bottom-down: vent V2 turns on. The second step involves determining the convolutional neural net (CNN) architecture, as well as its training. This step was performed using a tensorflow/keras environment (Jupyter Notebook). The third step involves the testing of the CNN on a test set. The situation when the sensors are placed only in the room corners corresponds to a case when there is no movement in the room (or it is negligible). This situation is shown in
Figure 4a. The presence of dust particles is shown in shades of gray (dark: more particles, light: fewer particles). It has been established that this situation does not correspond to reality, due to the swirling of the air caused by the movement of employees who operate the machines and the possible opening of the door when entering and leaving the room. In reality, this room is mostly isolated from the rest of the plant to prevent the spread of dust particles.
Figure 4b shows a case of interpolation using multiple sensors, as shown in
Figure 4. This way of generating images representing dust particles is more in line with the real situation; it is now possible to represent pollution in separate sectors.
Synthetic data in the form of images were generated in the first step. A total of 616 images were generated, which were classified into four classes according to which vent should be turned on: V1, V2, both, or none. First, the dust particle emitters values were randomly initialized, and then the readings on the sensors were selected so that they depend on the distances of the dust emitters, but some randomness was also included. In total, 1200 test images were synthesized in this step. Examples of synthesized training images for each class are shown in
Figure 5.
In the next step, a suitable artificial neural network architecture was chosen: a convolutional neural network (CNN) was chosen because this architecture recognizes the patterns that exist in the images very well [
42,
43]. Since a CNN is not suitable for implementation in low end wireless nodes, it was planned to be deployed in the middleware layer. Several variants of CNN architectures were tested, some of which contain more than 12,000,000 trainable parameters, so training can be extremely time consuming. However, the goal was that the training does not take long on the average hardware/software platform to allow for possible retraining, which would improve the system. Certainly, it is desirable to measure the duration of the training process in hours instead of days. It was decided to use four convolutional layers with a “relu” activation function; there were 64 3 × 3 kernels. Each convolution layer was followed by a pooling layer, the window size was 2 by 2. Finally, there were two fully connected layers with 164 and 4 neurons, and the activation functions were “relu” and “softmax”, respectively. The loss function was “categorical_crossentropy”, with “adam” optimizer, “accuracy” metrics, and validation split set to 0.1. There were 154,232 trainable parameters in total. After 100 epochs, the achieved training set accuracy was 0.977. The third step was testing the previously trained network on 1200 images. The achieved test set accuracy was 0.822. The accuracy of 0.822 was not particularly high, so there was an additional adjustment of the CNN and a more significant number of images in the training set.
4. Experiment
For the purpose of validation of the proposed model and for measuring its efficiency and usability, the testing platform was developed. The testing platform was used in the experiment with two goals. The first goal was to prove that Arduino/Genuino Uno and similar platforms could be used for development of the prototypes of the sensor nodes, and for testing smart industrial systems. The second goal was to estimate the usability and functionality of the MQTT protocol in industrial system environments.
The testing platform was designed as follows:
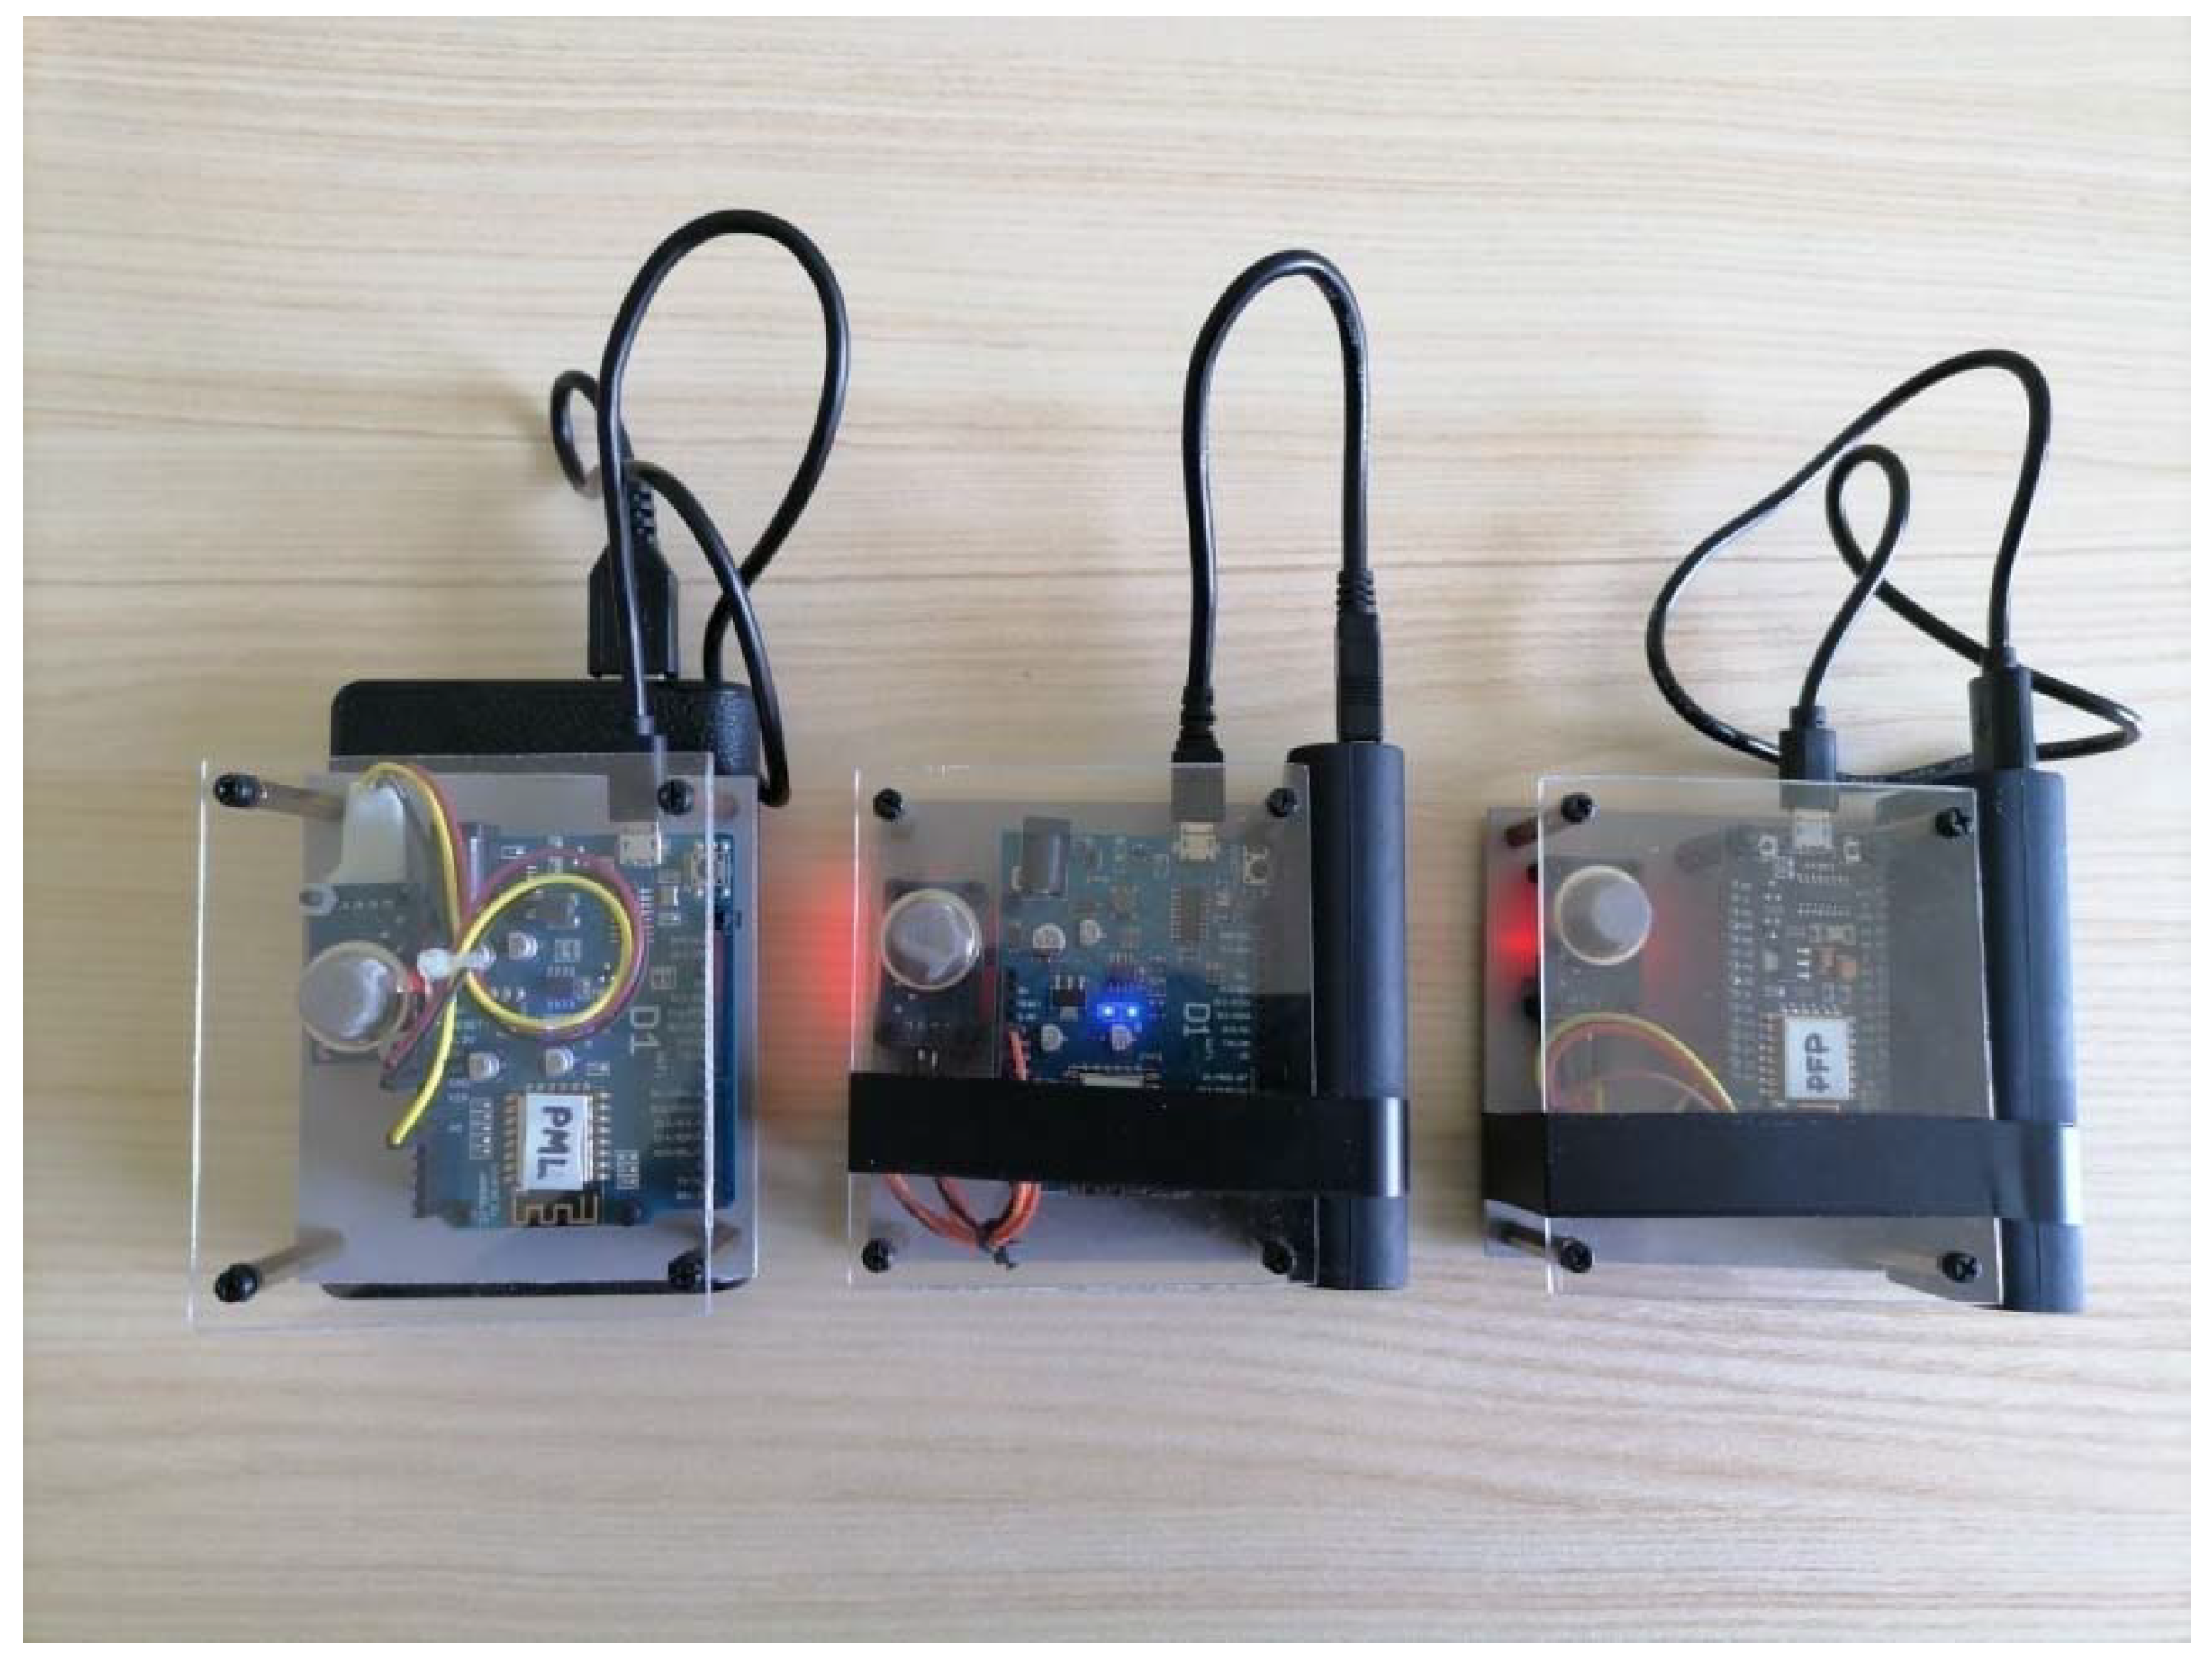
Sensor nodes were based on Arduino/Genuino UNO Rev3 clones with integrated ESP8266 module. A total of 10 sensor nodes were developed and used in the scenarios. The sensor nodes are presented in
Figure 6, and had the following configuration:
- ▪
Wemos D1 R2: 5 pcs. (four with MQ-135 and one with MQ-2 sensor),
- ▪
Espduino: 2 pcs. (one with MQ-135 and one with MQ-2 sensor), and
- ▪
NodeMCU 12E v1.0: 3 pcs. (all three with MQ-135 sensor).
A laptop was used as the system hosting computer, with the following components: CPU Intel(R) Core(TM) i3-4005U CPU @ 1.70 GHz, 4 GB RAM, DDR3 450 GD SATA HDD, internal WLAN adapter (optionally with TP-Link 722N external USB WLAN adapter), and
Wireless access point/router
Software components of the system were:
Windows 10, Mosquitto broker, Python script for subscription (irrelevant for the testing), screen display, and writing to SQLite database (irrelevant for the testing), installed on the laptop described above.
Wireshark Network Analyzer tool installed on the same laptop.
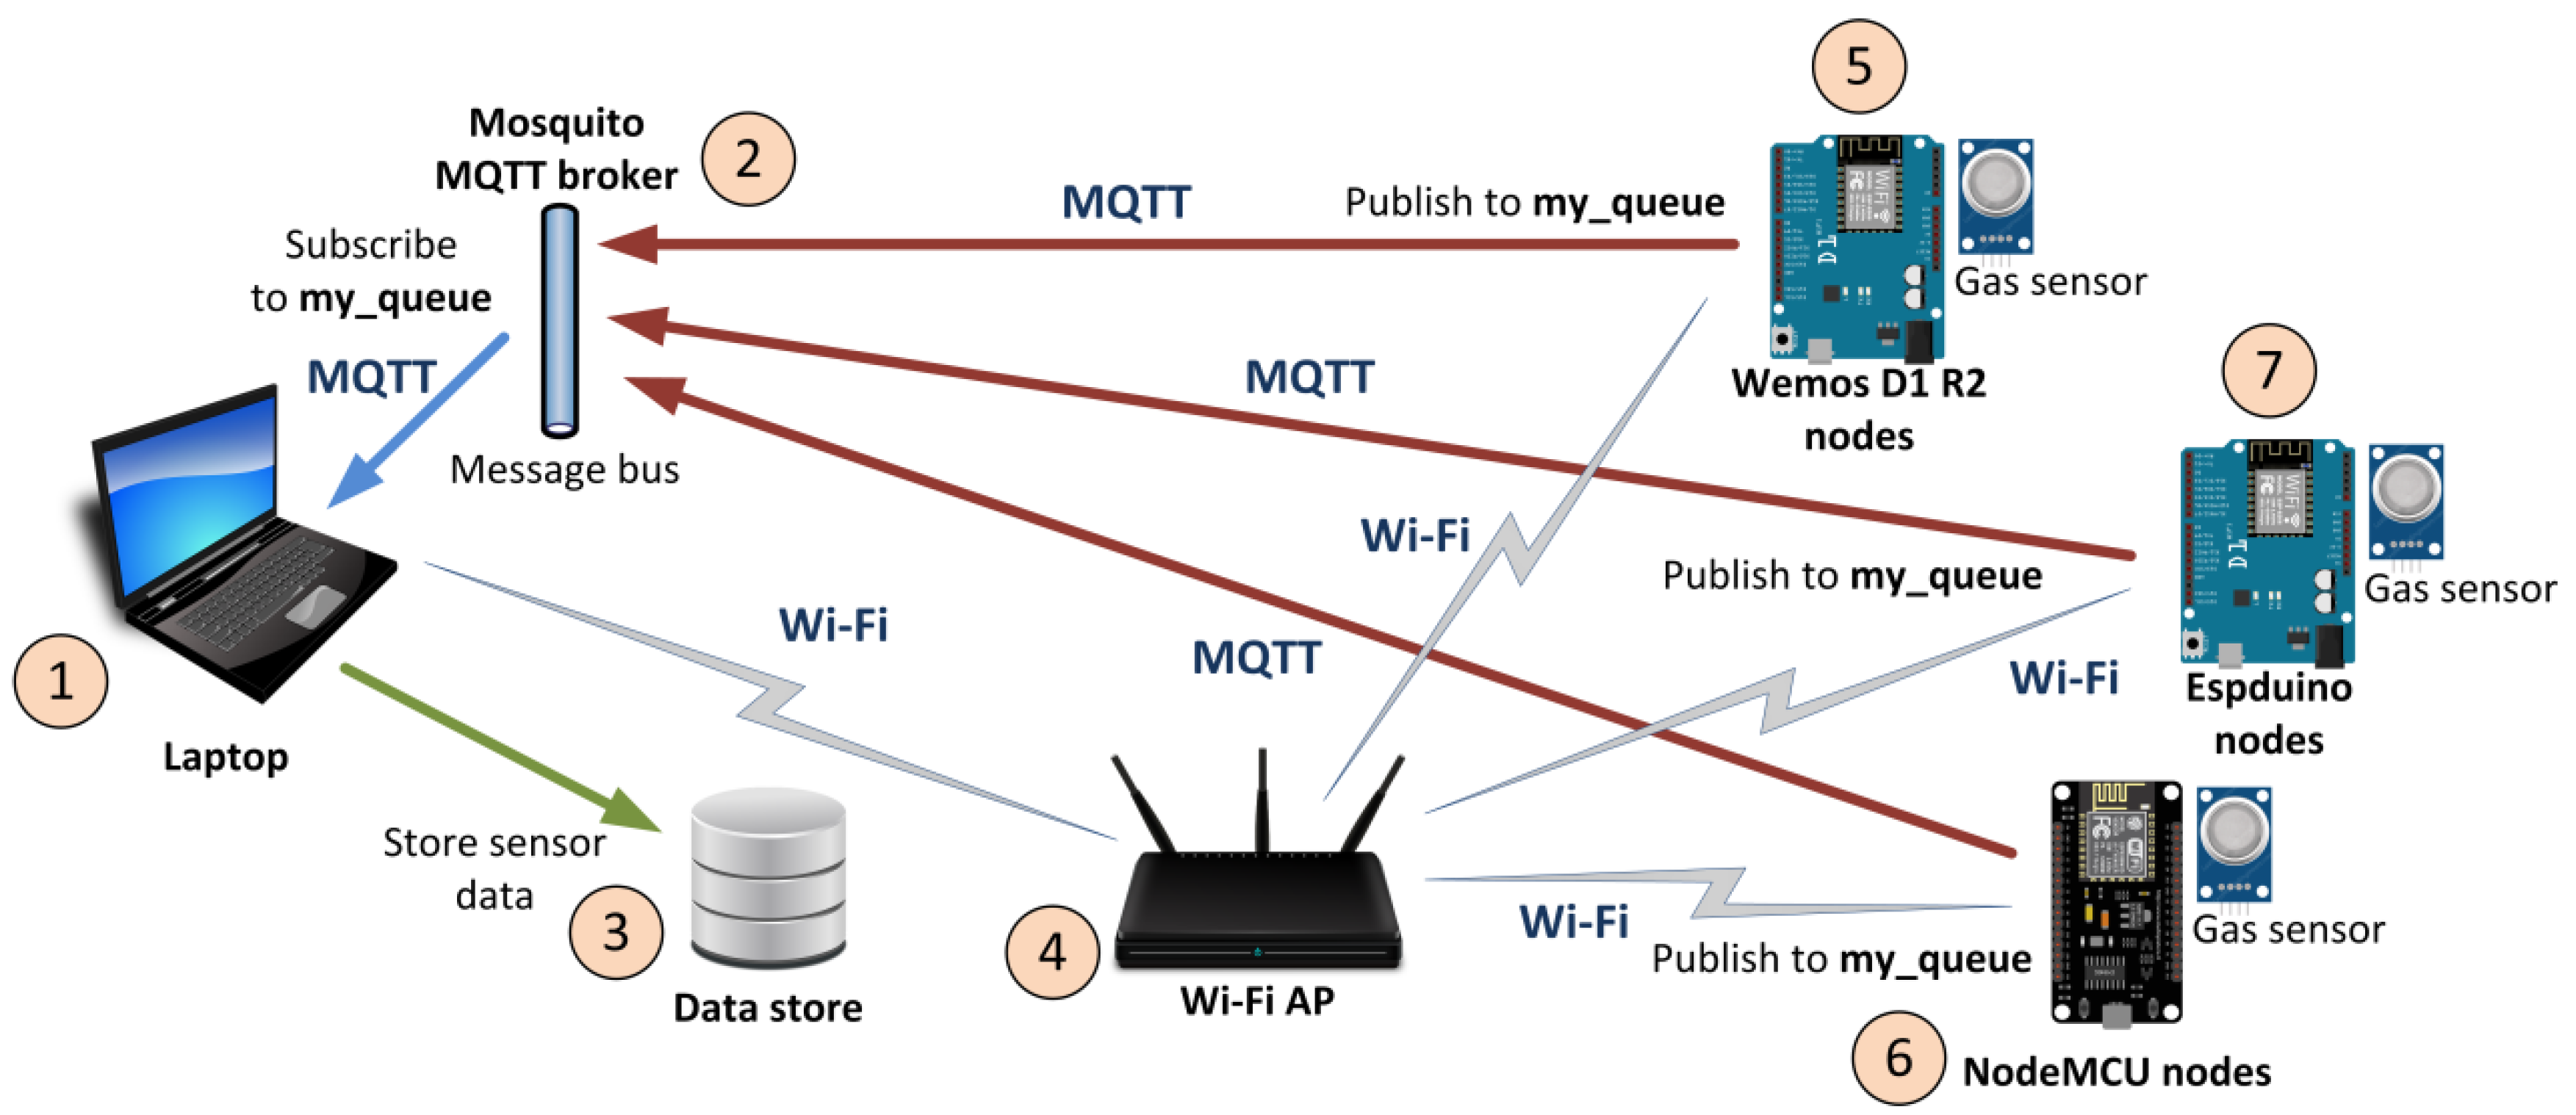
The deployment of the testing platform components and their connectivity are shown in
Figure 7. At the PHY layer all nodes and server were connected to the Wi-Fi wireless access point/router (4) using IEEE 802.11n technology. Laptop (1) had Mosquitto MQTT broker (2), data store (3), and Wireshark network analyzing tool installed. It also had Python script installed for displaying sensor data from the queue, and for storing same data in the SQLite database. The Python script and data store are not relevant for this research. The sensor nodes were presented with: five Wemos D1 R2 (5), three NodeMCUs (6), and two Espduino (7) Arduino clones. All sensor nodes used same firmware developed with the Arduino IDE software, and had one gas sensor, as described in the beginning of
Section 4.
This is the general purpose platform, designed to be deployed in industrial, laboratory, and classroom environments as a test-bed for the development and testing of prototype software applications for design and teaching purposes. The platform was tested in laboratory conditions, in a small sized room (about 10 square meters) with office furniture, and a high level of interference from other wireless devices not part of the platform.
Experiment Description
The experiment consisted of four scenarios. The experimental scenarios are described with the number of sensor nodes, data sending interval, and with the load of the server measured with the packets per second. The data collected during the experiment are presented in this study are openly available in the
Supplementary Materials. Those four experimental scenarios were:
4 sensor nodes, data send interval: 5 s: 0.62 pckts./sec server load
4 sensor nodes, data send interval: 200 ms: 11.82 pckts./sec server load
4 sensor nodes, data send interval: no delay: 51.10 pckts./sec server load
10 sensor nodes, data send interval: no delay: 174.11 pckts./sec server load
5. Results
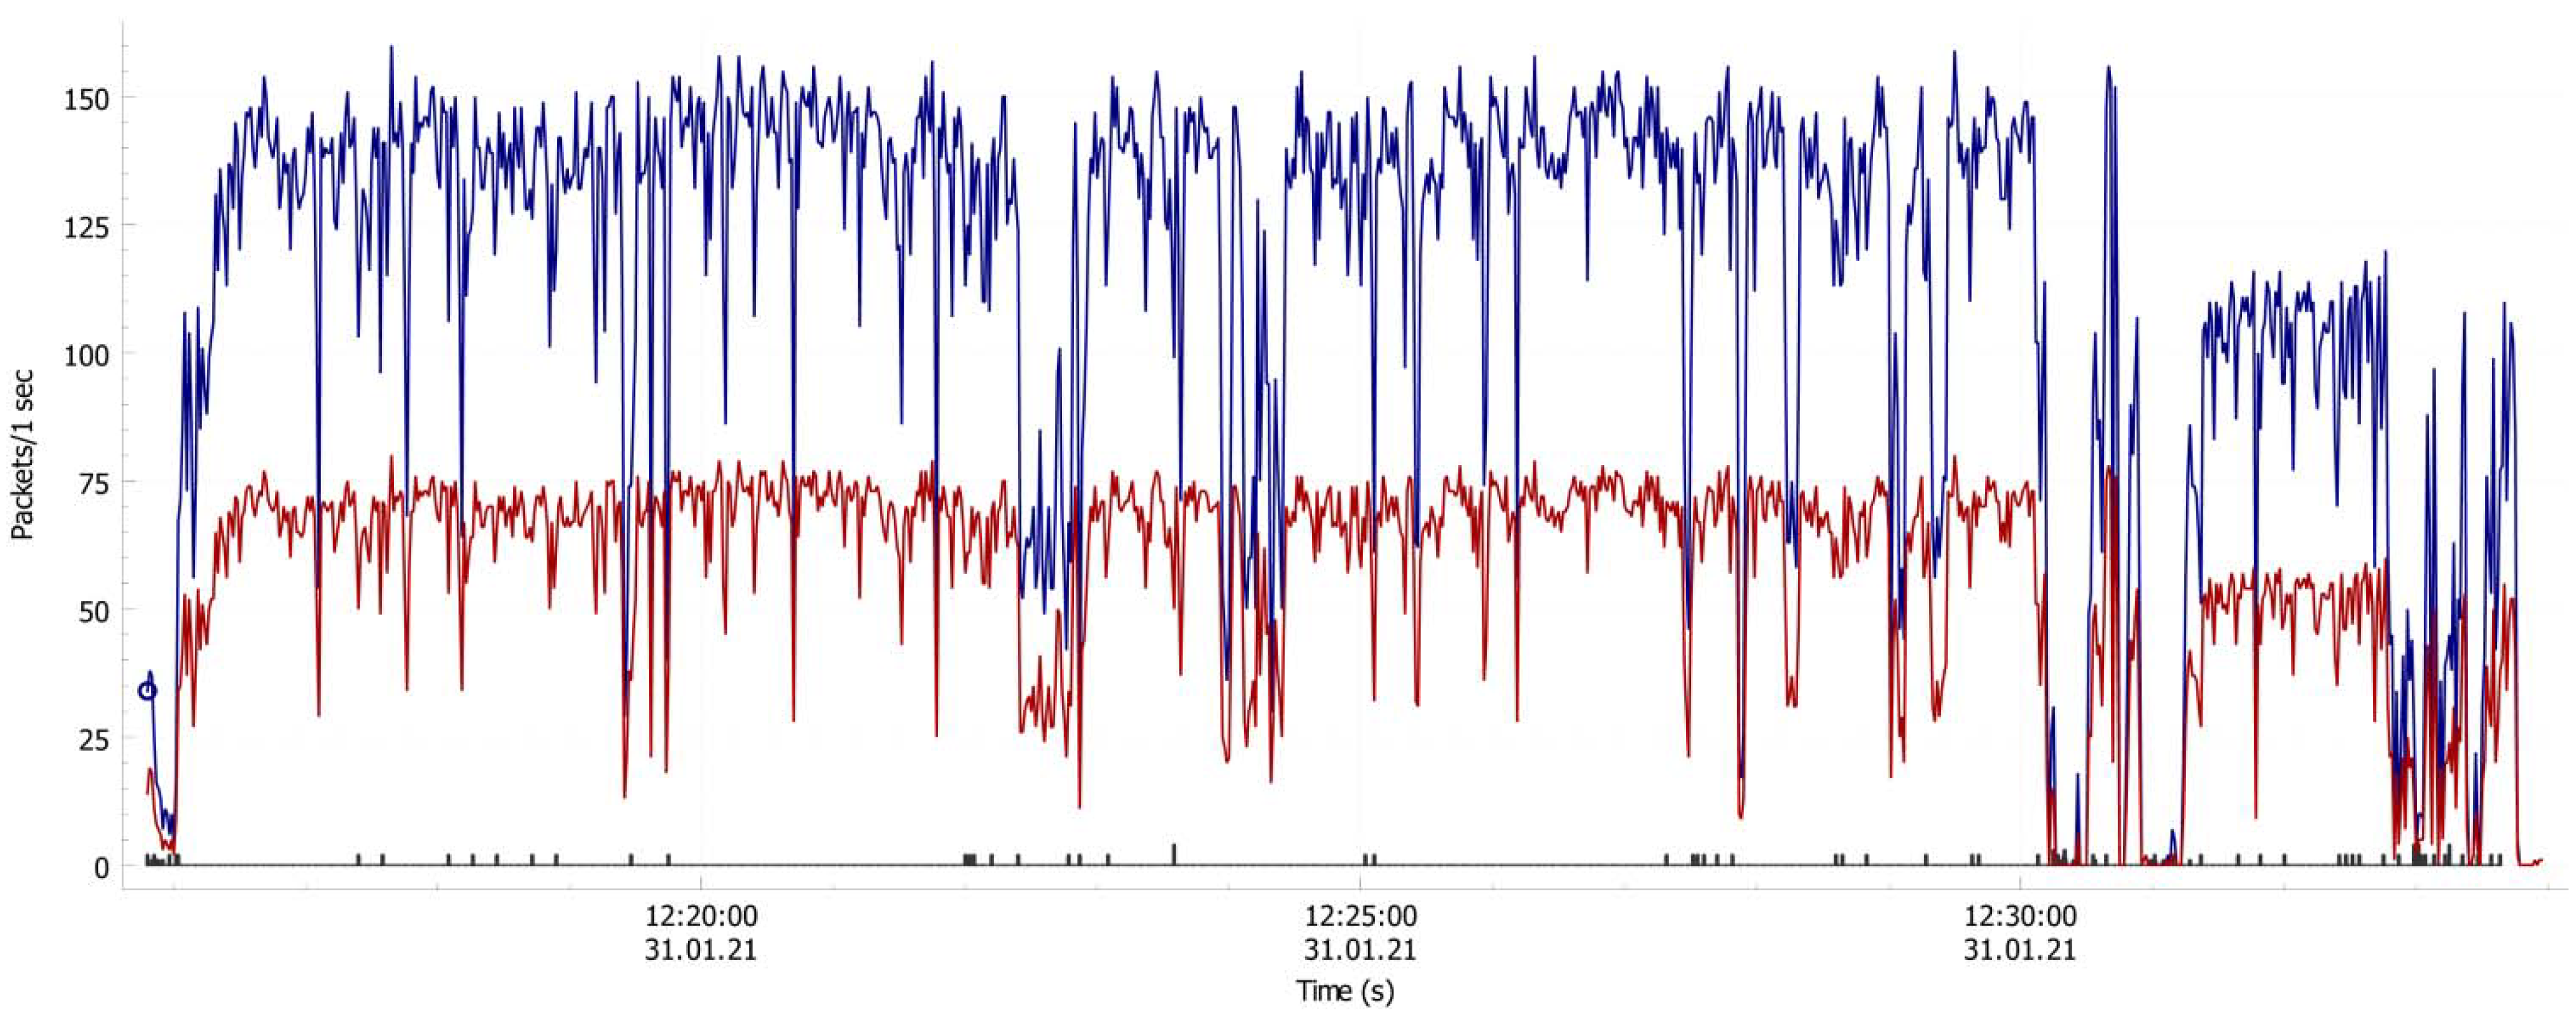
The experiment data summary is presented and discussed in this section. The traffic was captured with the network analyzing tool Wireshark and logged data were latter used for traffic analyses. The traffic load in the case of the scenario with four sensor nodes deployed is shown in the
Figure 8.
Figure 8 shows traffic load in packets per second in communication between the server and four sensor nodes, with no delay between data sending interval. The higher values (blue lines) represent TCP packets, lower values (red line) represent MQTT packets, and the lowest values (dark line close to the 0) represent error packets.
A higher traffic load was achieved with the usage of 10 sensor nodes in scenario 4. This traffic load is shown in
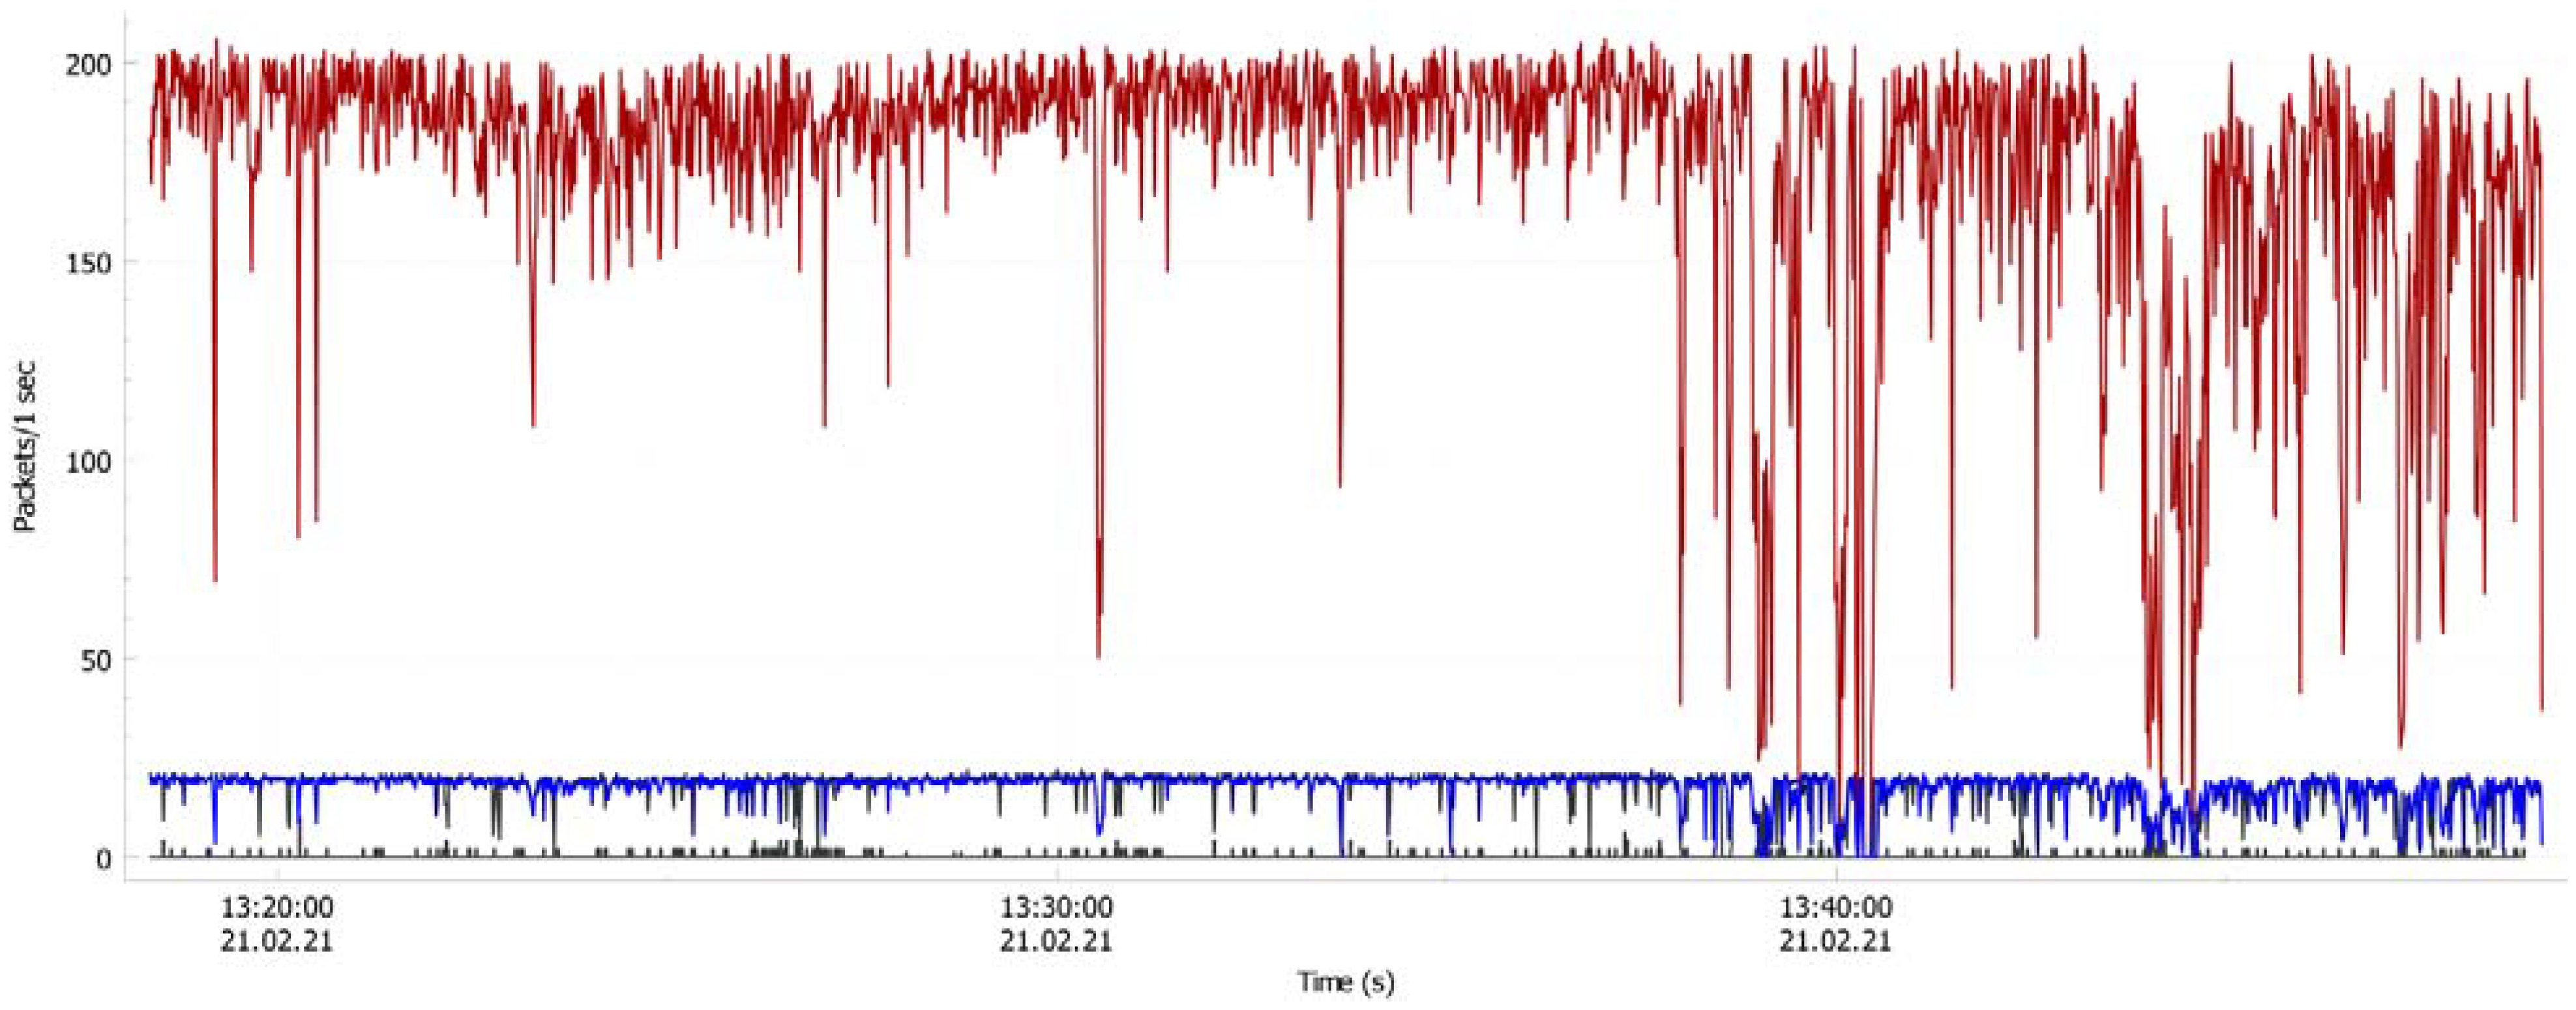
Figure 9, where the number of MQTT packets sent to the server, the MQTT packets sent from a single sensor node, and the TCP errors per second are presented. The higher values (red line) represent MQTT packets send to the server from sensor nodes, middle values (blue line) represent MQTT packets sent from individual sensor nodes to the server, and the lowest values (dark line close to 0) represent error packets.
The traffic load for the same scenario is shown in
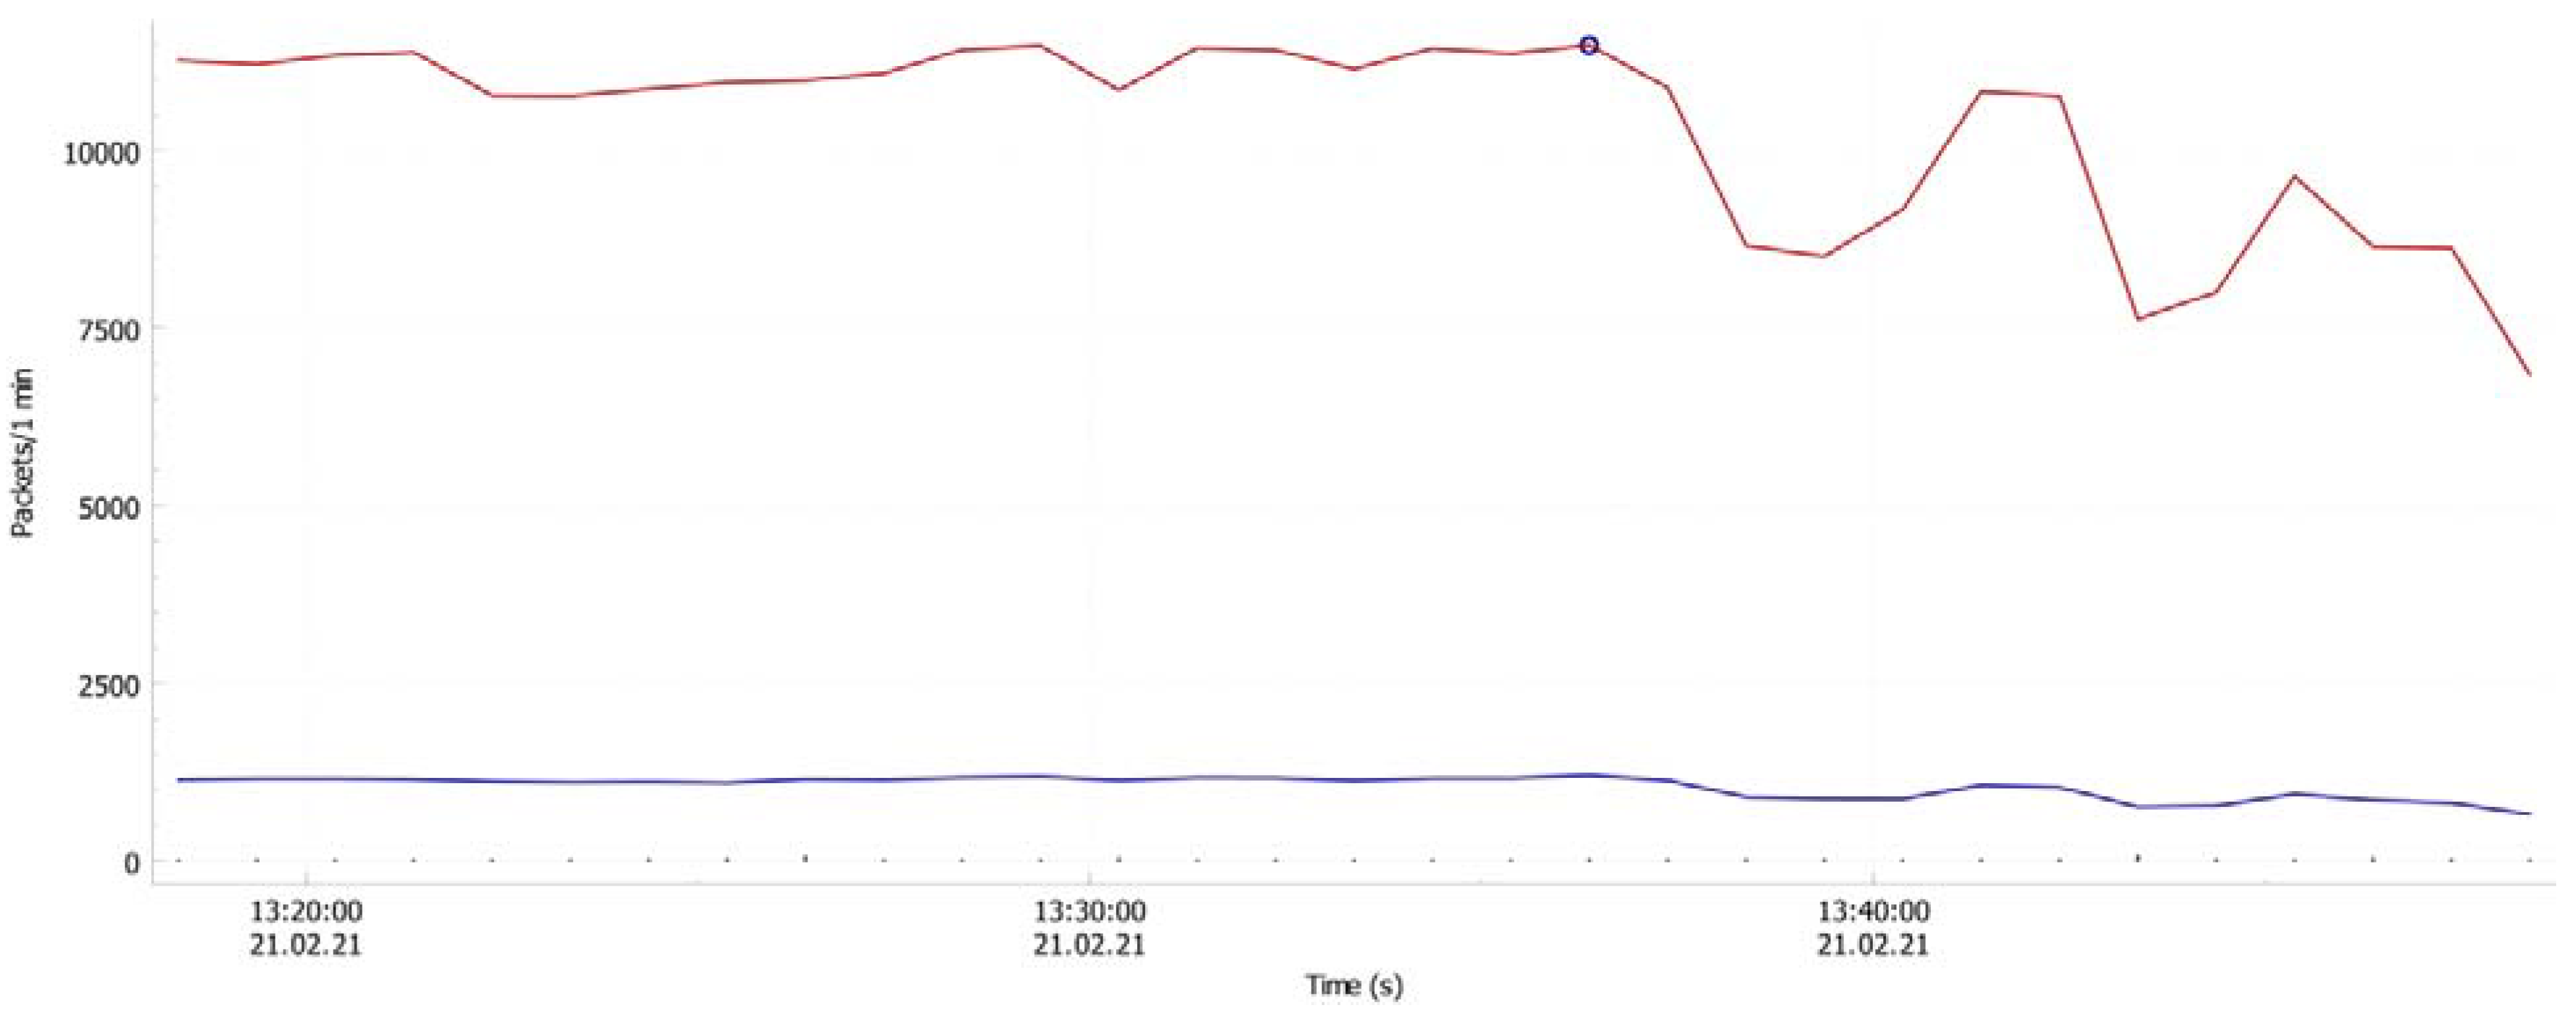
Figure 10. Figure shows the number of MQTT packets sent to the server, MQTT packets sent from single sensor node, and TCP errors per minute. The higher values (red line) represent MQTT packets sent to server, lower values (blue line) represent MQTT packets sent from individual node, and the lowest values (dark line close to the 0) present error packets per minute.
Table 1 shows the average and maximal number of MQTT packets for all nodes (total MQTT) and for each node separately per second. The 10 sensor nodes are displayed in the table with the last octet of IP address (192.168.0.14, 192.168.0.15, 192.168.0.17, 192.168.0.18, 192.168.0.19, 192.168.0.20, 192.168.0.21, 192.168.0.22, 192.168.0.24, and 192.168.0.26).
Table 2 shows the average and maximal number of MQTT packets for all nodes (total MQTT) and for each node separately per minute.
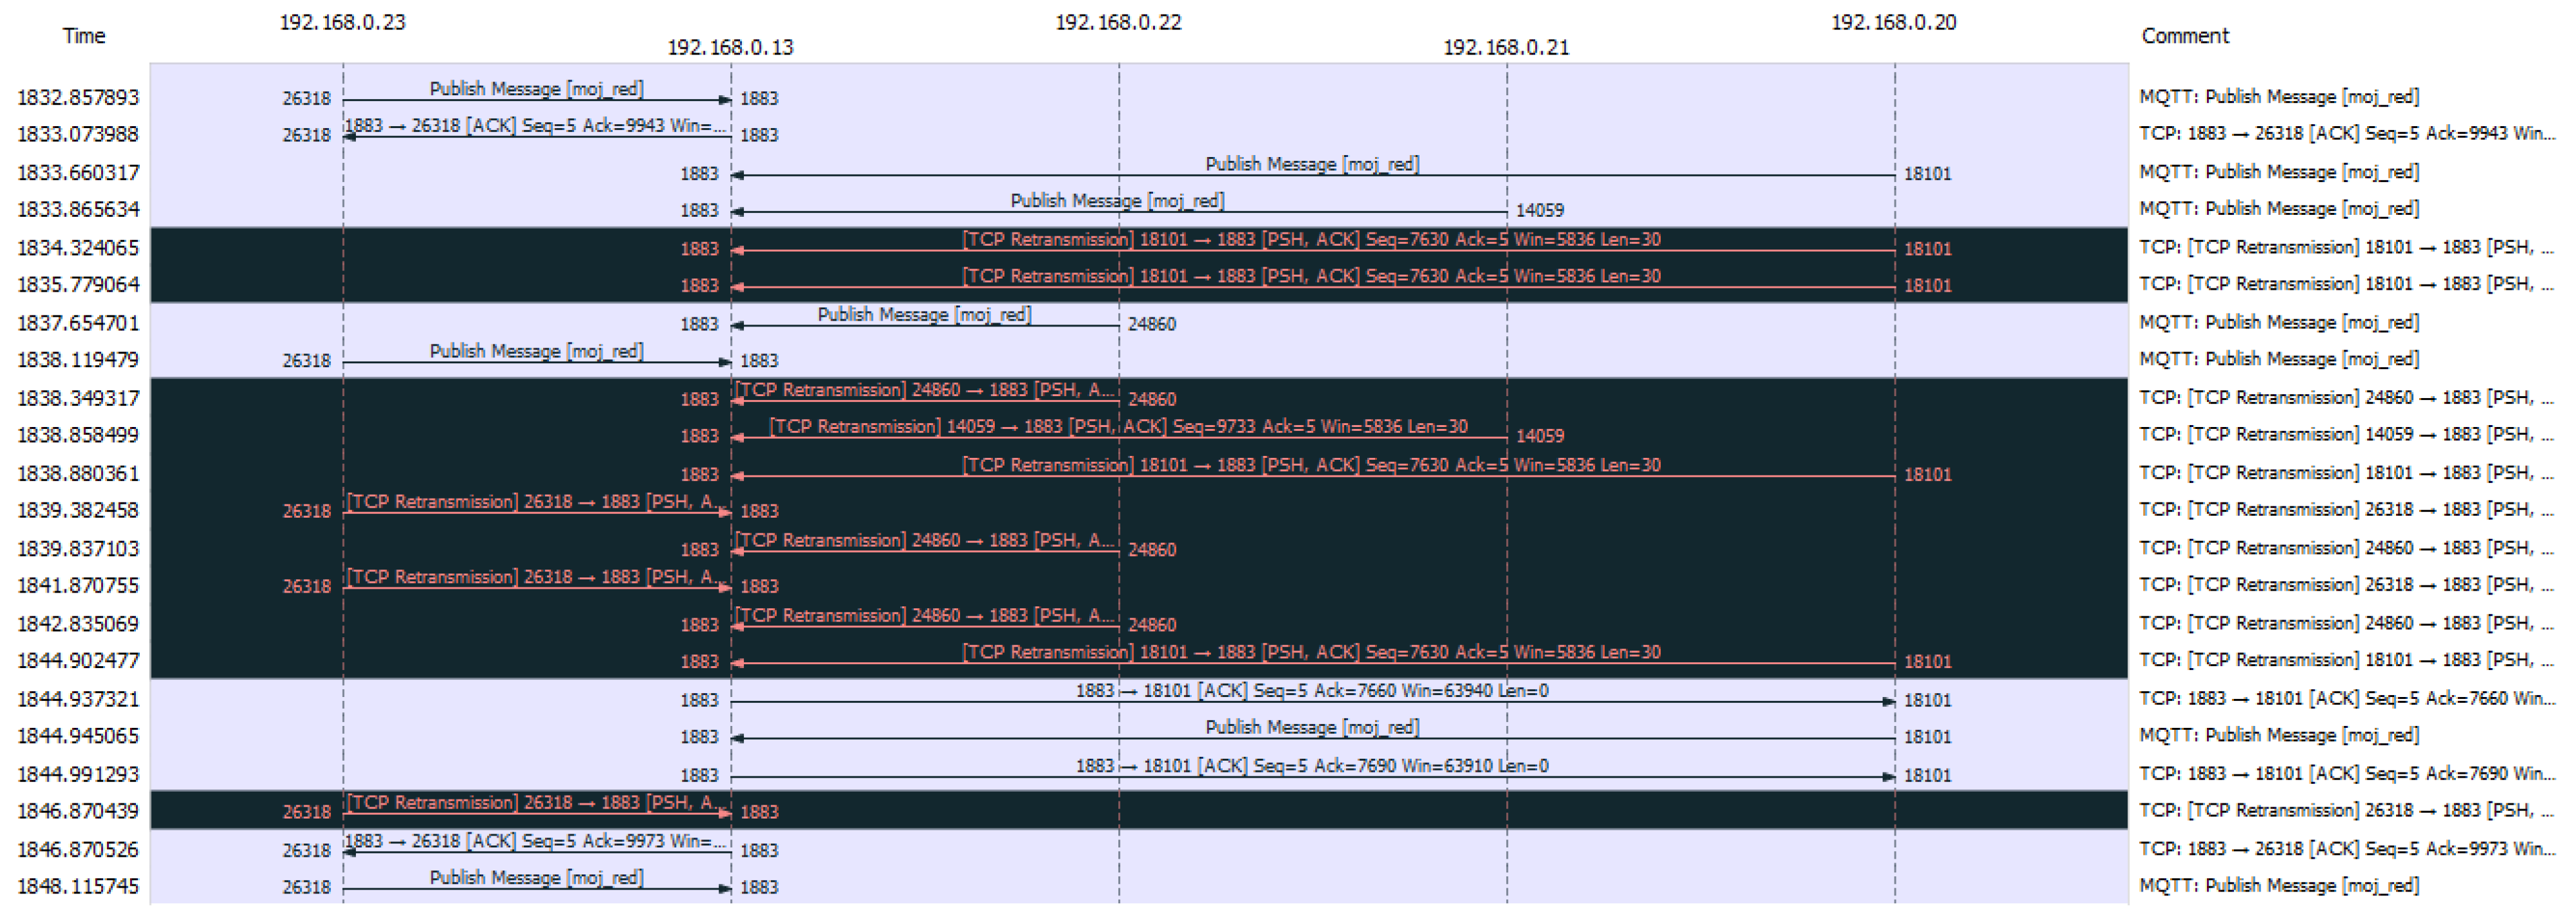
The flowchart of the communication between the server and the four test devices is presented in the
Figure 11. The presented flowchart contains no errors, and the communication between each node and server is made in two packets in pairs. One packet is for sending the MQTT message from the node to server, and represents the MQTT publishing message. The second message is the ACK message from the server, with the confirmation that the packet is correctly received.
The testing platform and partially implemented proposed model worked satisfactorily. Errors in communication occurred only during a small percentage of the time. The interval in the communication with the increasing number of errors is shown in the
Figure 12.
As said before, the system traffic data were collected during the experiment using Wireshark, a network analyzing tool. The traffic was saved in the pcapng, and latter exported to CSV file and further analyzed with the Python script for creating the traffic statistics and analyses.
The traffic statistics are given in
Table 3. It is evident that the number of errors, or more accurately the number of packet retransmissions, was very low during all four scenarios. It ranged from 0.00 to 0.81 percent. It is also obvious that the increase of the packet load did not affect the increase in the packet transmission errors, or TCP packet retransmissions.
6. Conclusions
This paper presented a model for the monitoring of a working environment in smart manufacturing, and designed with the idea of including emerging technologies and contemporary approaches in building complex cyber-physical systems. A trained convolutional neural network on synthetic data is part of the proposed model, and is applicable to a variety of smart industrial monitoring scenarios. The model had to be easily developed in the form of a testing platform, with the usage of open-source hardware and software for platform development. The model and the platform were tested for their validity and applicability.
The experiment showed that the usage of the described testing platform and up to 10 Arduino/Genuino based sensor nodes could simulate a wireless smart industrial monitoring network with maximum load of 174.11 packets per second. This traffic load is suitable for small- and middle-scale smart industrial monitoring systems. The results also showed that the system works properly, with a low percentage of packet errors, and without increasing errors with a rising number of transmitted packets per second.
The testing platform proved to be efficient for: prototype building; a test bed for application development; a laboratory for engineering education at universities; a portable experimental set, which can be deployed at factories, university labs, and other specific facilities.
The possible functionality of the middleware layer was shown on the example of hazardous particles management in an indoor environment; in this case with dust particles. The convolutional neural network was trained on synthetic data and served as an example and proof of concept. The validity of this setting was verifiable using a test set. The accuracy on the test set of 82% could be increased, first of all by changing the architecture of the neural network, and then by using a more extensive training set. The application of this solution could have an impact on resource savings: vents are turned on or off depending on the amount of dust particles and their dispersion.
In future research it is necessary to examine the validity of such a solution in the case of other pollutants and their combinations.
The future research goal will be the investigation of the applicability of the proposed model in different areas, such as equipment maintenance, inventory, goods, and human resources monitoring. The expansion of the model may be also directed into the process of integration of proposed models, with cloud, edge, and fog environments.


 ,
, 


