
Gulf Cooperation Council Countries’ Climate Change Mitigation Challenges and Exploration of Solar and Wind Energy Resource Potential


Abstract
1. Introduction

2. Consumption Growth of the GCC

| Country | Area (km2) | Population (Millions) | GDP (Billion USD) | GDP per Capita (Thousand USD) | Oil Reserve (Billion Barrels) | Gas Reserve (Billion Cubic Feet) | Gas and Oil Share in GDP (%) | Gas and Oil Share in Revenues (%) |
|---|---|---|---|---|---|---|---|---|
| Saudi Arabia | 2,149,690 | 33.5 | 646 | 21 | 266 | 8588 | 48 | 90 |
| Oman | 309,500 | 4.5 | 70 | 17 | 5 | 931 | 48 | 82 |
| UAE | 71,002 | 9.5 | 370 | 48 | 98 | 6091 | 36 | 76 |
| Kuwait | 17,818 | 4.2 | 114 | 29 | 102 | 1784 | 52 | 94 |
| Qatar | 11,600 | 2.6 | 165 | 59 | 25 | 24,299 | 56 | 61 |
| Bahrain | 778.3 | 1.6 | 31 | 23 | 0.12 | 92 | 44 | 80 |
| GCC total | 2,560,388 | 55.9 | 1396 | 197 | 496.12 | 41,785 | 284 | 483 |
3. The GCC Region’s Geographical Factors
4. The GCC’s Solar and Wind Energy Resource Potential
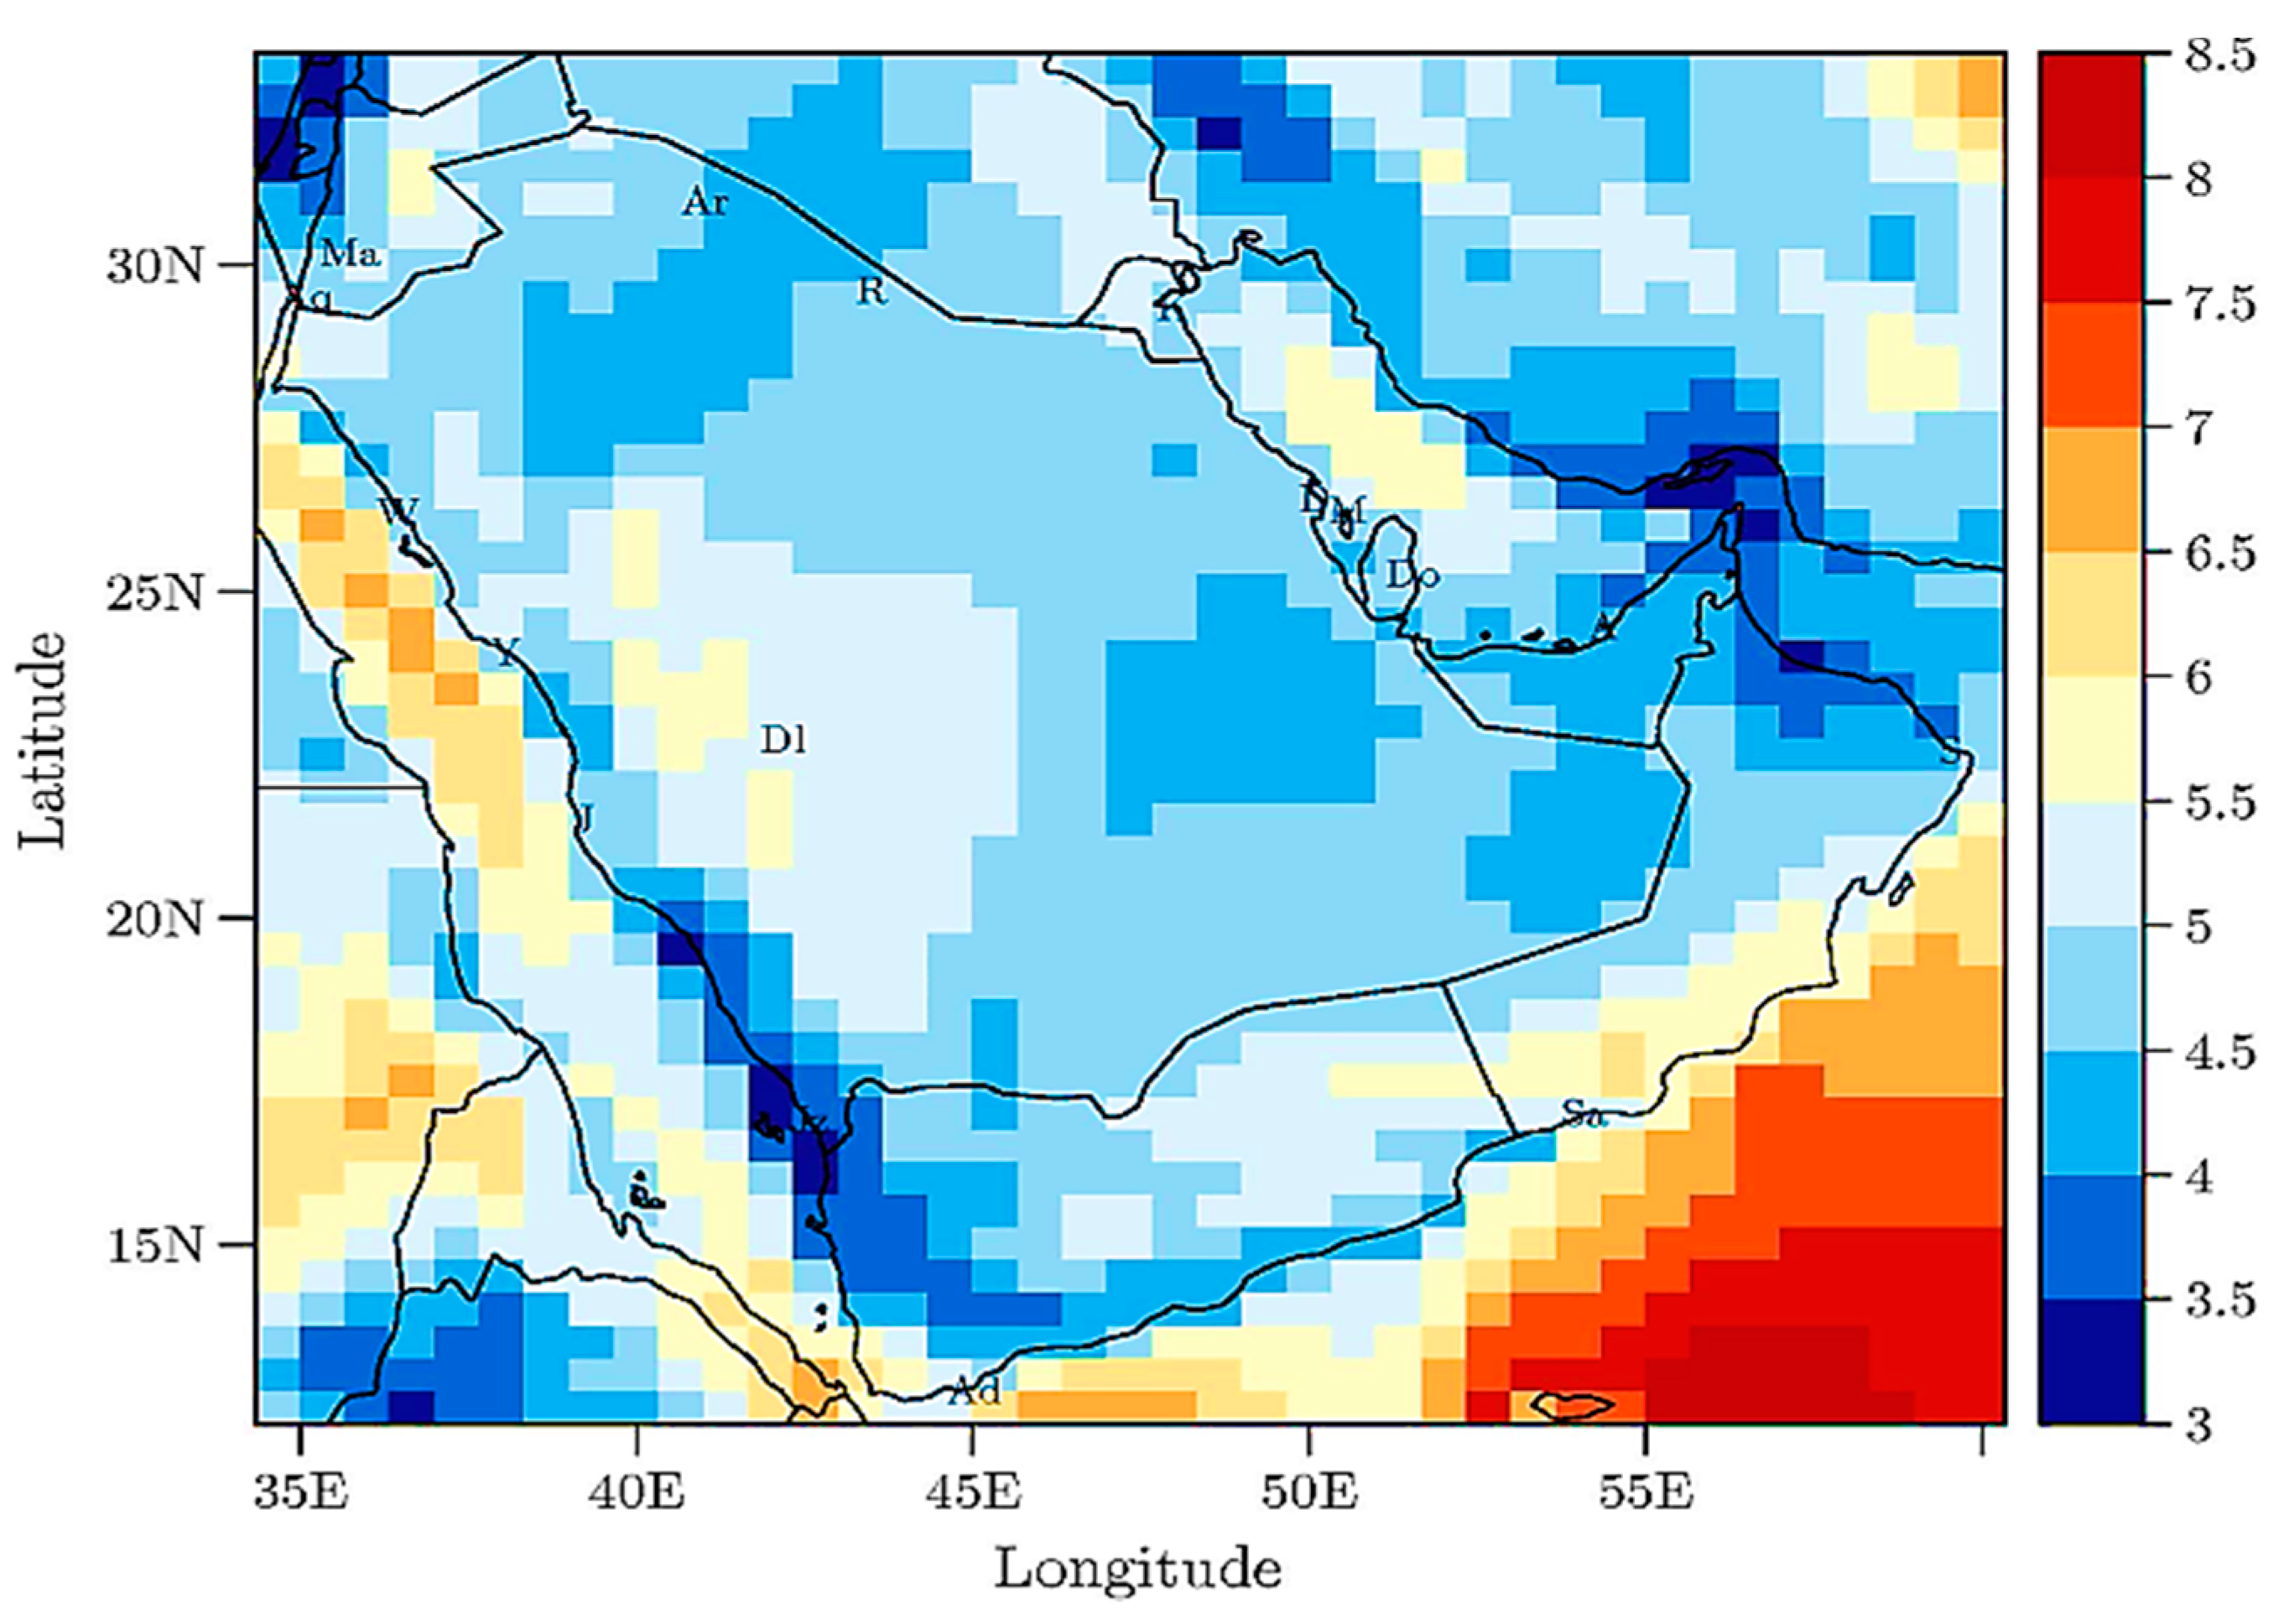
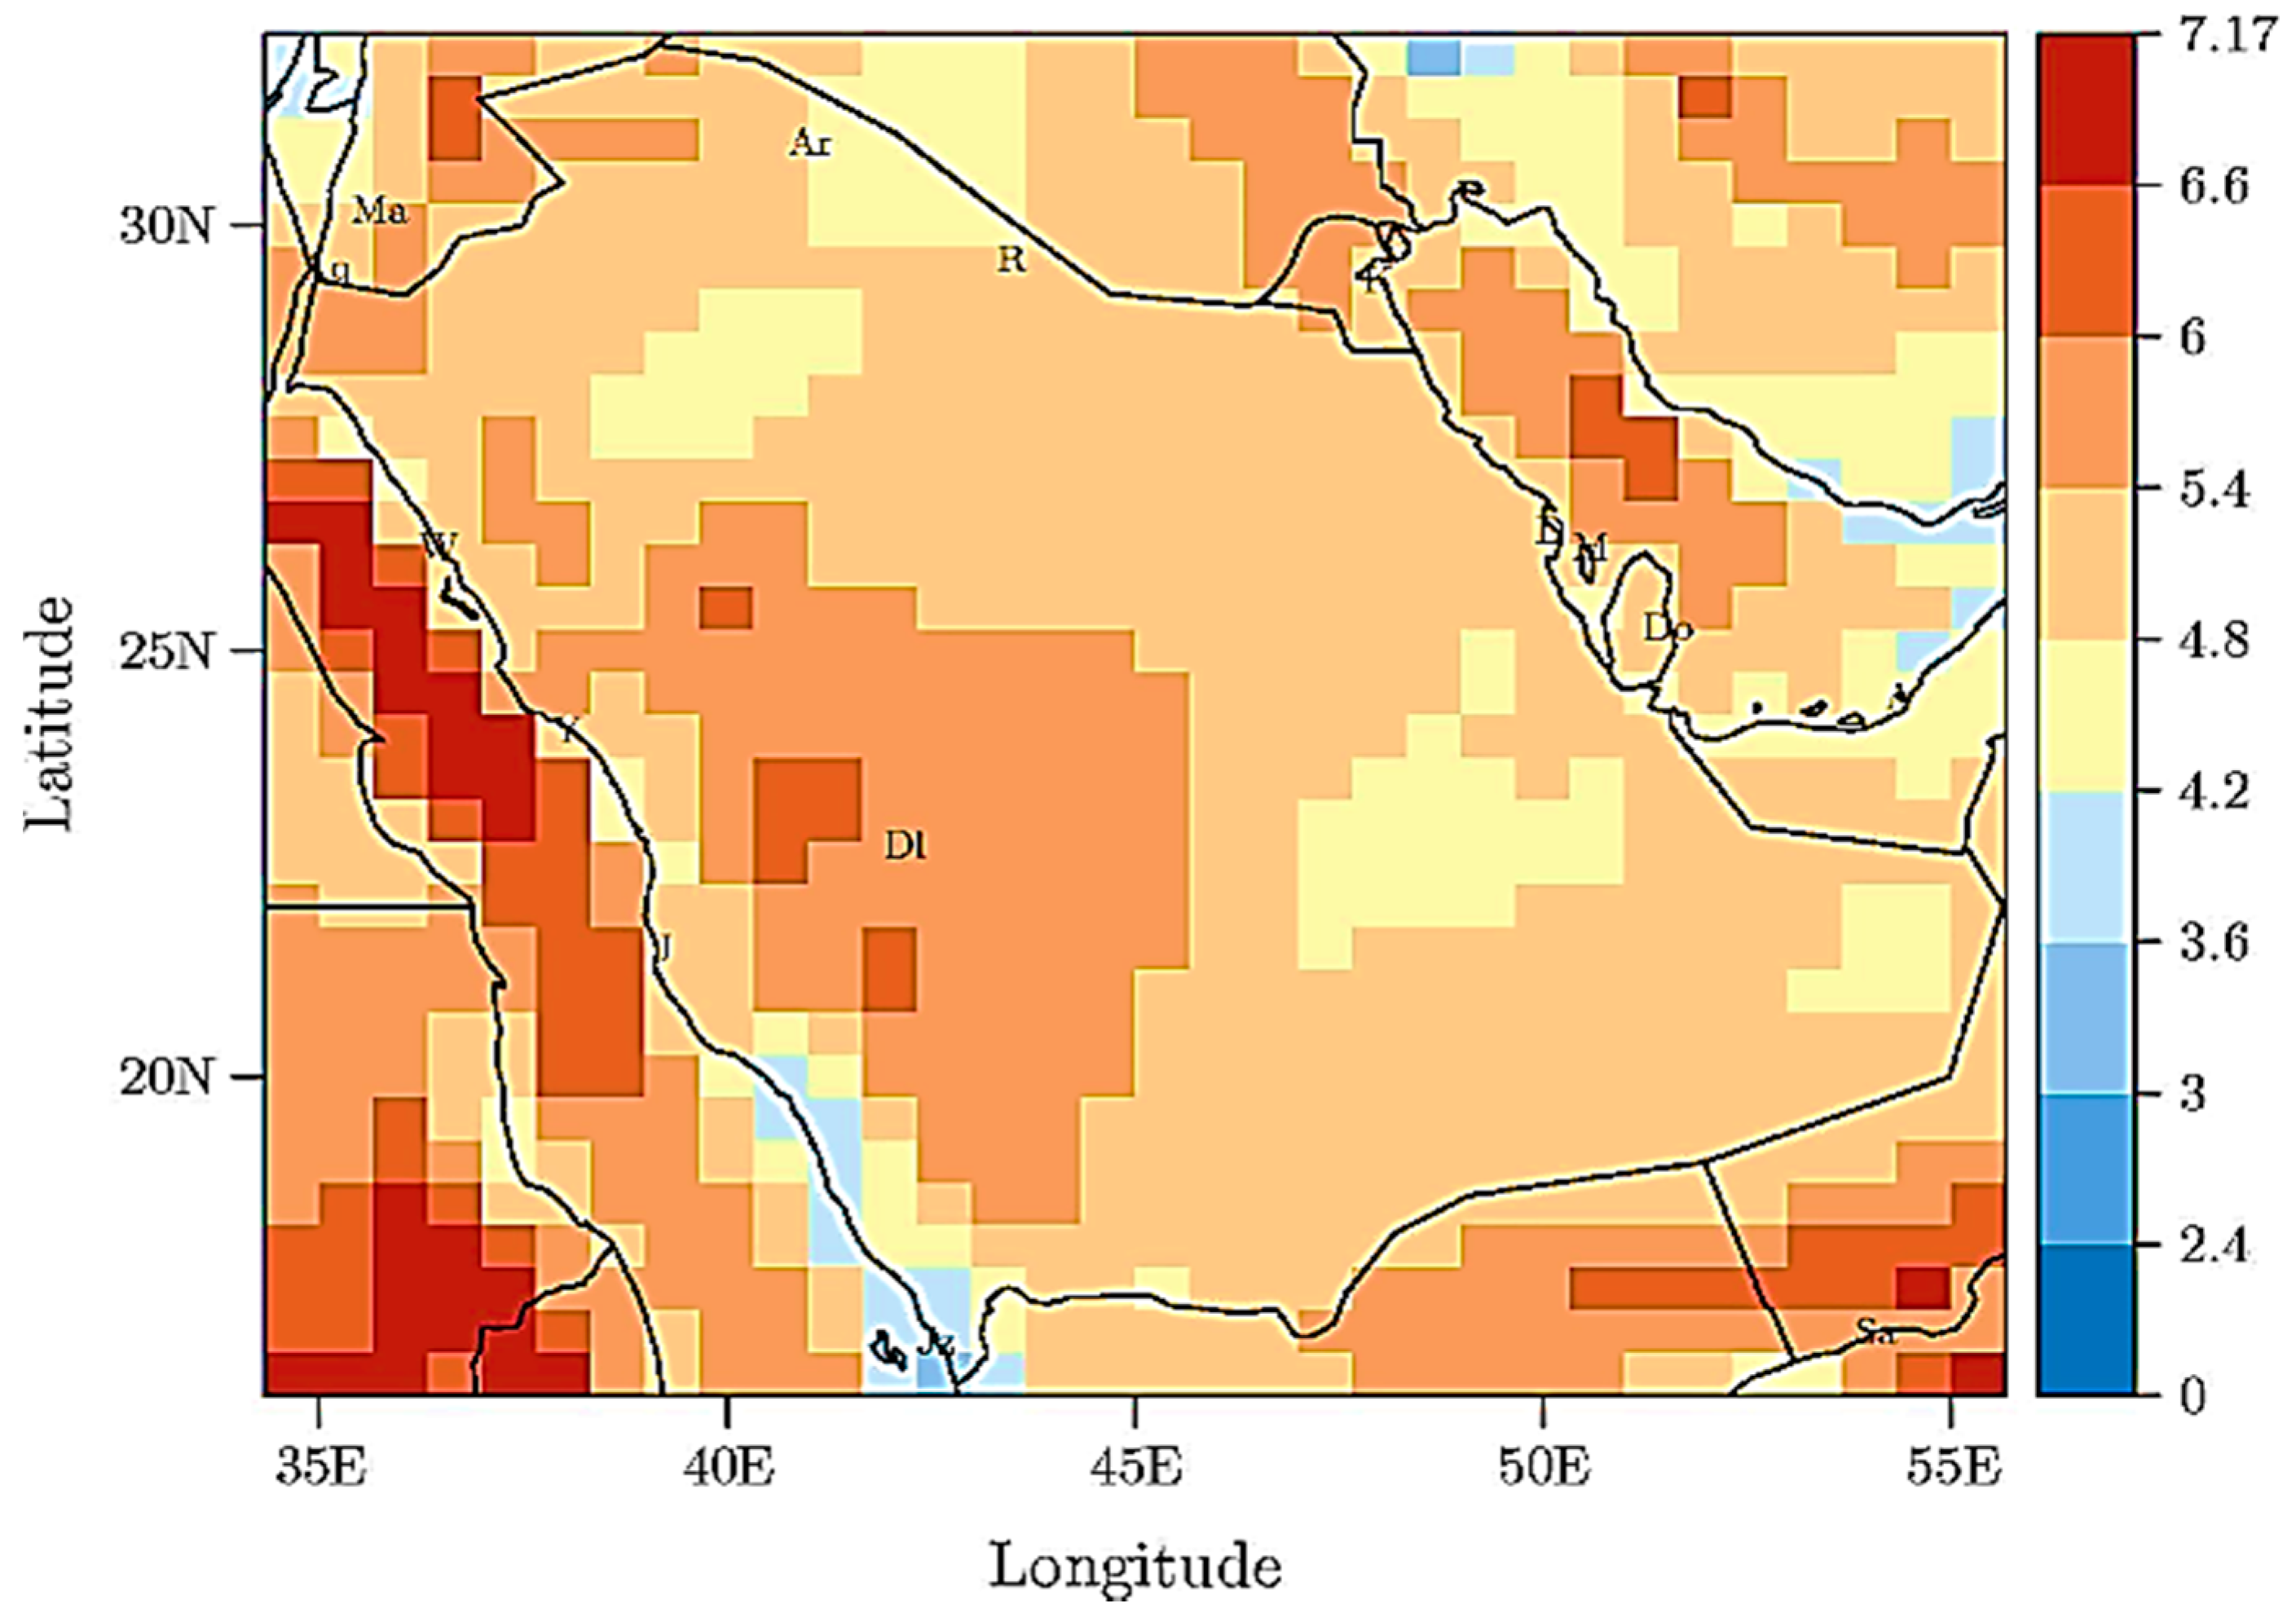
4.1. Solar Energy
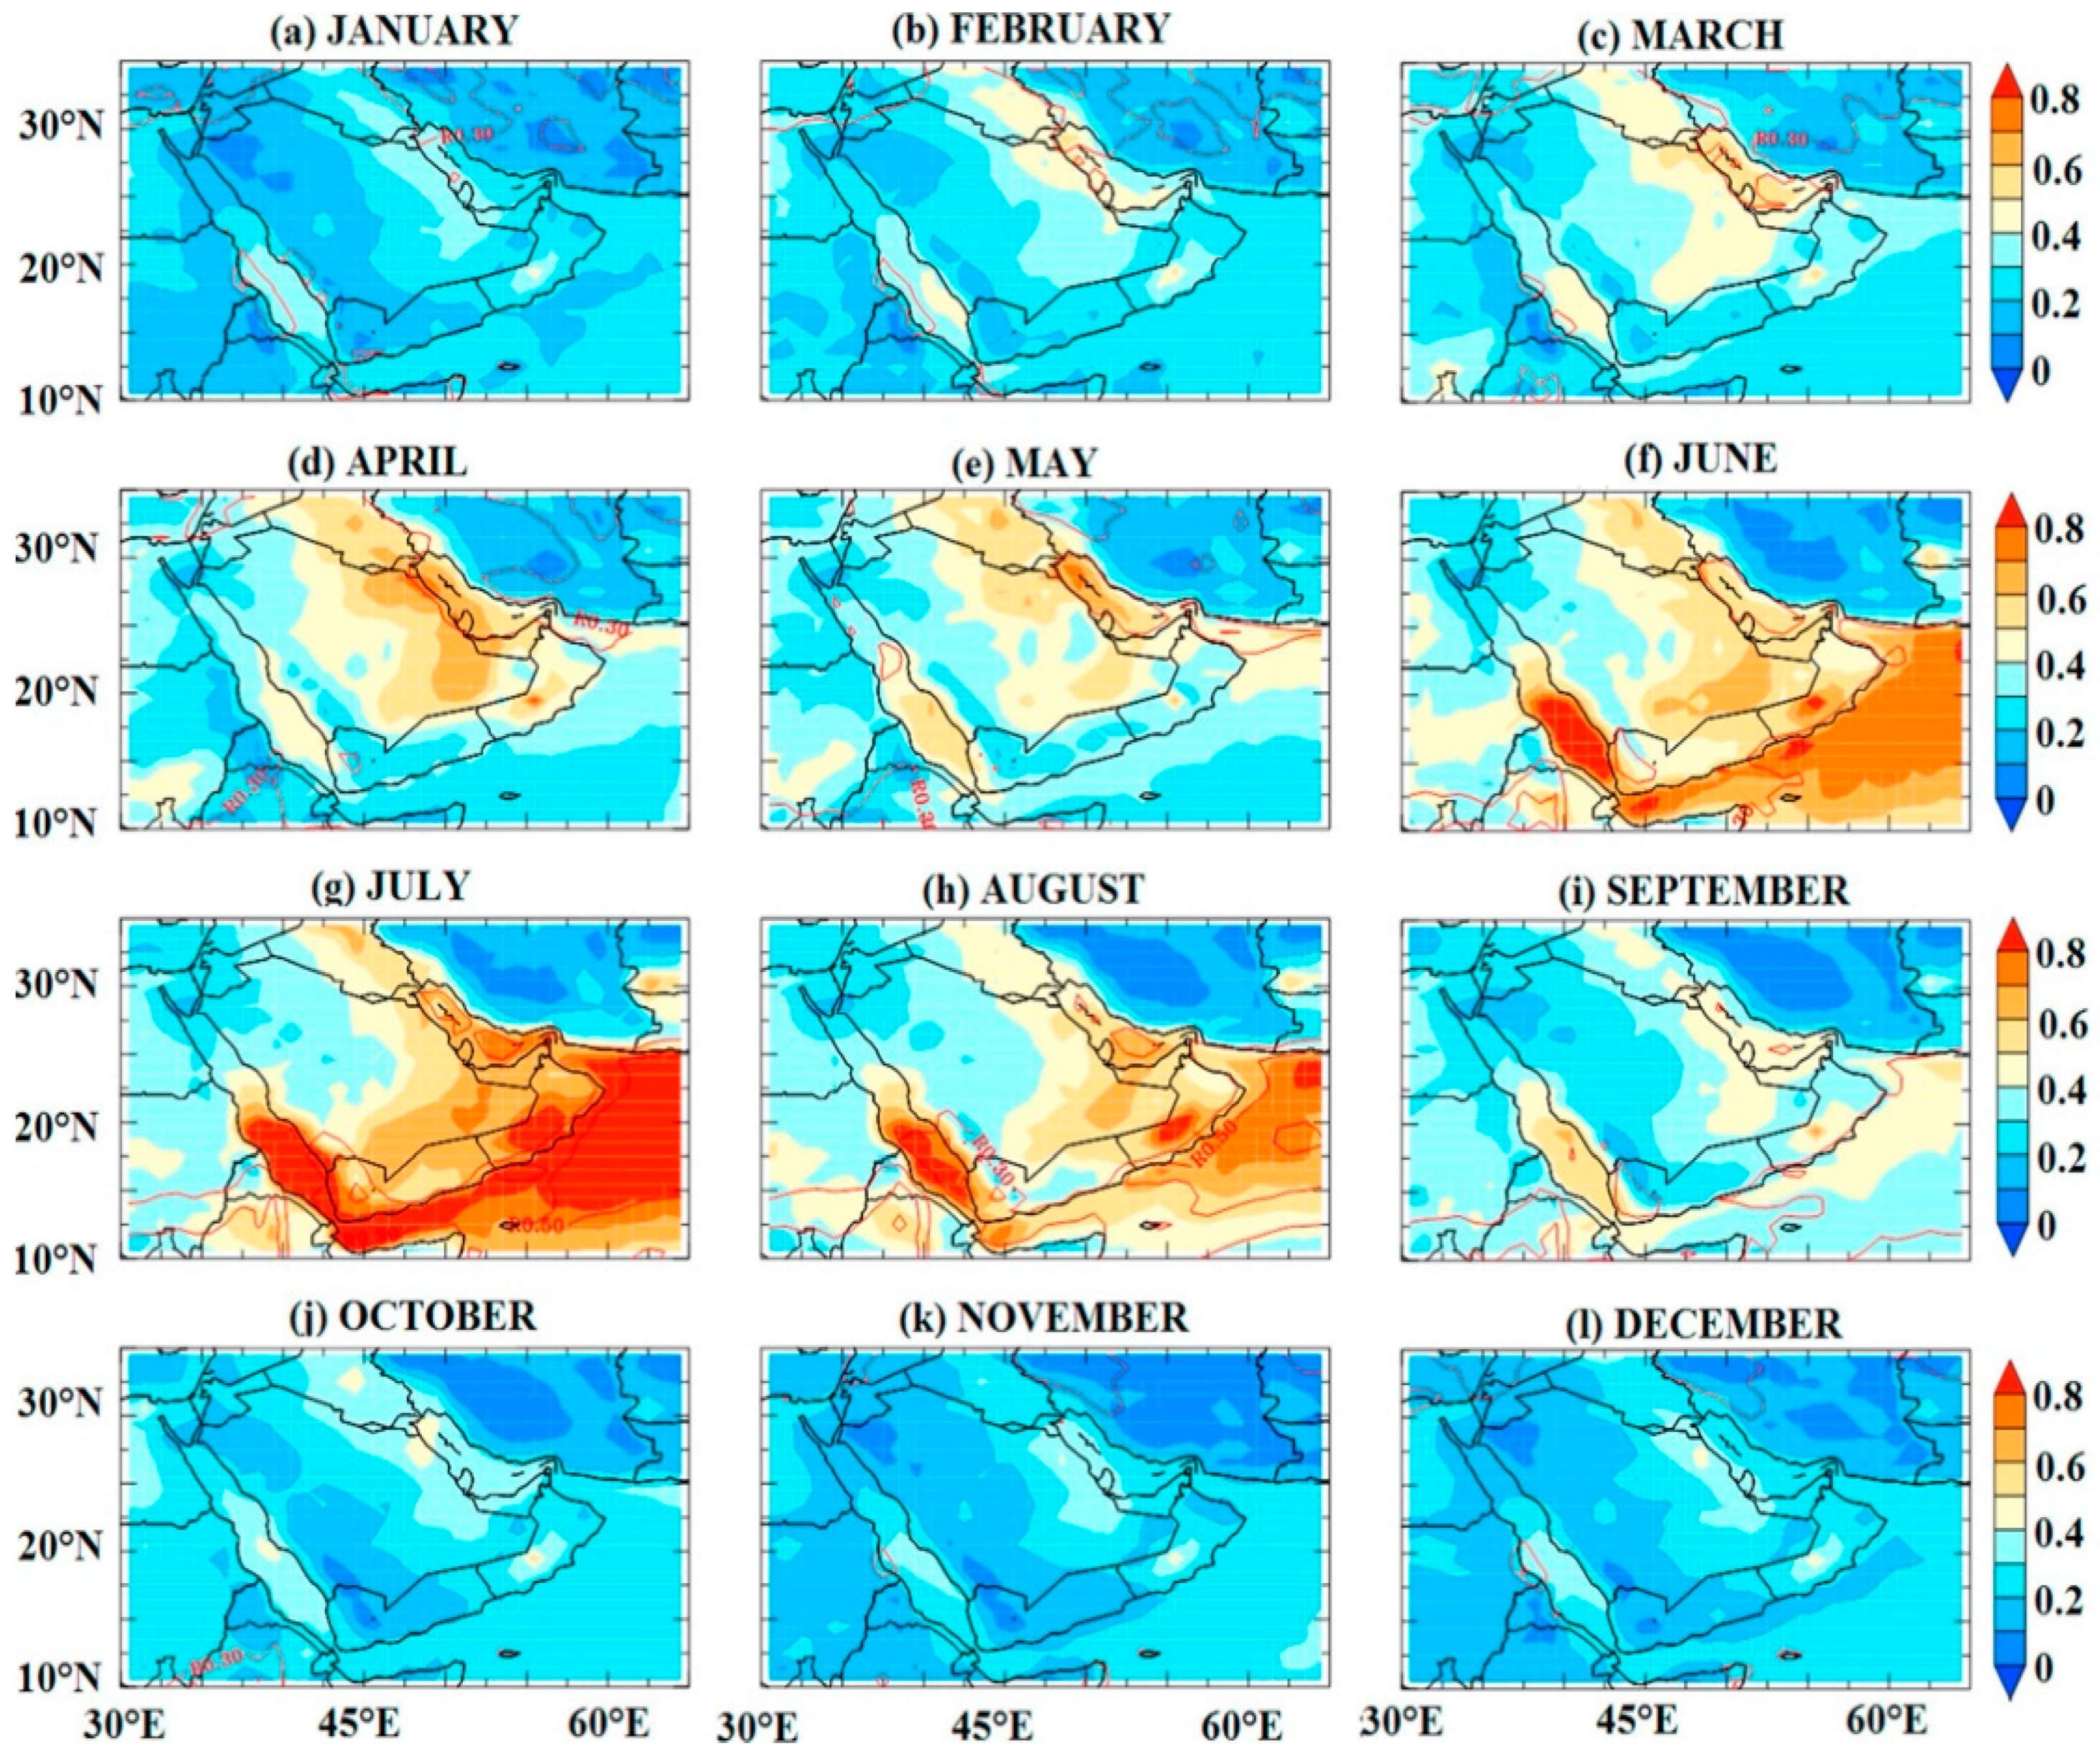
4.2. Effects of Dust and Clouds
| No | Location | Region/City | Annual Dust (tons km⁻2) | Reference |
|---|---|---|---|---|
| 1 | Saudi Arabia | Central Riyadh | 392 | [74] |
| Northeastern Riyadh | 454 | [75] | ||
| Najran * | 420 | This study | ||
| Sharurah * | 416 | This study | ||
| Wadi Al-Dawasir * | 382 | This study | ||
| Al-Baha * | 298 | This study | ||
| Hail * | 298 | This study | ||
| Jeddah * | 267 | This study | ||
| Yenbo * | 198 | This study | ||
| Tabuk * | 164 | This study | ||
| Turaif * | 271 | This study | ||
| Al Ahsa * | 355 | This study | ||
| Hafar Al Batin * | 397 | This study | ||
| Arar * | 279 | This study | ||
| 2 | Oman | Fahal coastal area | 89 | [76] |
| 3 | UAE | Coastal areas of UAE * | 256 | This study |
| 4 | Kuwait | Central (Kuwait City) | 216–339 | [77] |
| 5 | Qatar | Doha | 50–113 | [78,79] |
| 6 | Bahrain | Bahrain | 60–144 | [80] |
| 7 | Arabian Gulf | Northern parts of Arabian Gulf | 373 | [81] |
| 8 | Sahara Desert | western and southern Sahara Desert | 913–10,446 | [82,83] |
| 9 | Red Sea | Red Sea | 43.3 | [84] |
| 10 | Iraq | Baghdad | 220 | [85] |
| Um Qasr | 193 | [86] |
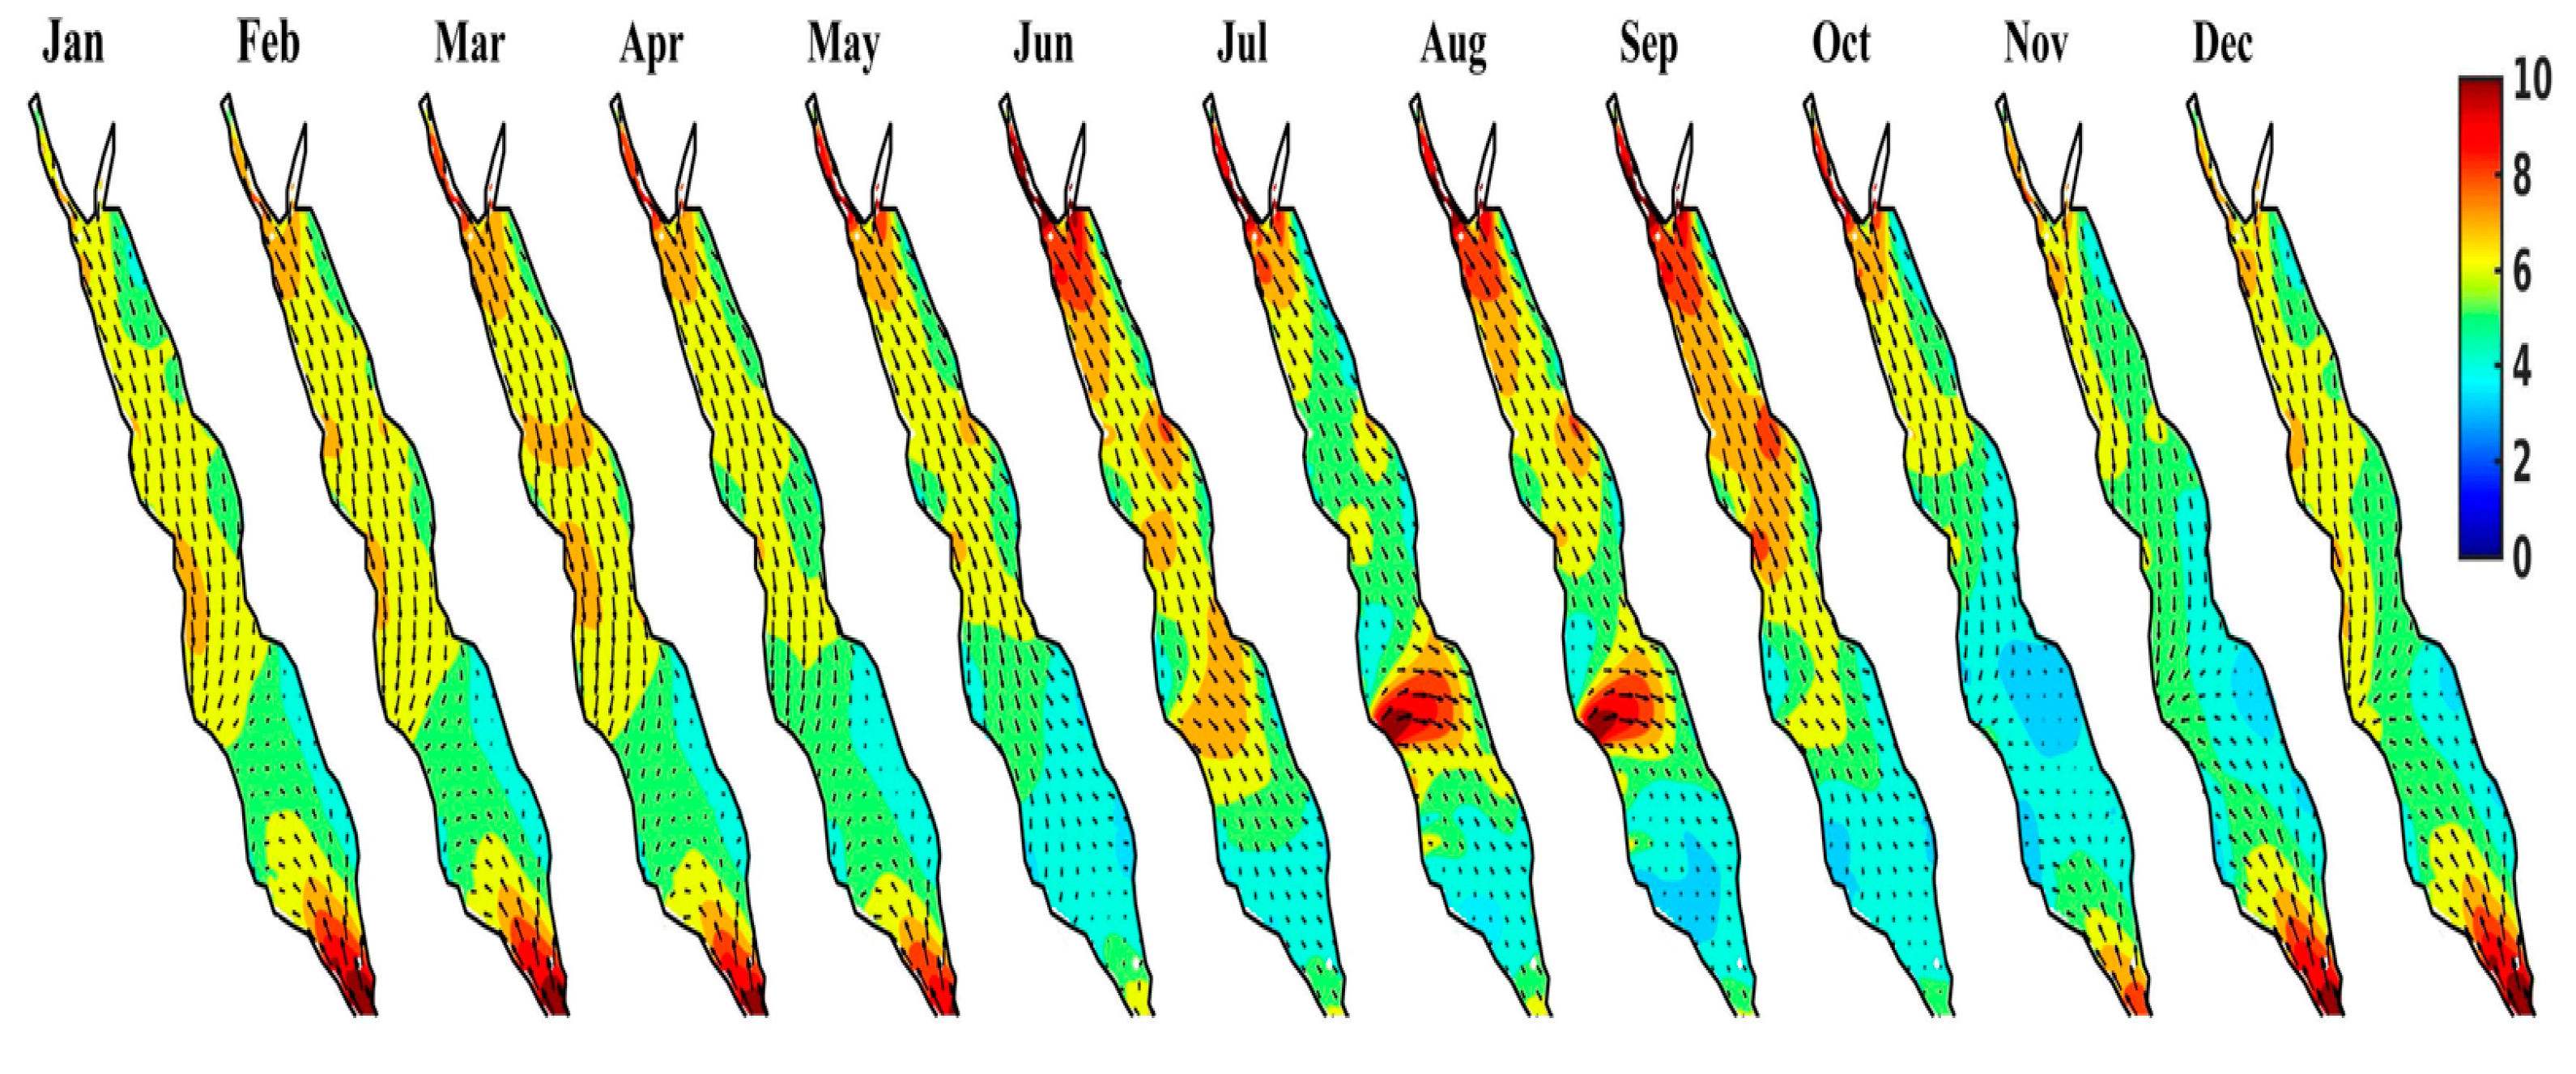
4.3. Wind Energy
5. Solar and Wind Power Generation
6. Climate Justice
7. Discussion
8. Conclusions
Author Contributions
Funding
Institutional Review Board Statement
Informed Consent Statement
Data Availability Statement
Acknowledgments
Conflicts of Interest
Nomenclature
| COVID-19 | Coronavirus-2019 |
| GCC | Gulf Cooperation Council |
| IPCC | International Panel on Climate Change |
| UNEP | United Nations Environment Program |
| UNFCCC | United Nations Framework Convention on Climate Change |
| IRENA | International Renewable Energy Agency |
| CAT | Climate Action Tracker |
| GDP | Gross Domestic Product |
| CO2 | Carbon Dioxide |
| AOD | Aerosol Optical Depth |
| GHI | Global Horizontal Irradiance |
| DHI | Direct Horizontal Irradiance |
| DNI | Direct Normal Irradiance |
| CSP | Concentrating solar power |
| PV | Photovoltaic |
| Gt | Gigaton |
| Mt | Million Tons |
| GW | Gigawatts |
| MW | Megawatts |
| GHG | Greenhouse Gas |
| °C | Celsius |
| A | Amount of Dust Fallout |
| W | Weight of Dust Fallout |
References
- Bauer, N.; Baumstark, L.; Leimbach, M. The REMIND-R model: The role of renewables in the low-carbon transformation—First-best vs. second-best worlds. Clim. Chang. 2011, 114, 145–168. [Google Scholar] [CrossRef]
- HM Government. The UK Low Carbon Transition Plan: National Strategy for Climate and Energy; Department of Energy and Climate Change: London, UK, 2009. [Google Scholar]
- Nyambuu, U.; Semmler, W. Climate change and the transition to a low carbon economy—Carbon targets and the carbon budget. Econ. Model. 2020, 84, 367–376. [Google Scholar] [CrossRef]
- Tollefson, J. The hard truths of climate change by the numbers. Nature 2019, 573, 324–327. [Google Scholar] [CrossRef] [PubMed]
- Each Country’s Share of CO2 Emissions. Available online: https://www.ucsusa.org/resources/each-countrys-share-co2-emissions (accessed on 3 March 2021).
- Climate Action Tracker: Global Emissions Time Series. Available online: https://climateactiontracker.org/global/cat-emissions-gaps/ (accessed on 1 March 2021).
- Jackson, R.B.; Le Quéré, C.; Andrew, R.M.; Canadell, J.G.; I Korsbakken, J.; Liu, Z.; Peters, G.P.; Zheng, B. Global energy growth is outpacing decarbonization. Environ. Res. Lett. 2018, 13, 120401. [Google Scholar] [CrossRef]
- Wogan, D.; Pradhan, S.; Albardi, S. GCC Energy System Overview; King Abdullah Petroleum Studies and Research Center (KAPSARC): Riyadh, Saudi Arabia, 2017; p. 36. [Google Scholar]
- Lilliestam, J.; Patt, A. Barriers, Risks and Policies for Renewables in the Gulf States. Energies 2015, 8, 8263–8285. [Google Scholar] [CrossRef]
- Asif, M. Growth and sustainability trends in the buildings sector in the GCC region with particular reference to the KSA and UAE. Renew. Sustain. Energy Rev. 2016, 55, 1267–1273. [Google Scholar] [CrossRef]
- Bekhet, H.A.; Matar, A.; Yasmin, T. CO2 emissions, energy consumption, economic growth, and financial development in GCC countries: Dynamic simultaneous equation models. Renew. Sustain. Energy Rev. 2017, 70, 117–132. [Google Scholar] [CrossRef]
- Qader, M.R. Electricity Consumption and GHG Emissions in GCC Countries. Energies 2009, 2, 1201–1213. [Google Scholar] [CrossRef]
- Griffiths, S. A review and assessment of energy policy in the Middle East and North Africa region. Energy Policy 2017, 102, 249–269. [Google Scholar] [CrossRef]
- Lim, X.Y.; Foo, D.C.; Tan, R.R. Pinch analysis for the planning of power generation sector in the United Arab Emirates: A climate-energy-water nexus study. J. Clean. Prod. 2018, 180, 11–19. [Google Scholar] [CrossRef]
- Ghaffour, N.; Bundschuh, J.; Mahmoudi, H.; Goosen, M.F. Renewable energy-driven desalination technologies: A comprehensive review on challenges and potential applications of integrated systems. Desalination 2015, 356, 94–114. [Google Scholar] [CrossRef]
- Shatat, M.; Worall, M.; Riffat, S. Opportunities for solar water desalination worldwide: Review. Sustain. Cities Soc. 2013, 9, 67–80. [Google Scholar] [CrossRef]
- Al-Maamary, H.M.; Kazem, H.A.; Chaichan, M.T. The impact of oil price fluctuations on common renewable energies in GCC countries. Renew. Sustain. Energy Rev. 2017, 75, 989–1007. [Google Scholar] [CrossRef]
- Abdmouleh, Z.; Alammari, R.A.; Gastli, A. Recommendations on renewable energy policies for the GCC countries. Renew. Sustain. Energy Rev. 2015, 50, 1181–1191. [Google Scholar] [CrossRef]
- Atalay, Y.; Biermann, F.; Kalfagianni, A. Adoption of renewable energy technologies in oil-rich countries: Explaining policy variation in the Gulf Cooperation Council states. Renew. Energy 2016, 85, 206–214. [Google Scholar] [CrossRef]
- Bhutto, A.W.; Bazmi, A.A.; Zahedi, G.; Klemeš, J.J. A review of progress in renewable energy implementation in the Gulf Cooperation Council countries. J. Clean. Prod. 2014, 71, 168–180. [Google Scholar] [CrossRef]
- Al-Amir, J.; Abu-Hijleh, B. Strategies and policies from promoting the use of renewable energy resource in the UAE. Renew. Sustain. Energy Rev. 2013, 26, 660–667. [Google Scholar] [CrossRef]
- Mezher, T.; Dawelbait, G.; Abbas, Z. Renewable energy policy options for Abu Dhabi: Drivers and barriers. Energy Policy 2012, 42, 315–328. [Google Scholar] [CrossRef]
- Blazquez, J.; Hunt, L.C.; Manzano, B. Oil Subsidies and Renewable Energy in Saudi Arabia: A General Equilibrium Approach. Energy J. 2017, 38, 38. [Google Scholar] [CrossRef]
- Griffiths, S. Renewable energy policy trends and recommendations for GCC countries. Energy Transit. 2017, 1, 3. [Google Scholar] [CrossRef]
- International Renewable Energy Agency. Renewable Energy Market. Analysis: GCC; IRENA: Abu Dhabi, United Arab Emerites, 2019; ISBN 978-92-9260-096-9. [Google Scholar]
- Malik, K.; Rahman, S.M.; Khondaker, A.N.; Abubakar, I.R.; Aina, Y.A.; Hasan, M.A. Renewable energy utilization to promote sustainability in GCC countries: Policies, drivers, and barriers. Environ. Sci. Pollut. Res. 2019, 26, 20798–20814. [Google Scholar] [CrossRef]
- Patlitzianas, K.D.; Doukas, H.; Psarras, J. Enhancing renewable energy in the Arab States of the Gulf: Constraints & efforts. Energy Policy 2006, 34, 3719–3726. [Google Scholar] [CrossRef]
- Fattouh, B.; El-Katiri, L. Energy and Arab Economic Development; United Nations Development Programme: New York, NY, USA, 2012. [Google Scholar]
- Secretariat General of the Gulf Cooperation Council. The Cooperation Council for the Arab States of the Gulf. Available online: http://www.gcc-sg.org/en-us/CooperationAndAchievements/Pages/Home.aspx (accessed on 29 June 2019).
- Al-Maamary, H.M.S.; Kazem, H.A.; Chaichan, M.T. Changing the energy profile of the GCC States: A review. Int. J. Appl. Eng. Res. 2016, 11, 1980–1988. [Google Scholar]
- Alsharhan, A.; Rizk, Z.; Nairn, A.; Bakhit, D.; Alhajari, S. Hydrogeology of an Arid Region: The Arabian Gulf and Adjoining Areas; Elsevier: Amsterdam, The Netherlands, 2001. [Google Scholar]
- Riad, M. Geopolitics and politics in the Arab Gulf States (GCC). GeoJournal 1986, 13, 201–210. [Google Scholar] [CrossRef]
- Madaeni, S.H.; Sioshansi, R.; Denholm, P. How Thermal Energy Storage Enhances the Economic Viability of Concentrating Solar Power. Proc. IEEE 2012, 100, 335–347. [Google Scholar] [CrossRef]
- Hepbasli, A.; Alsuhaibani, Z. A key review on present status and future directions of solar energy studies and applications in Saudi Arabia. Renew. Sustain. Energy Rev. 2011, 15, 5021–5050. [Google Scholar] [CrossRef]
- Tian, Y.; Zhao, C. A review of solar collectors and thermal energy storage in solar thermal applications. Appl. Energy 2013, 104, 538–553. [Google Scholar] [CrossRef]
- Li, W.; Wei, P.; Zhou, X. A cost-benefit analysis of power generation from commercial reinforced concrete solar chimney power plant. Energy Convers. Manag. 2014, 79, 104–113. [Google Scholar] [CrossRef]
- Zhao, X.; Zeng, Y.; Zhao, D. Distributed solar photovoltaics in China: Policies and economic performance. Energy 2015, 88, 572–583. [Google Scholar] [CrossRef]
- Sermyagina, E.; Saari, J.; Kaikko, J.; Vakkilainen, E. Integration of torrefaction and CHP plant: Operational and economic analysis. Appl. Energy 2016, 183, 88–99. [Google Scholar] [CrossRef]
- Guo, P.; Zhai, Y.; Xu, X.; Li, J. Assessment of levelized cost of electricity for a 10-MW solar chimney power plant in Yinchuan China. Energy Convers. Manag. 2017, 152, 176–185. [Google Scholar] [CrossRef]
- Du, E.; Zhang, N.; Hodge, B.-M.; Kang, C.; Kroposki, B.; Xia, Q. Economic justification of concentrating solar power in high renewable energy penetrated power systems. Appl. Energy 2018, 222, 649–661. [Google Scholar] [CrossRef]
- Pazheri, F.R. Solar power potential in Saudi Arabia. Int. J. Eng. Res. Appl. 2014, 4, 171–174. [Google Scholar]
- Almasoud, A.; Gandayh, H.M. Future of solar energy in Saudi Arabia. J. King Saud Univ. Eng. Sci. 2015, 27, 153–157. [Google Scholar] [CrossRef]
- Singh, T.; Hussien, M.A.A.; Al-Ansari, T.; Saoud, K.; McKay, G. Critical review of solar thermal resources in GCC and application of nanofluids for development of efficient and cost effective CSP technologies. Renew. Sustain. Energy Rev. 2018, 91, 708–719. [Google Scholar] [CrossRef]
- Meltzer, J.; Hultman, N.E.; Langley, C. Low-Carbon Energy Transitions in Qatar and the Gulf Cooperation Council Region. SSRN Electron. J. 2014. [Google Scholar] [CrossRef]
- Prăvălie, R.; Patriche, C.; Bandoc, G. Spatial assessment of solar energy potential at global scale. A geographical approach. J. Clean. Prod. 2019, 209, 692–721. [Google Scholar] [CrossRef]
- Doukas, H.; Patlitzianas, K.D.; Kagiannas, A.G.; Psarras, J. Renewable energy sources and rationale use of energy development in the countries of GCC: Myth or reality? Renew. Energy 2006, 31, 755–770. [Google Scholar] [CrossRef]
- Al-Badi, A.; Malik, A.; Gastli, A. Sustainable energy usage in Oman—Opportunities and barriers. Renew. Sustain. Energy Rev. 2011, 15, 3780–3788. [Google Scholar] [CrossRef]
- Alnaser, W.E.; Alnaser, N.W. The impact of the rise of using solar energy in GCC countries. Renew. Energy Environ. Sustain. 2019, 4, 7. [Google Scholar] [CrossRef]
- Mokri, A.; Ali, M.A.; Emziane, M. Solar energy in the United Arab Emirates: A review. Renew. Sustain. Energy Rev. 2013, 28, 340–375. [Google Scholar] [CrossRef]
- Assi, A.; Jama, M.; Al-Shamisi, M. Prediction of Global Solar Radiation in Abu Dhabi. ISRN Renew. Energy 2012, 2012, 1–10. [Google Scholar] [CrossRef]
- Salam, M.A.; Khan, S.A. Transition towards sustainable energy production—A review of the progress for solar energy in Saudi Arabia. Energy Explor. Exploit. 2017, 36, 3–27. [Google Scholar] [CrossRef]
- Alyahya, S.; Irfan, M.A. Analysis from the new solar radiation Atlas for Saudi Arabia. Sol. Energy 2016, 130, 116–127. [Google Scholar] [CrossRef]
- Alnaser, W.; Alnaser, N. The status of renewable energy in the GCC countries. Renew. Sustain. Energy Rev. 2011, 15, 3074–3098. [Google Scholar] [CrossRef]
- Bachour, D.; Perez-Astudillo, D. Ground-measurement GHI Map for Qatar. Energy Procedia 2014, 49, 2297–2302. [Google Scholar] [CrossRef][Green Version]
- Dasari, H.P.; Desamsetti, S.; Langodan, S.; Attada, R.; Kunchala, R.K.; Viswanadhapalli, Y.; Knio, O.; Hoteit, I. High-resolution assessment of solar energy resources over the Arabian Peninsula. Appl. Energy 2019, 248, 354–371. [Google Scholar] [CrossRef]
- Vignola, F.; Michalsky, J.; Stoffel, T. Solar and Infrared Radiation Measurements; CRC Press: Boca Raton, FL, USA, 2016. [Google Scholar]
- Mas’Ud, A.A.; Wirba, A.V.; Alshammari, S.J.; Muhammad-Sukki, F.; Abdullahi, M.M.; Albarracín, R.; Hoq, M.Z. Solar Energy Potentials and Benefits in the Gulf Cooperation Council Countries: A Review of Substantial Issues. Energies 2018, 11, 372. [Google Scholar] [CrossRef]
- Zell, E.; Gasim, S.; Wilcox, S.; Katamoura, S.; Stoffel, T.; Shibli, H.; Engel-Cox, J.; Al Subie, M. Assessment of solar radiation resources in Saudi Arabia. Sol. Energy 2015, 119, 422–438. [Google Scholar] [CrossRef]
- Jimenez, P.A.; Hacker, J.P.; Dudhia, J.; Haupt, S.E.; Ruiz-Arias, J.A.; Gueymard, C.A.; Thompson, G.; Eidhammer, T.; Deng, A. WRF-Solar: Description and Clear-Sky Assessment of an Augmented NWP Model for Solar Power Prediction. Bull. Am. Meteorol. Soc. 2016, 97, 1249–1264. [Google Scholar] [CrossRef]
- Haupt, S.E.; Kosović, B.; Jensen, T.; Lazo, J.K.; Lee, J.A.; Jiménez, P.A.; Cowie, J.; Wiener, G.; McCandless, T.C.; Rogers, M.; et al. Building the Sun4Cast System: Improvements in Solar Power Forecasting. Bull. Am. Meteorol. Soc. 2018, 99, 121–136. [Google Scholar] [CrossRef]
- Prasad, A.A.; Taylor, R.A.; Kay, M. Assessment of direct normal irradiance and cloud connections using satellite data over Australia. Appl. Energy 2015, 143, 301–311. [Google Scholar] [CrossRef]
- Crespi, F.; Toscani, A.; Zani, P.; Sánchez, D.; Manzolini, G. Effect of passing clouds on the dynamic performance of a CSP tower receiver with molten salt heat storage. Appl. Energy 2018, 229, 224–235. [Google Scholar] [CrossRef]
- Middleton, N. Dust storms in the Middle East. J. Arid. Environ. 1986, 10, 83–96. [Google Scholar] [CrossRef]
- Prospero, J.M.; Ginoux, P.; Torres, O.; Nicholson, S.E.; Gill, T.E. Environmental characterization of global sources of atmospheric soil dust identified with the NIMBUS 7 Total Ozone Mapping Spectrometer (TOMS) absorbing aerosol product. Rev. Geophys. 2002, 40, 2-1–2-31. [Google Scholar] [CrossRef]
- Tindale, N.; Pease, P. Aerosols over the Arabian Sea: Atmospheric transport pathways and concentrations of dust and sea salt. Deep. Sea Res. Part. II Top. Stud. Oceanogr. 1999, 46, 1577–1595. [Google Scholar] [CrossRef]
- Chen, W.-D.; Cui, F.; Zhou, H.; Ding, H.; Li, D.-X. Impacts of different radiation schemes on the prediction of solar radiation and photovoltaic power. Atmos. Ocean. Sci. Lett. 2017, 10, 446–451. [Google Scholar] [CrossRef]
- Awad, A.; Mashat, A.-W. The Synoptic Patterns Associated with Spring Widespread Dusty Days in Central and Eastern Saudi Arabia. Atmosphere 2014, 5, 889–913. [Google Scholar] [CrossRef]
- Awad, A.M.; Mashat, A.-W.S. Synoptic features associated with dust transition processes from North Africa to Asia. Arab. J. Geosci. 2013, 7, 2451–2467. [Google Scholar] [CrossRef]
- Notaro, M.; Alkolibi, F.; Fadda, E.; Bakhrjy, F. Trajectory analysis of Saudi Arabian dust storms. J. Geophys. Res. Atmos. 2013, 118, 6028–6043. [Google Scholar] [CrossRef]
- Mashat, A.; Awad, A.M. The classification of the dusty areas over the Middle-East. Bull. Fac. Sci. Cairo Univ. 2010, 78, 1–19. [Google Scholar]
- Attada, R.; Dasari, H.P.; Parekh, A.; Chowdary, J.S.; Langodan, S.; Knio, O.; Hoteit, I. The role of the Indian Summer Monsoon variability on Arabian Peninsula summer climate. Clim. Dyn. 2019, 52, 3389–3404. [Google Scholar] [CrossRef]
- Attada, R.; Yadav, R.K.; Kunchala, R.K.; Dasari, H.P.; Knio, O.; Hoteit, I. Prominent mode of summer surface air temperature variability and associated circulation anomalies over the Arabian Peninsula. Atmos. Sci. Lett. 2018, 19, e860. [Google Scholar] [CrossRef]
- Kumar, K.R.; Attada, R.; Dasari, H.P.; Vellore, R.K.; Langodan, S.; Abualnaja, Y.O.; Hoteit, I.; Langdon, S. Aerosol Optical Depth variability over the Arabian Peninsula as inferred from satellite measurements. Atmos. Environ. 2018, 187, 346–357. [Google Scholar] [CrossRef]
- Al-Tayeb, N.T.; Jarrar, B.M. Dust fall in the city of Riyadh. In Proceedings of the Industrial Air Pollution Symposium, Riyadh, Saudi Arabia, 15–17 November 1993; pp. 66–74. [Google Scholar]
- Modaihsh, A.; Ghoneim, A.; Al-Barakah, F.; Mahjoub, M.; Nadeem, M. Characterizations of Deposited Dust Fallout in Riyadh City, Saudi Arabia. Pol. J. Environ. Stud. 2017, 26, 1599–1605. [Google Scholar] [CrossRef]
- Badawy, M.; Hernandez, M.; Al-Harthy, F. Sources of pollution at Mina al Fahal Coastal area. Bull. Environ. Contam. Toxicol. 1992, 49, 813–820. [Google Scholar] [CrossRef]
- Al-Dousari, A.; Al-Nassar, W.; Al-Hemoud, A.; Alsaleh, A.; Ramadan, A.; Al-Dousari, N.; Ahmed, M. Solar and wind energy: Challenges and solutions in desert regions. Energy 2019, 176, 184–194. [Google Scholar] [CrossRef]
- Al-Thani, H.; Koc, M.; Isaifan, R.J. Investigations on Deposited Dust Fallout in Urban Doha: Characterization, Source Apportionment and Mitigation. Environ. Ecol. Res. 2018, 6, 493–506. [Google Scholar] [CrossRef][Green Version]
- Javed, W.; Wubulikasimu, Y.; Figgis, B.; Guo, B. Characterization of dust accumulated on photovoltaic panels in Doha, Qatar. Sol. Energy 2017, 142, 123–135. [Google Scholar] [CrossRef]
- Alnaser, N.W.; Dakhel, A.A.; Al Othman, M.J.; Batarseh, I.; Lee, J.K.; Najmaii, S.; Alnaser, W.E. Dust accumulation study on the Bapco 0.5 MWp PV project at University of Bahrain. Int. J. Power Renew. Energy Syst. 2015, 2, 53. [Google Scholar]
- Al-Dousari, A.; Doronzo, D.; Ahmed, M. Types, Indications and Impact Evaluation of Sand and Dust Storms Trajectories in the Arabian Gulf. Sustainability 2017, 9, 1526. [Google Scholar] [CrossRef]
- Yassin, M.F.; Almutairi, S.K.; Al-Hemoud, A. Dust storms backward Trajectories’ and source identification over Kuwait. Atmos. Res. 2018, 212, 158–171. [Google Scholar] [CrossRef]
- Al-Hemoud, A.; Al-Dousari, A.; Al-Dashti, H.; Petrov, P.; Al-Saleh, A.; Al-Khafaji, S.; Behbehani, W.; Li, J.; Koutrakis, P. Sand and dust storm trajectories from Iraq Mesopotamian flood plain to Kuwait. Sci. Total Environ. 2020, 710, 136291. [Google Scholar] [CrossRef]
- Kalenderski, S.; Stenchikov, G.L.; Zhao, C. Modeling a typical winter-time dust event over the Arabian Peninsula and the Red Sea. Atmos. Chem. Phys. Discuss. 2013, 13, 1999–2014. [Google Scholar] [CrossRef]
- Al-Dabbas, M.A.; Abbas, M.A.; Al-Khafaji, R.M. Dust storms loads analyses—Iraq. Arab. J. Geosci. 2012, 5, 121–131. [Google Scholar] [CrossRef]
- Gharib, I.; Al-Hashash, M.; Anwar, M. Dust Fallout in Northern Part. Of the ROPME Sea Area; Report No. KISR-2266; Kuwait Institute for Scientific Research: Kuwait City, Kuwait, 1987. [Google Scholar]
- Yip, C.M.A.; Gunturu, U.B.; Stenchikov, G.L. Wind resource characterization in the Arabian Peninsula. Appl. Energy 2016, 164, 826–836. [Google Scholar] [CrossRef]
- Marafia, A.-H.; Ashour, H.A. Economics of off-shore/on-shore wind energy systems in Qatar. Renew. Energy 2003, 28, 1953–1963. [Google Scholar] [CrossRef]
- Almutairi, B.L. Investigating the Feasibility and Soil-Structure Integrity of Onshore Wind Turbine Systems in Kuwait. Ph.D. Thesis, Loughborough University, Loughborough, UK, 2017. [Google Scholar]
- Al Bahrana, N.; Al Mahdi, N. Feasibility of wind energy applications in Bahrain. Renew. Energy 1991, 1, 831–836. [Google Scholar] [CrossRef]
- Janajreh, I.; Su, L.; Alan, F. Wind energy assessment: Masdar City case study. Renew. Energy 2013, 52, 8–15. [Google Scholar] [CrossRef]
- Nader, S. Paths to a low-carbon economy—The Masdar example. Energy Procedia 2009, 1, 3951–3958. [Google Scholar] [CrossRef]
- Rehman, S.; Ahmad, A. Assessment of wind energy potential for coastal locations of the Kingdom of Saudi Arabia. Energy 2004, 29, 1105–1115. [Google Scholar] [CrossRef]
- Rehman, S.; El-Amin, I.; Ahmad, F.; Shaahid, S.; Al-Shehri, A.; Bakhashwain, J. Wind power resource assessment for Rafha, Saudi Arabia. Renew. Sustain. Energy Rev. 2007, 11, 937–950. [Google Scholar] [CrossRef]
- Baseer, M.; Meyer, J.; Rehman, S.; Alam, M. Wind power characteristics of seven data collection sites in Jubail, Saudi Arabia using Weibull parameters. Renew. Energy 2017, 102, 35–49. [Google Scholar] [CrossRef]
- Al-Nassar, W.; Neelamani, S.; Al-Salem, K.; Al-Dashti, H. Feasibility of offshore wind energy as an alternative source for the state of Kuwait. Energy 2019, 169, 783–796. [Google Scholar] [CrossRef]
- Al-Salem, K.; Neelamani, S.; Al-Nassar, W. Wind energy map of Arabian Gulf. Nat. Resour. 2018, 9, 212–228. [Google Scholar] [CrossRef]
- Rehman, S.; Halawani, T.; Mohandes, M. Wind power cost assessment at twenty locations in the kingdom of Saudi Arabia. Renew. Energy 2003, 28, 573–583. [Google Scholar] [CrossRef]
- Langodan, S.; Viswanadhapalli, Y.; Dasari, H.P.; Knio, O.; Hoteit, I. A high-resolution assessment of wind and wave energy potentials in the Red Sea. Appl. Energy 2016, 181, 244–255. [Google Scholar] [CrossRef]
- Jiang, H.; Farrar, J.T.; Beardsley, R.C.; Chen, R.; Chen, C. Zonal surface wind jets across the Red Sea due to mountain gap forcing along both sides of the Red Sea. Geophys. Res. Lett. 2009, 36, 36. [Google Scholar] [CrossRef]
- Dasari, H.P.; Langodan, S.; Viswanadhapalli, Y.; Vadlamudi, B.R.; Papadopoulos, V.P.; Hoteit, I. ENSO influence on the interannual variability of the Red Sea convergence zone and associated rainfall. Int. J. Clim. 2017, 38, 761–775. [Google Scholar] [CrossRef]
- Langodan, S.; Cavaleri, L.; Viswanadhapalli, Y.; Hoteit, I. Wind-wave source functions in opposing seas. J. Geophys. Res. Oceans 2015, 120, 6751–6768. [Google Scholar] [CrossRef]
- Menezes, V.V.; Farrar, J.T.; Bower, A.S. Westward mountain-gap wind jets of the northern Red Sea as seen by QuikSCAT. Remote Sens. Environ. 2018, 209, 677–699. [Google Scholar] [CrossRef]
- Zhai, P.; Bower, A. The response of the Red Sea to a strong wind jet near the Tokar Gap in summer. J. Geophys. Res. Oceans 2013, 118, 421–434. [Google Scholar] [CrossRef]
- Nematollahi, O.; Hoghooghi, H.; Rasti, M.; Sedaghat, A. Energy demands and renewable energy resources in the Middle East. Renew. Sustain. Energy Rev. 2016, 54, 1172–1181. [Google Scholar] [CrossRef]
- Munawwar, S.; Ghedira, H. A review of Renewable Energy and Solar Industry Growth in the GCC Region. Energy Procedia 2014, 57, 3191–3202. [Google Scholar] [CrossRef]
- Ouarda, T.; Charron, C.; Shin, J.-Y.; Marpu, P.; Al-Mandoos, A.; Al-Tamimi, M.; Ghedira, H.; Al Hosary, T. Probability distributions of wind speed in the UAE. Energy Convers. Manag. 2015, 93, 414–434. [Google Scholar] [CrossRef]
- Gastli, A.; Charabi, D.Y.; Al-Yahyai, M.S. Assessment of Wind Energy Potential Locations in Oman using Data from Existing Weather Stations. Renew. Sustain. Energy Rev. 2010, 14. [Google Scholar] [CrossRef]
- Shawon, M.J.; El Chaar, L.; Lamont, L.A. The GCC: Wind technology deployment potential. In Proceedings of the 2011 IEEE GCC Conference and Exhibition (GCC), Dubai, United Arab Emerites, 19–22 February 2011; pp. 174–177. [Google Scholar]
- Elrahmani, A.; Hannun, J.; Eljack, F.; Kazi, M.-K. Status of renewable energy in the GCC region and future opportunities. Curr. Opin. Chem. Eng. 2021, 31, 100664. [Google Scholar] [CrossRef]
- Sultan, N. The challenge of shale to the post-oil dreams of the Arab Gulf. Energy Policy 2013, 60, 13–20. [Google Scholar] [CrossRef]
- Praveen, R.; Keloth, V.; Abo-Khalil, A.G.; Alghamdi, A.S.; Eltamaly, A.M.; Tlili, I. An insight to the energy policy of GCC countries to meet renewable energy targets of 2030. Energy Policy 2020, 147, 111864. [Google Scholar] [CrossRef]
- Alharbi, F.R.; Csala, D. GCC Countries’ Renewable Energy Penetration and the Progress of Their Energy Sector Projects. IEEE Access 2020, 8, 211986–212002. [Google Scholar] [CrossRef]
- International Renewable Energy Agency. Renewable Capacity Statistics; IRENA: Abu Dhabi, United Arab Emerites, 2020; ISBN 978-92-9260-239-0. [Google Scholar]
- Adger, W.N. Scales of governance and environmental justice for adaptation and mitigation of climate change. J. Int. Dev. 2001, 13, 921–931. [Google Scholar] [CrossRef]
- Schlosberg, D. Theorising environmental justice: The expanding sphere of a discourse. Environ. Politics 2013, 22, 37–55. [Google Scholar] [CrossRef]
- Hamza, W.; Enan, M.R.; Al-Hassini, H.; Stuut, J.-B.; De-Beer, D. Dust storms over the Arabian Gulf: A possible indicator of climate changes consequences. Aquat. Ecosyst. Health Manag. 2011, 14, 260–268. [Google Scholar] [CrossRef]


| Country | Target | Year |
|---|---|---|
| Saudi Arabia | Reduce power consumption by 8% | 2021 |
| Reduce peak demand by 14% | 2021 | |
| Oman | Reduce greenhouse gas (GHG) emissions by 2% | 2030 |
| UAE | Reduce the power consumption in Dubai by 30% | 2030 |
| Reduce power consumption by 40% | 2050 | |
| Improve the efficiency for corporates and individuals by 40% | 2050 | |
| Reduce the electricity generation carbon footprint by 70% | 2050 | |
| Kuwait | Reduce power consumption by 30% | 2030 |
| Improve power generation efficiency by 15% | 2030 | |
| Qatar | Reduce the per-capita power consumption by 8% | 2022 |
| Bahrain | Reduce the power consumption by 6% | 2025 |
| Country | Solar (MW) | Wind (MW) | Total | ||
|---|---|---|---|---|---|
| CSP | Utility PV | Building Integrated PV | |||
| Saudi Arabia | 9500 | 10,500 | 750 | 3500 | 24,250 |
| Oman | 770 | 2420 | 990 | 1210 | 5390 |
| UAE | 6000 | 18,900 | 4200 | 300 | 29,400 |
| Kuwait | 1000 | 5800 | 1000 | 200 | 8000 |
| Qatar | 600 | 2250 | 150 | - | 3000 |
| Bahrain | 70 | 520 | 70 | 20 | 680 |
| GCC Total | 17,940 | 40,390 | 7160 | 5230 | 70,720 |
Publisher’s Note: MDPI stays neutral with regard to jurisdictional claims in published maps and institutional affiliations. |
© 2021 by the authors. Licensee MDPI, Basel, Switzerland. This article is an open access article distributed under the terms and conditions of the Creative Commons Attribution (CC BY) license (http://creativecommons.org/licenses/by/4.0/).
Share and Cite
Alharbi, F.R.; Csala, D. Gulf Cooperation Council Countries’ Climate Change Mitigation Challenges and Exploration of Solar and Wind Energy Resource Potential. Appl. Sci. 2021, 11, 2648. https://doi.org/10.3390/app11062648
Alharbi FR, Csala D. Gulf Cooperation Council Countries’ Climate Change Mitigation Challenges and Exploration of Solar and Wind Energy Resource Potential. Applied Sciences. 2021; 11(6):2648. https://doi.org/10.3390/app11062648
Chicago/Turabian StyleAlharbi, Fahad Radhi, and Denes Csala. 2021. "Gulf Cooperation Council Countries’ Climate Change Mitigation Challenges and Exploration of Solar and Wind Energy Resource Potential" Applied Sciences 11, no. 6: 2648. https://doi.org/10.3390/app11062648
APA StyleAlharbi, F. R., & Csala, D. (2021). Gulf Cooperation Council Countries’ Climate Change Mitigation Challenges and Exploration of Solar and Wind Energy Resource Potential. Applied Sciences, 11(6), 2648. https://doi.org/10.3390/app11062648