Article

Analysis and Optimization of Driveline Bushing for Lateral Ride Vibration under Shock Excitation

1
Tianjin Key Laboratory for Advanced Mechatronic System Design and Intelligent Control, School of Mechanical Engineering, Tianjin University of Technology, Tianjin 300384, China
2
State Key Laboratory of Engines, Tianjin University, Tianjin 300350, China
*
Authors to whom correspondence should be addressed.
Appl. Sci. 2021, 11(6), 2647; https://doi.org/10.3390/app11062647
Submission received: 9 February 2021 / Revised: 9 March 2021 / Accepted: 12 March 2021 / Published: 16 March 2021
(This article belongs to the Section Acoustics and Vibrations)

Abstract

:
Ride comfort is increasingly important for automobile companies due to the increasing concern of the demands of customers. Response to shock at low speed, such as single or consecutive pulse excitations from humps, are one of the greatest assessing indices of vehicle ride related to the ride comfort. This paper aims to study the effect of driveline bushing on ride vibration when the vehicle experiences shock excitation and to improve the ride quality by optimizing the bushing parameters. A vehicle level multibody dynamic model with a differential-subframe subsystem is developed and calibrated against field test data. The sensitivities of the bushing stiffness and damping coefficients are analyzed and the most influential bushing parameters on the seat rail vibration are identified. The relationship between the bushing parameters and the ride vibration is developed by a 5-level response surface design. The fitted response functions are validated and adopted as the optimization objectives. The optimized results, including the acceleration, the running r.m.s. acceleration, the jerk, the running r.m.s. jerk, the VDV and the comfort, are compared with those of the baseline vehicle. Results show that the optimized bushings significantly decrease the vibration at the driver and the rear passenger seats by approximately 50% in the lateral direction. A considerable improvement has been achieved in ride comfort that the weighted vibration at seats is reduced to a level below the median perception threshold of human being in the lateral direction.

1. Introduction

It is the two main functions of the bushings in automobiles to isolate vibration transmission between structures and reduce noise transmitted to cabin. Stiffness and damping of bushing have a great influence on the static and dynamic performance of vehicles. As a highly coupled dynamic system, changes of subsystem of vehicle may have considerable impacts on the global responses [1].
Suspensions (of vehicle/seat) and mounts (of engine/suspension) have the most direct effect on ride comfort and have been well studied [2,3,4,5,6]. It was justified that the well-designed mechanical properties of the jounce bumper is able to reduce the vertical acceleration at the vehicle centroid at most speeds [7]. The bushing joints of the front suspension have great influence on the vertical displacements and roll accelerations of the vehicle chassis [8]. Papaioannou et al. [9] discussed different sorts of optimization approaches for improving ride comfort and road holding at the same time. Moheyeldein [10] proposed a dynamic air spring model and its benefit to ride comfort was examined through a 2-DOF analytical model. A hydropneumatic suspension model with a semiactive suspension control is developed to improve the ride comfort of an agriculture tractor [11]. Powertrain mounting system has also been widely investigated. Researches including the dynamic simulation of the rubber or hydraulic mounts [12,13,14,15], the development of vibration isolation method from engine to chassis [16,17,18,19], and optimization of the mount characteristics [20,21,22] were carried out. In addition to suspensions and powertrain mounts, driveline components also have considerable influence on the vehicle ride [23], where bushings play a significant role in connecting the front/rear drive units and their subframes and between the subframes and chassis. Effect of the driveline bushings on the dynamic responses at both local system (e.g., differential/subframe vibration) and global system (e.g., the seat rail vibration) is of great importance for vehicle design [24].
Ride comfort is related to the objective responses of human body to vibration and the subjective sensation and feeling of occupants caused by the vibration accordingly [25]. Both of the objective and subjective response of human depend on the vibration direction [26]. It has been proved that a low-amplitude rotational movement of the upper body can cause same discomfort as high-amplitude vertical movement [27]. Among all six directions, comparing to the vertical vibration the passenger is more sensitive to lateral and roll movements, which are less concerned. In terms of the kind of ride vibration, at low speed the pulse excitation or shock (hump or pit) is the main contributor to the discomfort compared to the random vibration with little magnitude due to the inconspicuous response of the human body to it. Pulse excitation and shock deserve more concern to improve the performance of ride comfort of vehicles while most of the previous studies focused on the other one.
The objective of the study is to investigate the influence of driveline bushing on ride vibration of a vehicle and to improve the comfort by optimizing the bushing parameters. To this end, a multibody dynamics (MBD) model of a vehicle including a detailed differential-subframe subsystem is developed and validated by the experiment. A sensitivity analysis is carried out to identify significant factors among the bushing parameters affecting the seat rail vibration. Based on the sensitivity result, the relationship between the vibration of seat rail and the bushing parameters is established with the response surface method (RSM). Finally, the optimization of the bushing parameters is carried out with the particle swarm optimization (PSO) method while the fitted response functions is applied to minimize the overall vibration at the driver seat rail.

2. Model

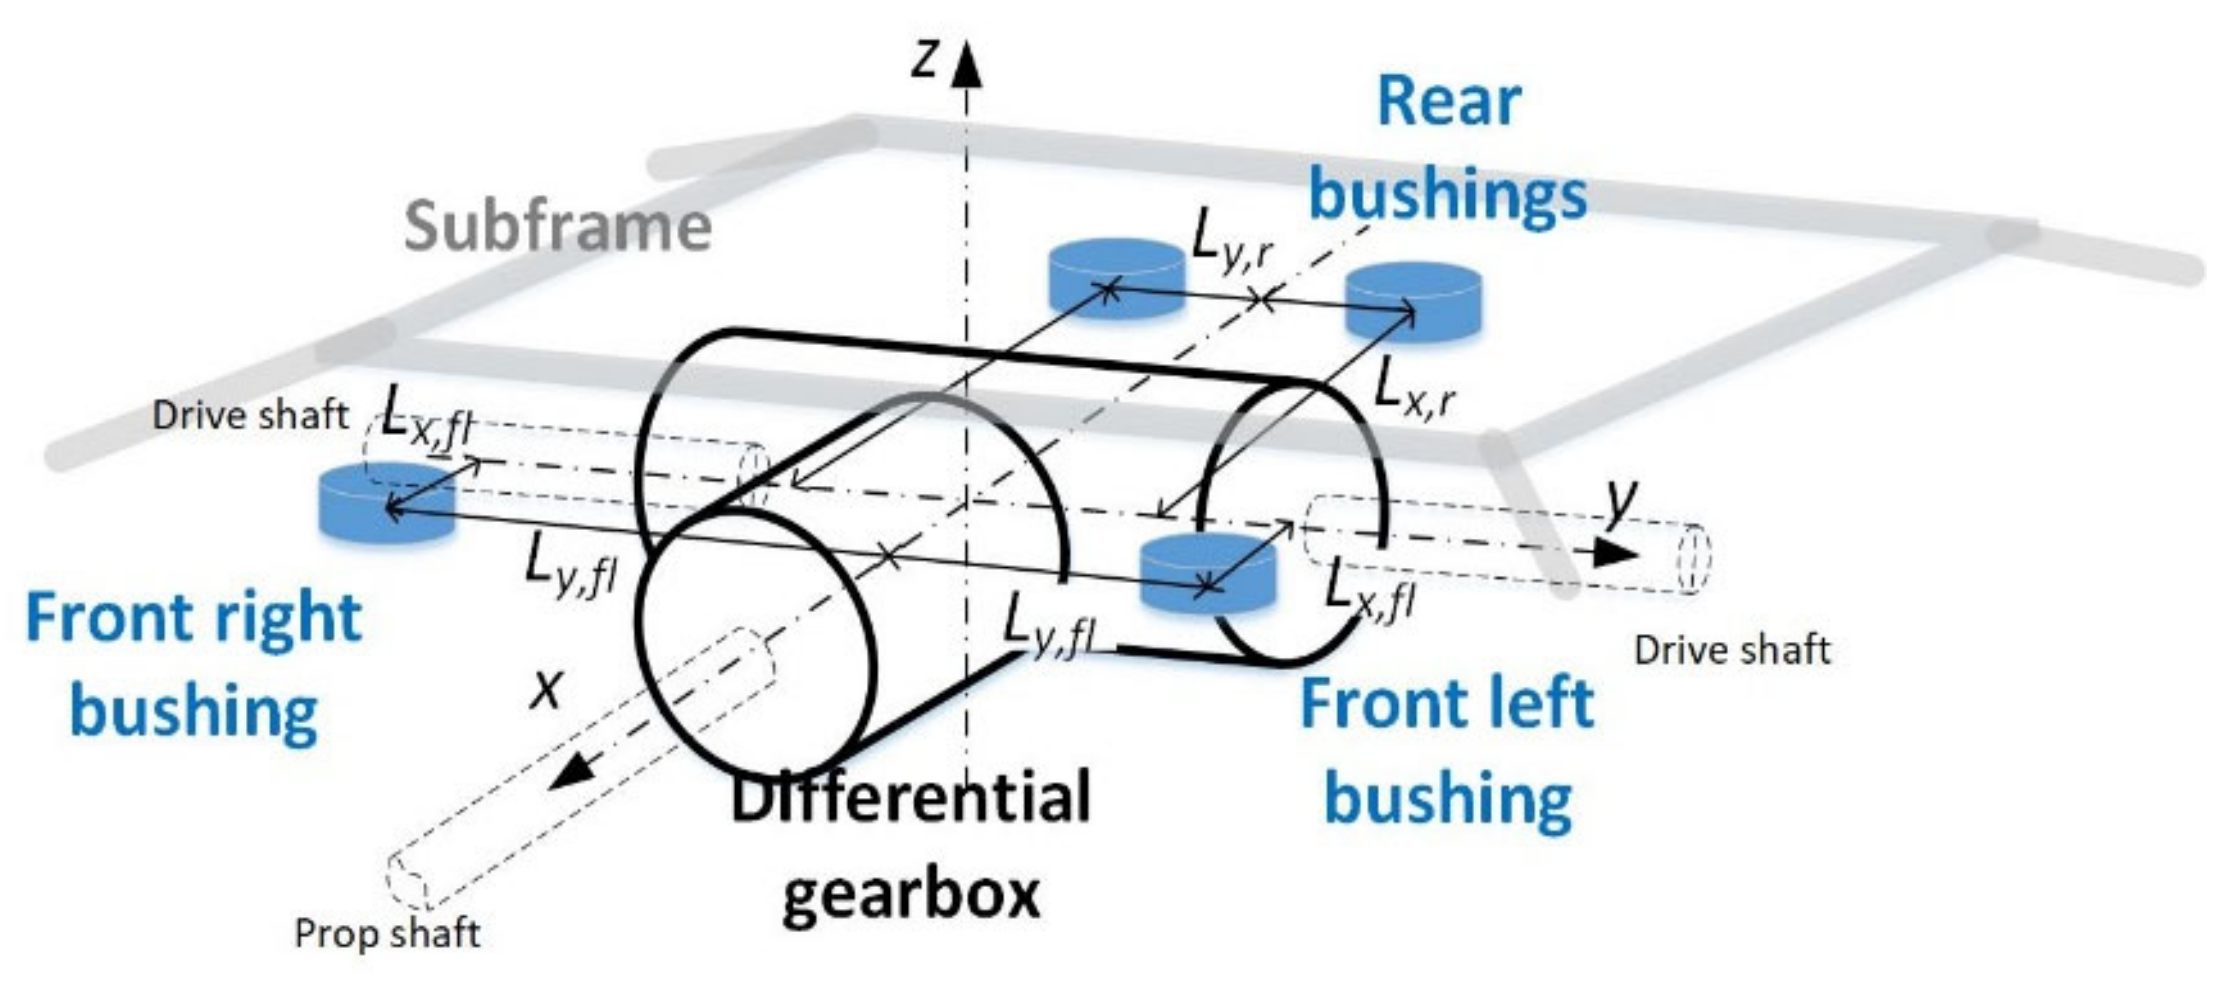
2.1. Model Construction

The vehicle model is developed through the multibody dynamic approach considering the vibration inputs in the longitudinal, lateral and vertical directions [5]. An internal developed program based on MATLAB is applied in the modeling and equation solving of the multibody model. The rear differential studied in this paper locates at the very end of the driveline, hanging on the rear subframe by four rubber bushings, as shown in Figure 1. The two front bushings are arranged asymmetrically with respect to the driveline axial direction, and the two rear bushings are symmetric. The lateral distance between the front right bushing and the differential centroid is much larger than between the front left one and the differential centroid. It is noted that the prop shaft and the drive shafts are considered in the mathematical modeling but not involved in the sensitivity analysis.
In the dynamic model, the rear differential is considered as a whole, which means the gears, the input shaft and the constant velocity joints are all integrated onto the differential casing. Under this consideration, the high frequency vibration due to gear meshing is neglected since the ride analysis usually focuses on the vibration below 30 Hz [28,29,30]. However, the vibration modes of the rear differential assembly are considered. The rubber bushing is modeled with a series of parallel spring-damper units with three pairs of equivalent constant stiffness and damping in the longitudinal, lateral and vertical directions respectively. The properties of the two front bushings are different and those of the two rear ones are identical. The properties of the bushings are listed in Table 1, in which the fore-and-aft direction, lateral and vertical direction is represented with x, y and z respectively. A smooth road with an obstacle (20 mm in height) and a constant vehicle speed of 35 km/h were applied to simulate the case of a car crossing a bump at low speed, which is the same as the test condition employed in the model validation.

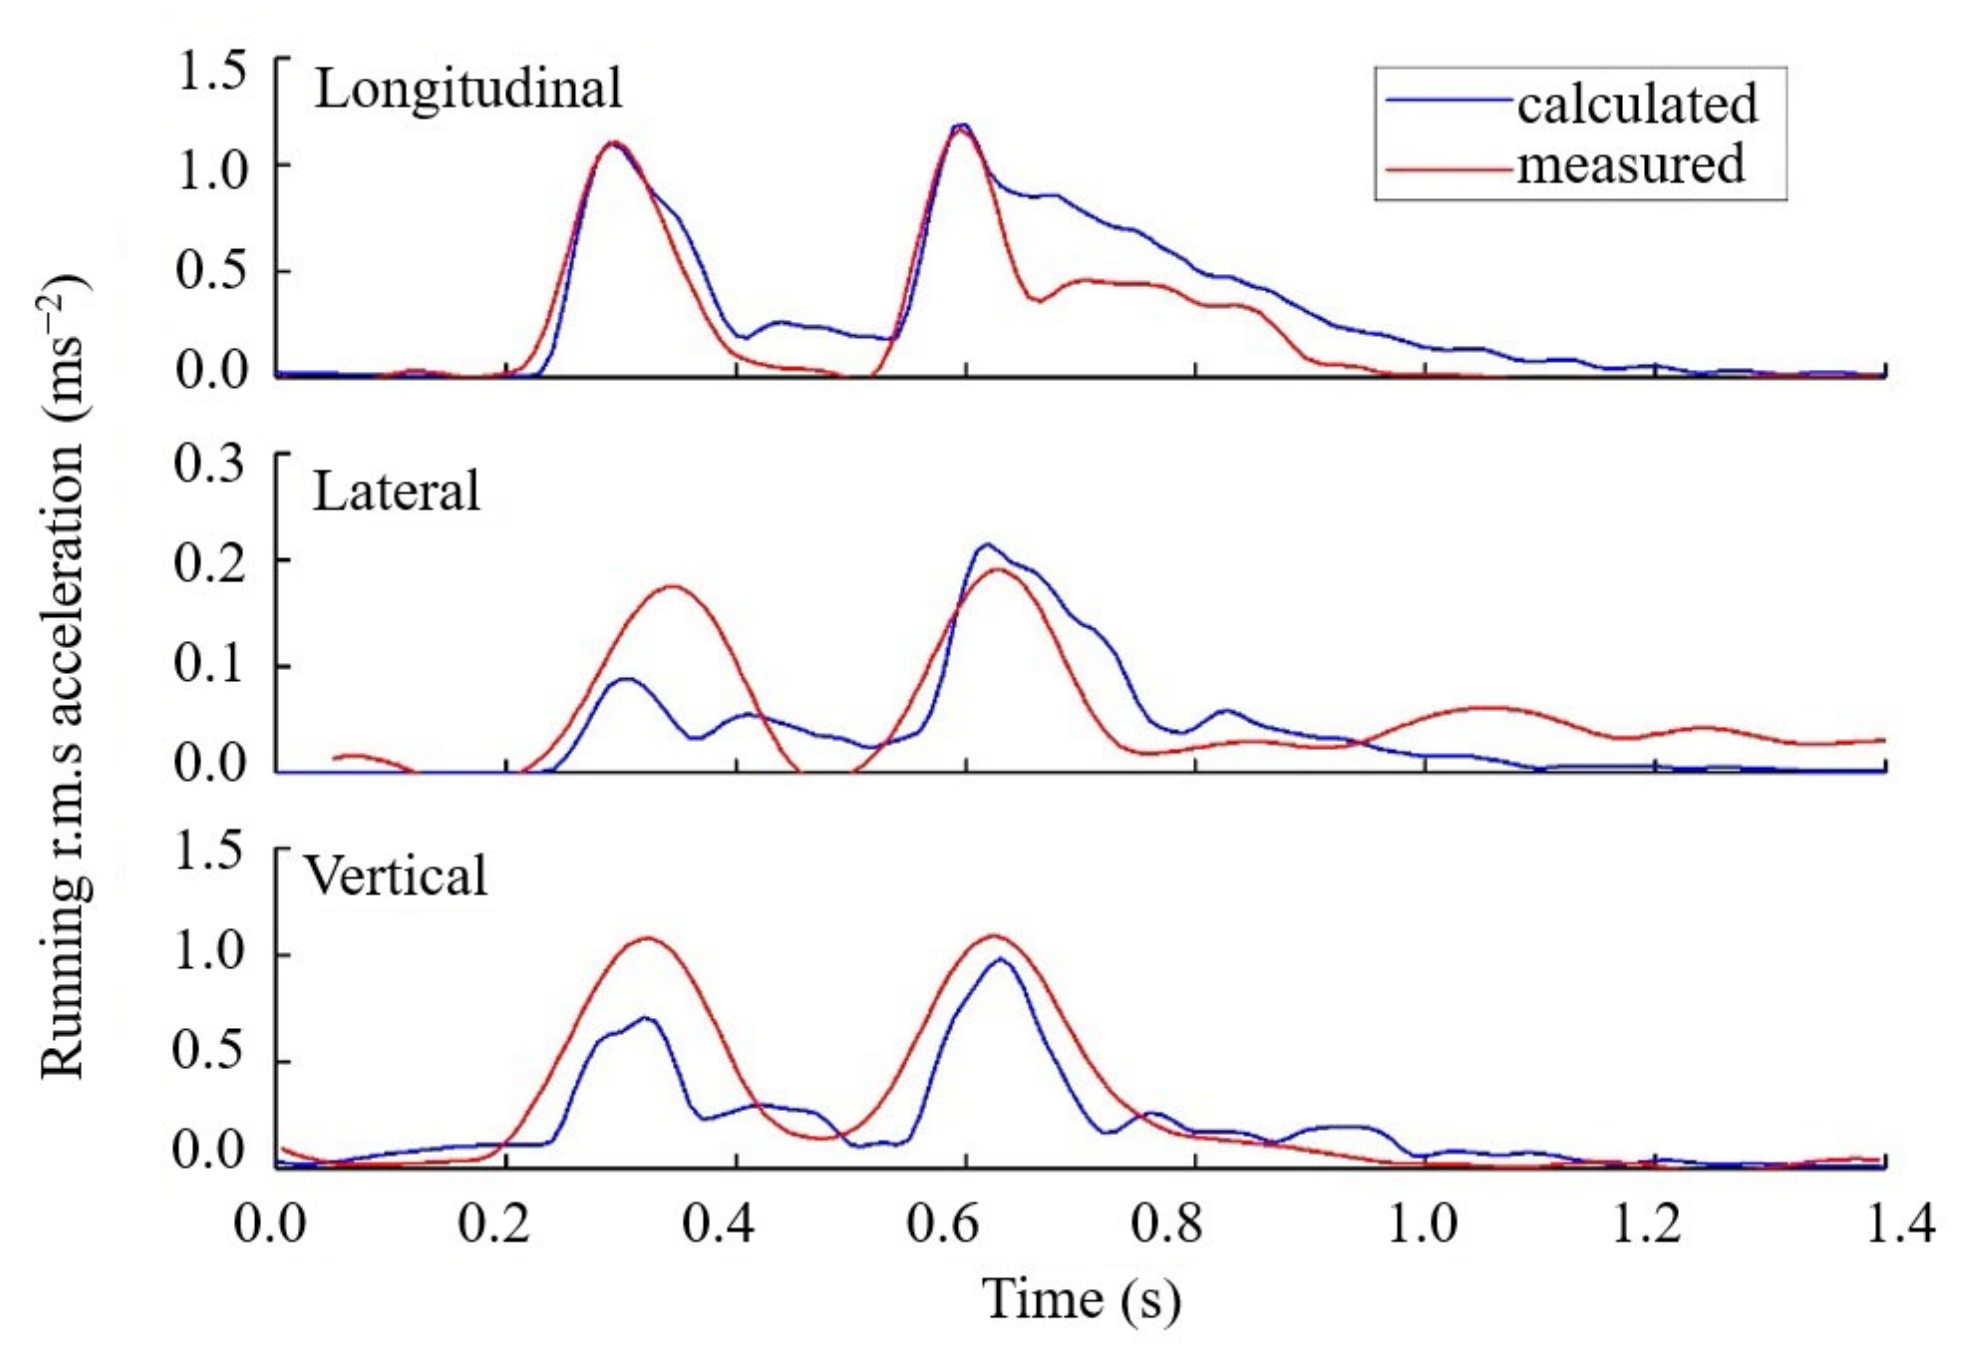
2.2. Model Validation

A field measurement over a 20 mm obstacle (Figure 2) at 35 km/h was conducted, which represents a typical working condition when the vehicle passes over a speed bump. In the test, the vehicle passes over the obstacle with both wheels of each axle, i.e., the left and right wheels of one axle were exposed to the shock excitation simultaneously. All the other test conditions met the requirement of Chinese standard GB/T 4970-2009. The r.m.s acceleration of the driver seat rail that was applied in the ride comfort analysis was measured with a triaxial accelerometer (PCB 356A26), which had a sensitivity of approximately 50 mV/g with an operating range of ±100 g. The accelerometer was mounted at the seat rail of the driver based on GB/T 4970-2009, which is shown in Figure 3. The test data was recorded with a sampling rate of 512 samples per second by Simcenter SCADAS Mobil. A duration of 1.4 s signal was employed to compute the running r.m.s. acceleration using Equation (1) [31].
a t 0 = 1 τ t 0 τ t 0 a t 2 d t 1 2
where a(t) is the instantaneous acceleration, τ is the integration time for running averaging, t is the time and t0 is the time of observation. The integration time was 0.02 s and the overlap were 50%. The running r.m.s. accelerations in the three translational directions computed with the simulation results were compared with those from the measured data, as shown in Figure 4.
The comparison shows that the simulation results agrees reasonably well with the experimental data. Two peaks can be found in the running r.m.s. acceleration as the front and the rear wheels hit the bump successively.

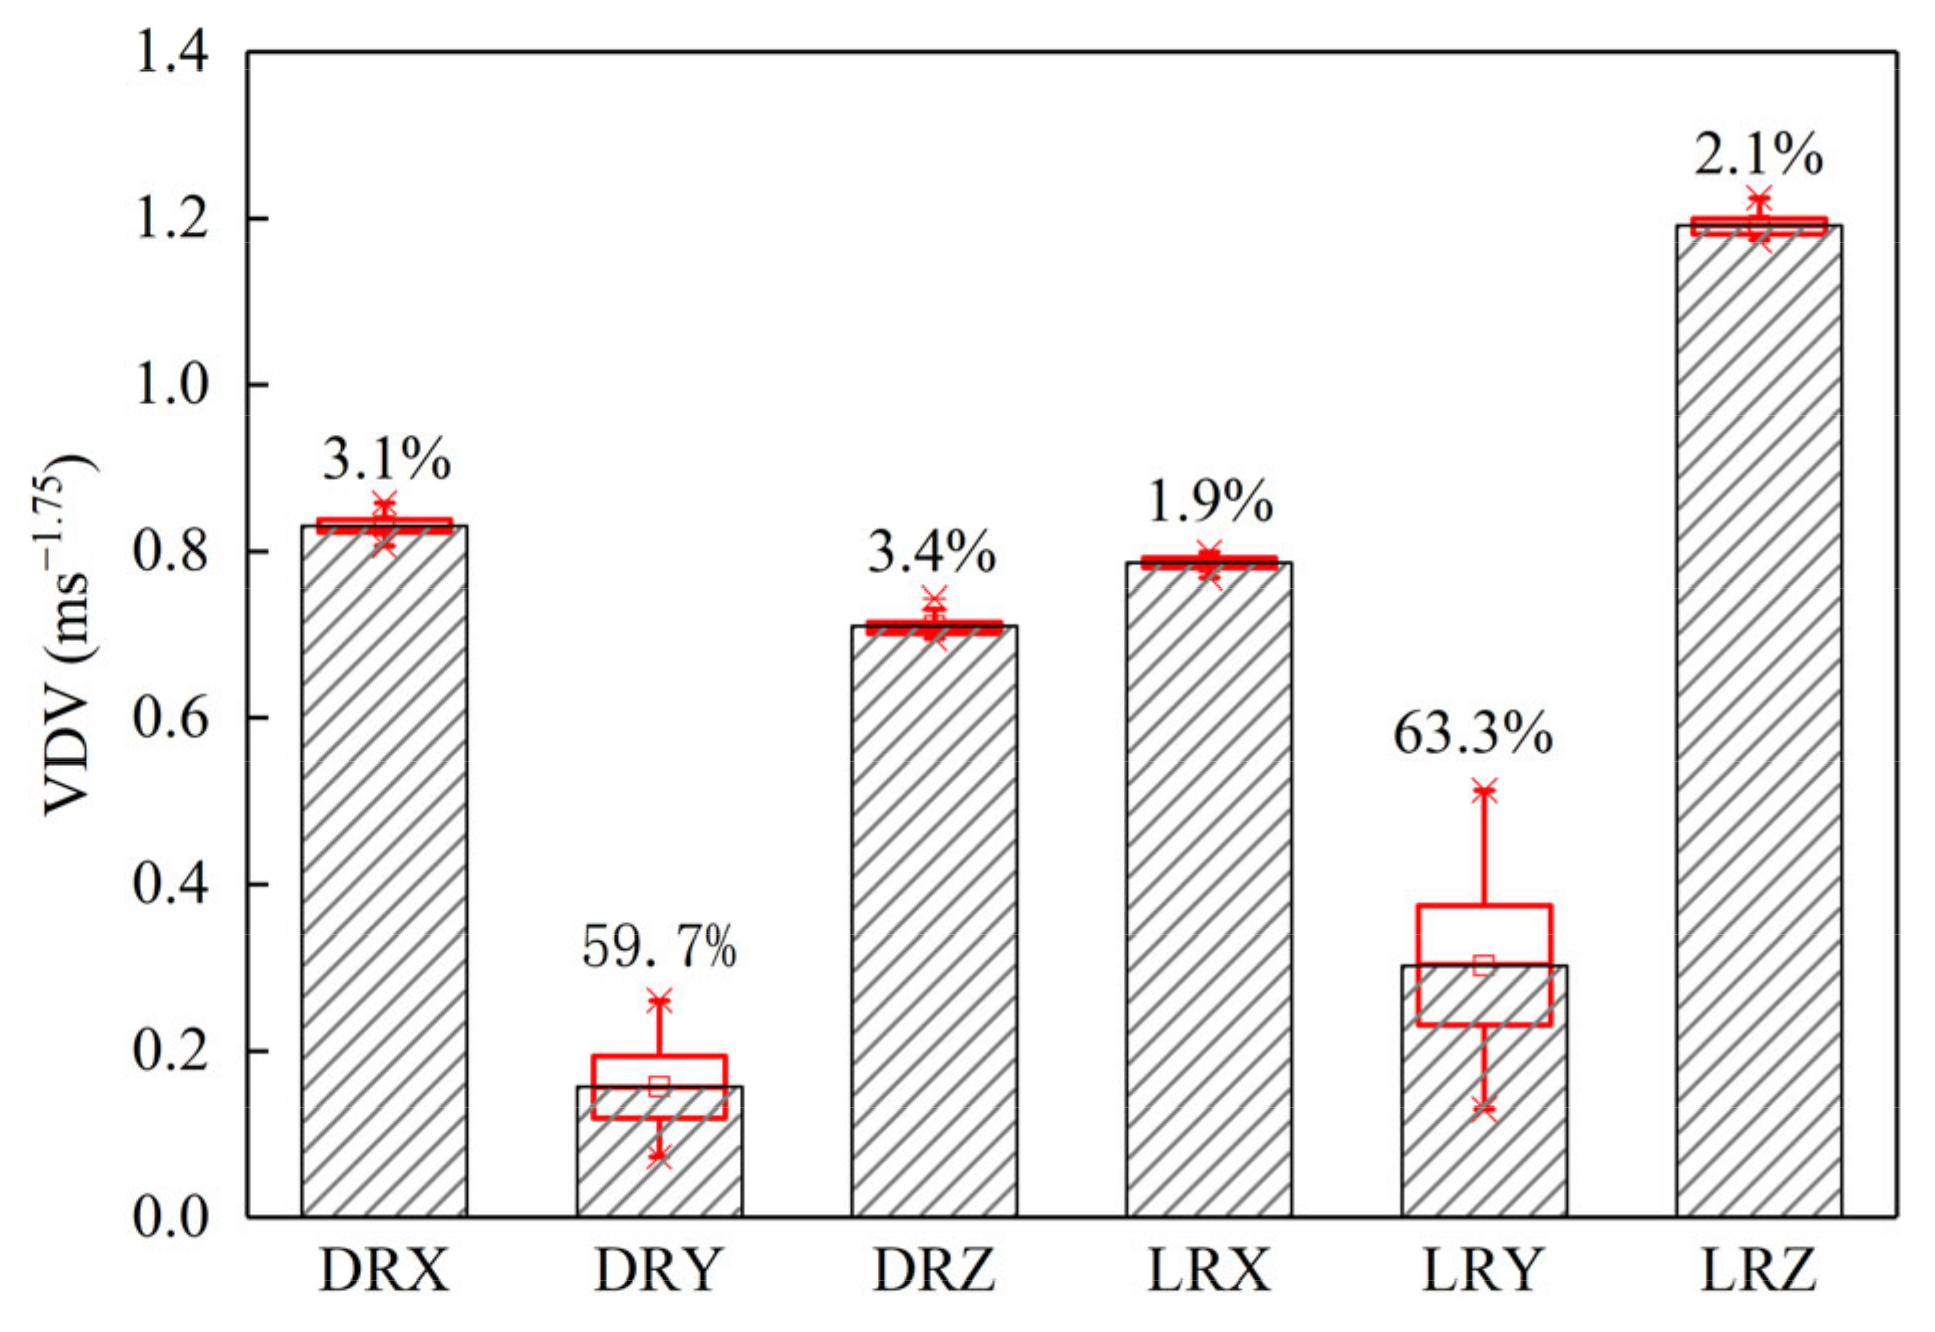
3. Sensitivity Analysis

3.1. Method

Since the two rear bushings were identical, a total of 18 stiffness and damping parameters were employed as the design parameters in the sensitivity analysis, including kx_FL, cx_FL, ky_FL, cy_FL, kz_FL, cz_FL, kx_FR, cx_FR, ky_FR, cy_FR, kz_FR, cz_FR, kx_RR, cx_RR, ky_RR, cy_RR, kz_RR and cz_RR, where the subscripts FL, FR and RR refer to the front left, front right and rear bushings, and x, y and z refer to the longitudinal, lateral and vertical directions. In the sensitivity analysis, the lower and upper bounds of the design parameter were ±50% of its baseline value. The vibration at the driver (DR) seat rail and the rear left passenger (LP) seat base was taken as the target. The design was conducted by the Latin Hypercube Sampling method containing 80 runs in total. The vibration dose value (VDV) [31] was chosen as the response in the sensitivity analysis and given as:
VDV = 0 T a t 4 d t 1 / 4
where a(t) is the acceleration time history.

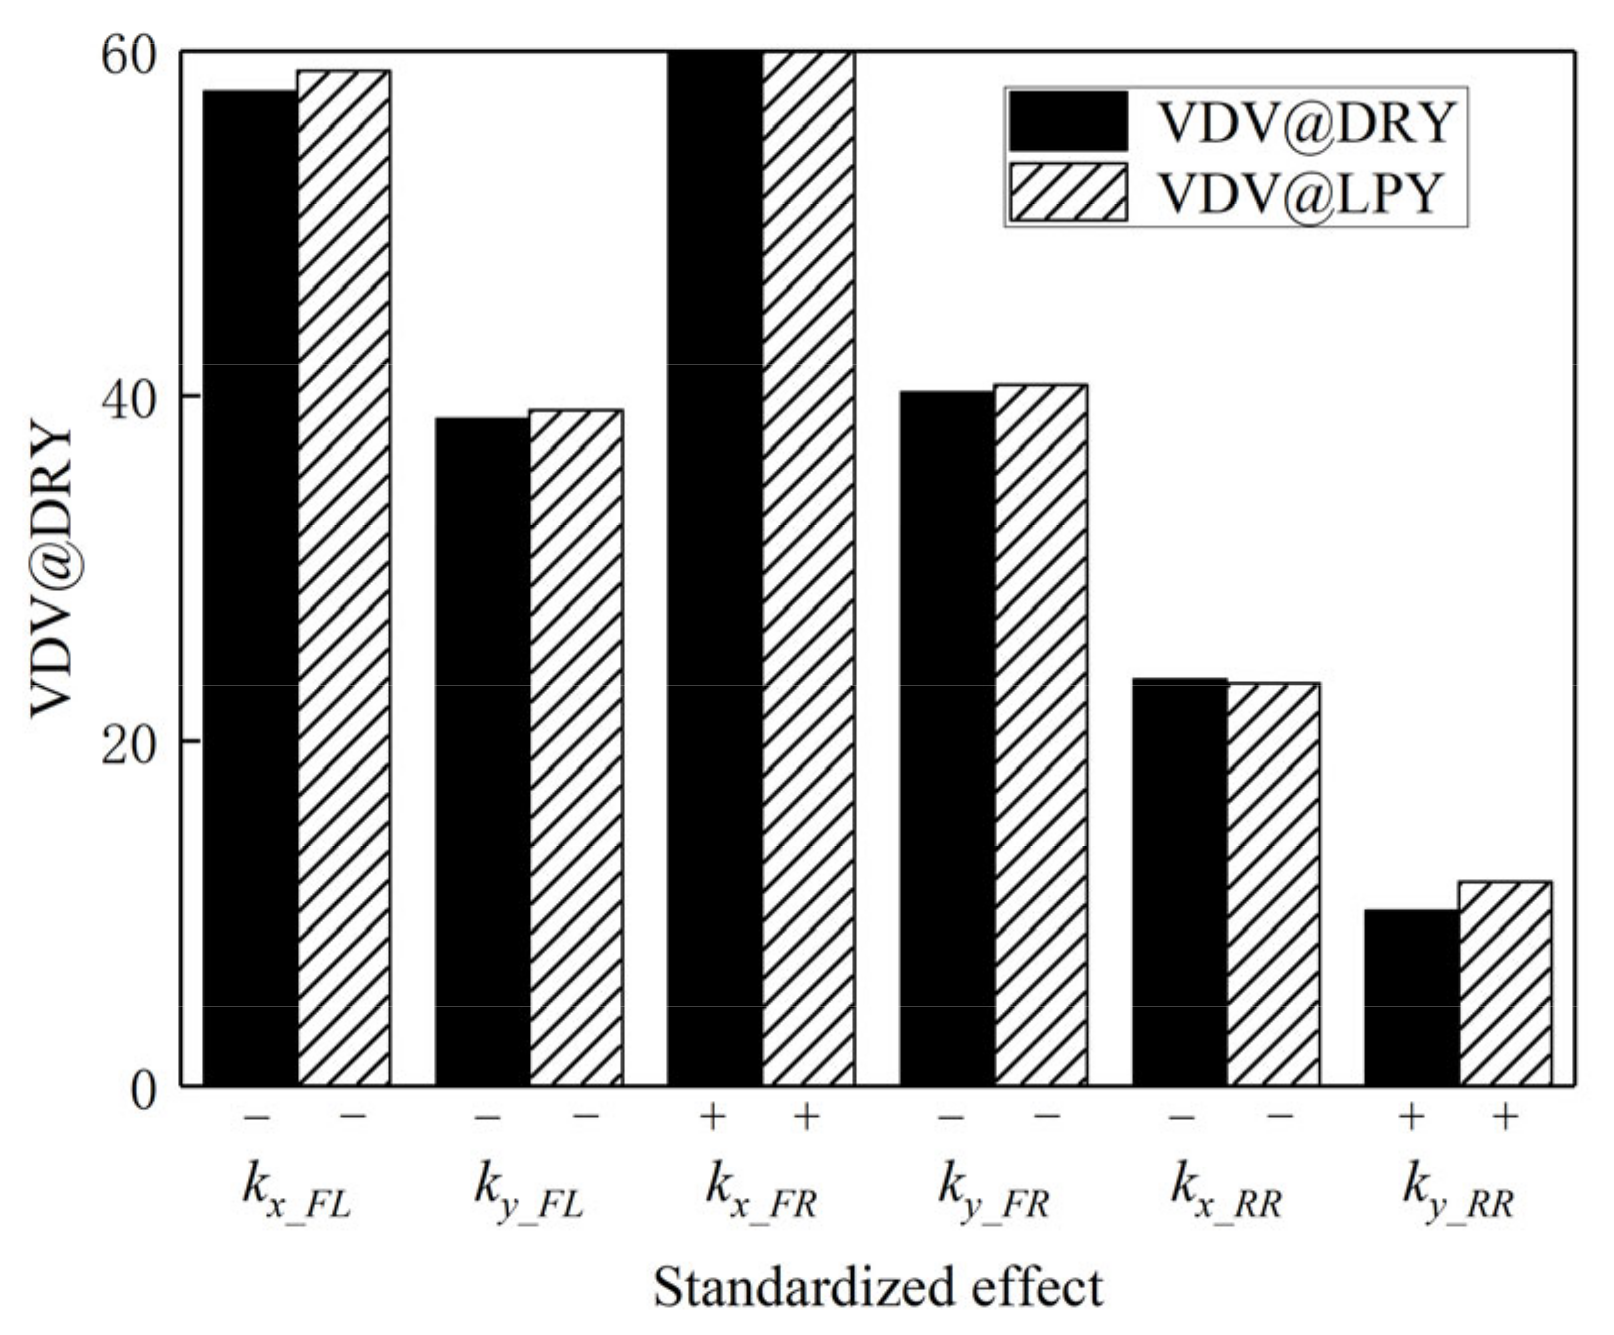
3.2. Sensitivity Results

The variation of the responses due to the change of design parameters is shown in Figure 5. Comparing between different locations and different directions, only VDVs of the lateral acceleration at the DR and the LR had considerable changes, which were 59.7% for DR and 63.3% for LR. Therefore, in the following analysis the vibration at the lateral direction was the main topic as that in the other two directions were still considered. It is found six bushing parameters, kx_FL, k y_FL, k x_FR, k y_FR, k x_RR and k y_RR, had an important effect on ride vibration at the seat rails in the lateral direction. All these six parameters cause at least 10% change in the lateral VDV, as shown in Figure 6. A bar with a positive value means the VDV increased with increasing value of the corresponding parameter, and vice versa. It can be seen from Figure 6 that the effects of each influential parameter on the VDVs at the driver and the rear left passenger seat rails were very close. In the following work, only the ride vibration at the driver seat rail was considered.

4. Relationship between Seat Rail Vibration and Bushing Parameters

4.1. Design of Experiment

The main idea of RSM is to obtain an optimal response with a series of designed experiments. In this paper, RSM was used to build up the relationships between the differential bushing parameters and the VDVs at the driver seat rail vibration in different directions.
The six significant factors (kx_FL, ky_FL, kx_FR, ky_FR, kx_RR and ky_RR) with five levels (0.53, 0.8, 1.0, 1.2 and 1.47 times the baseline) were used for the design. The lower and higher levels (0.8 and 1.2 times the baseline) were chosen manually and the lowest and highest levels (0.53 and 1.47 times the baseline) were calculated accordingly [32]. A total of 54 runs were designed and the design parameters were coded for convenience.

4.2. Response Function

Using the regression method, the relationships between the responses (VDVs at the driver seat rail in different directions) and the design parameters (kx_FL, ky_FL, kx_FR, ky_FR, kx_RR and ky_RR) were fitted by quadratic polynomials. The fitted response functions for the VDVs at the driver seat rail in the three translational directions are given as follows:
VDV x _ FL = 0.7870 0.0149 k x _ FL 0.0222 k y _ FL + 0.0586 k x _ FR + 0.0048 k y _ FR + 0.0012 k x _ RR + 0.0425 k y _ RR 0.0009 k x _ FL 2 0.0045 k y _ FL 2 + 0.0148 k y _ FR 2 0.0127 k y _ FR 2 0.0023 k x _ RR 2 0.0166 k y _ RR 2 + 0.0145 k x _ FL k y _ FL 0.0217 k x _ FL k y _ FR + 0.0158 k x _ FL k y _ FR + 0.0025 k x _ FL k x _ RR + 0.0040 k x _ FL k y _ RR 0.0071 k x _ FL k x _ FR + 0.0060 k y _ FL k y _ FR + 0.0057 k y _ FL k x _ RR 0.0016 k y _ FL k y _ RR 0.0117 k x _ FR k y _ FR 0.0083 k x _ FR k x _ RR + 0.0042 k x _ FR k y _ RR + 0.0066 k x _ FR k x _ FL 0.0112 k y _ FR k y _ RR 0.0008 k x _ RR k y _ RR
VDV y _ FL = 0.623 0.210 k x _ FL 0.164 k y _ FL + 0.136 k x _ FR 0.158 k y _ FR 0.161 k x _ RR 0.181 k y _ RR 0.0552 k x _ FL 2 + 0.0039 k y _ FL 2 + 0.0345 k x _ FR 2 0.0004 k y _ FR 2 + 0.0316 k x _ RR 2 + 0.0803 k y _ RR 2 + 0.0624 k x _ FL k y _ FL + 0.0301 k x _ FL k x _ FR + 0.0682 k x _ FL k y _ FR + 0.0239 k x _ FL k x _ RR 0.0039 k x _ FL k y _ RR 0.0476 k y _ FL k x _ FR + 0.0340 k y _ FL k x _ FR + 0.0200 k y _ FL k x _ RR + 0.0111 k y _ FL k y _ RR 0.0533 k x _ FR k y _ FR 0.0089 k x _ FR k x _ RR + 0.0070 k x _ FR k y _ RR + 0.0190 k y _ FR k x _ FL + 0.0106 k y _ FR k y _ RR + 0.0020 k x _ RR k y _ RR
VDV z _ FL = 1.059 0.150 k x _ FL 0.130 k y _ FL _ y 0.008 k x _ FR 0.124 k y _ FR 0.083 k x _ RR 0.124 k y _ RR + 0.0229 k x _ FL 2 + 0.0224 k y _ FL 2 + 0.0105 k x _ FR 2 + 0.0246 k y _ FR 2 + 0.0164 k x _ RR 2 + 0.0622 k y _ RR 2 + 0.0316 k x _ FL k y _ FL + 0.0042 k x _ FL k x _ FR + 0.0284 k x _ FL k y _ FR + 0.0167 k x _ FL k y _ RR 0.0040 k x _ FL k y _ RR 0.0041 k y _ FL k x _ FR + 0.0260 k y _ FL k y _ FR + 0.0124 k y _ FL k x _ RR + 0.0011 k y _ FL k y _ RR 0.0133 k x _ FR k y _ FR 0.0035 k x _ FR k x _ RR 0.0028 k x _ FR k y _ RR + 0.0135 k y _ FR k x _ FL + 0.0012 k y _ FR k y _ RR 0.0014 k x _ RR k y _ RR
A set of five random combinations of the six design parameters were generated to test the applicability of the fitted response functions, as listed in Table 2. The test samples were never used in the fitting procedure. The VDVs at the driver seat rail were obtained applying the test parameters into the MBD model, and the corresponding VDVs were also computed using the fitted response functions (Equations (3)—(5)), as given in Table 2.
The relative errors between the DR VDVs obtained from the response functions and the MBD simulations were all less than 6%. The results show that the direct relationships obtained through the RSM gave good predictions of the VDV at DR, which means the response functions were suitable for the following optimization.

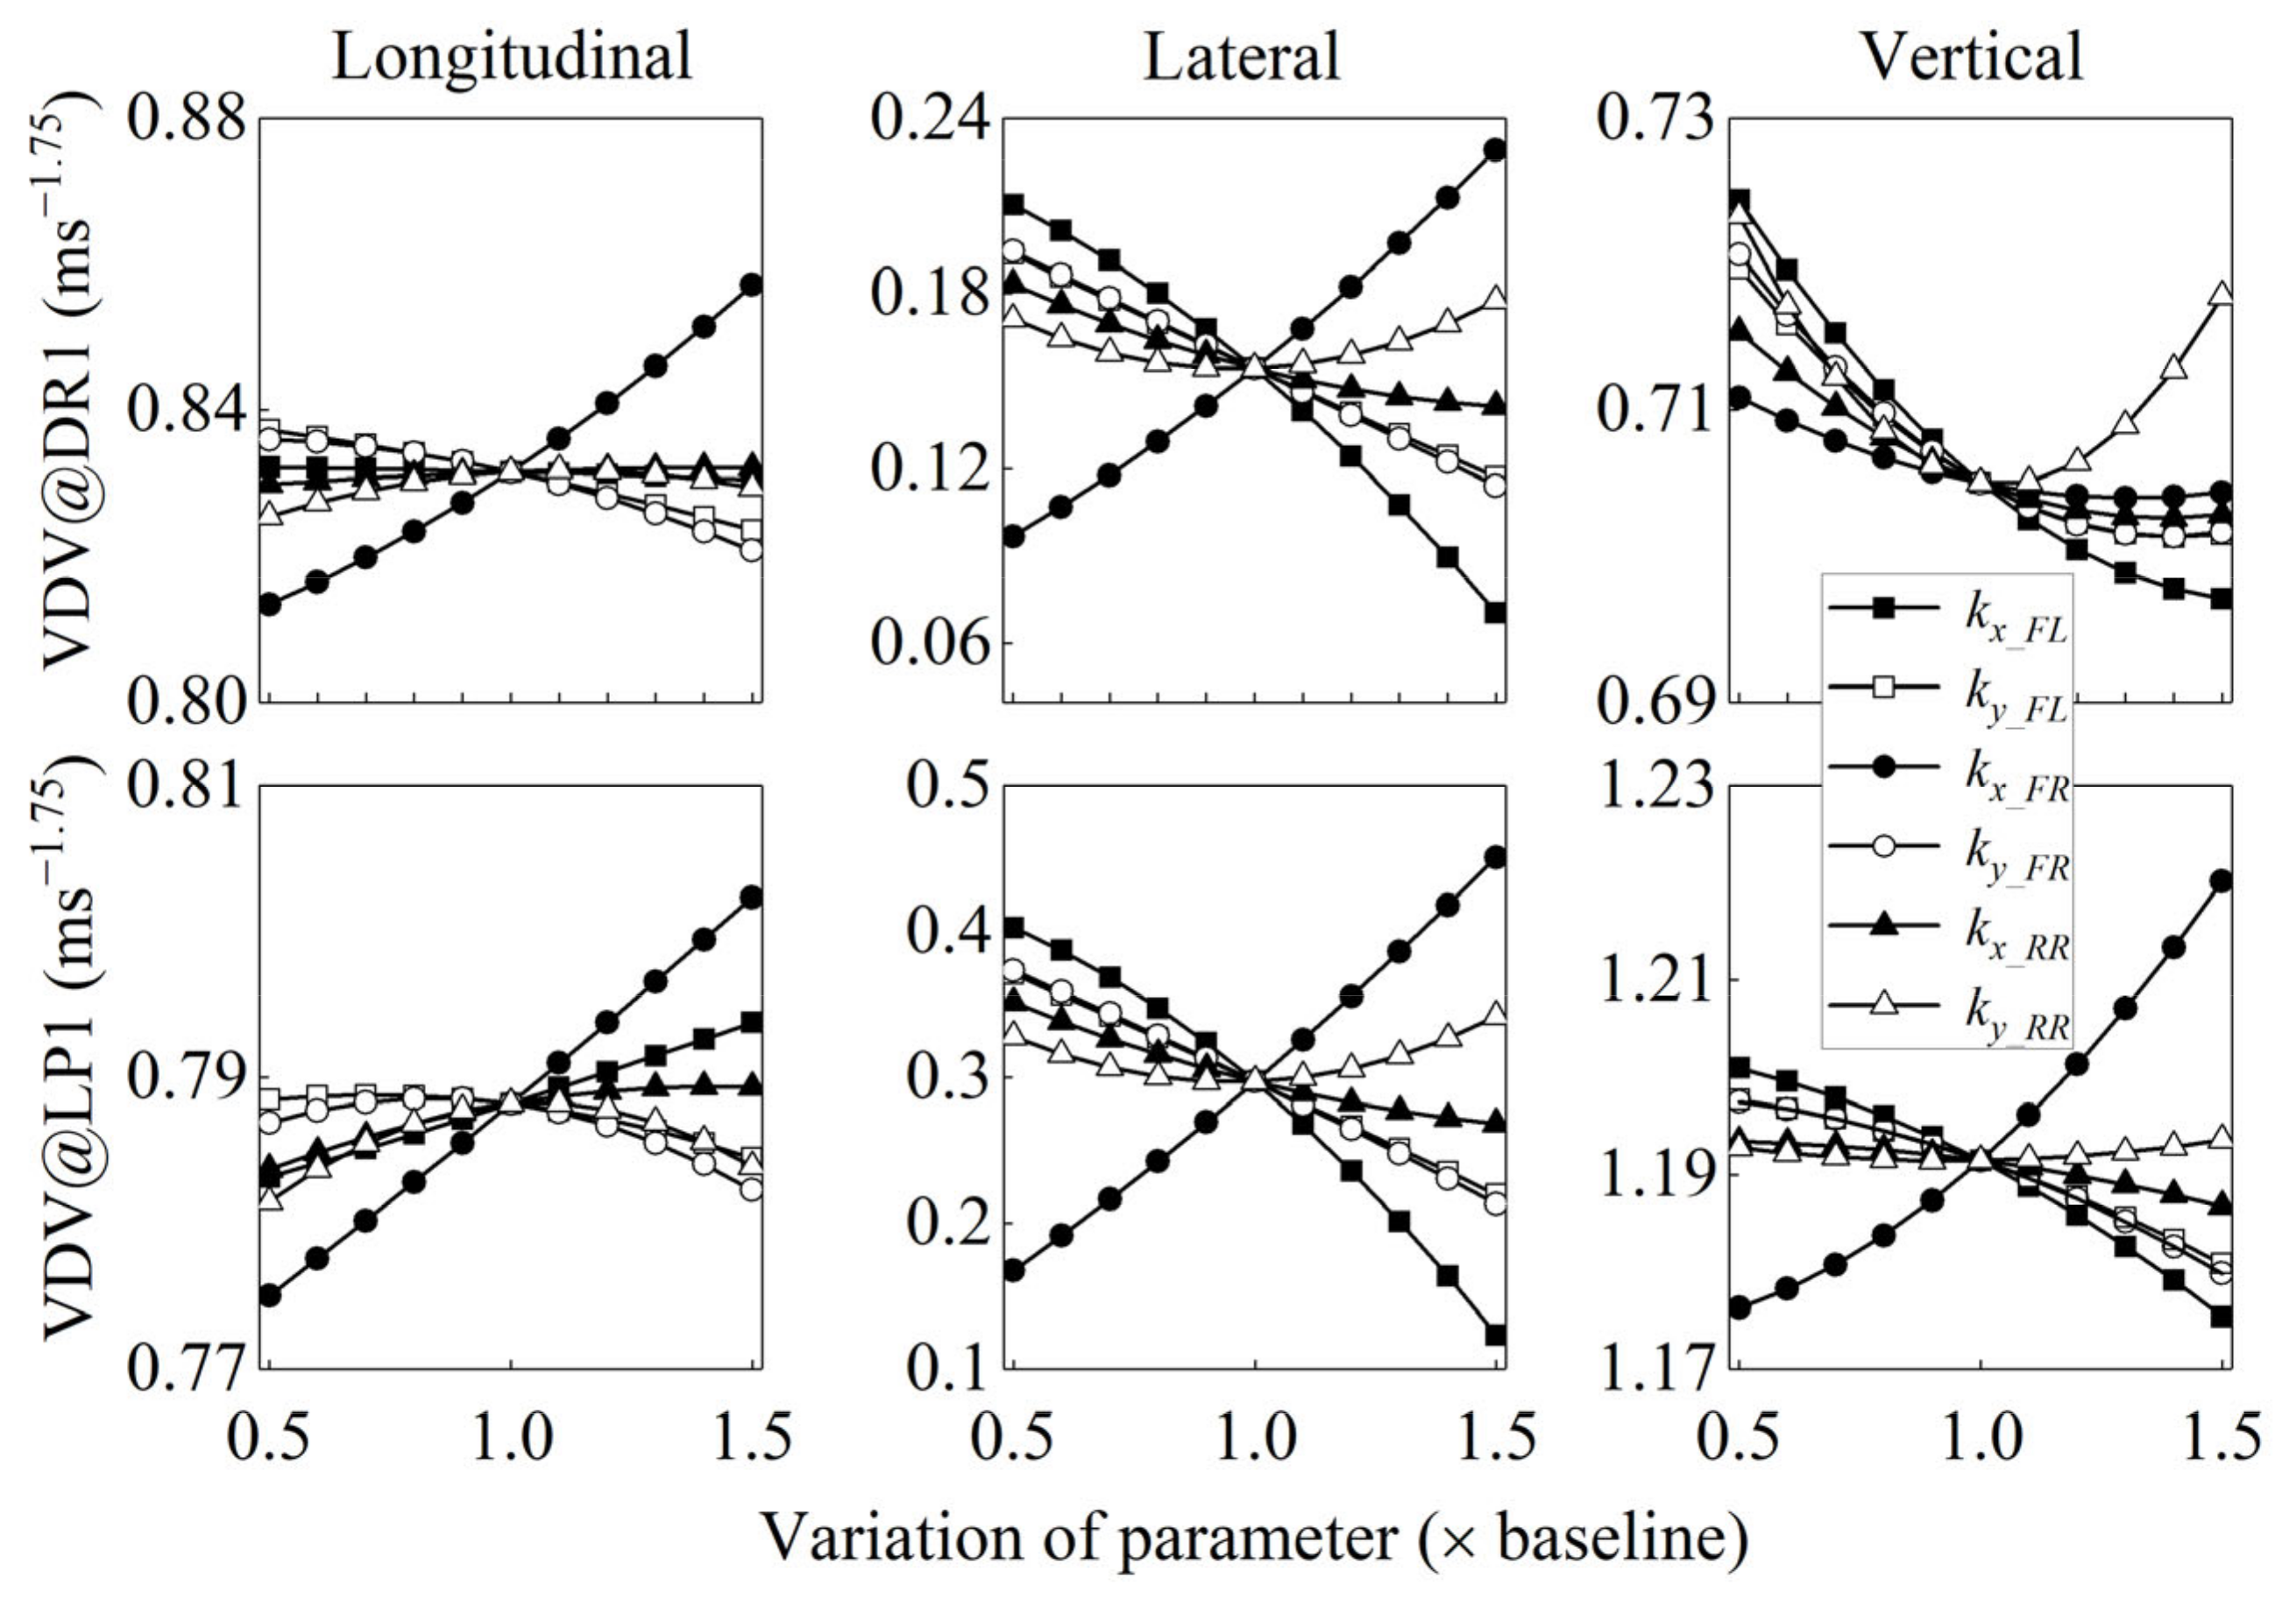
4.3. Effect of the Design Parameter on Seat Rail Vibration

Based on Equations (3)–(5), the main effects of each parameter on the responses are found out and given in. In the longitudinal direction, the VDVDR decreased with increasing kx_FL, ky_FL and ky_FR, but increased with increasing kx_FR, and kx_RR. The effect of ky_RR on the VDVDR was not monotonous—the VDVDR increased when the ky_RR increased from 50% to 110% of its baseline and then decreases when the ky_RR further increased. In the lateral direction, the VDVDR decreased with increasing kx_FL_, ky_FL_, ky_FR and kx_RR, but increased with increasing kx_FR and ky_RR. Again, the effect of ky_RR on the VDVDR varied according to the parameter range. In the range of 50%–100% of the baseline, the VDVDR decreased with increasing ky_RR. In the range of 100%–150% of the baseline, the VDVDR increased with increasing ky_RR. In the vertical direction, more parameters including ky_RR, ky_FL, kx_FR, ky_FR and kx_RR show non-monotonous effects on the response.
As can be seen from the vertical scales of Figure 7, the relative changes of the VDVDR were considerable (from 12% to 63%) in the lateral direction but marginal in the fore-and-aft and vertical directions (less than 5%).
The longitudinal VDVDR will reach its minimum value when kx_FL was minimized and ky_FL was maximized. In the lateral direction, the optimal VDVDR could be achieved with a combination of the maximum value of kx_FL and the maximum value of ky_FL. In the vertical direction, the situation was more complicated as the effect of ky_FL on the VDVDR was not monotonous. The lowest VDVDR was obtained when kx_FL was maximized and ky_FL was taken a value between 1.0 and 1.5 times of the baseline values. It can be found that when several parameters were considered together, the VDVs in different directions required different solutions to achieve their lowest values.

5. Optimization of Rear Drive Unit Bushing Parameters

5.1. Optimization Algorithm

The PSO algorithm searches the optimal solution [33] with a population of particles. Each particle represents a candidate solution to the optimization problem. Particles change positions by moving around in the search space guided by their own best-known position in the search space and the entire swarm’s best-known position. The searching process will stop if a relatively unchanging position is found or the maximum iteration limit is reached.
The particle is represented by an m-dimensional vector X, where m is the number of optimized parameters. The jth particle Xj can be described as Xj = (xj,1, xj,2, ..., xj,m), where xj,k is the position of the jth particle with respect to the kth dimension. At a certain time, a set of n particles is called as a population, which can be described as [X1, X2, … Xn]T. Every particle adjusts its position toward the global optimum through finding the two extreme values: the best position encountered by the particle itself, Pj = (pj,1, pj,2, ..., pj,m), and the best position found so far by the whole swarm, Pg = (pg,1, pg,2, ..., pg,m). The particle velocity vj and the position xj in the (i + 1) th iteration are calculated according to:
v j i + 1 = w v j i + c 1 r 1 p j x j i + c 2 r 2 p g x j i
x j i + 1 = x j i + v j i
where w is the inertia weight, c1 and c2 are the positive constants, and r1 and r2 are uniformly distributed random numbers in [0, 1].
The PSO flow can be described in the following steps:
  • Step 1: initialize the population positions and velocities of particles;
  • Step 2: update the time, the inertia weight and the velocities;
  • Step 3: update the positions based on the updated velocities;
  • Step 4: update the individual best by evaluating each particle according to its updated position;
  • Step 5: update the global best by searching for the minimum value among individual bests;
  • Step 6: test if one of the stopping criteria is satisfied. If yes, then stop; if not, then go to step 2.

5.2. Bushing Optimization

In this paper, the PSO was executed on a 2.90 GHz i7-4910MQ Intel Core. In the implementation, six optimization parameters, kx_FL, ky_FL, kx_FR, ky_FR, kx_RR and ky_RR, were contained in the problem. The upper and lower boundaries of the optimization parameters were set as 50% and 150% of their baseline values. The overall VDV at the driver seat rail was considered as the objective function given as following (ISO 2631-1: 1997):
VDV = k x VDV x 4 + k y VDV y 4 + k z VDV z 4 1 / 4
where the subscripts x, y and z represent the fore-and-aft, lateral and vertical directions, and kx, ky and kz were the multiplying factors in the corresponding directions. In this paper, the VDVs were calculated at the feet positions so that kx = 0.25, ky = 0.25 and kz = 0.4 were used according to ISO 2631-1:1997.
To improve the ride quality of the vehicle, the objective of the optimization was set as minimizing the overall VDV at the driver seat rail. For the algorithm parameters, the initial inertia weight was chosen as 0.9, the population size was 40, the number of particles was 5 and c1 = c2 = 2. The iteration will be terminated if the average cumulative change of the overall VDV over 50 generations was less than 1 × 10⁻⁶ or the number of iterations reached 500.
The six optimized stiffness of the four bushings were obtained as: {kx_FL, ky_FL, kx_FR, ky_FR, kx_RR, ky_RR} = {1.50, 0.99, 0.94, 1.13, 1.04, 1.05} times the baseline values. It means to achieve the best ride under a shock input at 35 km/h, the longitudinal and lateral stiffness of the front left differential bushing should increase by 50% and decrease by 1% respectively, those of the front right rear drive unit bushing should decrease by 6% and increase by 13% respectively, and those of the rear drive unit bushings should increase 4% and 5% respectively.

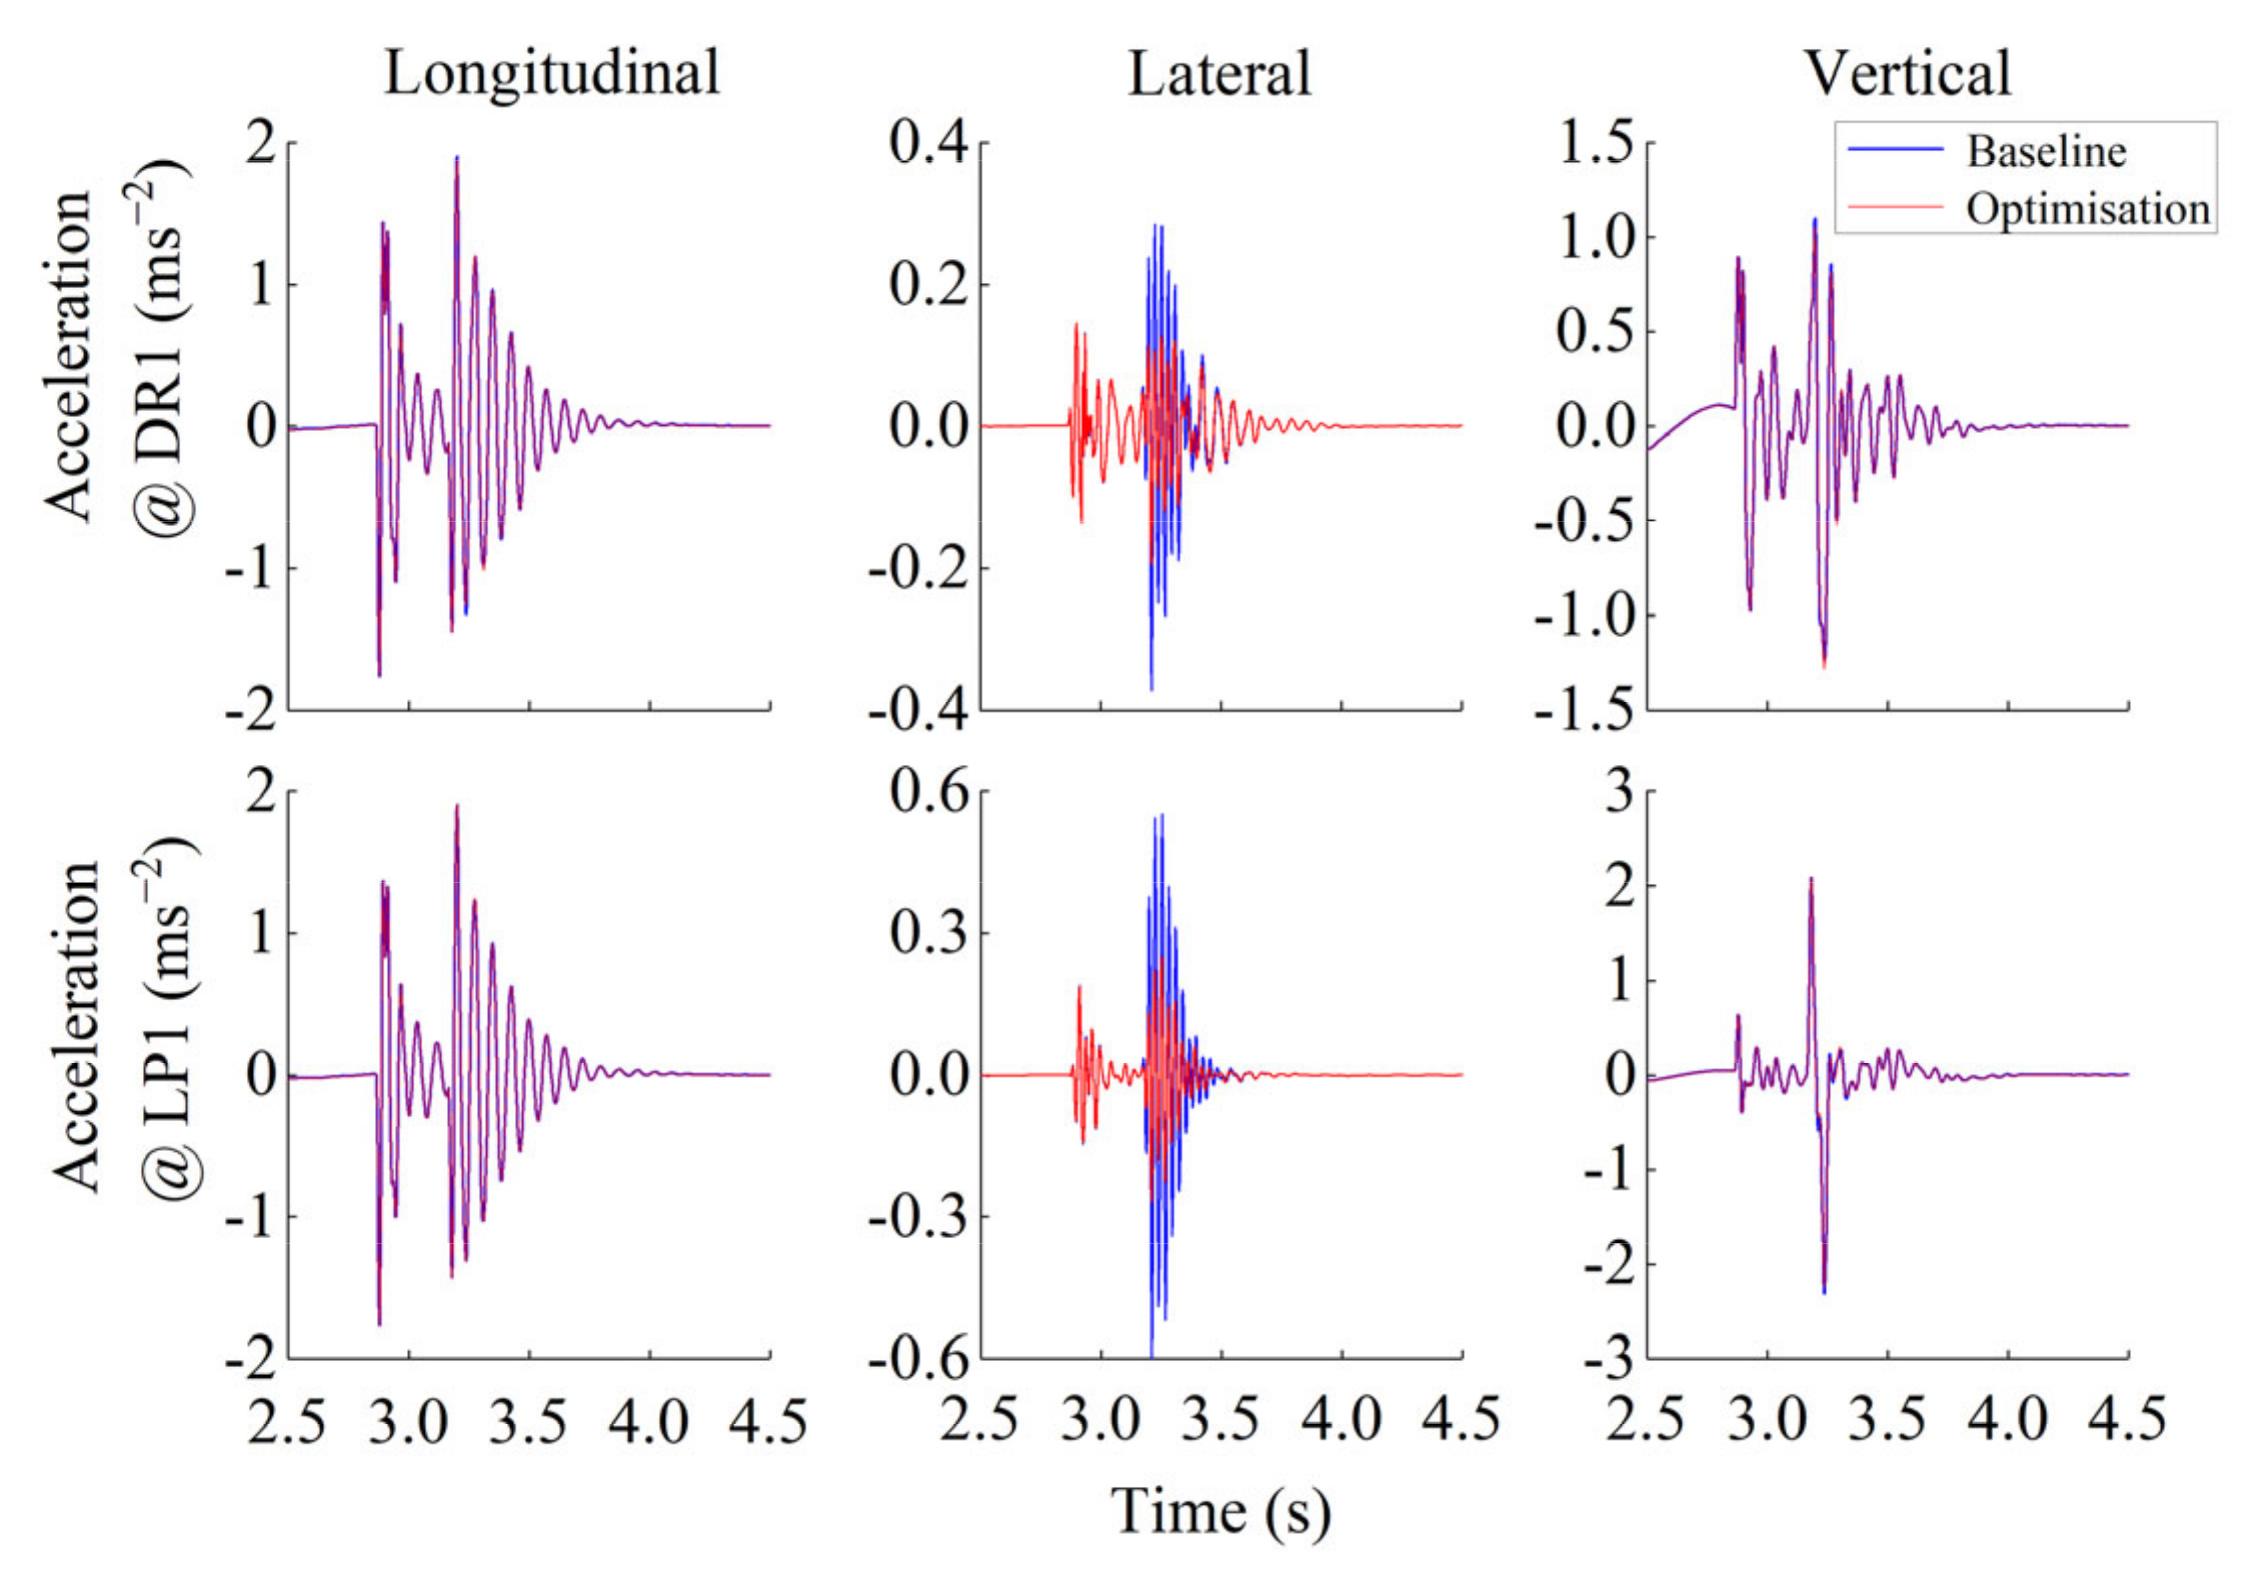
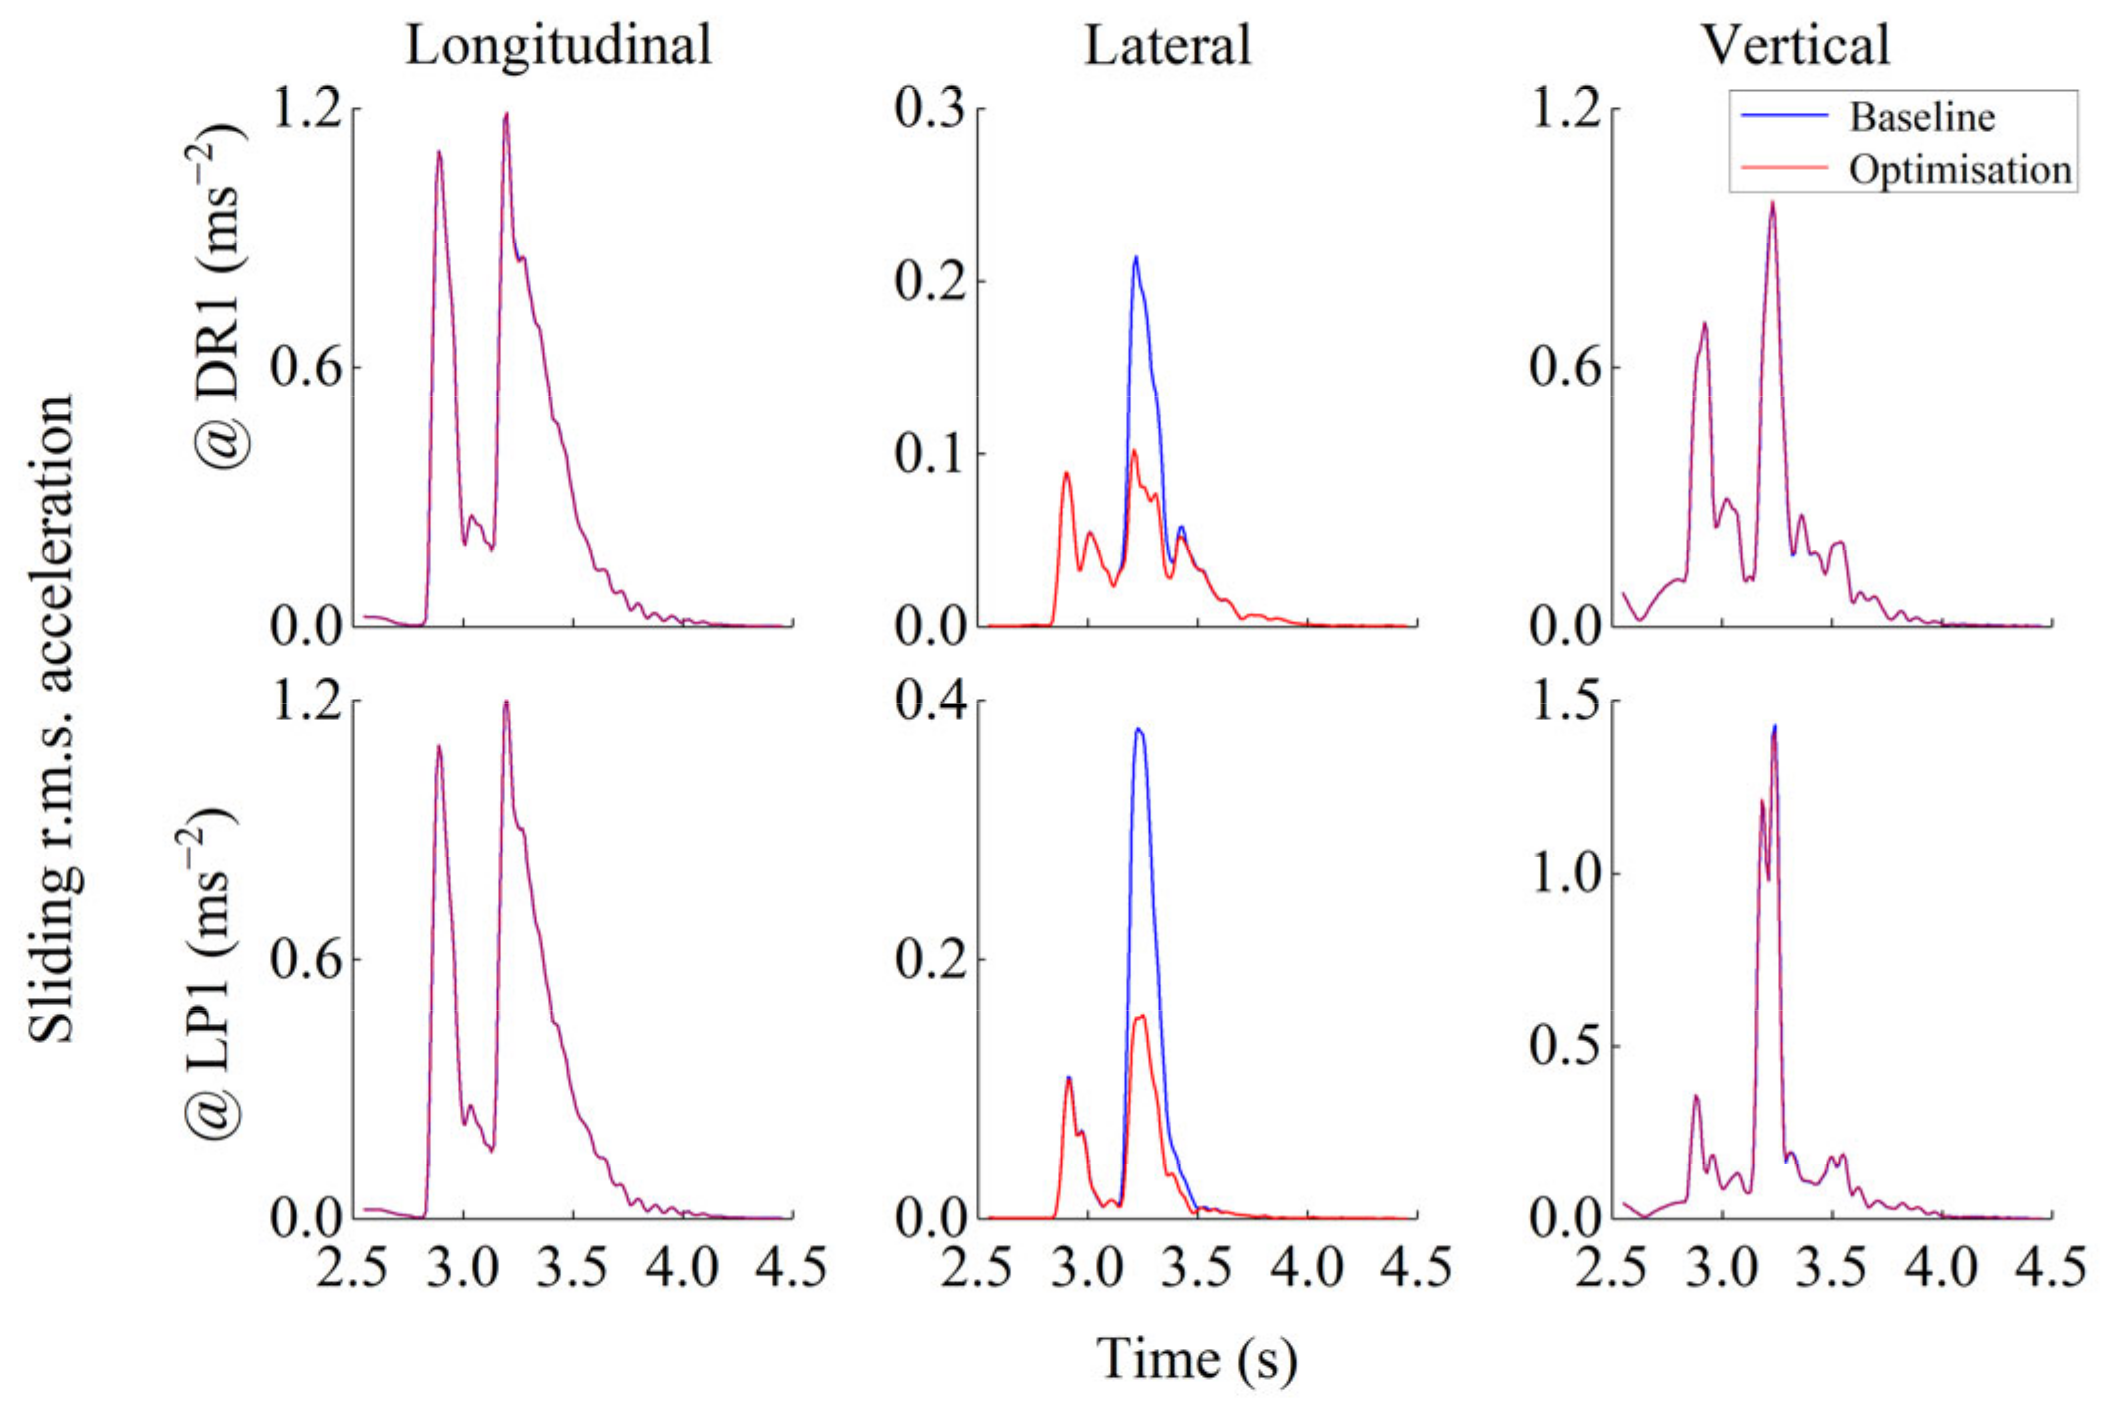
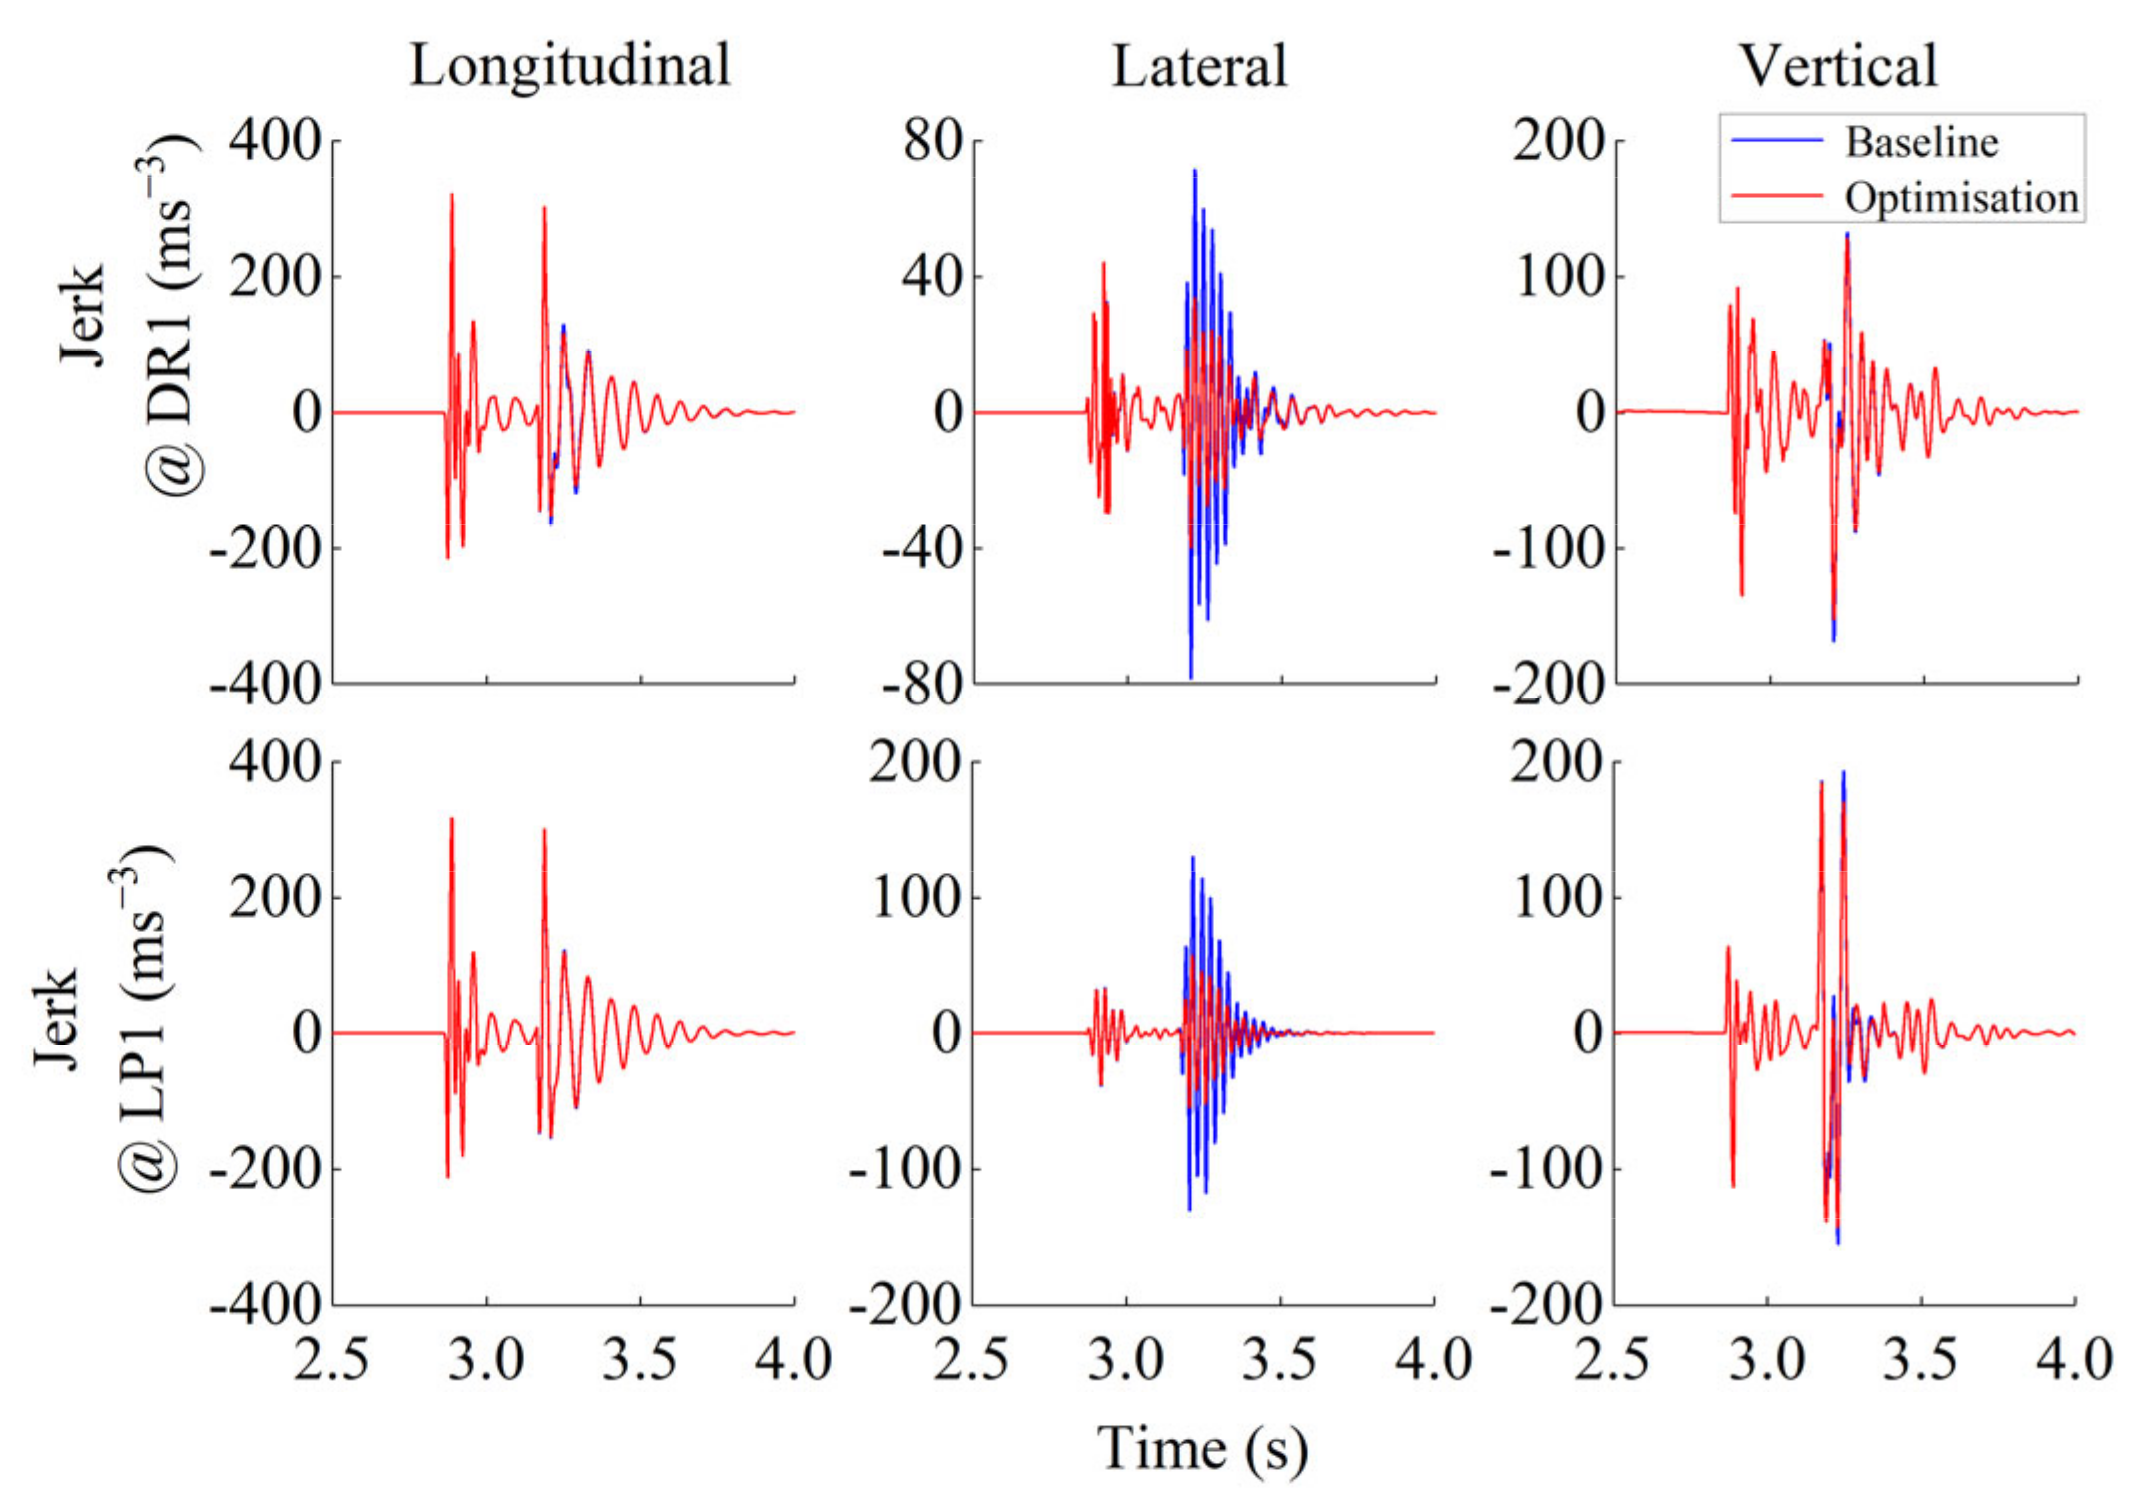
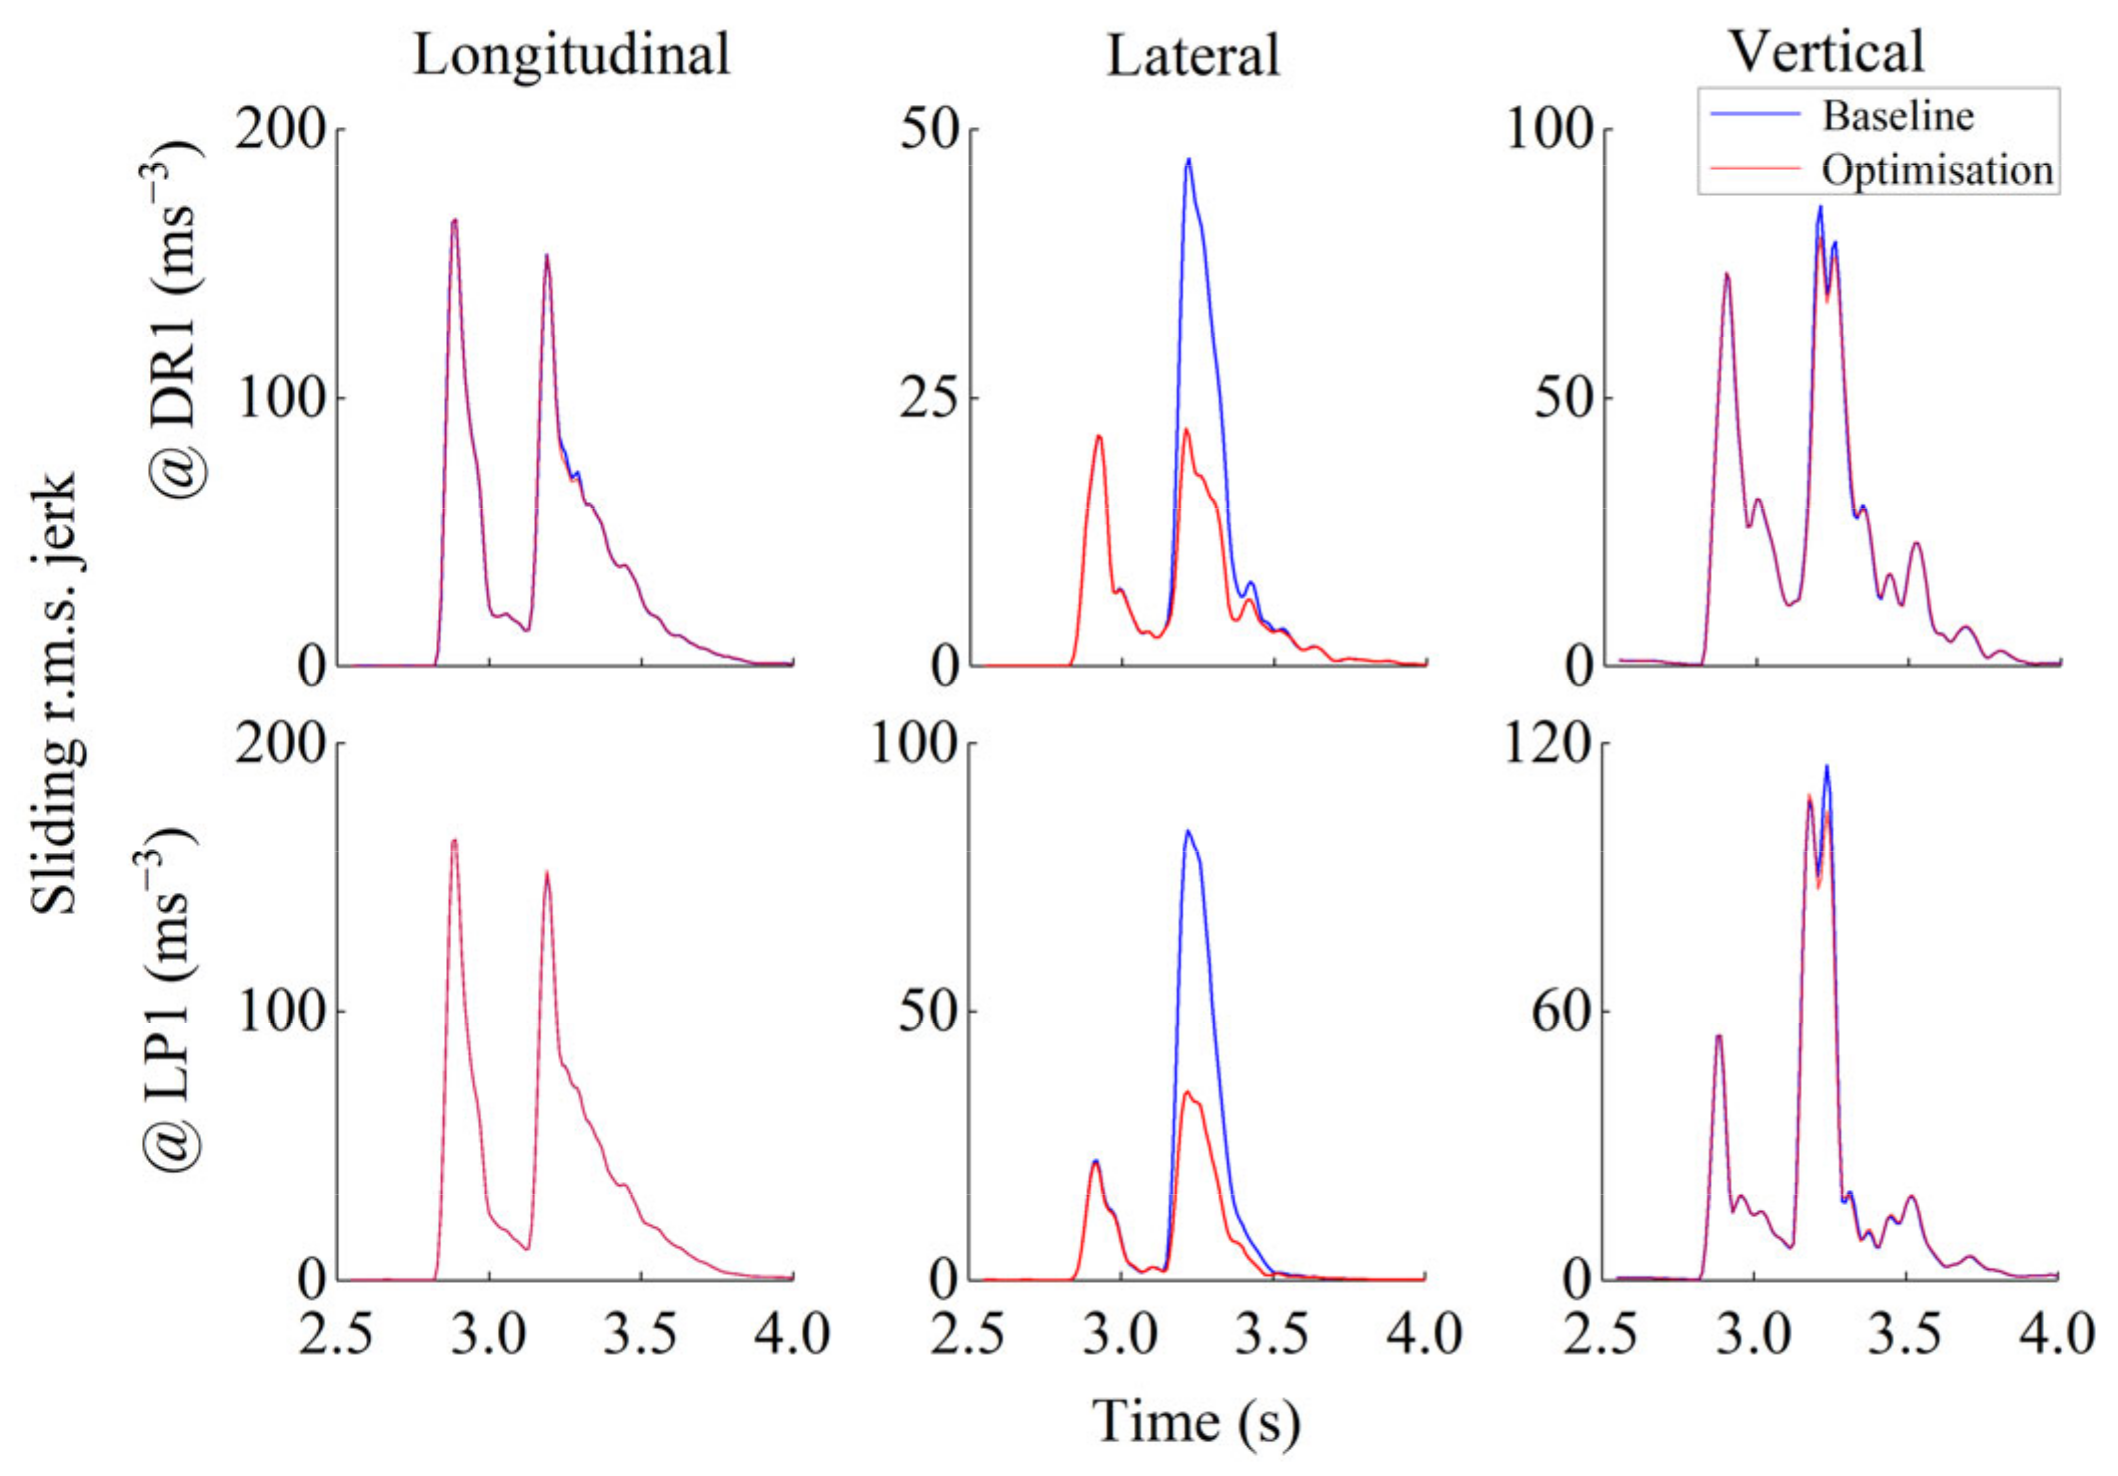
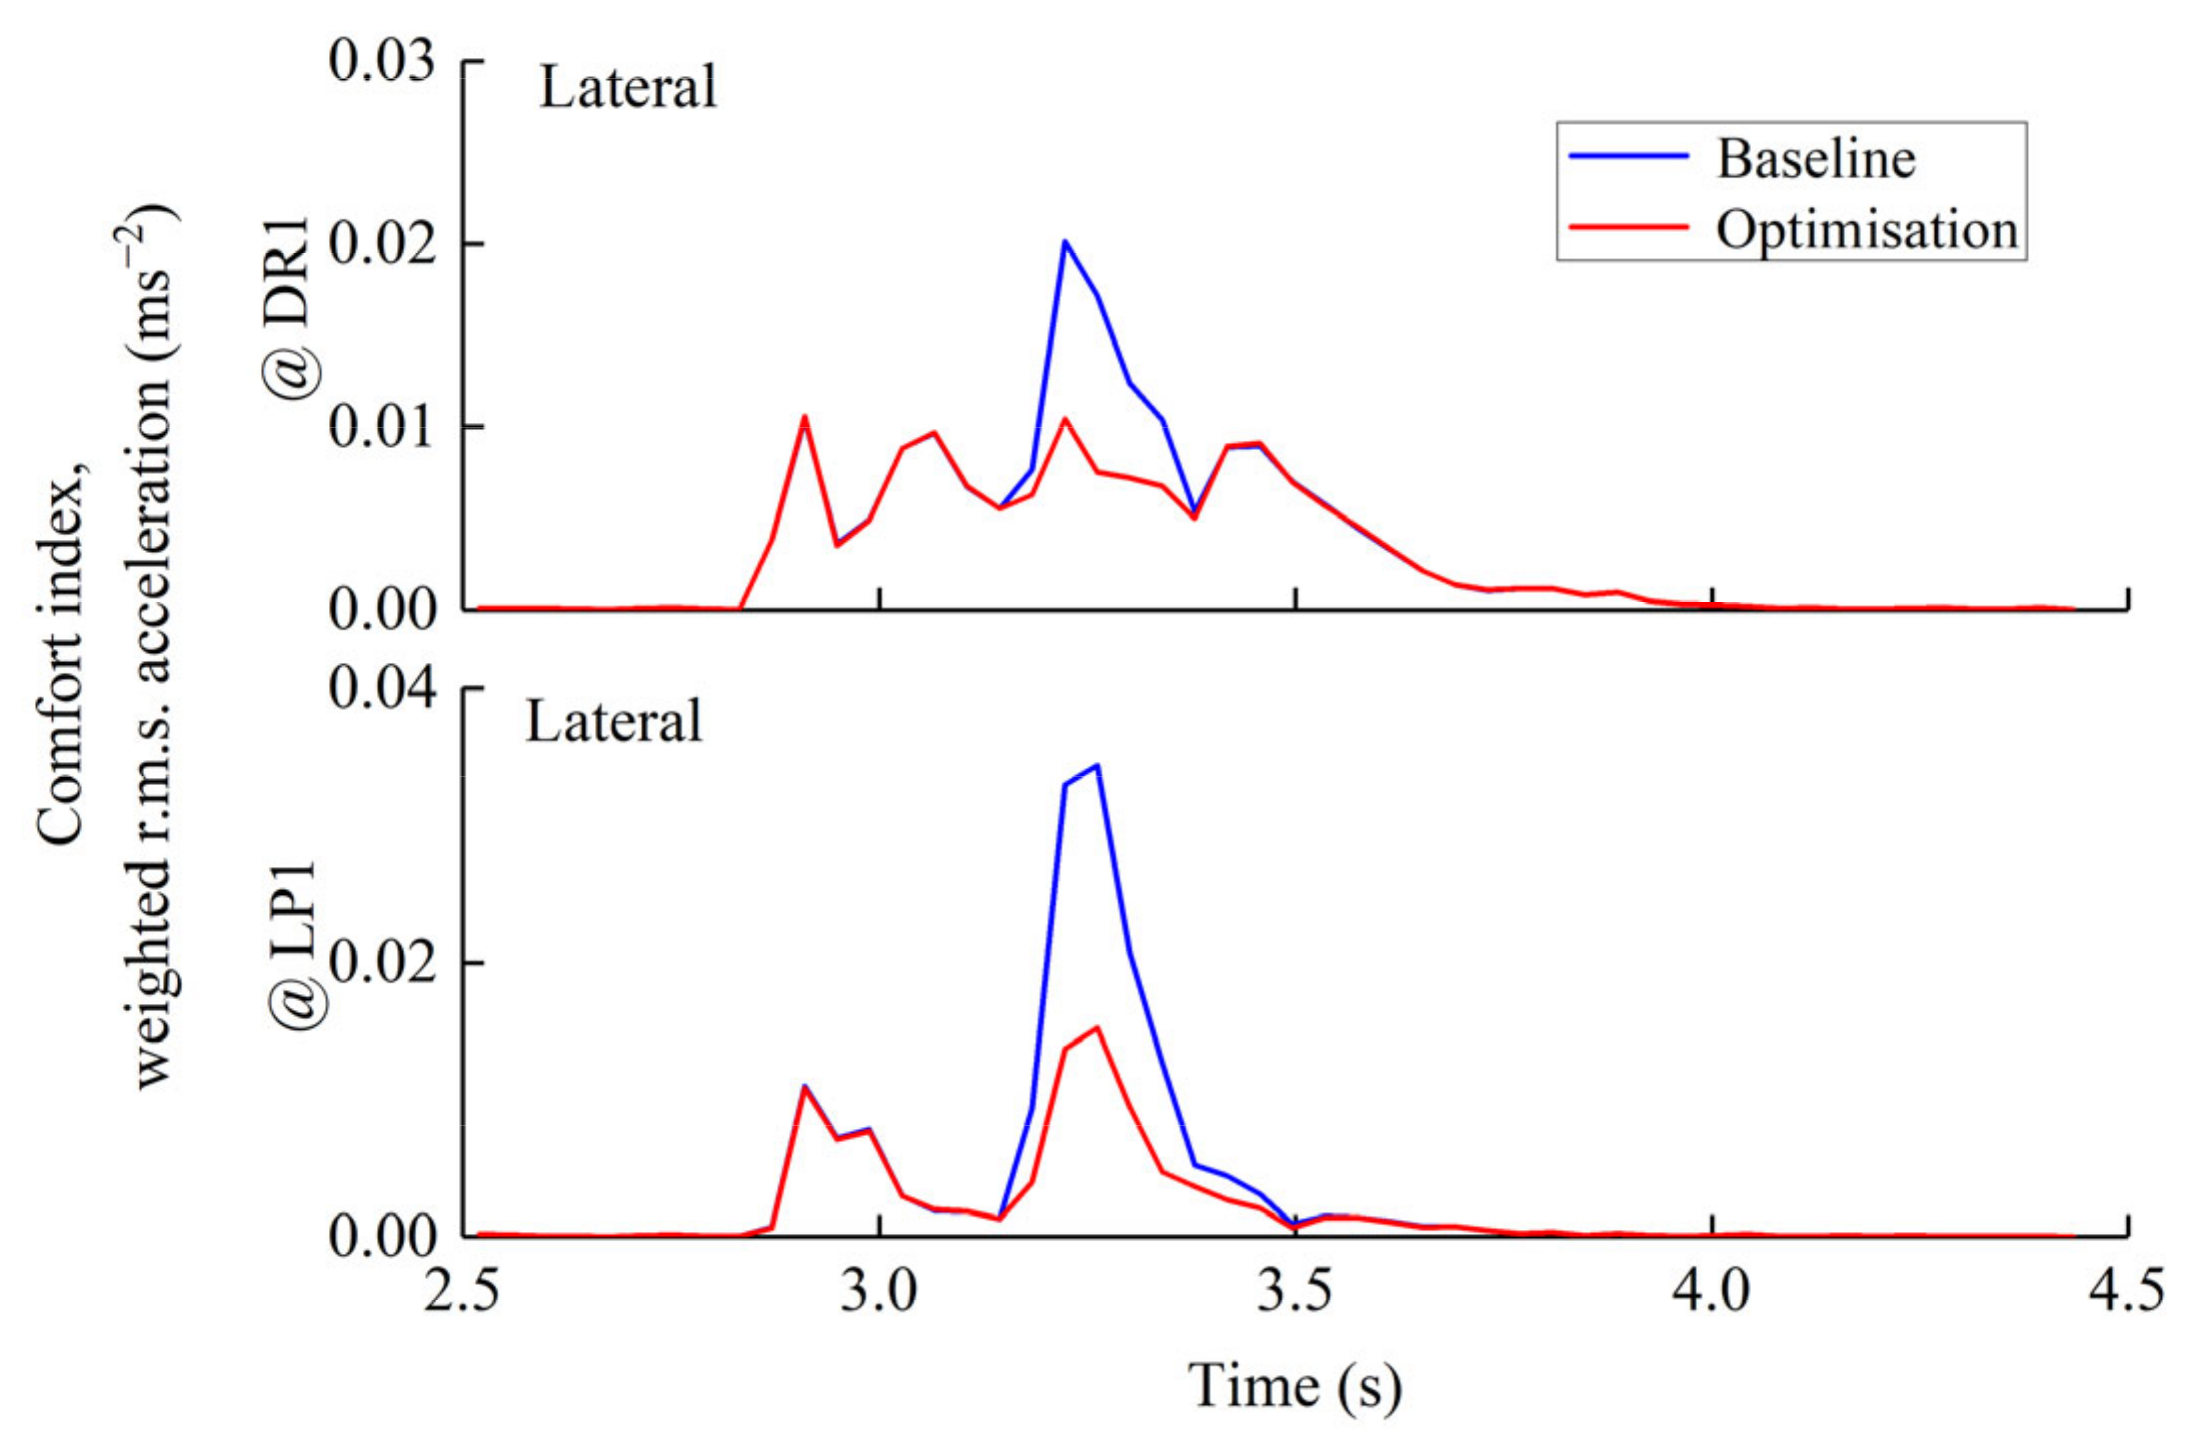
5.3. Optimized Ride Vibration

To find out the performance of the optimized differential bushings, the VDVs and the running r.m.s. acceleration at the driver seat rail in all three translational directions were calculated with the MBD model. The comparison between the VDV calculated with the baseline parameters and the optimized parameters at the driver seat rail (VDVDR) and at the rear left passenger seat base (VDVLP) is listed in Table 3.
It is shown that the optimized lateral VDVDR decreased by 47.5% compared with the baseline case. Improvements were also found in the fore-and-aft and vertical directions, although slight (about 1%). As discussed in the sensitivity analysis, the fore-and-aft and vertical vibrations at the driver seat rail were not sensitive to the change of the stiffness of differential bushings. As such, the improvement in ride quality in these two directions were limited through optimizing the differential bushing. For this reason, the overall VDVDR did not show apparent reduction after the optimization. Nevertheless, the reduction of the VDVDR reached 46.7% in the lateral direction after the optimization.
The acceleration time histories at DR and LP before and after the optimization are shown in Figure 8. It can be seen the second peak of the lateral acceleration at DR when the rear axle crossed the obstacle was significantly reduced by 60% (from 0.28 to 0.11 m/s2) through the optimization of the differential bushings. Similarly, for the LP seat, the peak acceleration in the lateral direction was decreased by 55% from 0.55 m/s2 to 0.25 m/s2. In terms of the fore-and-aft and vertical directions, the bushing optimization did not show any adverse effects on the accelerations at the two seat positions.
The running r.m.s. accelerations at the DR and LP are given in Figure 9. Same pattern can be found that the second peaks in the lateral direction were greatly reduced from 0.21 to 0.10 m/s2 (for the DR) and from 0.38 to 0.15 m/s2 (for the LP) respectively. While the differences of the running r.m.s. acceleration in the other two directions were hardly noticeable.
The jerk (Figure 10), which is the rate of the change of acceleration and usually used for evaluating the impact response, indicates that the optimization of the differential bushings benefits more the vibration absorption on the second peak corresponding to the rear wheels hitting the bump. The running r.m.s. jerk also shows same trend (Figure 11). These results were consistent with the fact that the differential was situated right upon the rear axle. The relatively localized differential vibration was transmitted through the bushings to the rear subframe where the rear suspensions were attached.
The comforts according to the ISO 2631-1: 1997 were calculated for the baseline and the optimized vehicle. In the lateral direction, as shown in Figure 12, the weighted acceleration peak of the baseline vehicle was eliminated by optimizing the differential bushing. Although there was a large variation between individuals in their perception of vibration. The vibration at the driver and the rear passenger seats were reduced below the median perception threshold (about 0.015 m/s2). It is, for the optimized vehicle, very likely that the driver or the passenger could not perceive any vibration in the lateral direction when the vehicle hit a bump at low speeds. The approach presented in this paper was demonstrated to be a feasible and effective method for optimizing dynamic performance of a mounting system. The methodology may be extended to optimizing performances of other vehicle substructures.

6. Conclusions

Driveline bushings had considerable effects on the ride comfort in the lateral direction while that in the fore-and-aft and vertical directions was found to be insensitive to the driveline bushing properties.
The relationship between the dynamic responses at seat rails and the driveline bushing parameters can be established through response functions. It benefits the computational efficiency of large-scale vehicle-level modeling and provides a feasible and effective approach for optimizing the dynamic performances of vehicle.
The lateral vibration was reduced to a quite low level even below the median perception threshold of human being. As a result, the ride comfort in the lateral direction was significantly improved by optimizing the bushing stiffness without disturbing the responses to vibration in vertical and fore-and-aft directions.
It is noticed that the conclusions were drawn under the specific test condition that was applied in the paper. It is unclear whether the conclusions were still correct under different circumstances such as height of the obstacle, the vehicle speed and the chassis structure of vehicle. Further work is expected to investigate the applicability of the conclusions and the factors that affect the ride comfort in fore-and-aft and vertical directions to benefit the improvement of it in the multidirection.

Author Contributions

Conceptualization: P.G. and Z.L.; modelling and Validation: J.L. (Jinlu Li) and P.G.; formal analysis: P.G. and Z.L.; writing—original draft preparation: P.G.; writing—review and editing: Z.L.; supervision: J.L. (Jiewei Lin); Funding acquisition: J.L. (Jiewei Lin). All authors have read and agreed to the published version of the manuscript.

Funding

This Research is funded by Project 51705357 supported by National Natural Science Foundation of China, the Project 18JCQNJC05500 and Project 18JCYBJC20000 supported by Tianjin Natural Science Foundation.

Institutional Review Board Statement

Not applicable.

Informed Consent Statement

Not applicable.

Data Availability Statement

The data are subject to release restrictions and are not publicly available.

Conflicts of Interest

The authors declare no conflict of interest.

References

  1. Zheng, X.; Hao, Z.; Wang, X.; Mao, J. A full-spectrum analysis of high-speed train interior noise under multi-physical-field coupling excitations. Mech. Syst. Signal Process. 2016, 75, 525–543. [Google Scholar] [CrossRef]
  2. Choi, B.C.; Cho, S.; Kim, C.-W. Sequential Approximate Optimization of MacPherson Strut Suspension for Minimizing Side Load by Using Progressive Meta-Model Method. Int. J. Automot. Technol. 2018, 19, 455–461. [Google Scholar] [CrossRef]
  3. Eskandary, P.K.; Khajepour, A.; Wong, A.; Ansari, M. Analysis and optimization of air suspension system with independent height and stiffness tuning. Int. J. Automot. Technol. 2016, 17, 807–816. [Google Scholar] [CrossRef]
  4. Suh, K.; Yoon, H. Design Optimization of a Rear Independent Suspension for the Korean Light Tactical Vehicle. Int. J. Automot. Technol. 2018, 19, 245–252. [Google Scholar] [CrossRef]
  5. Lin, J.; Lin, Z.; Ma, L.; Xu, T.; Chen, D.; Zhang, J. Analysis and optimization of coupled vibration between substructures of a multi-axle vehicle. J. Vib. Control. 2019, 25, 1031–1043. [Google Scholar] [CrossRef]
  6. Zhang, J.; Guo, P.; Lin, J.; Wang, K. A mathematical model for coupled vibration system of road vehicle and coupling effect analysis. Appl. Math. Model. 2016, 40, 1199–1217. [Google Scholar] [CrossRef]
  7. Wang, Y.; Zhao, W.; Zhou, G.; Gao, Q.; Wang, C. Suspension mechanical performance and vehicle ride comfort applying a novel jounce bumper based on negative Poisson’s ratio structure. Adv. Eng. Softw. 2018, 122, 1–12. [Google Scholar] [CrossRef]
  8. Ambrósio, J.; Veríssimo, P. Sensitivity of a vehicle ride to the suspension bushing characteristics. J. Mech. Sci. Technol. 2009, 23, 1075–1082. [Google Scholar] [CrossRef]
  9. Papaioannou, G.; Koulocheris, D. An approach for minimizing the number of objective functions in the optimization of vehicle suspension systems. J. Sound Vib. 2018, 435, 149–169. [Google Scholar] [CrossRef]
  10. Moheyeldein, M.M.; Abd-El-Tawwab, A.M.; Abd El-Gwwad, K.A.; Salem, M. An analytical study of the performance indices of air spring suspensions over the passive suspension. Beni-Suef Univ. J. Basic Appl. Sci. 2018, 7, 525–534. [Google Scholar] [CrossRef]
  11. Sim, K.; Lee, H.; Yoon, J.W.; Choi, C.; Hwang, S.-H. Effectiveness evaluation of hydro-pneumatic and semi-active cab suspension for the improvement of ride comfort of agricultural tractors. J. Terramech. 2017, 69, 23–32. [Google Scholar] [CrossRef]
  12. Khameneifar, F.; Arzanpour, S.; Moallem, M. Piezo-actuated active decoupler hydraulic engine mount. In ASME International Mechanical Engineering Congress and Exposition; ASME: New York, NY, USA, 2010; pp. 195–200. [Google Scholar]
  13. Lee, D.H.; Hwang, W.S.; Kim, C.M. Design sensitivity analysis and optimization of an engine mount system using an FRF-based substructuring method. J. Sound Vib. 2002, 255, 383–397. [Google Scholar] [CrossRef]
  14. Shangguan, W.B.; Zhao, Y. Dynamic analysis and design calculation methods for powertrain mounting systems. Int. J. Automot. Technol. 2007, 8, 731–744. [Google Scholar]
  15. El Hafidi, A.; Martin, B.; Loredo, A.; Jego, E. Vibration reduction on city buses: Determination of optimal position of engine mounts. Mech. Syst. Signal Process. 2010, 24, 2198–2209. [Google Scholar] [CrossRef]
  16. Kaul, S.; Dhingra, A.K. Engine mount optimisation for vibration isolation in motorcycles. Veh. Syst. Dyn. 2009, 47, 419–436. [Google Scholar] [CrossRef]
  17. Kalsule, D.; Hudson, D.; Yeola, Y.; Bohari, J. Structure Borne Noise and Vibration Reduction of a Sports Utility Vehicle by Body-Mount Dynamic Stiffness Optimization. SAE Tech. Pap. Ser. 2011. [Google Scholar] [CrossRef]
  18. Xu, P.; Bernardo, B.; Tan, K. Optimal mounting design for cab vibration isolation. Int. J. Veh. Des. 2011, 57, 292–304. [Google Scholar] [CrossRef]
  19. Ramachandran, T.; Padmanaban, K.P. Minimization of IC engine rubber mount displacement using genetic algorithm. Int. J. Adv. Manuf. Technol. 2013, 67, 887–898. [Google Scholar] [CrossRef]
  20. Shital, P.; Ghosh, C.; Talwar, H.; Gosain, A.; Dayal, P.S. A Study of Engine Mount Optimisation of Three-Cylinder Engine through Multi-Body Dynamic Simulation and Its Verification by Vehicle Measurement. SAE Tech. Pap. Ser. 2015. [Google Scholar] [CrossRef]
  21. Ooi, L.-E.; Ripin, Z.M. Optimization of an engine mounting system with consideration of frequency-dependent stiffness and loss factor. J. Vib. Control. 2016, 22, 2406–2419. [Google Scholar] [CrossRef]
  22. Zhang, B.; Zhan, H.; Gu, Y. A general approach to tune the vibration properties of the mounting system in the high-speed and heavy-duty engine. J. Vib. Control. 2016, 22, 247–257. [Google Scholar] [CrossRef] [Green Version]
  23. Lin, J.; Qiu, Y. Sensitivity analysis of a lightweight rear differential unit on ride comfort of a sport utility vehicle. In Proceedings of the 50th UK Conference on Human Response to Vibration, Southampton, UK, 9–10 September 2015; pp. 187–198. [Google Scholar]
  24. Lin, J.; Qiu, Y. Mathematical Modelling of the Rear Drive Unit of a Lightweight Vehicle for Sensitivity Analysis of Vibration. In Proceedings of the ASME 2016 International Design Engineering Technical Conferences and Computers and Information in Engineering Conference, Charlotte, NC, USA, 21–24 August 2016; p. V003T001A017. [Google Scholar]
  25. Zhang, X.; Zhang, Q.; Li, Y.; Liu, C.; Qiu, Y. Effect of the thickness of polyurethane foams at the seat pan and the backrest on fore-and-aft in-line and vertical cross-axis seat transmissibility when sitting with various contact conditions of backrest during fore-and-aft vibration. Appl. Ergon. 2021, 93, 103354. [Google Scholar] [CrossRef] [PubMed]
  26. Liu, C.; Qiu, Y. Nonlinearity in the localised apparent masses of the seated human body exposed to vertical vibration. Mech. Syst. Signal Process. 2020, 135, 106394. [Google Scholar] [CrossRef]
  27. Lin, Z.; Zhang, J.; Li, J.; Yin, W.; Liu, C.; Lin, J. Biodynamic Response of Seated Human Body to Roll Vibration and Correlation between Roll and Lateral Directions. Shock. Vib. 2020, 2020, 1–12. [Google Scholar] [CrossRef]
  28. Zhou, Z.; Griffin, M.J. Response of the seated human body to whole-body vertical vibration: Discomfort caused by mechanical shocks. Ergonomics 2017, 60, 347–357. [Google Scholar] [CrossRef] [PubMed]
  29. Huang, Y.; Zhang, P. Subjective discomfort caused by vertical whole-body vibration in the frequency range 2–100 Hz. Ergonomics 2019, 62, 420–430. [Google Scholar] [CrossRef] [PubMed]
  30. Beard, G.F.; Griffin, M.J. Discomfort caused by low-frequency lateral oscillation, roll oscillation and roll-compensated lateral oscillation. Ergonomics 2013, 56, 103–114. [Google Scholar] [CrossRef] [Green Version]
  31. ISO. Mechanical Vibration and Shock: Evaluation of Human Exposure to Whole-body Vibration. Part 1, General Requirements; ISO: Geneva, Switzerland, 1997. [Google Scholar]
  32. Myers, R.H.; Montgomery, D.C.; Anderson-Cook, C.M. Response Surface Methodology: Process and Product Optimization Using Designed Experiments; John Wiley & Sons: Hoboken, NJ, USA, 2016. [Google Scholar]
  33. Zhang, H.; Kennedy, D.D.; Rangaiah, G.P.; Bonilla-Petriciolet, A. Novel bare-bones particle swarm optimization and its performance for modeling vapor–liquid equilibrium data. Fluid Phase Equilibria 2011, 301, 33–45. [Google Scholar] [CrossRef]
Figure 1. Schematic of local subsystem of rear differential and rear subframe.
Applsci 11 02647 g001
Figure 2. Speed bump used in the test.
Applsci 11 02647 g002
Figure 3. The accelerometer mounted at the driver seat rail.
Applsci 11 02647 g003
Figure 4. Comparison between calculated and measured running r.m.s acceleration at the driver seat rail.
Applsci 11 02647 g004
Figure 5. Variation of vibration dose value (VDV) at seat rails due to changes of bushing stiffness and damping.
Applsci 11 02647 g005
Figure 6. Standardized effects of significant parameters on the lateral VDV at seat rails.
Applsci 11 02647 g006
Figure 7. Main effects of significant parameters on the VDV at seat rails.
Applsci 11 02647 g007
Figure 8. Comparison of accelerations at seat rails between the baseline and optimized models.
Applsci 11 02647 g008
Figure 9. Comparison of running r.m.s. accelerations at seat rails between the baseline and optimized models.
Applsci 11 02647 g009
Figure 10. Comparison of running r.m.s. accelerations at seat rails between the baseline and optimized models.
Applsci 11 02647 g010
Figure 11. Comparison of sliding r.m.s. jerk at seat rails between the baseline and optimized models.
Applsci 11 02647 g011
Figure 12. Comparison of lateral comfort indices at feet between the baseline and optimized models.
Applsci 11 02647 g012
Table 1. Properties of the bushings.
BushingGeometry Properties
Dynamic Rate (×105 N/m)Loss Angle (Degree)
xyzxyz
Left-FrontΦ 0.08 m × 0.05 m8.04.515555
Right-FrontΦ 0.08 m × 0.05 m184.620555
RearΦ 0.04 m × 0.075 m2.4208.0555
Table 2. Test samples and comparison of VDVs at the driver seat rail between multibody dynamics (MBD) and response surface method (RSM).
kx,FLky_FLkx_FRky_FRkx_RRky_RRVDV (m/s−1.75)
MBDRSM
xyzxyz
11.21.30.91.00.81.00.820.100.700.820.100.70
20.51.20.90.91.21.50.830.190.720.820.200.73
30.80.81.31.11.20.80.840.210.710.850.220.71
40.61.41.31.20.71.00.830.180.710.830.190.71
50.60.50.71.30.60.70.820.190.730.820.200.75
Table 3. Comparison of VDVs between the baseline and the optimized bushings.
VDV (m/s−1.75)DirectionBaselineOptimized
DriverFore-and-aft0.790.78
Lateral0.130.07
Vertical0.550.55
Left passengerFore-and-aft0.790.79
Lateral0.230.10
Vertical0.840.83
Publisher’s Note: MDPI stays neutral with regard to jurisdictional claims in published maps and institutional affiliations.

