Article

Additive Manufacturing of Porous Ti6Al4V Alloy: Geometry Analysis and Mechanical Properties Testing

1
Department of Biomedical Engineering, Faculty of Mechanical Engineering, Technical University of Košice, Letná 9, 04200 Košice, Slovakia
2
Department of Physical Chemistry, Faculty of Science, P.J. Šafárik University in Košice, Moyzesova 11, 04154 Košice, Slovakia
3
Doctoral Academic Studies, Faculty of Medicine, University of Novi Sad, Hajduk Veljkova 3, 21000 Novi Sad, Serbia
4
Department of Stomatology and Maxilofacial Surgery, Faculty of Medicine, P.J. Šafárik University in Košice, SNP 1, 04011 Košice, Slovakia
*
Author to whom correspondence should be addressed.
Appl. Sci. 2021, 11(6), 2611; https://doi.org/10.3390/app11062611
Submission received: 25 February 2021 / Revised: 10 March 2021 / Accepted: 11 March 2021 / Published: 15 March 2021
(This article belongs to the Section Applied Biosciences and Bioengineering)

Abstract

:
This work is devoted to the research of porous titanium alloy structures suitable for use in biomedical applications. Mechanical properties were examined on six series of samples with different structures and porosity via static compressive test to identify the type of structure suitable for elimination of the “stress shielding” effect. In addition, high porosity is desirable due to the overgrowth of bone tissue into the internal structure of the implant. The samples were made of titanium alloy Ti6Al4V by using selective laser melting (SLM) additive manufacturing. The series of samples differ from each other in pore size (200, 400, and 600 µm) and porous structure topology (cubic or trabecular). The actual weight of all samples, which plays an important role in identifying other characteristics, was determined. Compressive tests were focused on the detection of maximum stress. The highest porosity and thus the lowest weight were achieved in the samples with a trabecular structure and 600 µm pore size. All tested samples reached optimal values of maximum stress and tensile strength. The most appropriate mechanical properties were observed for samples with a 200 µm pore diameter and cubic structure.

1. Introduction

Contemporary medicine uses the knowledge and possibilities of modern engineering extensively. This is significantly reflected in the field of the replacement of damaged bone segments [1]. The implants must meet special demands; therefore, they must be produced from the highest quality materials by using the most modern production technologies [2]. The implant properties are required to be as similar to the original biological bone as possible. Material must cause any problems for the patients and help them to live a full life at the same time [3]. Therefore, implants are expected to be biocompatible to the human body, able to perform their function for a long time, durable, easy-care, and maintainable [4]. Metallic materials are the best choice for most bone replacements [5]. Titanium alloys appear to be very attractive, mainly due to their low weight compared to other metals, favorable biocompatibility, and corrosion resistance. The downside of titanium alloys is the relatively high Young’s modulus (113 GPa) compared with human cortical bone (15 GPa to 20 GPa), which may adversely affect the healing process even for patients with a proper bone density [6]. Based on the fact that the reduction of α phase in titanium alloys diminishes Young’s modulus, Dai et al. designed and tested β phase titanium alloy with Young’s modulus around 65 GPa [7]. For instance, Arifin et al. enriched the titanium alloy with ceramic material hydroxyapatite (HA) to reduce Young’s modulus. Moreover, an increase in the biological activity of titanium was observed from in vivo and in vitro tests due to the introduction of HA [6,8]. Takemoto et al. performed compression and bending tests on porous titanium implants with a biomimetic calcium phosphate (CaP) coating to evaluate their mechanical properties [9]. Porous structures have several indisputable advantages, from reducing the weight of the implant while maintaining satisfactory mechanical properties to improving the osseointegration process and overgrowth of biological bone in the implant after its implantation into the body [10]. For fabrication of certain structures, additive manufacturing (AM) appears to be a very promising technique [11]. Technologies such as selective laser sintering (SLS), direct metal laser sintering (DMLS), and electron beam melting (EBM) operate on the principle of using high-power lasers to create mechanically effective structures [12,13]. SLS technology uses layer by layer building strategy defined in a predesigned computer-aided design (CAD) model [14]. The metal powder with a size of 20 μm to 100 μm is stored in a container from which it is applied in the vertical direction to the construction platform by a roller [15]. The whole process is carried out under an inert atmosphere (e.g., argon or nitrogen) to prevent oxidation and contamination of the powder during sintering. The surrounding unsintered material serves as a support for further layers and can be recycled at the end of the production process. For a detailed analysis of sintered porous material, the method of computed tomography (CT) as a nondestructive examination technique is appropriate to use. CT can be utilized for grain size, porosity and geometric analysis, defects identification, and structural evaluation [13]. The manufactured components require heat, machining, and polishing postprocessing treatment [16]. According to Tu et al., there is a great potential of AM in the production of dental implants. In their study, experimental porous Ti alloy dental implants, made by using DMLS, exhibited more bone formation than commercial implants [17]. Correspondingly, the results of the recent preclinical meta-analysis indicate that bone formation is improved when porous surface dental implants are used, compared to non-porous surface implants [18]. Structural factors in implants, including porosity level, pore size and pore interconnectivity, affect bone tissue ingrowth and differentiation. Increase in implant porosity leads to a decrease in compressive strength and elastic modulus to better match the mechanical properties of the host bone [19]. The importance of material porosity in biological applications plays an essential role in how the material will be accepted, whereas at low porosity the material will be far less appropriate than the material with higher porosity [20]. In the following scientific publications, the authors dealt with research of the mechanical properties of titanium alloy specimens with a porous structure with different topologies and porosity produced by additive manufacturing using selective laser melting (SLM) technology and the resulting mechanical properties of the prepared porous titanium materials affected the possibility of their using in specific implant applications [21,22,23]. However, the structures studied in this work represent unique inhomogeneous bone substitutes made by certified medical software that have not been tested for implantological purposes yet. The presented work was focused on the design and weight optimization of porous structures made of titanium alloy using additive technology and to reduce the stress shielding effect for use in biomedical engineering.

2. Materials and Methods

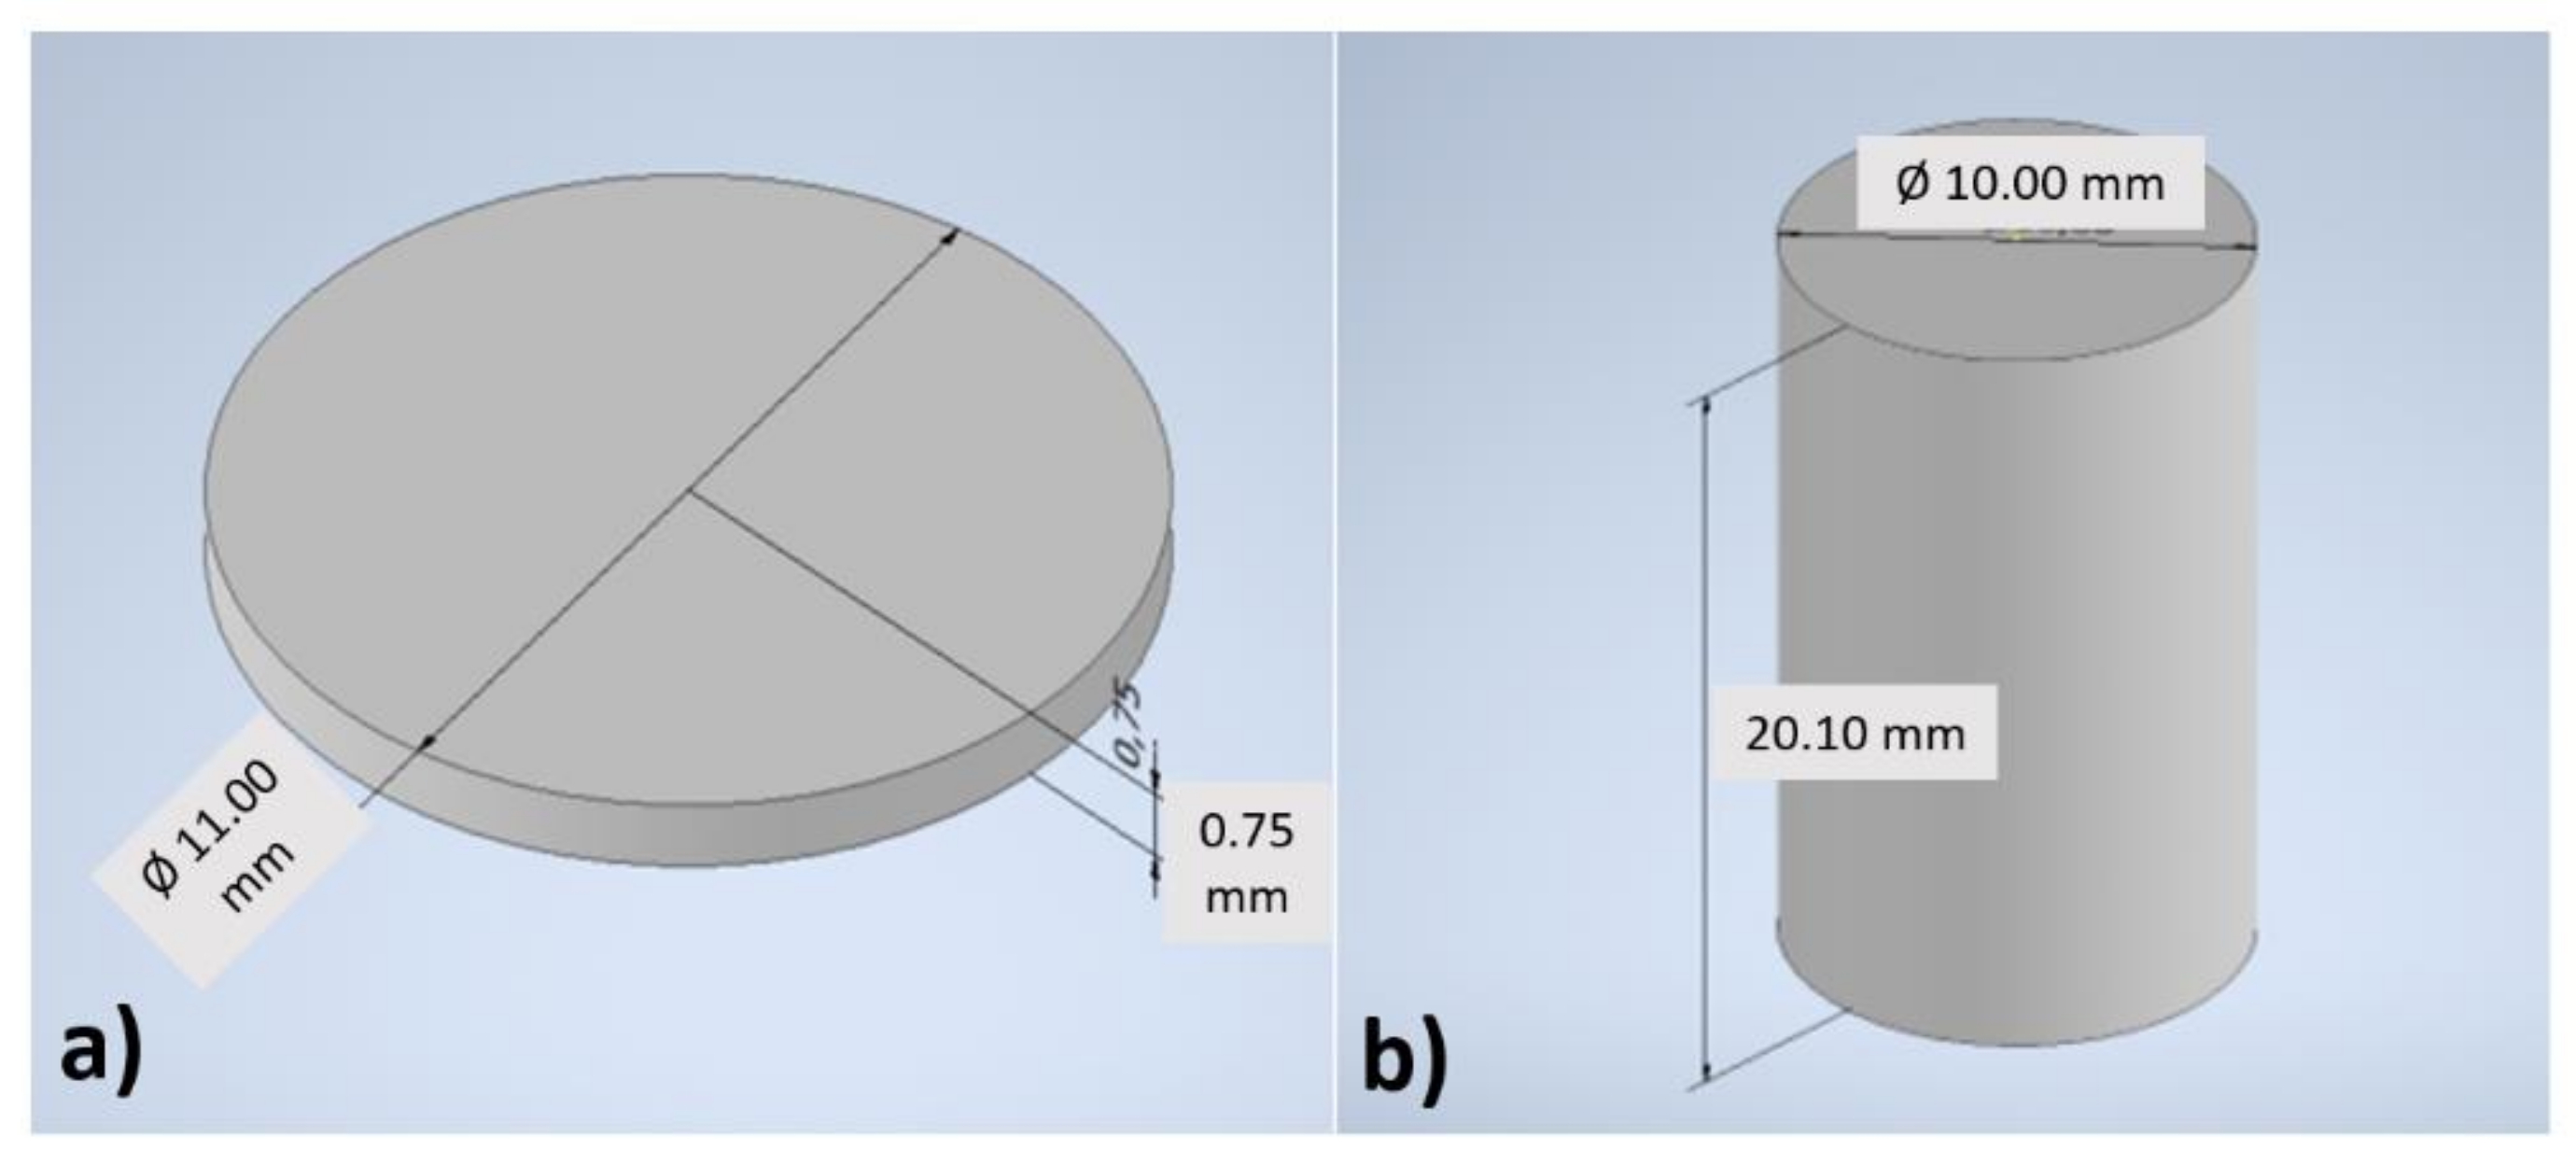
2.1. Sample Preparation

Experimental samples were prepared from a titanium Ti6Al4V alloy rematitan CL (Dentaurum, Germany), (composition and technical parameters are listed in Table 1 and Table 2) and designed according to the ISO 13314 standard, which is focused on the pressure tests of porous and cellular metals [24]. The dimensions of the tested specimens were also designed according to the ISO standard. In this study, cylindrical samples with a diameter of 10 mm and a height of 20 mm were selected. Ti6Al4V samples were prepared on the base sheet (diameter of 11 mm and height of 0.75 mm) which helps to produce and subsequently separate the specimen from the support without damage and allows anchoring the pores at the same time. Two types of porous structures were produced with a trabecular and cubic arrangement. Samples with pore sizes of 200 µm, 400 µm, and 600 µm of each structure were designed and produced. A solid, non-porous sample with the same dimensions was used as a reference.

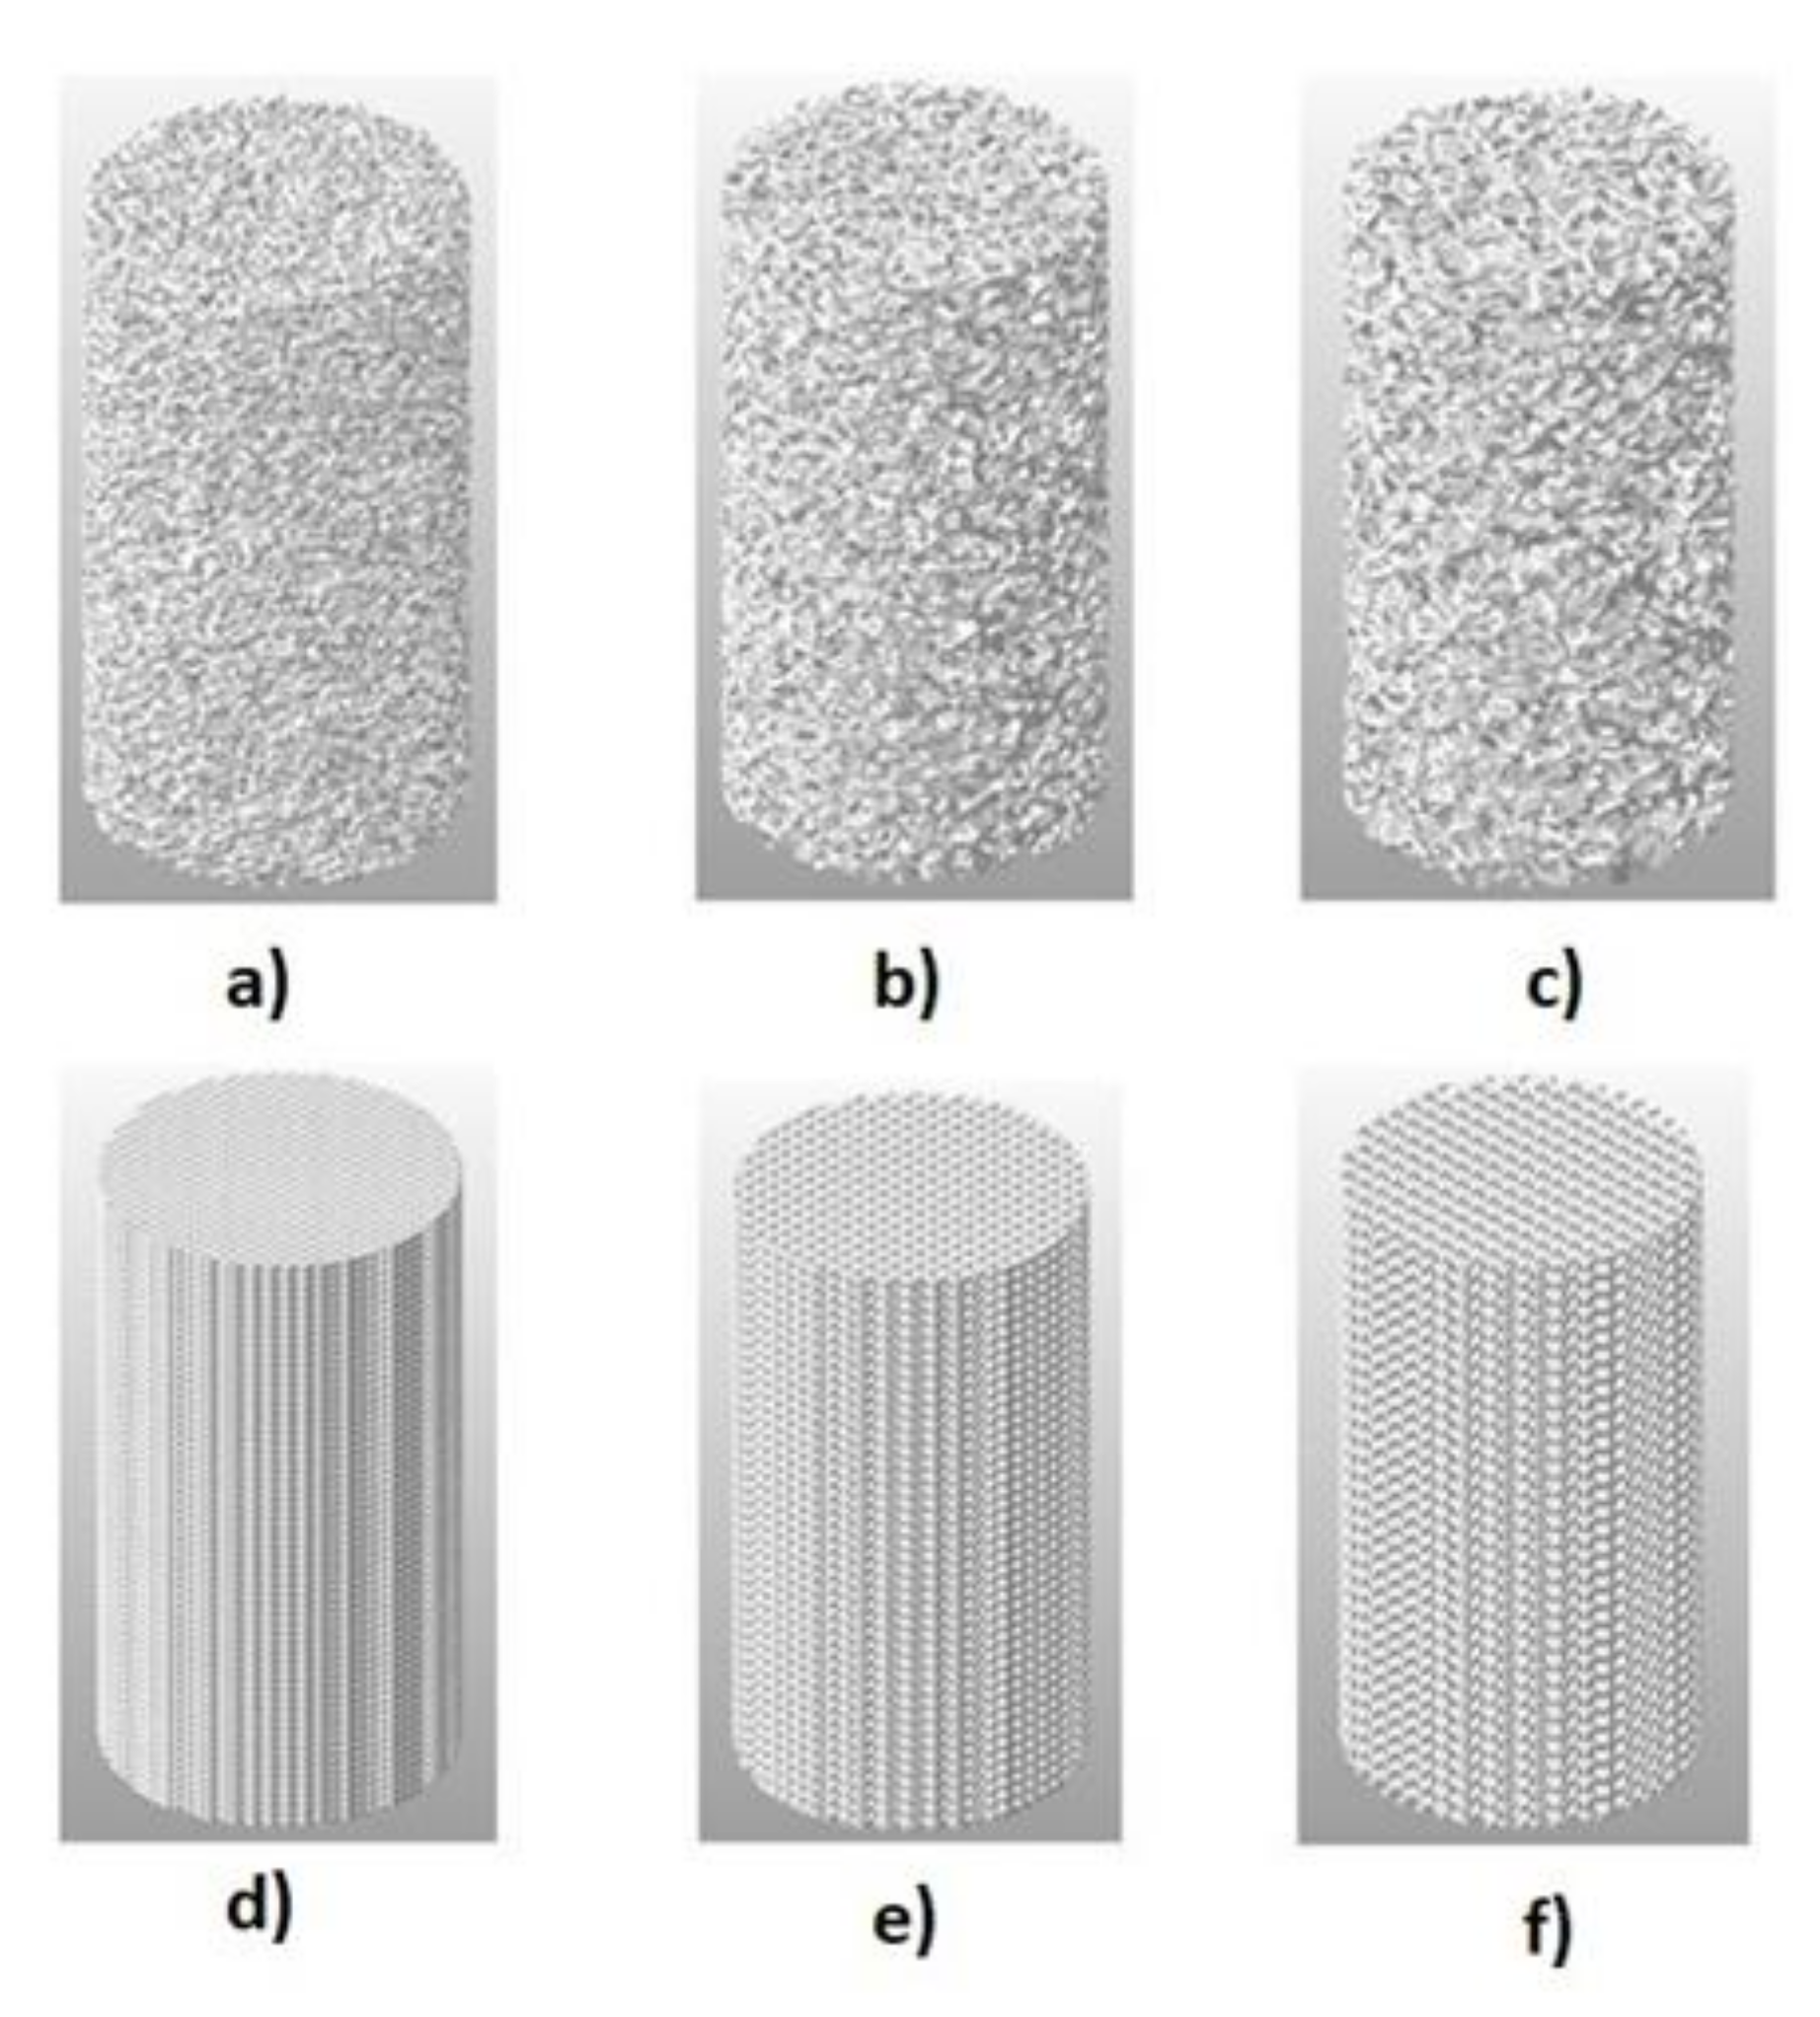
2.2. 3D Models Preparation

The design of the 3D computer-aided design (CAD) was produced in the Solidworks modeling software (Dassault Systèmes, Waltham, Québec, Canada). The model consists of two parts—the sample model and the base model. The division of the sample model into individual parts was necessary for the generation of the porous structure since only the sample have a porous structure. Figure 1 depicts a CAD model of a base (Figure 1a) and a CAD model of a sample (Figure 1b).
Extension of the height value of the sample model was necessary due to the penetration of the CAD model of the sample into the CAD model of the base during joining these two parts. Semi-automatic generation of the porous specimen structure was produced using Autodesk Within Medical software (Autodesk, San Rafael, California, USA) in partnership with Biomedical Engineering, Inc. (Košice, Slovakia). The CAD models of the specimens prepared this way were combined with the CAD model of the base. The support model with a height of 3 mm was created as well. Support was adjusted to the dimensions of the base of the samples. The prepared 3D CAD models in *.stl format served as input data for the additive production process. Six types of test samples (1–6) with two structures and three pore sizes (Table 3) were prepared. Figure 2 shows individual 3D CAD models of tested specimens with specific types of porous structures, without bases. The details of the trabecular and cubic structures are in Figure 3.

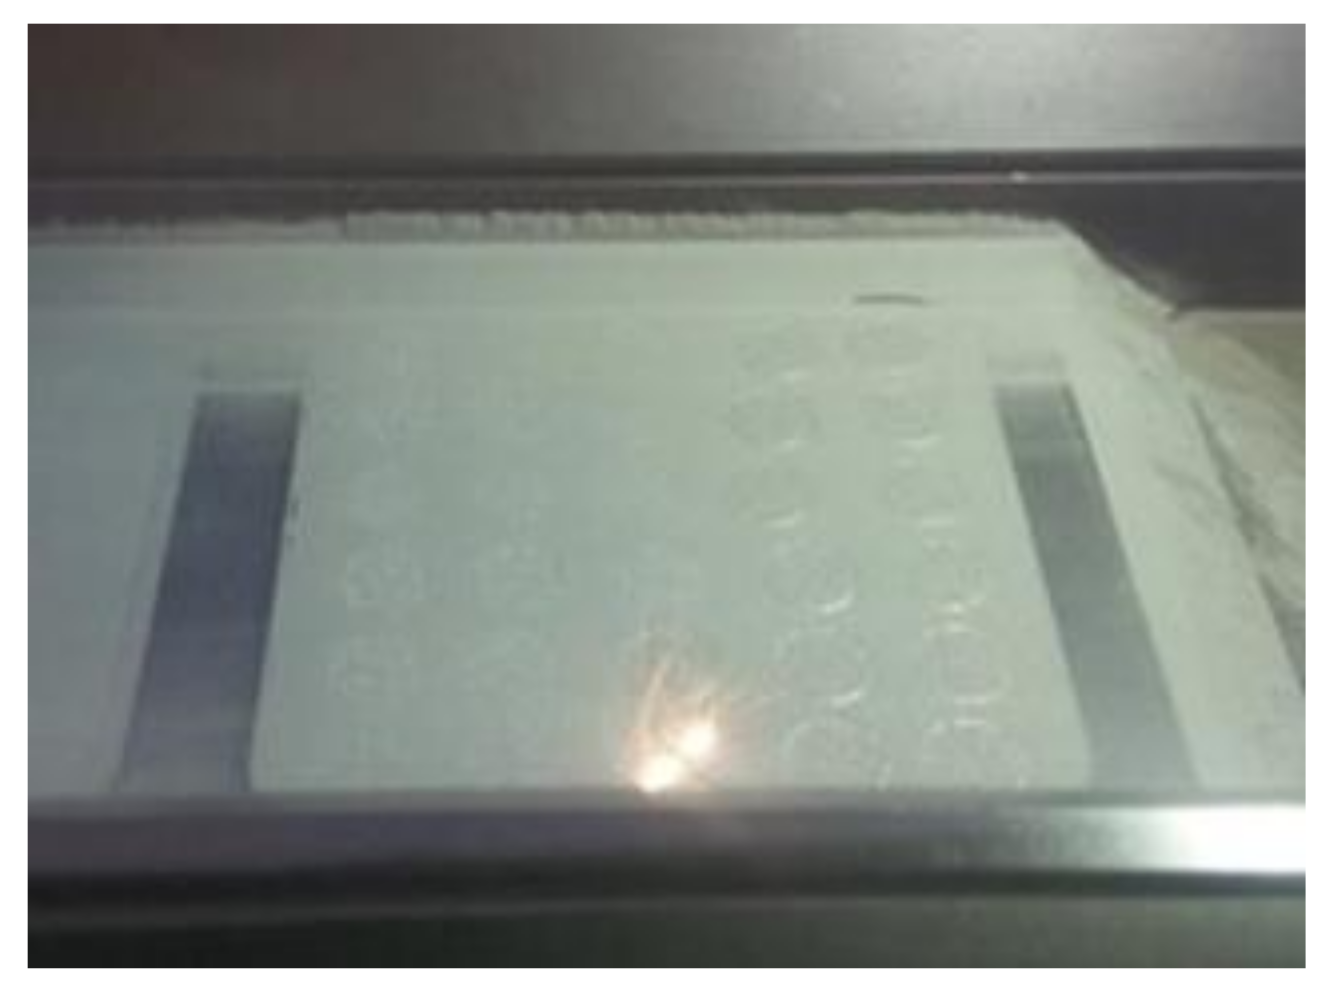
2.3. Additive Manufacturing of Ti6Al14V Samples

To produce porous test specimens, the selective laser melting (SLM) production technology was chosen (Mlab cusing R (GE Additive, USA)). The basic parameters of the device settings in the SLM production process are listed in Table 4.

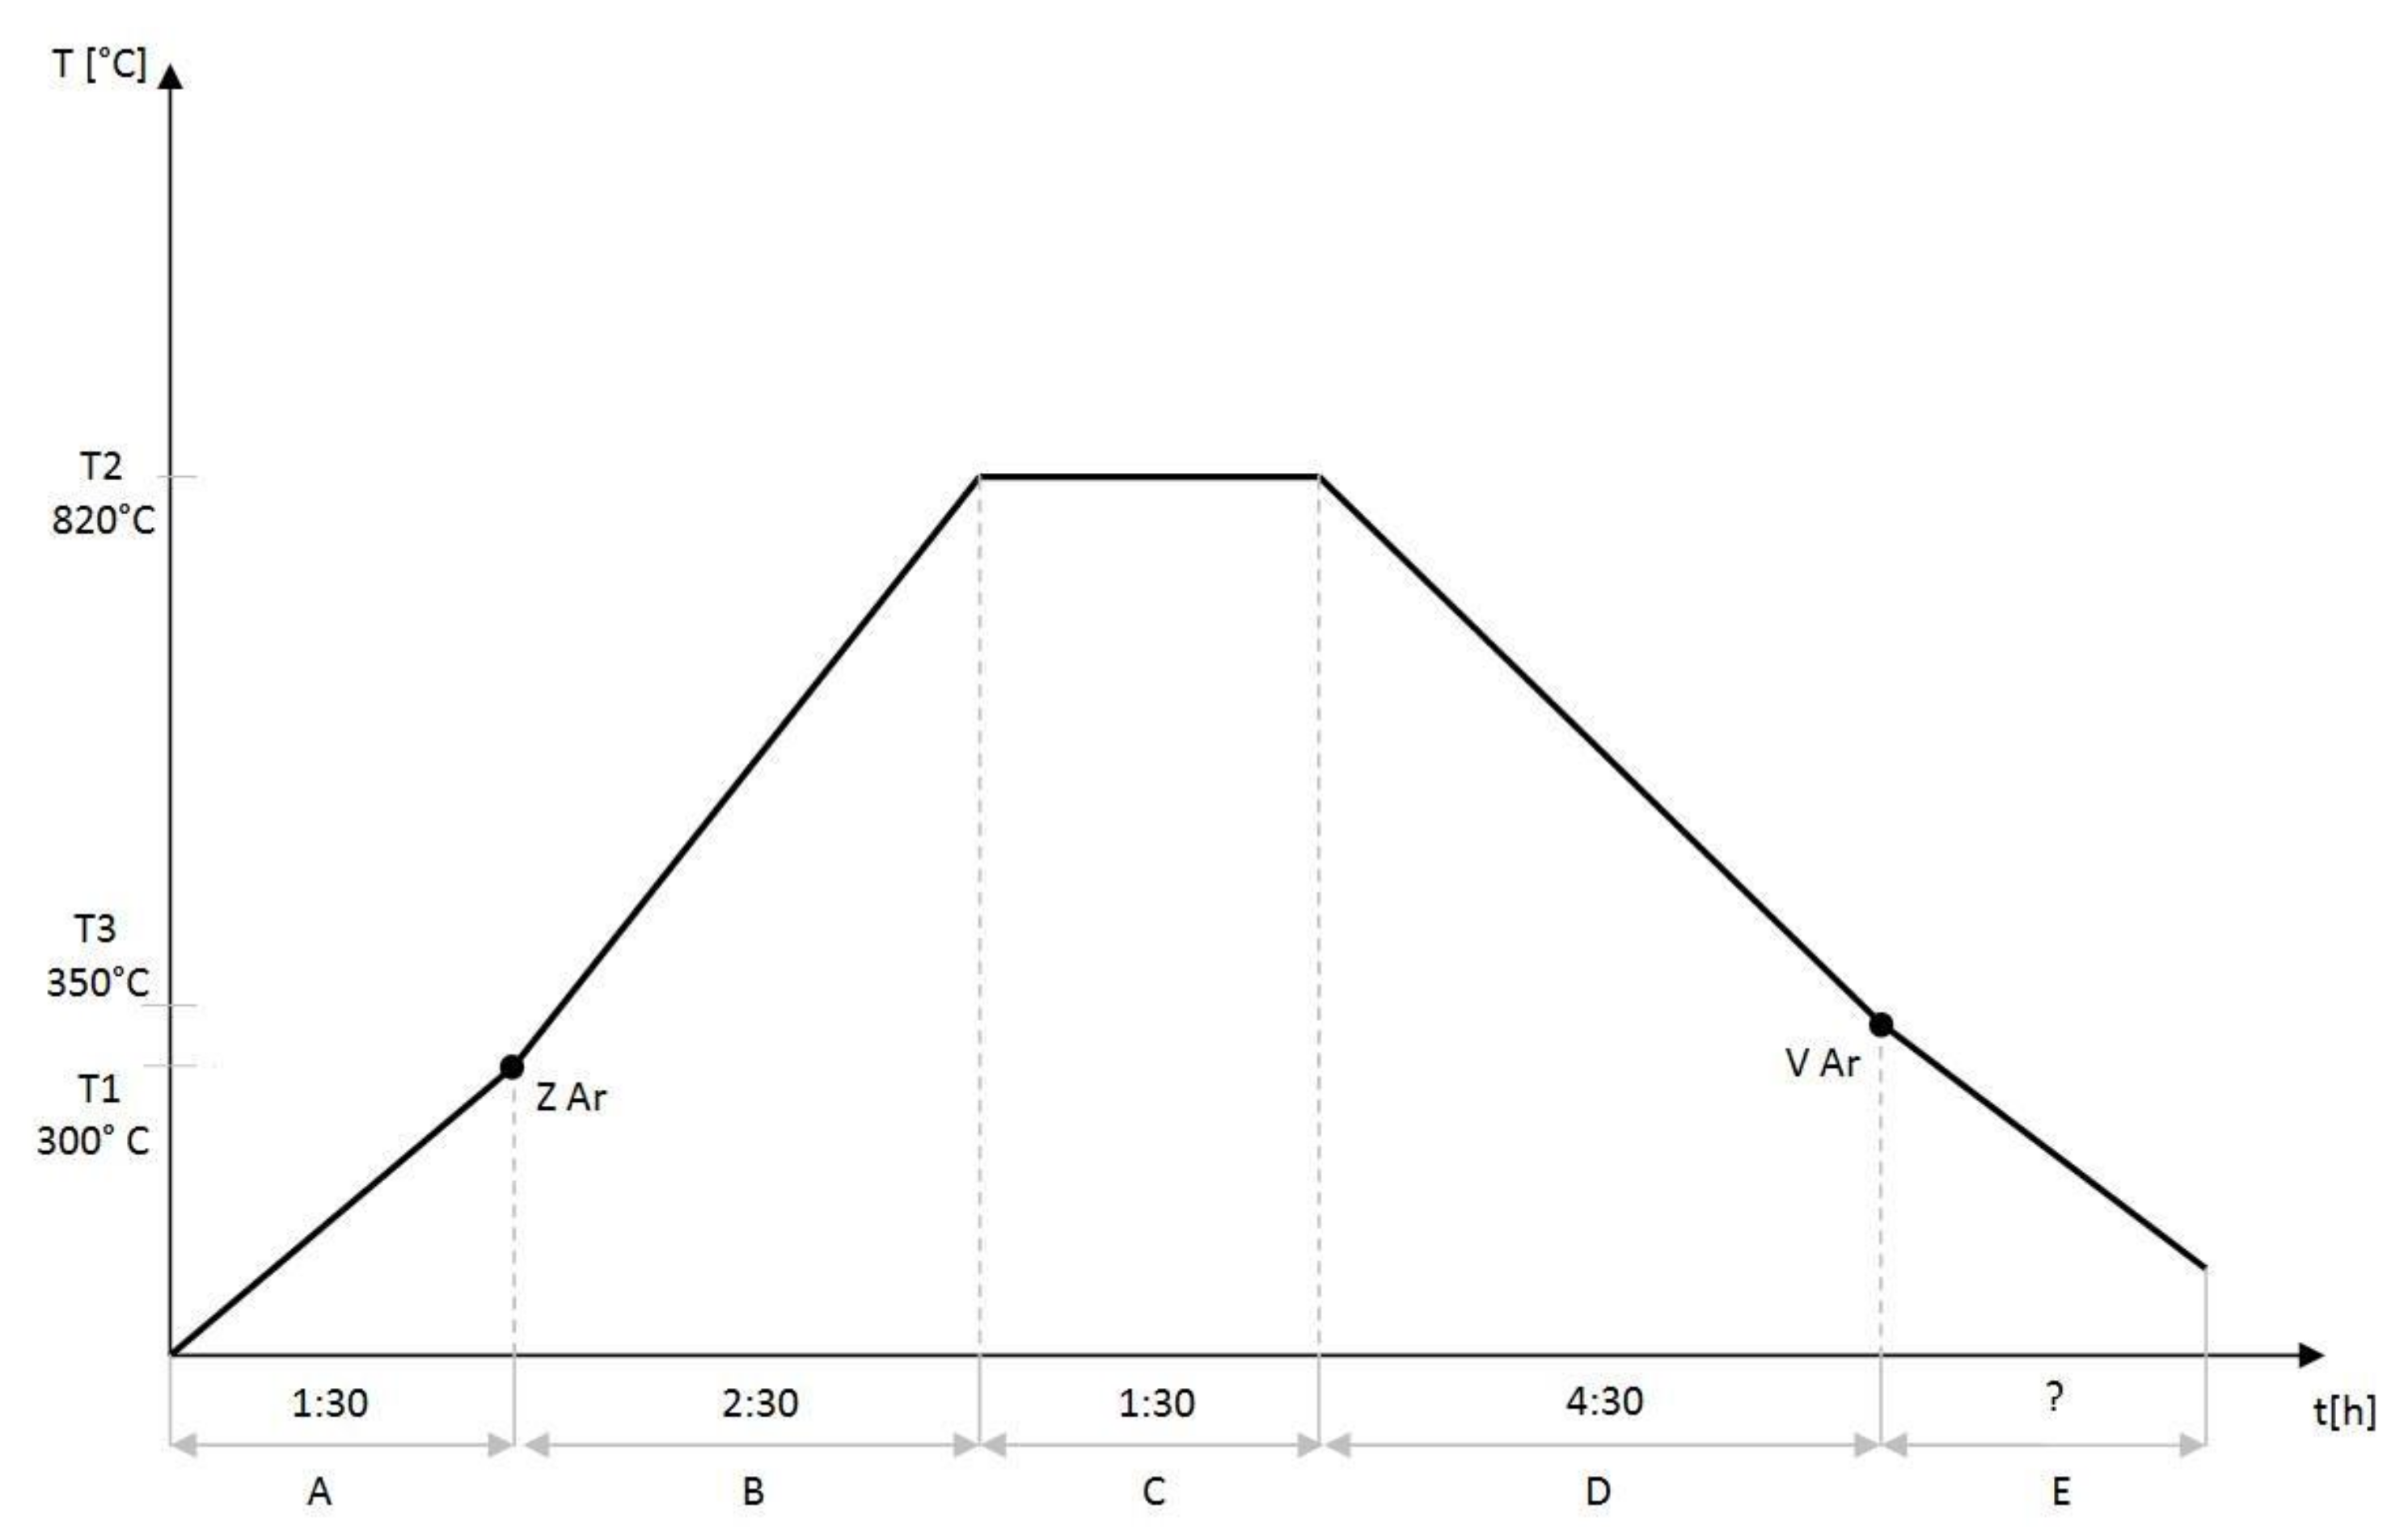
2.4. Post-Processing of Printed Samples

All samples were postprocessed after sintering. The cleaning of the samples consisted of manual shaking of the platform on a solid pad and then on the vibrating device. After a thorough cleaning, annealing of the test specimens was performed using an annealing furnace N7/H—N1491 (Nabertherm, Lilienthal, Germany). Based on the manual from the furnace manufacturer (Figure 4), the annealing program for titanium alloy was set, where the annealing temperature reached 820 °C after 4 h. The test specimens on the annealing plates were placed in the annealing chamber before the start of the program itself because the specimens made of titanium alloy must be subjected to gradual heating. After reaching a temperature of 820 °C, the samples were annealed for 90 min. Subsequently, automatic cooling of the chamber began until the temperature inside the furnace reached 350 °C, thus ending the annealing program. The test specimens were then subjected to spontaneous cooling, which was achieved by maintaining a constant temperature of 20 °C in the air-conditioned laboratory. Samples were removed from the platform by sawing with a metal saw at the support site and the remaining support was removed using a lathe. The edges of the base were smoothed with a file.

2.5. Computed Tomography

After all mechanical adjustments, the samples were weighed, and their dimensions were measured. Before the pressure loading itself, the samples were scanned by an industrial computed tomography Metrotom 1500 (CarlZeiss, Oberkochen, Germany) which provides non-destructive, non-contact measurements. One-piece was taken from each type of sample to obtain a 3D model of the produced sample. The analysis was performed using the VGstudio Max software (Volume Graphics, Heidelberg, Germany). The dimension/pore sizes after additive (SLM) production and the volume of the objects were also investigated.

2.6. Mechanical Testing

A static pressure test was used to evaluate the mechanical properties of the samples using the universal test apparatus (200 kN, Zwick-Extensometer, Ulm, Germany) with the maximum pressure/thrust of 200 kN. The measurement procedure and parameters were performed according to ISO 13314 norm with a sample loading at a test speed of 1.2 mm/min. The duration of the load was set to 60% of the deformation of the sample. Loading of one sample took approximately 5 min depending on the sample type. At the end of the testing, the acquired data were processed using the device default software.

2.7. Microstructure after Compression

The microstructure of the produced Ti material after the compression tests was evaluated from images taken using Helios Nanolab 600i by FEI microscope with a resolution <1 nm.

3. Results

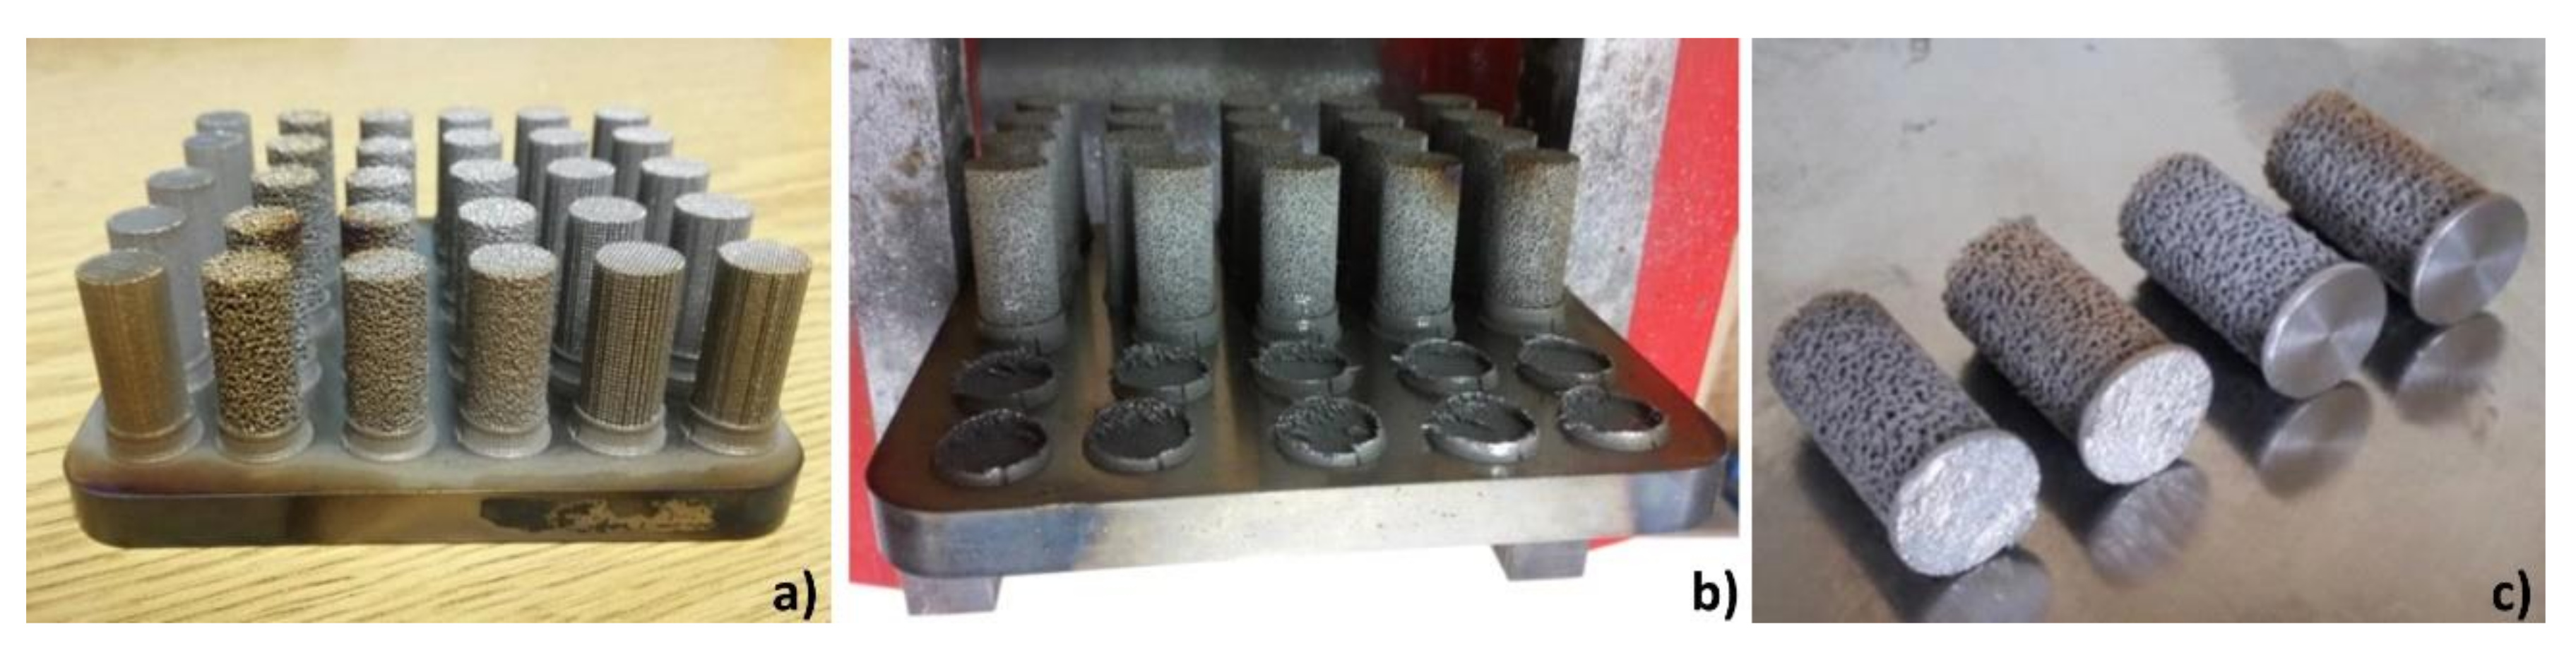
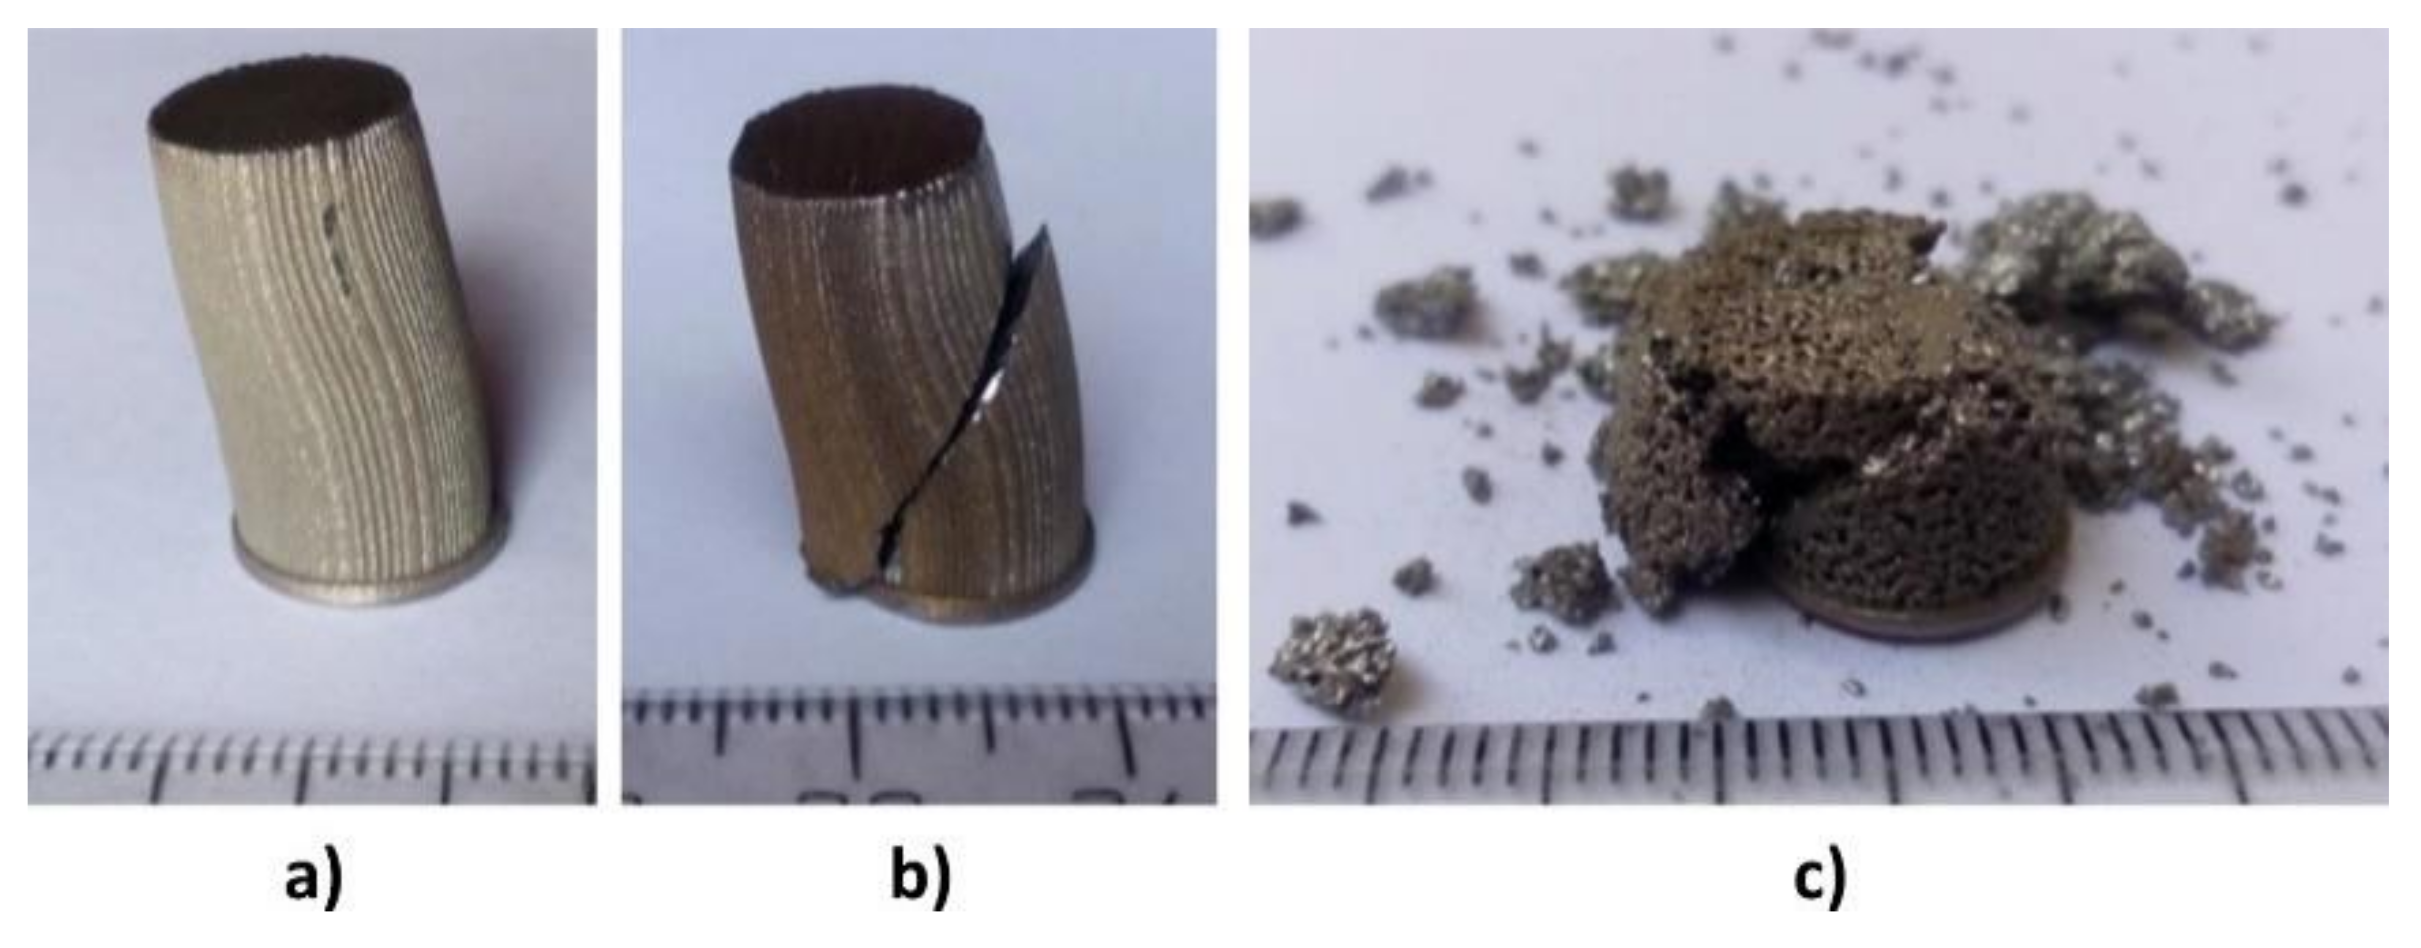
3.1. Prepared Ti6Al4V Samples

Before printing, SLM production process parameters were set. The input data in the *.stl format has been imported into the software and transferred to the production. The samples were arranged in six rows on the platform while each row represented a different type of sample. The production procedure was repeated twice, with 30 samples being produced in each run. The course of the additive production process is shown in Figure 5.
It is known that after the additive manufacturing of porous structures, a residual un-sintered titanium powder filled in the pores can be preserved in the internal environment of the material. The test specimens have been left on the platform, as deformation of the material could occur during mechanical removal due to the internal stresses that arise during production. Therefore, the cleaning process and the thermal annealing process are crucial. It is not possible to remove the residual titanium powder after heat treatment, therefore it has to be removed immediately after production. Annealing of the test specimens used to remove the above-mentioned internal stresses was performed after cleaning. Images of specimens on the platform after the thermal annealing process (Figure 6a), removal of specimens from the platform (Figure 6b), and specimens with untreated (the first two from the left) and treated (the first two from the right) bases (Figure 6c) are depicted in Figure 6. Since the flat top and the bottom surface of the specimen are required for static pressure tests, the remaining support was removed with a lathe. The bottom of the sample and the edges of the base were leveled and smoothed with a file. Figure 6c shows the difference between the un-machined and machined bottom surface of the test specimen base.

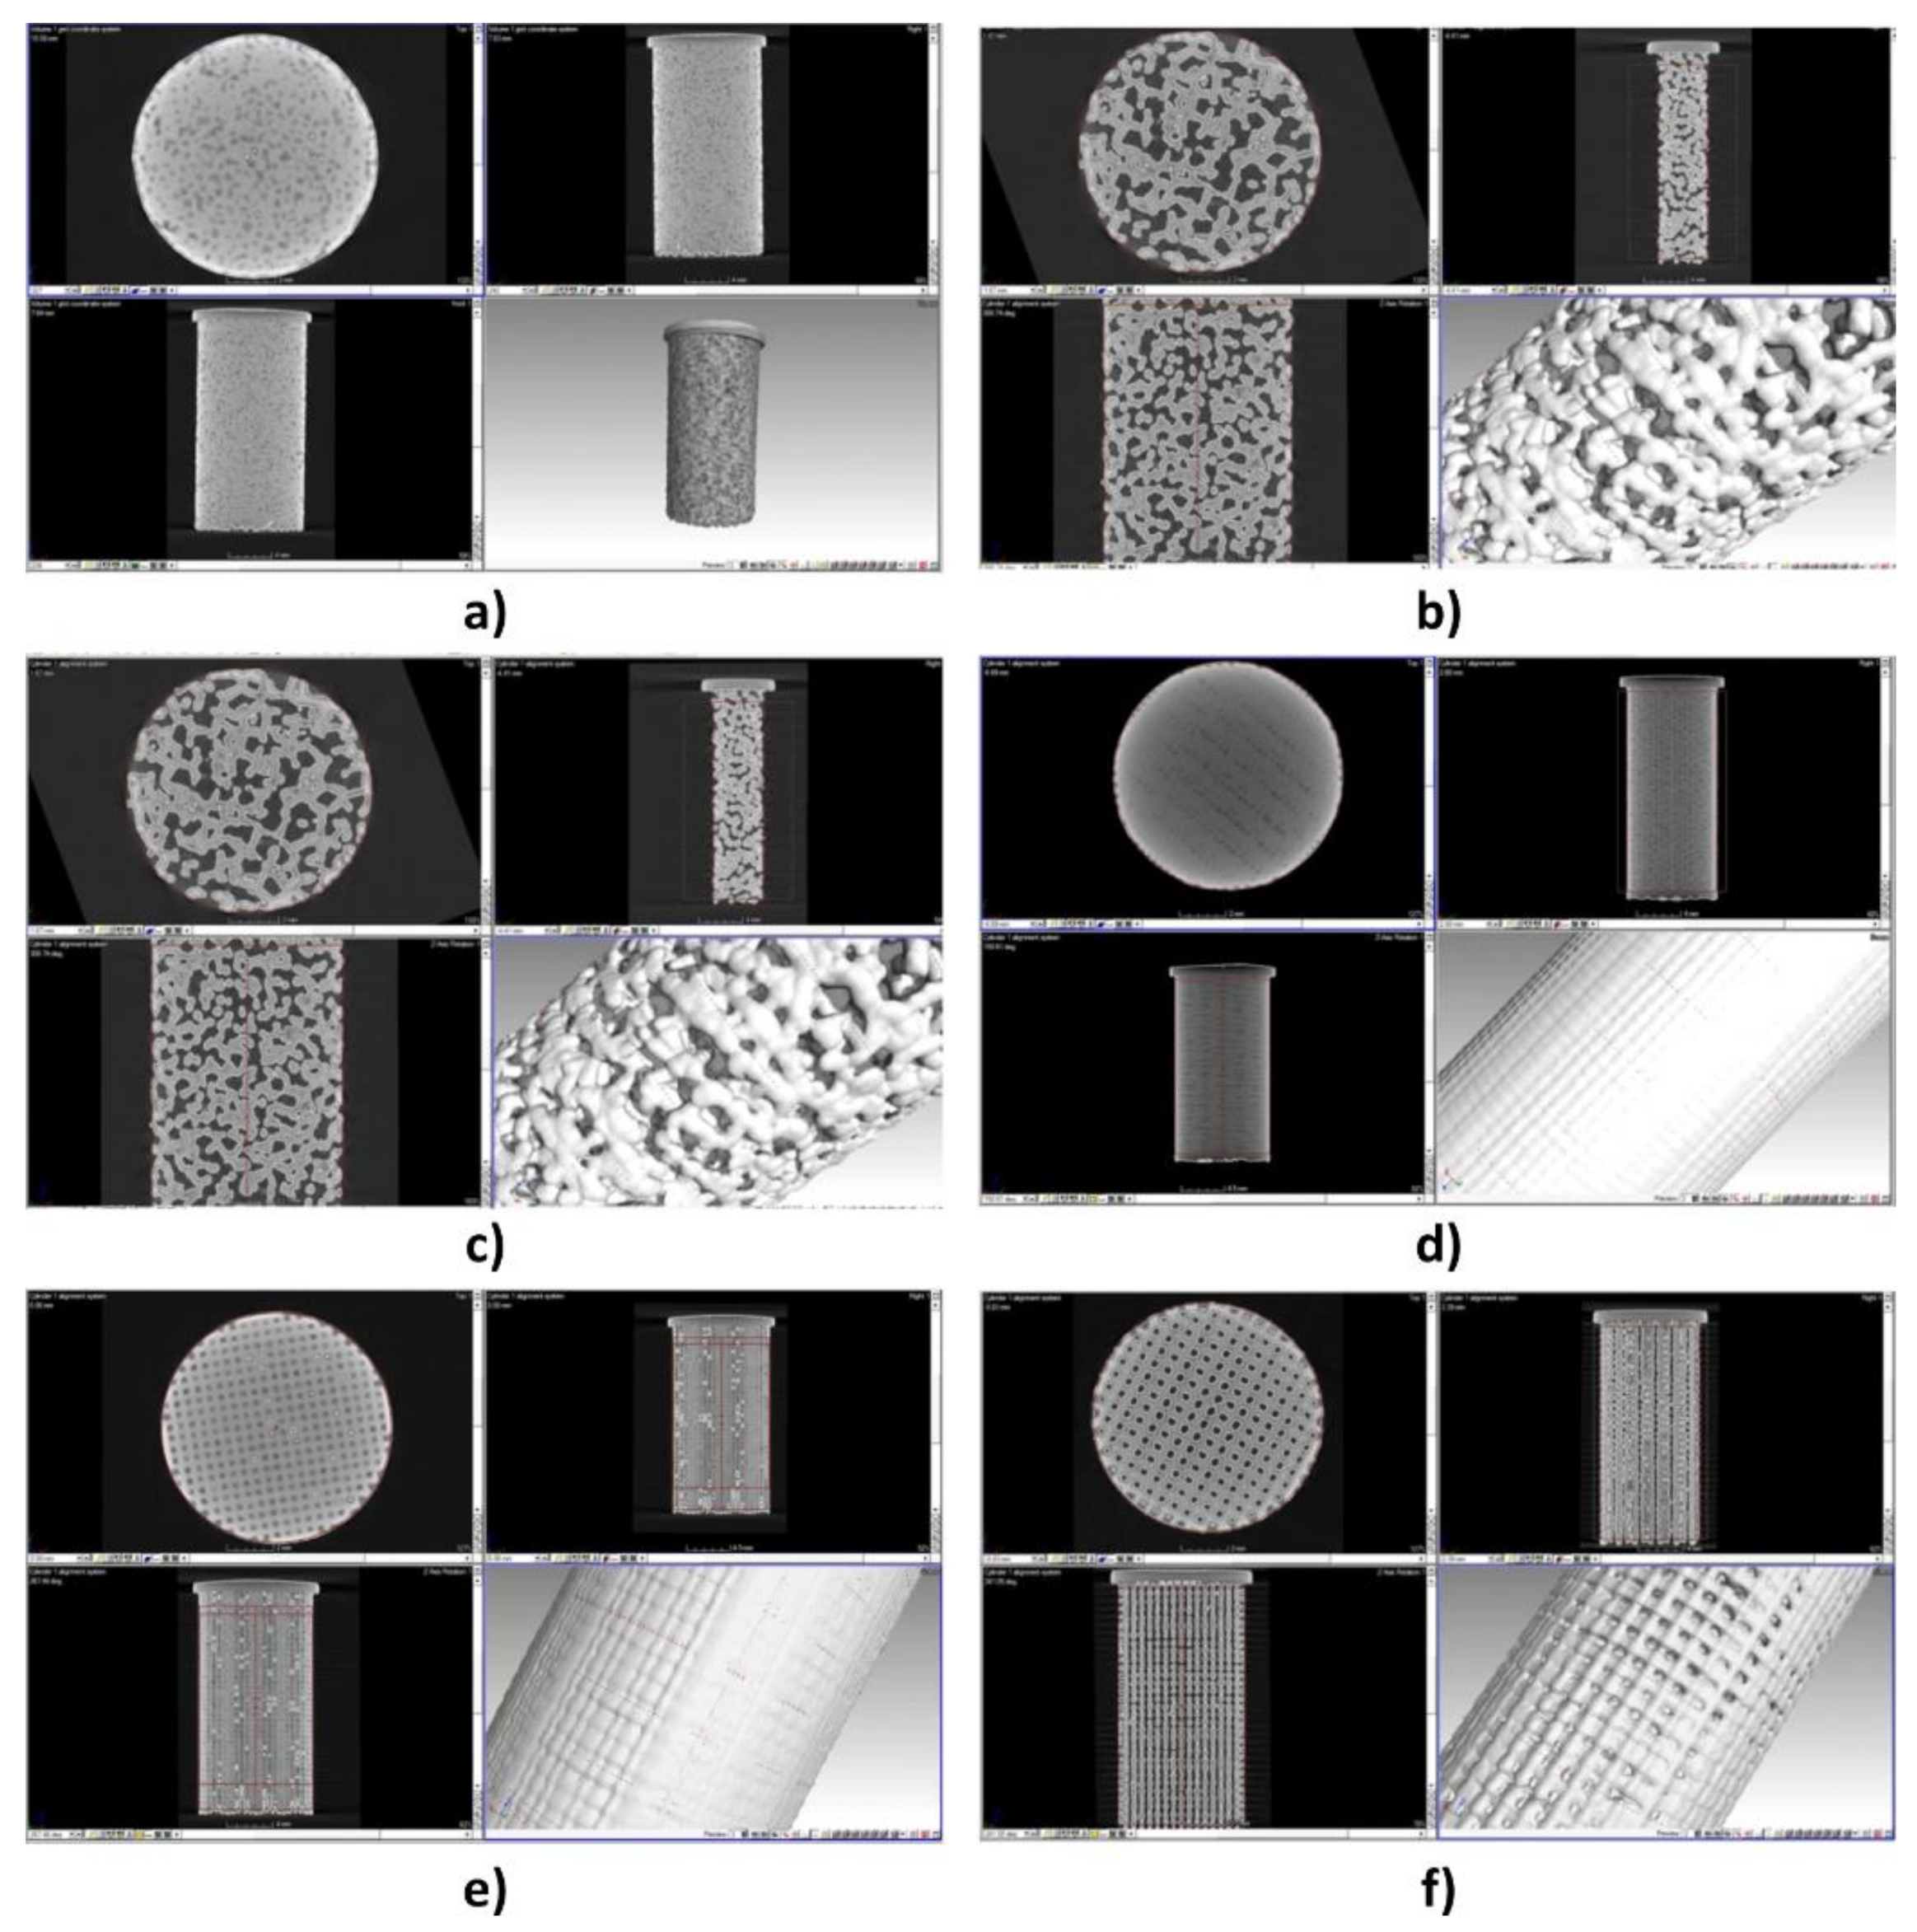
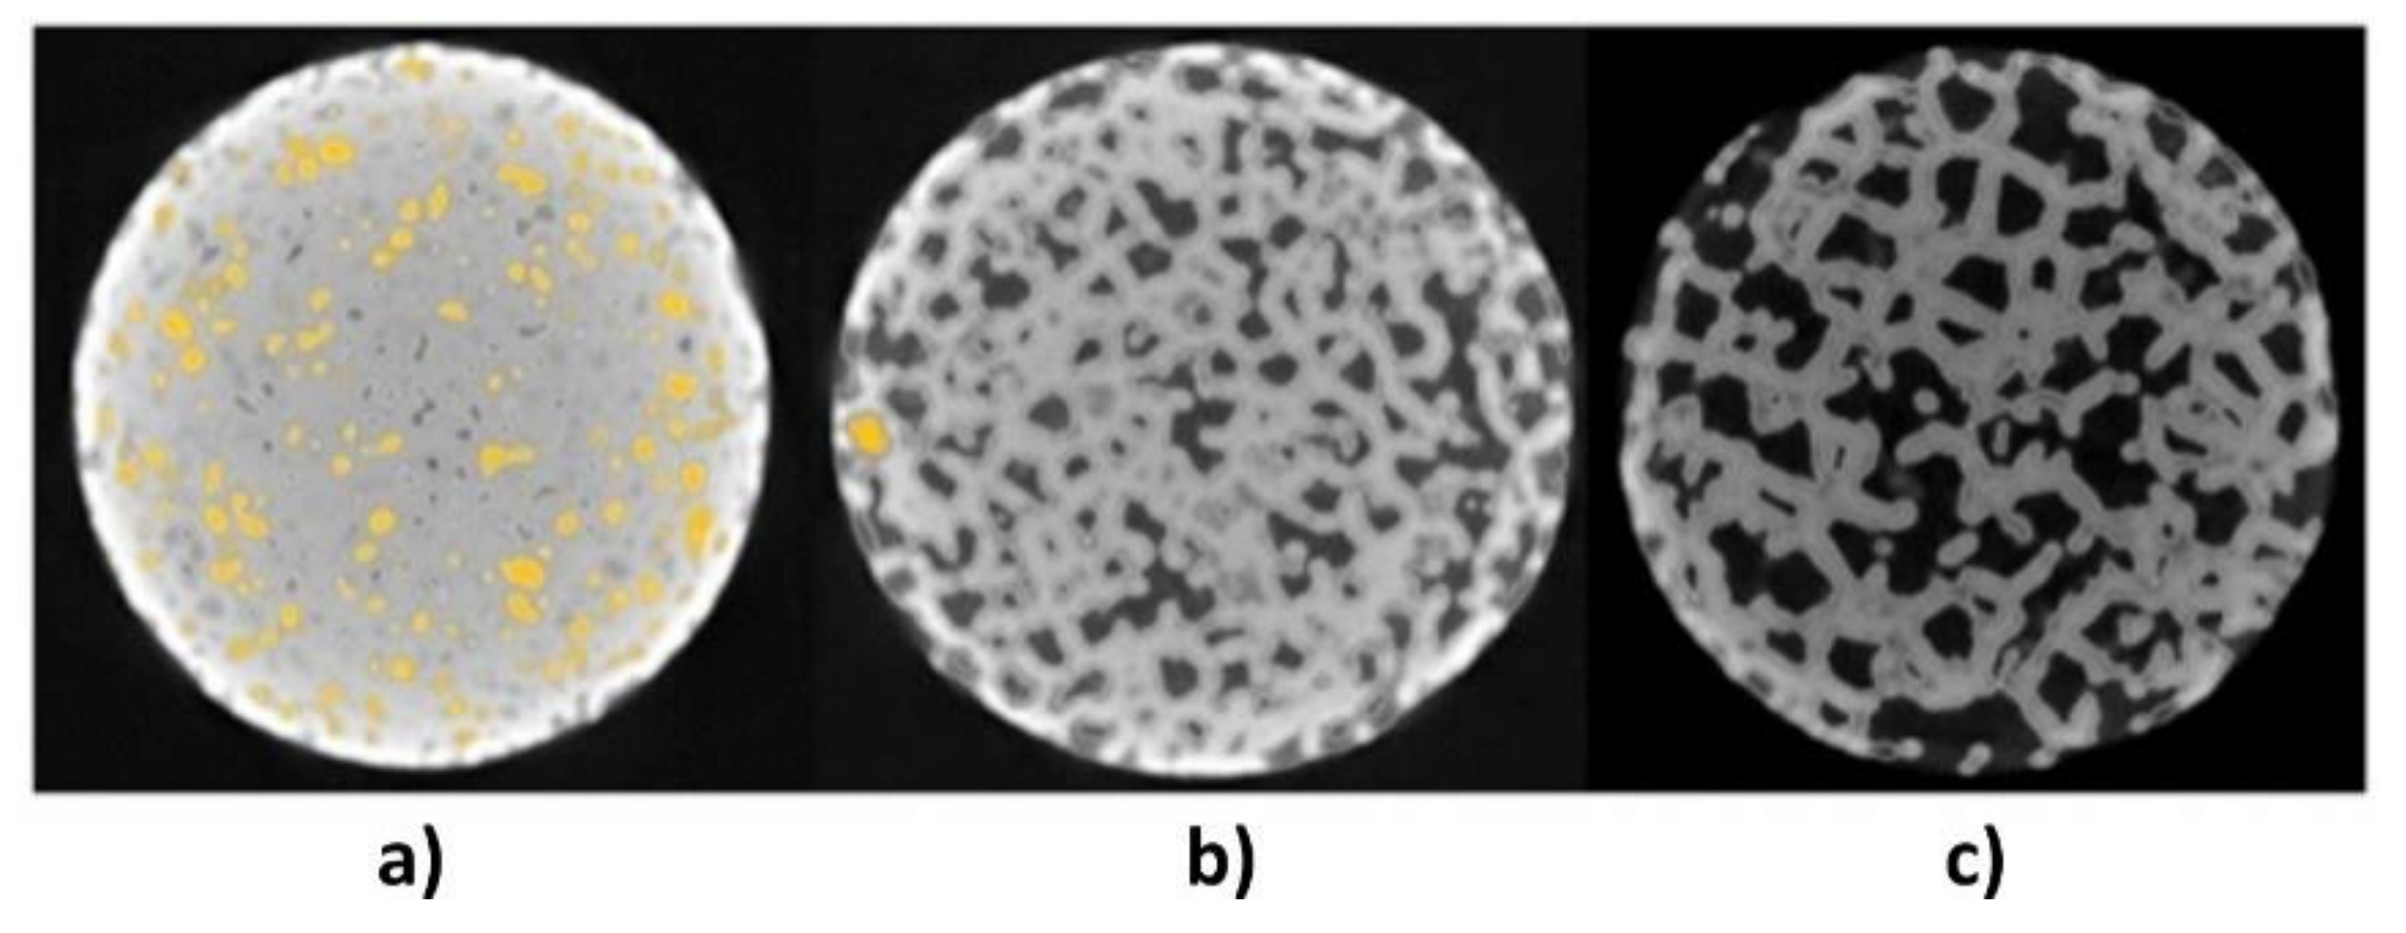
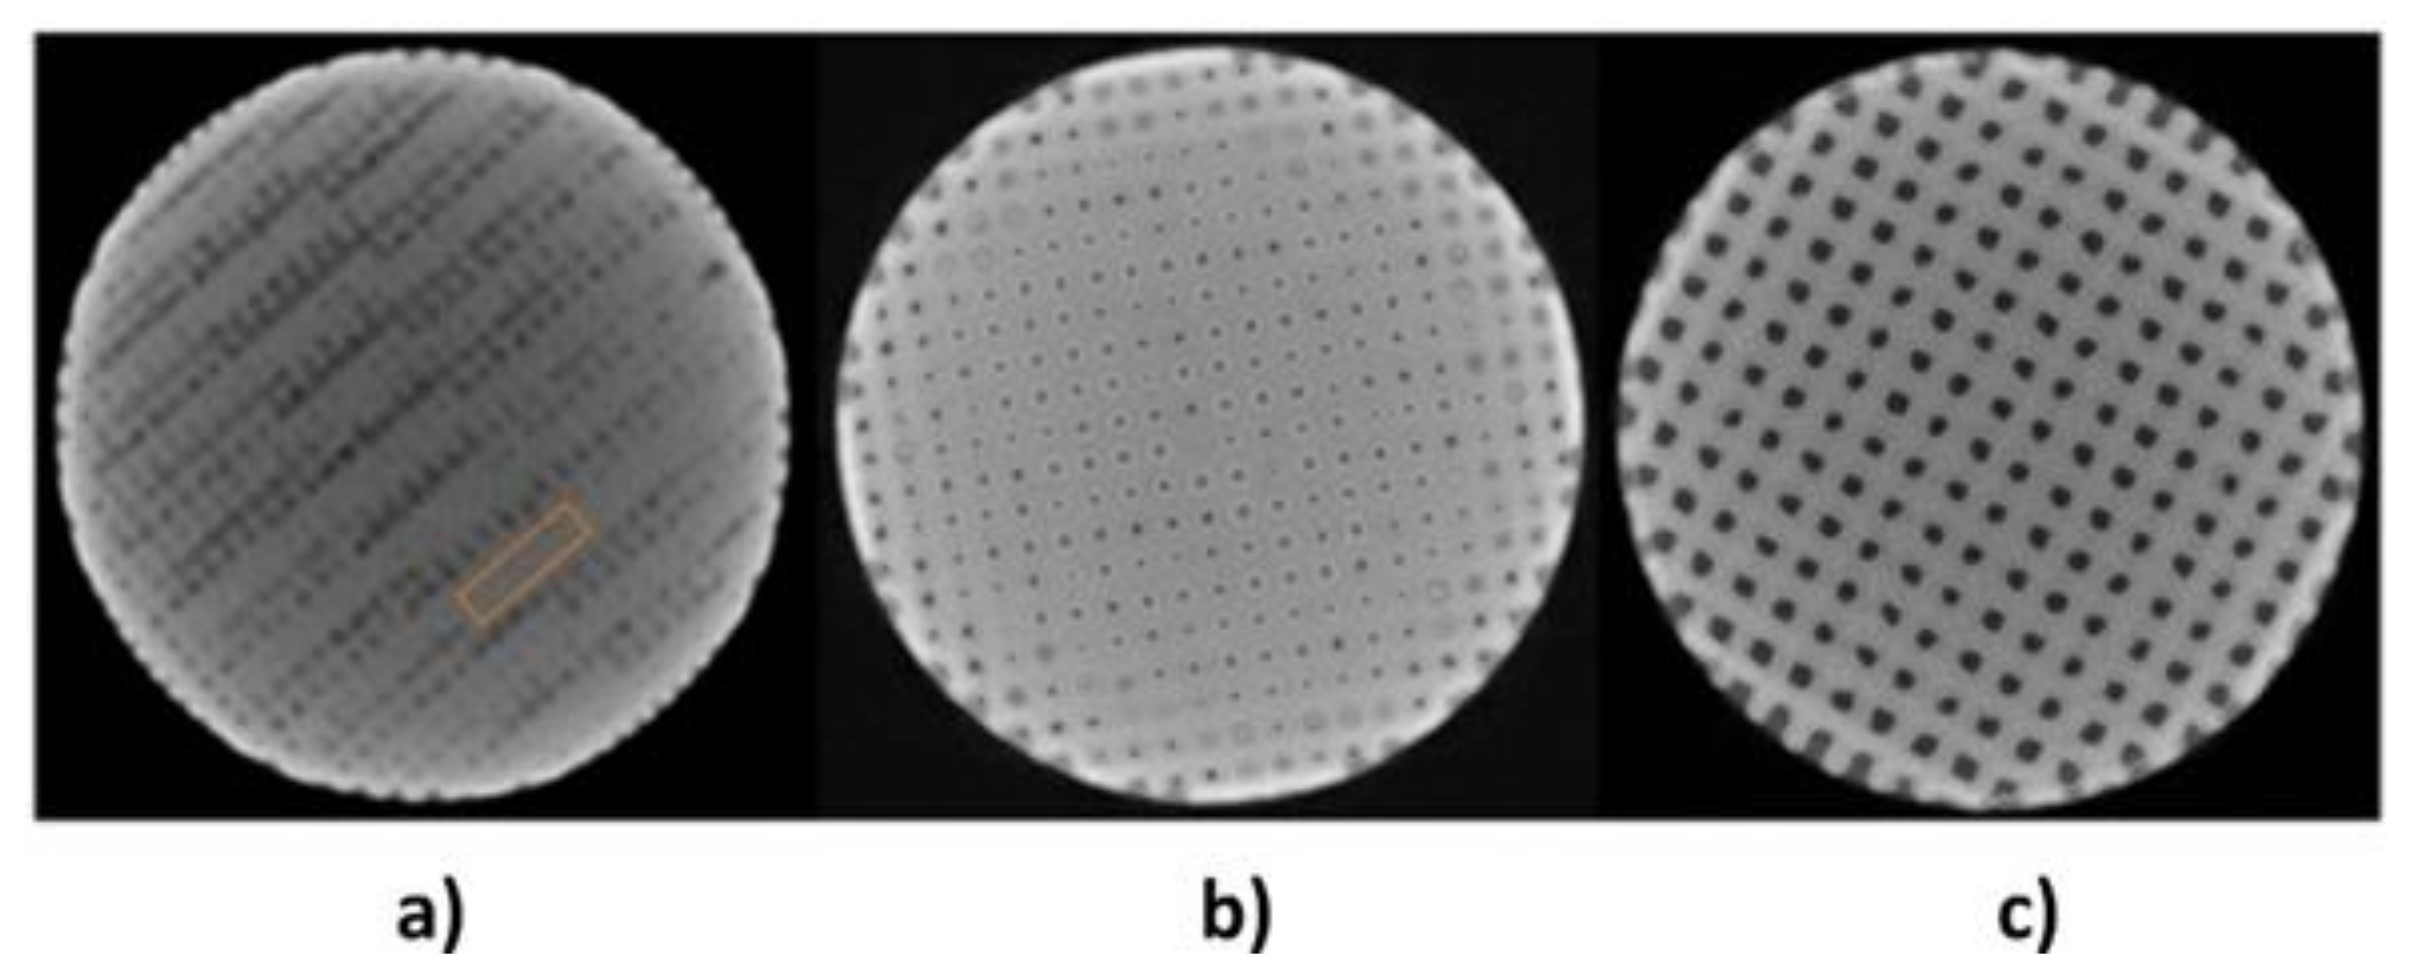
3.2. PC—Tomography Scans

After the mechanical dressing, the samples were prepared for mechanical testing. Each sample was weighed, measured, and scanned by a computed tomography method before the pressure tests. Figure 7 shows the 3D models of the samples in different views. Sampling was performed at a resolution of 33 µm.
The “New defect detection” module with a maximum pore diameter of 10 mm was used for the porosity analysis. Due to the size and shape of the pores in sample type 1, they are filled with unsintered powder. The amount of powder in the sample can be evaluated from the porosity analysis. However, in this case, the result of the analysis was inconclusive due to the interconnection of the pores. In Figure 8, the areas marked in orange are identified as pores (unconnected), the dark gray areas closed by the white line are unidentified pores (connected). The bright edge of the cross-sectional sample is caused by a beam hardening artifact. This mapping is valid for all analyzes.
During the micro-CT analysis of the type 1 sample model, the software was unable to recognize individual pores. This is due to the presence of sintered powder and the low nominal porosity of the sample design. It can be seen from the cross-section of the sample model that the individual pores were not interconnected (Figure 7a). In the µCT analysis of the type 2 sample model (Figure 7b), the evaluation software distinguished the pores in the material. The porosity analysis shows that the pores are interconnected, and the result is shown in Figure 8b. Unsintered titanium powder was also present but to a minimal extent. When analyzing the type 3 sample (Figure 7c), the pores were also interconnected, and the evaluation software could accurately distinguish between the sintered material and air. There were no pores detected in sample 4 (Figure 8c). The content of unbaked titanium powder is negligible compared to previous types of structures. Type 4 sample (Figure 7d) was found to contain a significant amount of sintered titanium powder. For this reason, the software could not distinguish the material from the air and thus did not evaluate the individual pores. Pore size determinations were approximate (the software did not detect the pores) and therefore this value is also only approximate. In sample type 4 (Figure 7d) was found a significant amount of sintered titanium powder. Unlike the trabecular structure, in the case of a cubic structure, all pores should be interconnected, so the porosity analysis is irrelevant. With a pore size of 200 µm, it is clear in the cross-sectional view that there are areas in the sample where the pores did not form at all or were clogged with sintered material (there is no difference in density)—an orange bounded area (Figure 9).
Type 5 sample (Figure 7e) also contained unsintered titanium powder which affected the evaluation of the sample properties. The shape of the pores was mostly circular, not square. The average pore size was 270 µm which means that the pore size decreased by 32.5% compared to the solid sample (type 7). For type 6, the pores were not clogged with unbaked titanium powder which means that the pores were large enough to be optimally cleaned from this powder. The average pore size measured in the type 6 sample was 410 µm. Within the evaluation, the values of selected characteristics (weight and pore size) of the test samples were compared. In terms of weight, samples of type 7 (solid sample) and 2 (trabecular structure with a pore size of 400 µm) were closest to the designed values. The weight of the porous sample (type 2) is 7.7% lower than the modeled value. Samples of types 5 and 6 (porous samples with a cubic structure and a pore size of 400 µm and 600 µm, respectively) had the largest differences in weight. In general, the larger is the pore size of the sample, the lower is the weight. Moreover, the weight of samples with a cubic structure is higher than the weight of samples with a trabecular structure (Table 5). The greatest weight reduction occurred in the type 3 sample, which has a trabecular structure and a pore size of 600 µm. The type 4 sample (cubic structure and pore size of 200 µm) had the smallest difference in weight value compared to the solid sample. These solid samples were made to determine the actual weight of the samples and to verify the density of the annealed and sintered titanium powder used for production. The average weight of the complete sample is 7.3 g and the material density is 0.0043 g/mm3.

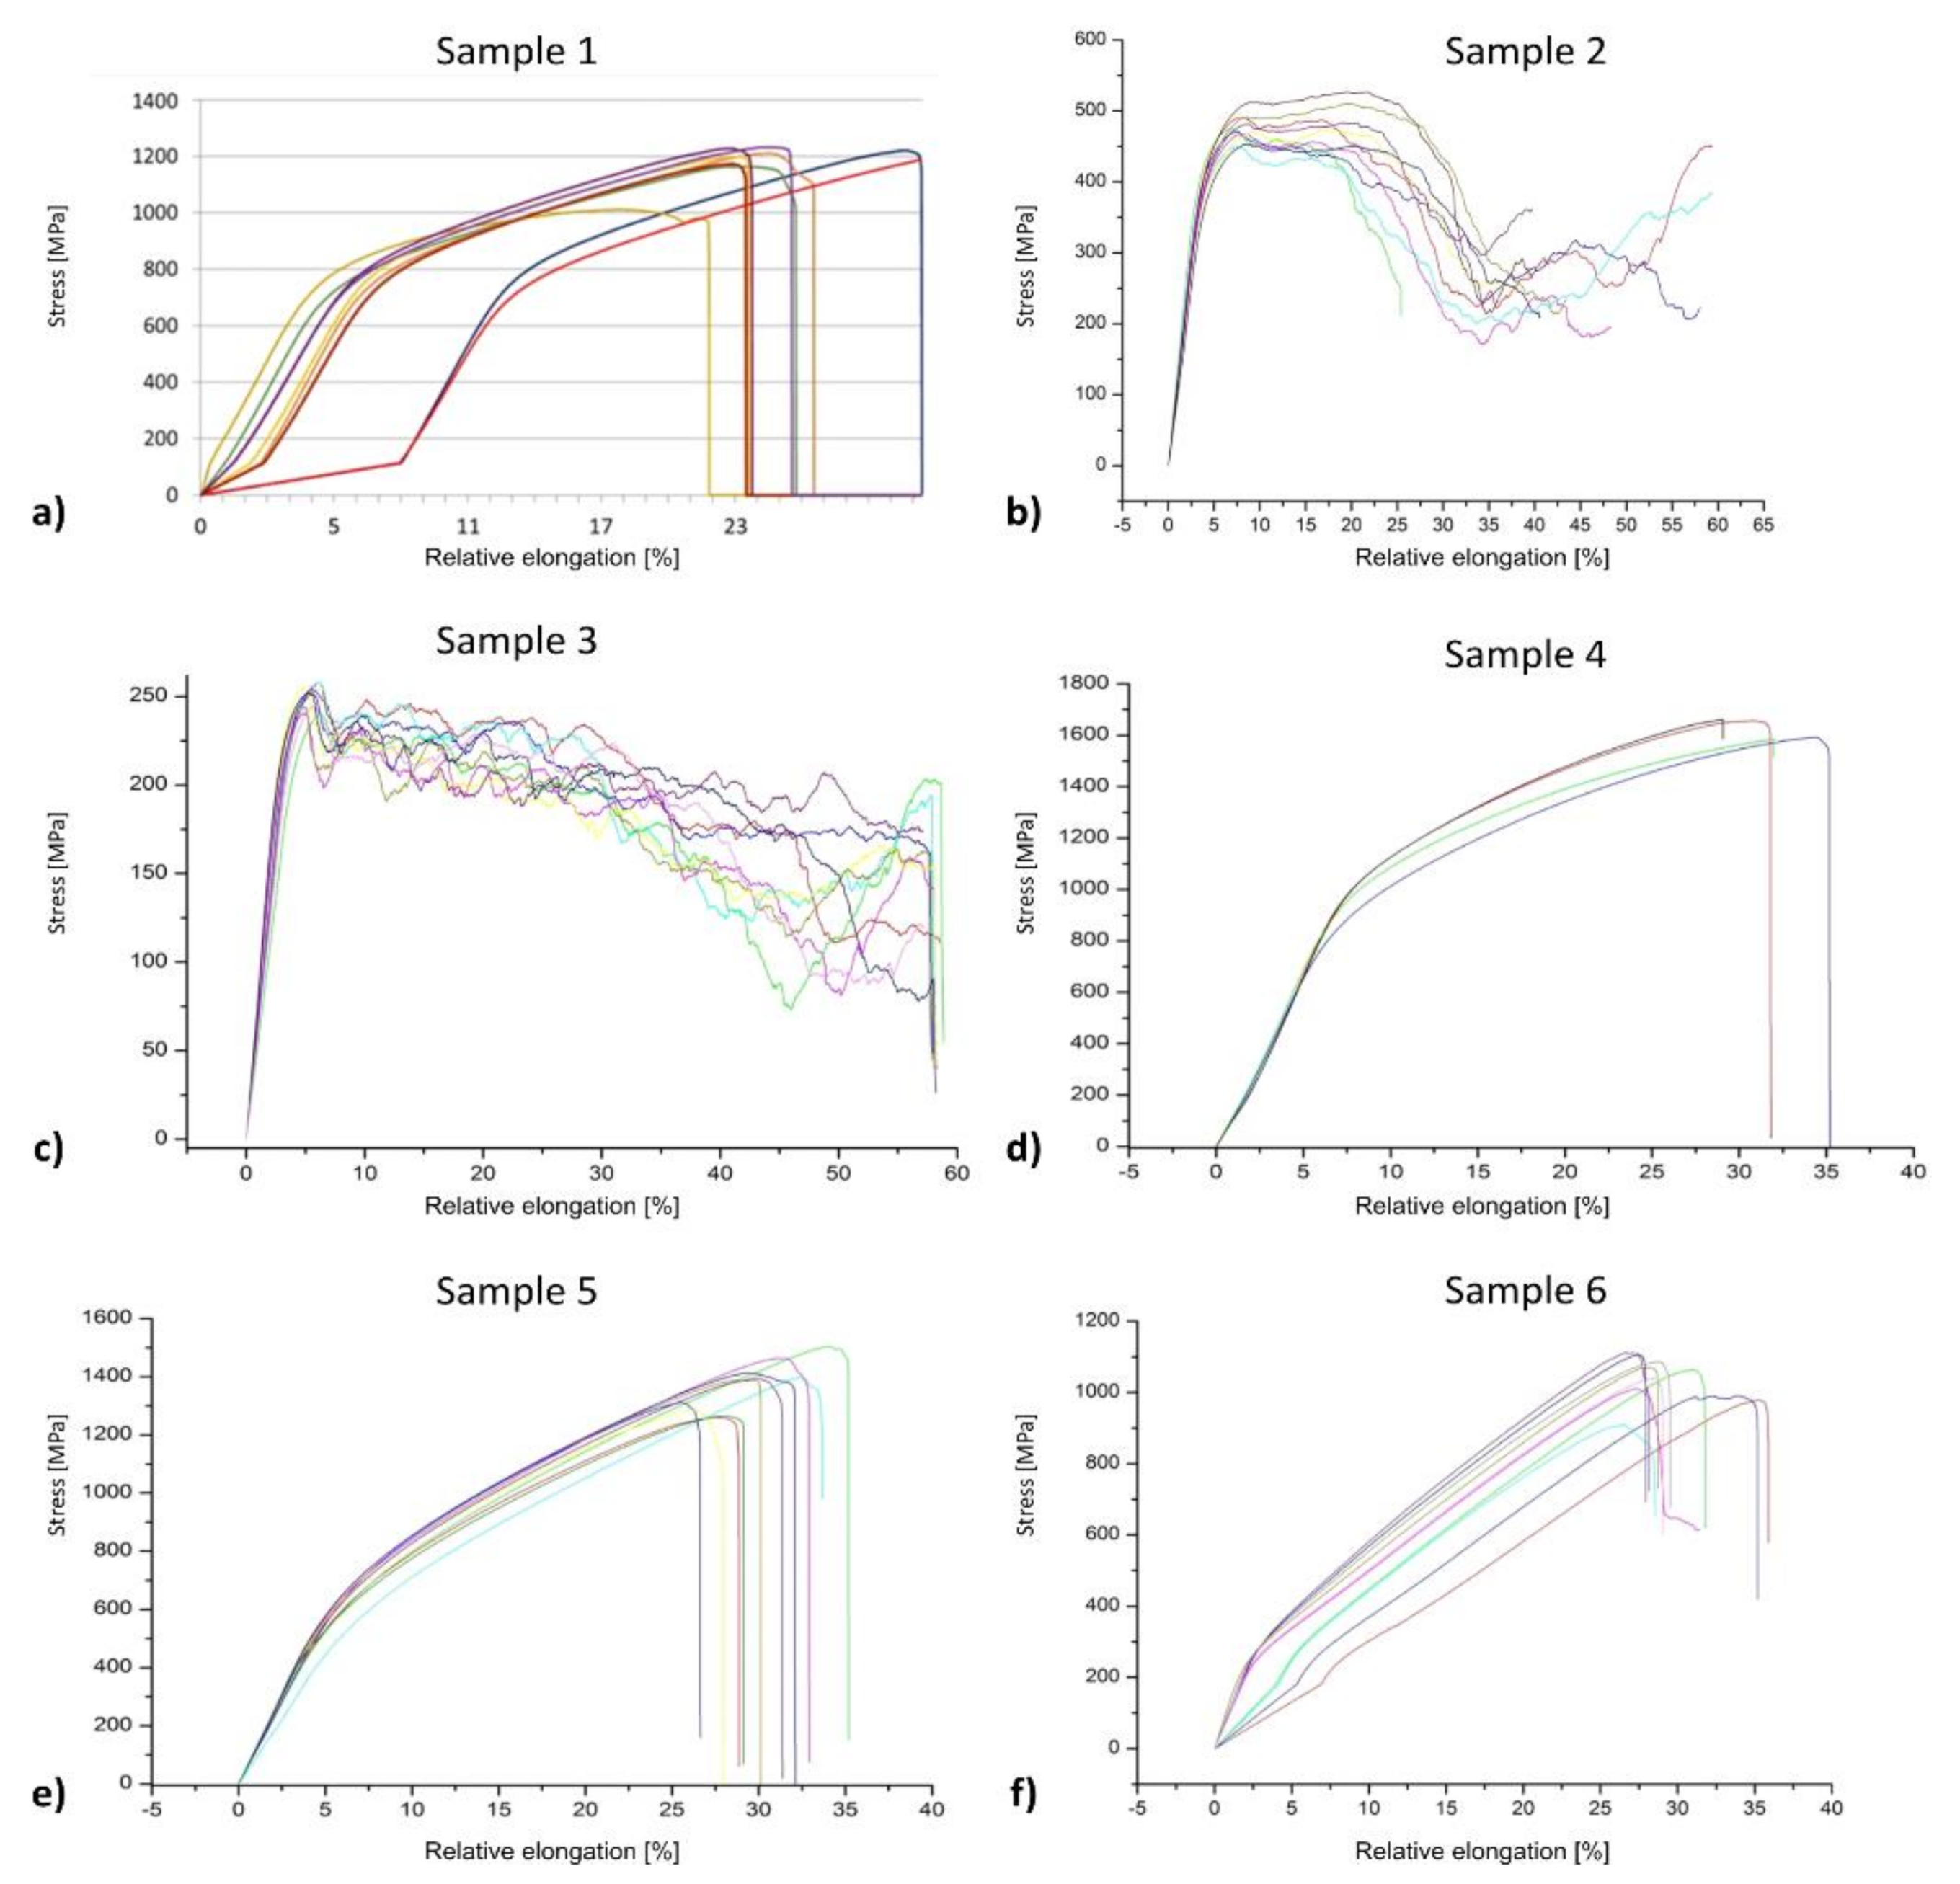
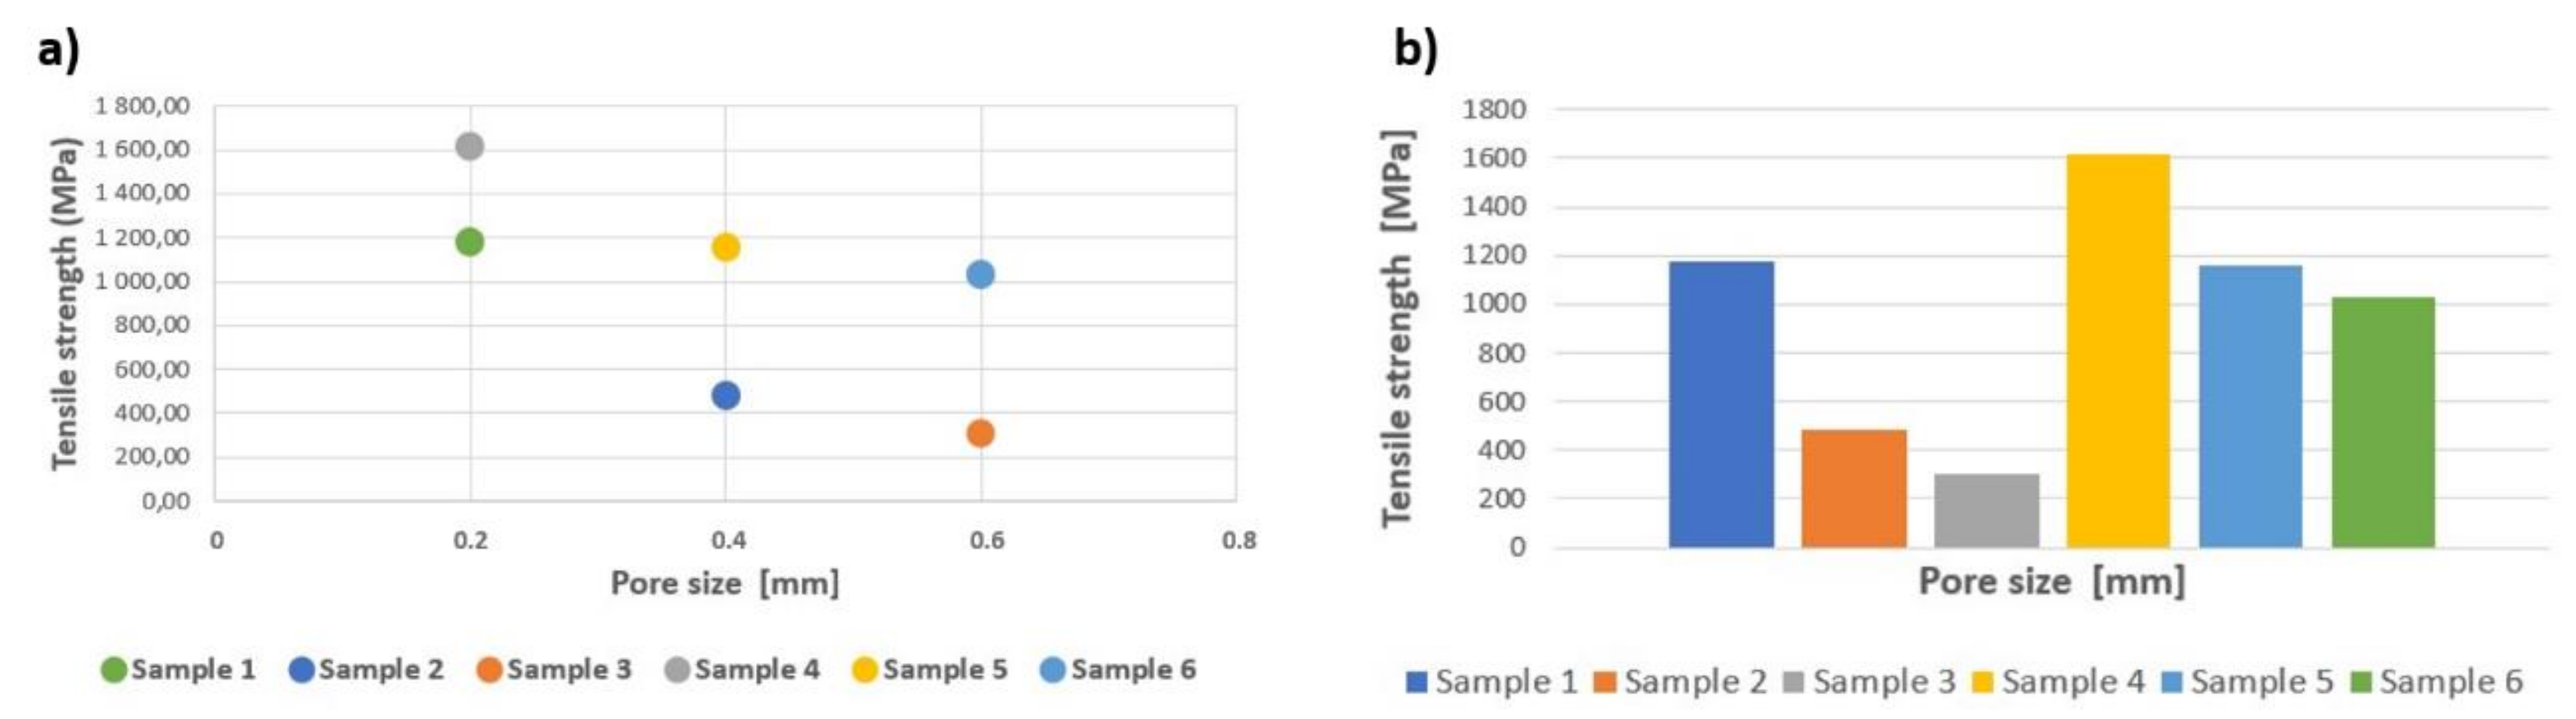
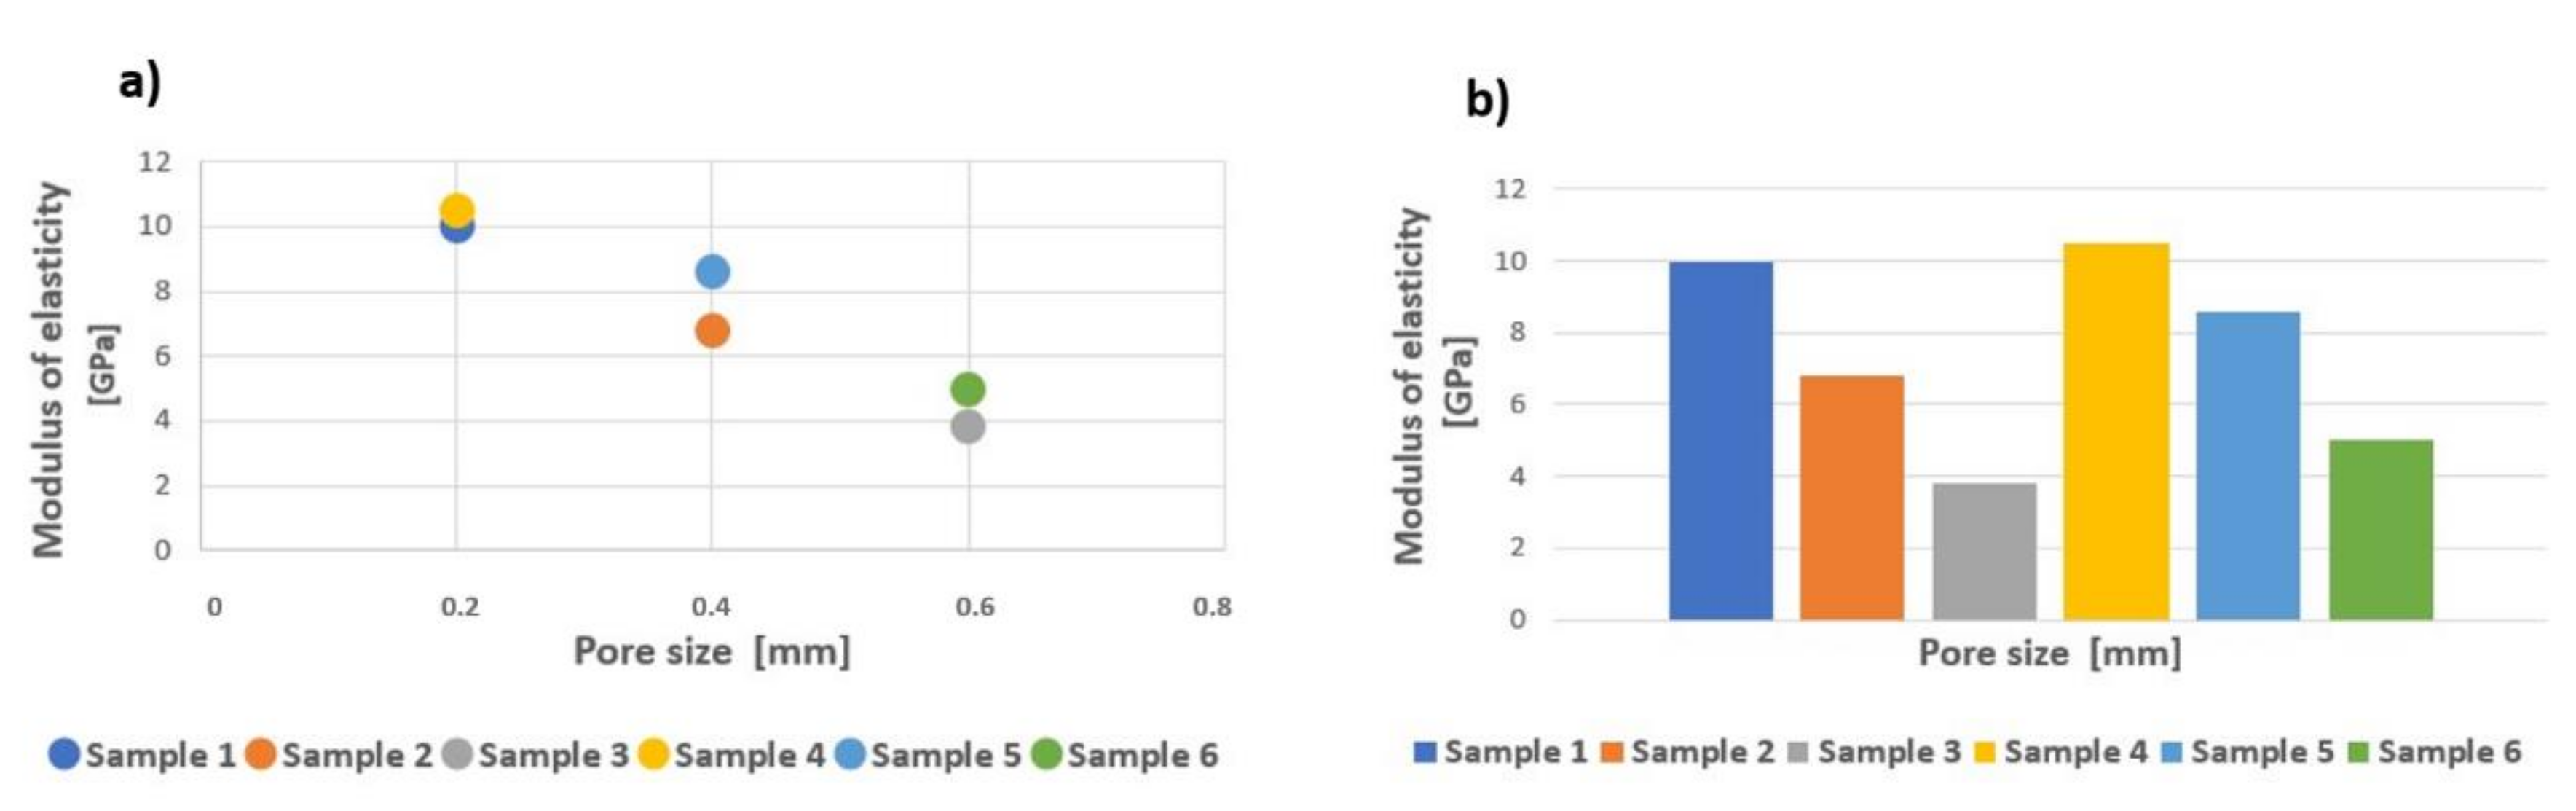
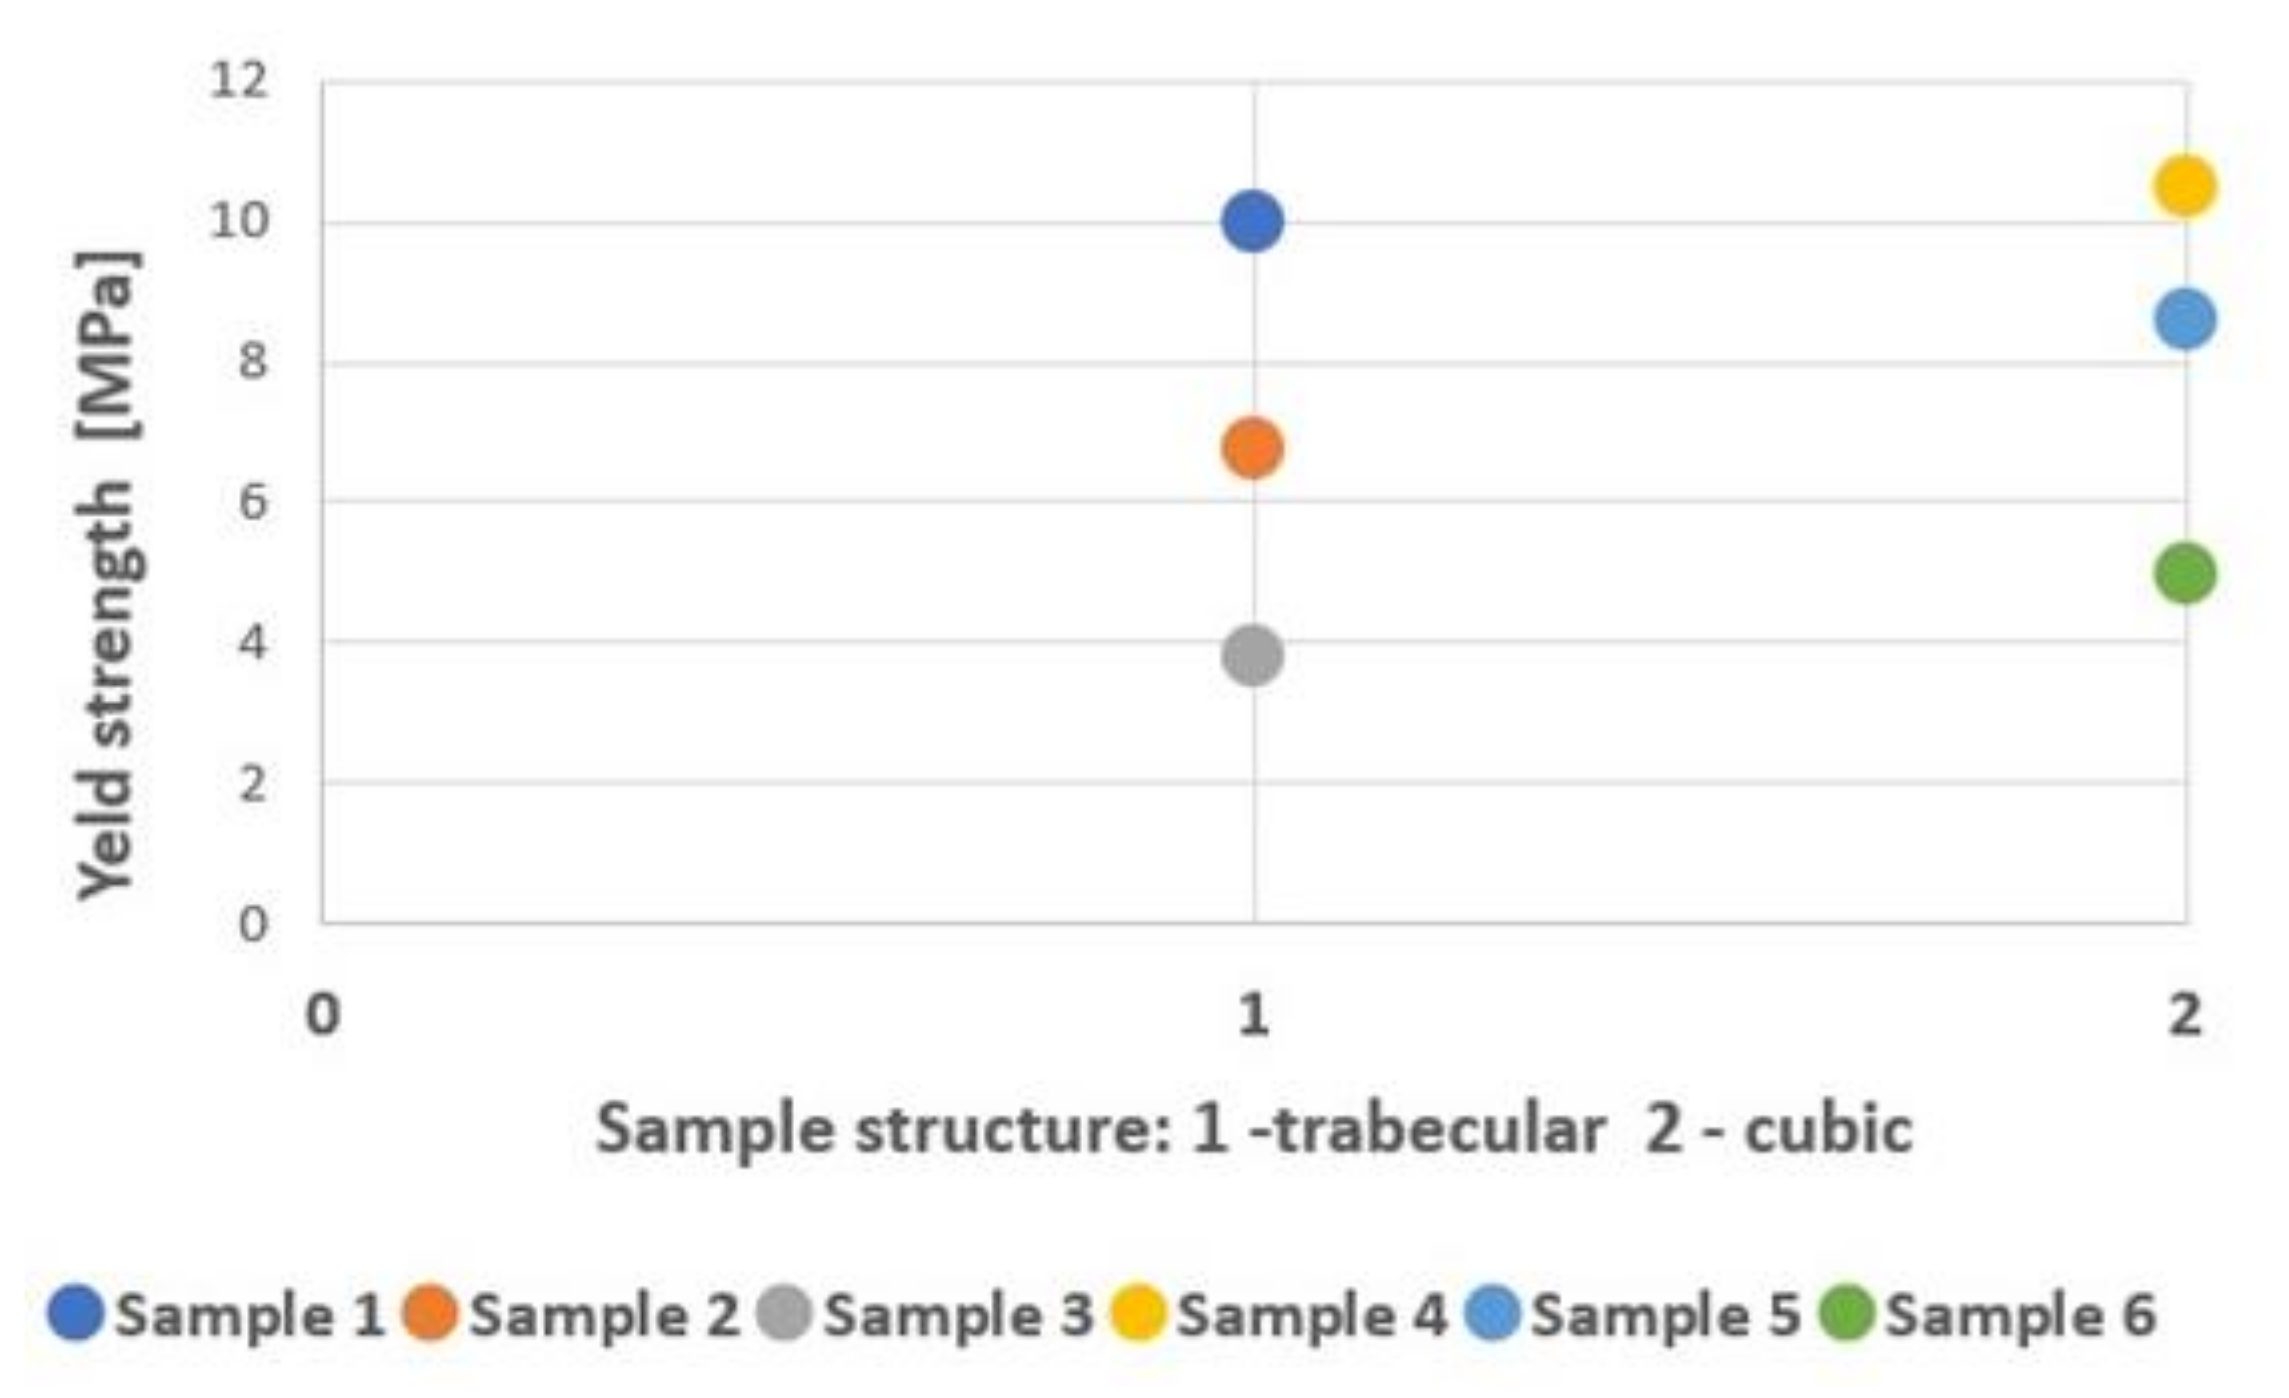
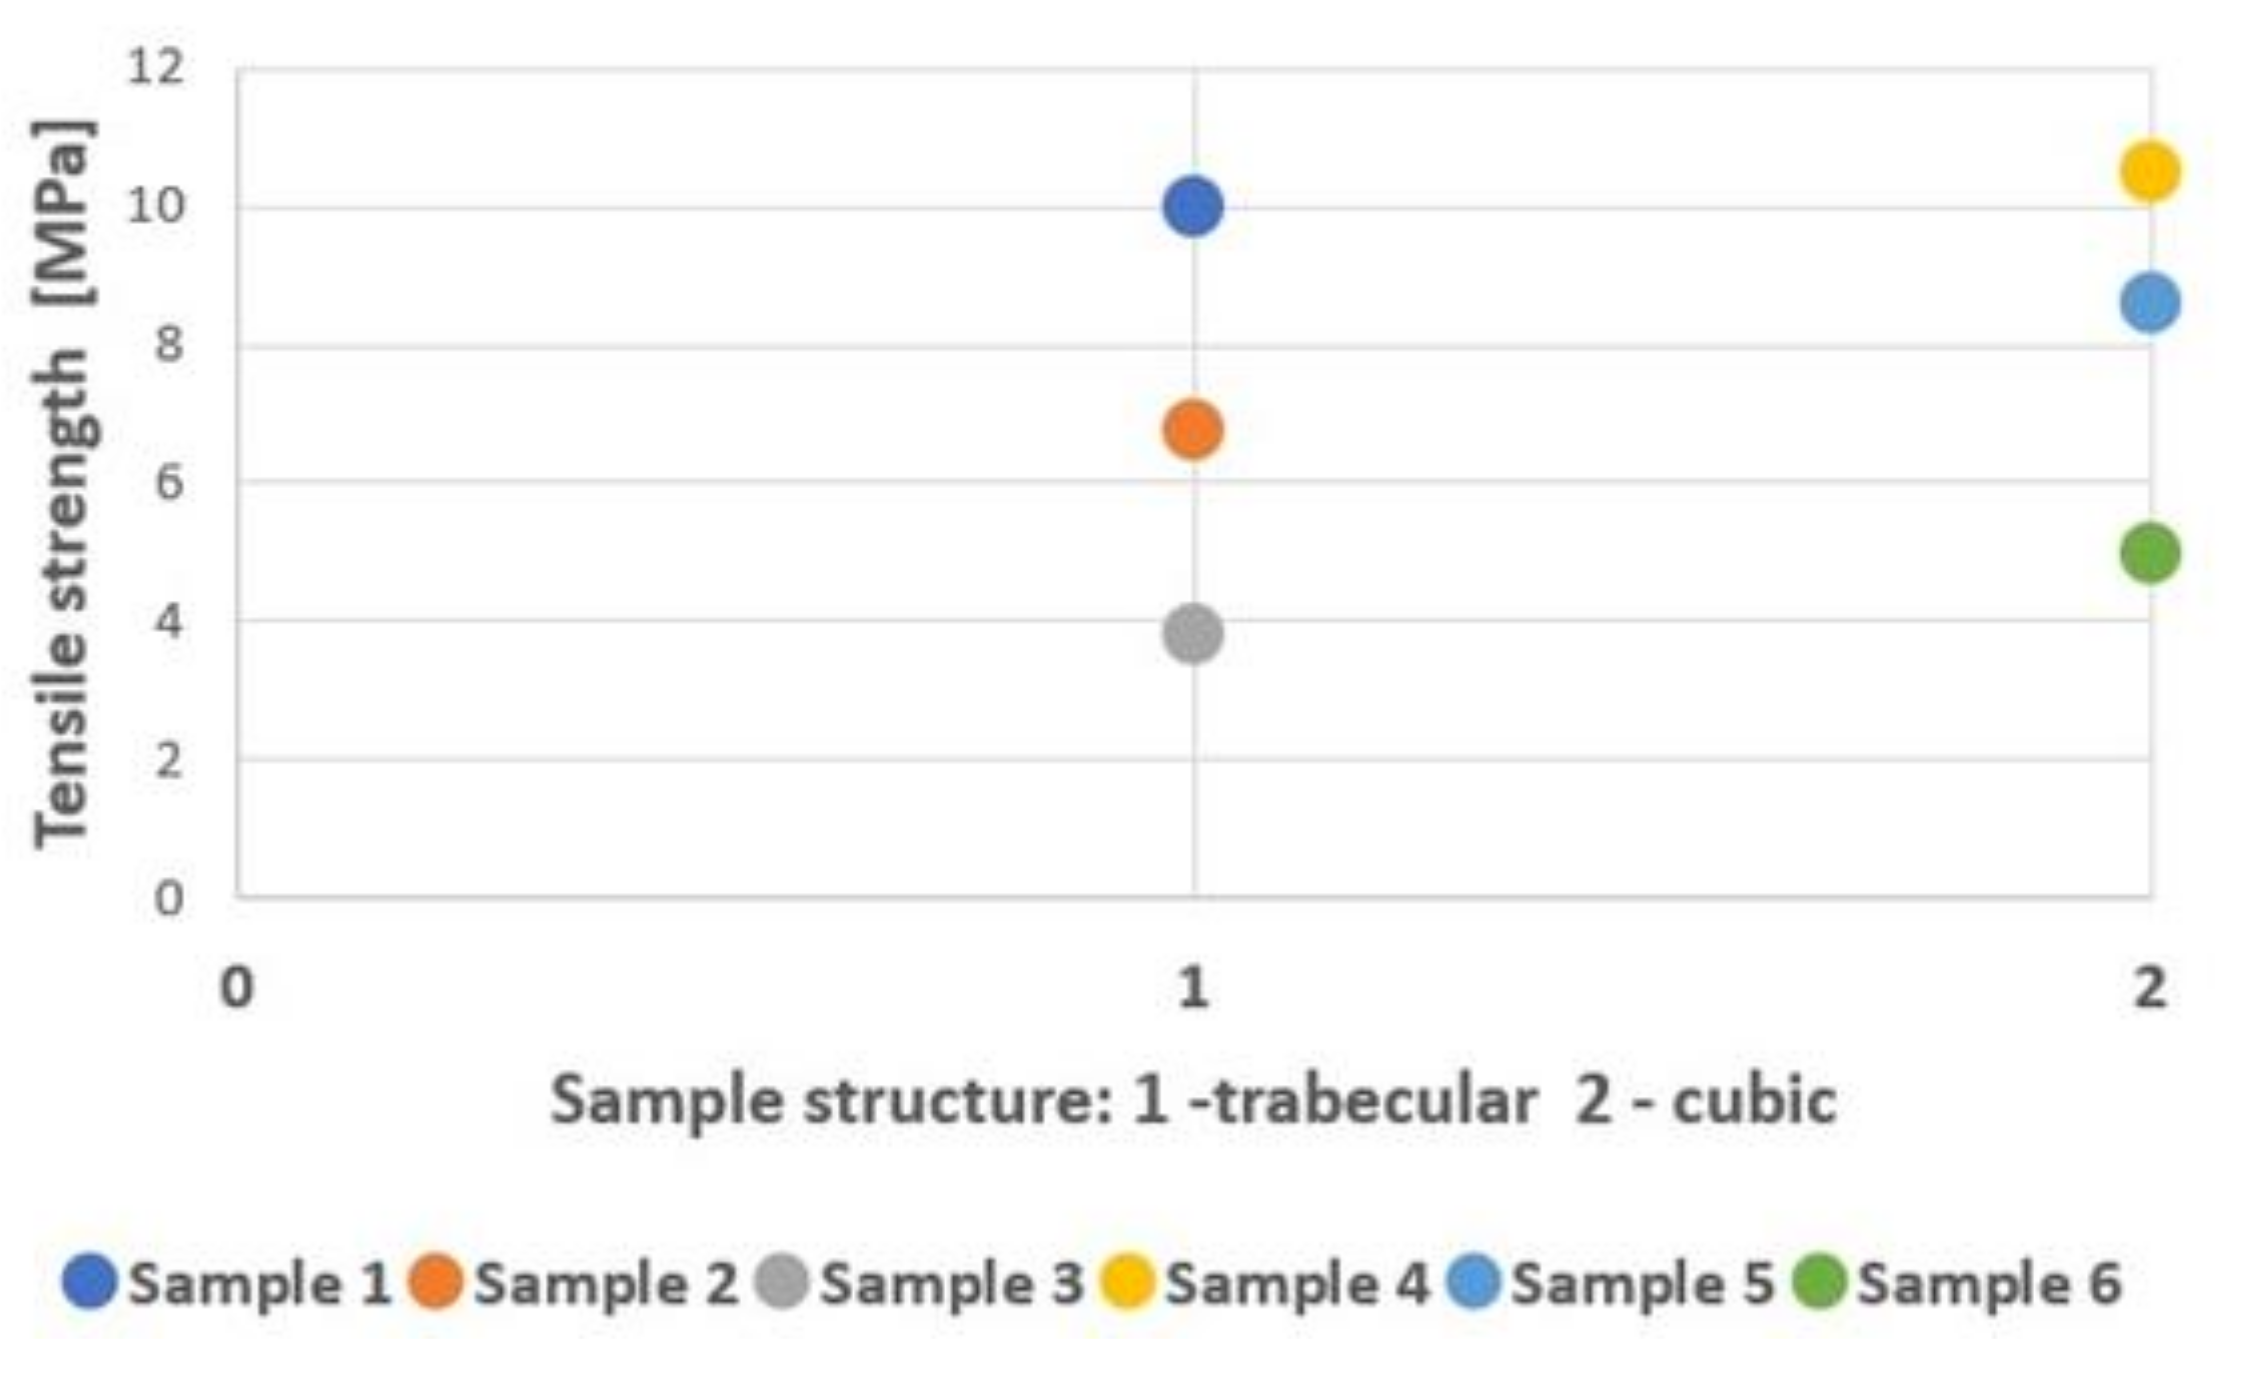
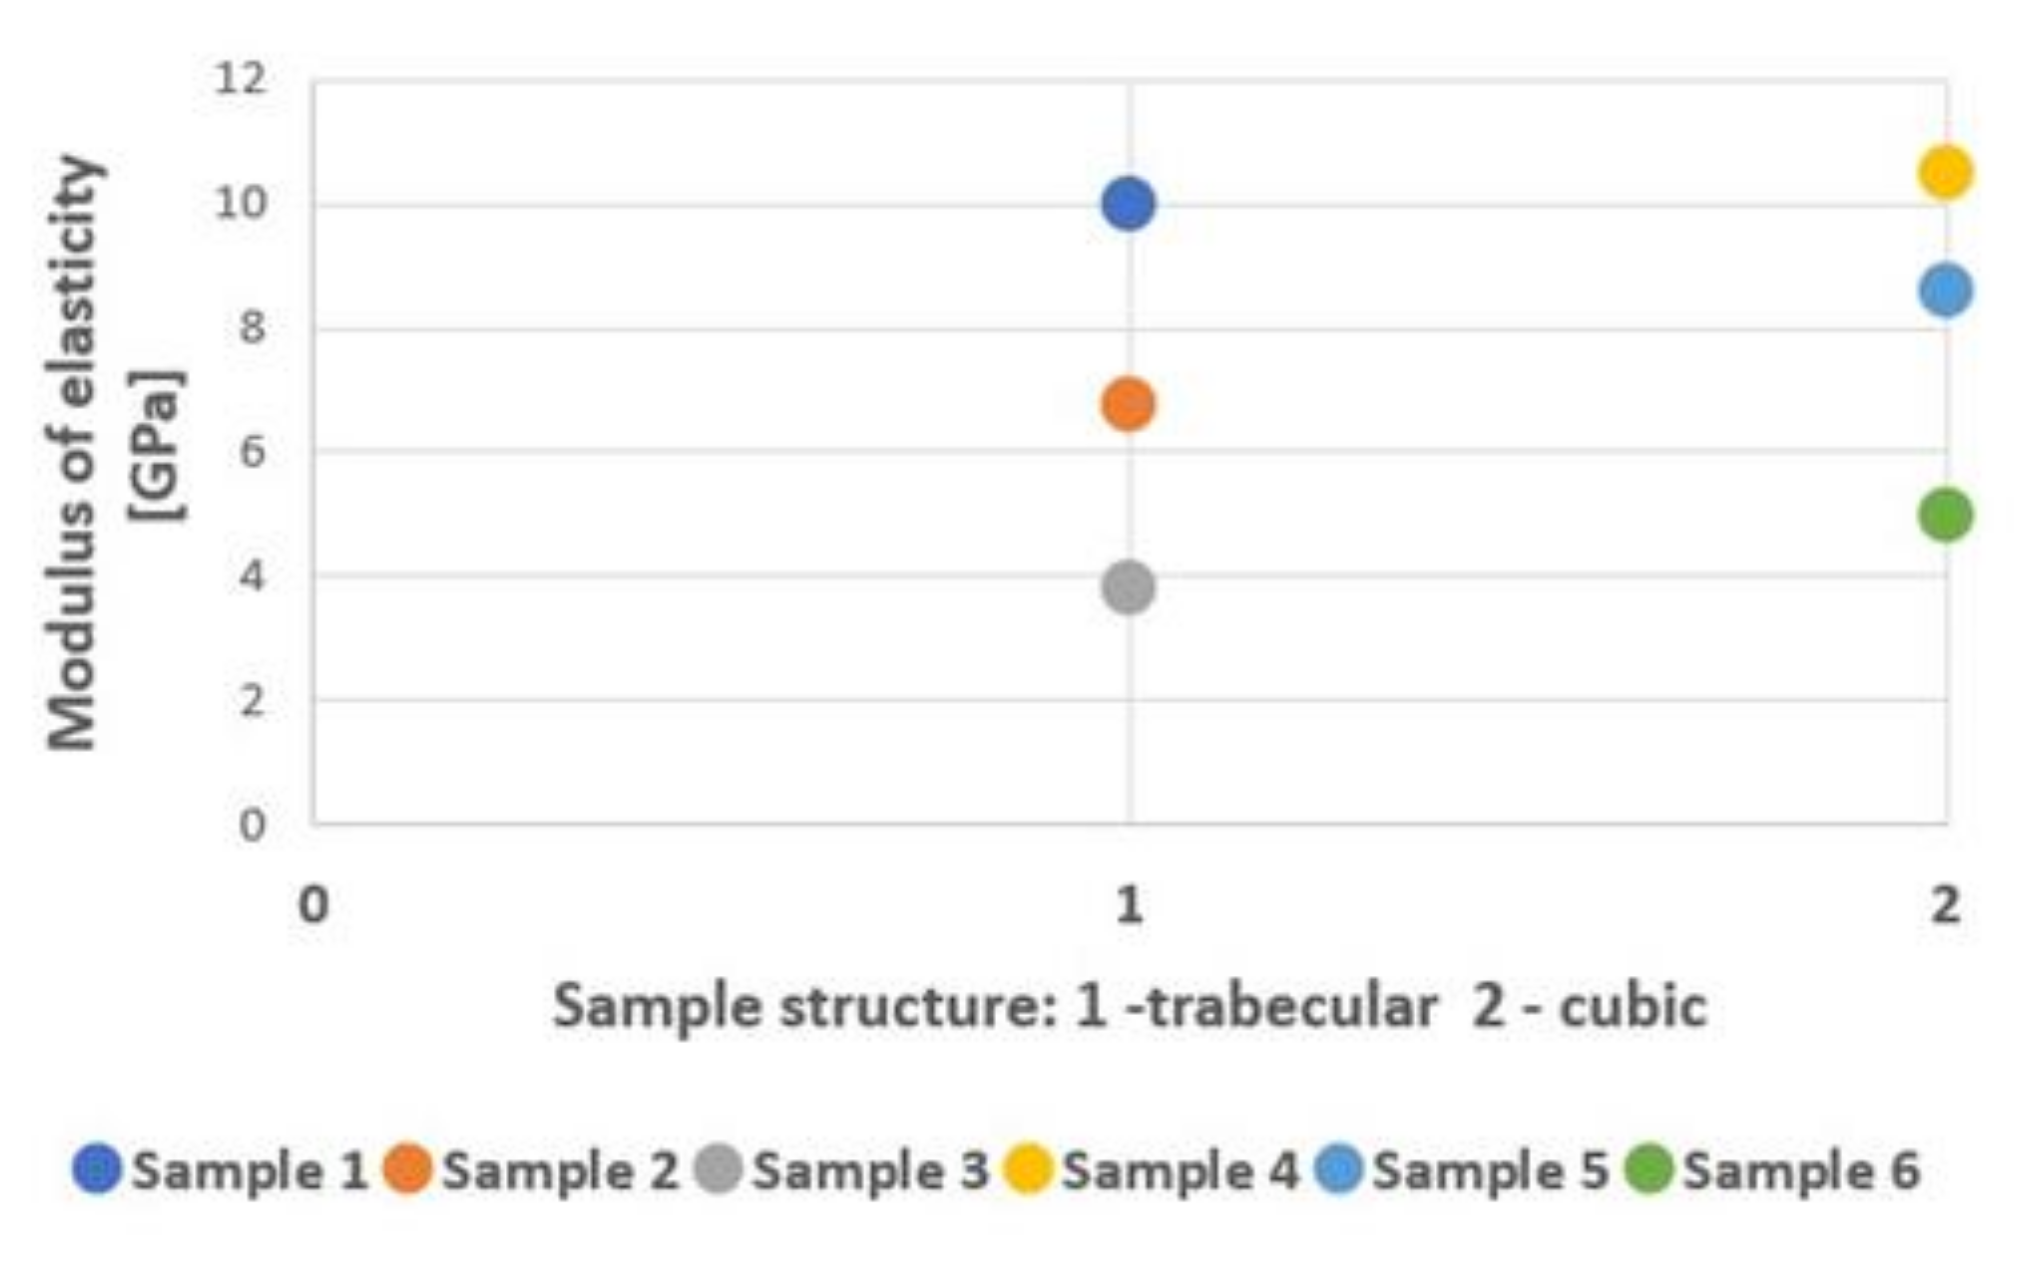
3.3. Mechanical Testing

Mechanical properties of the selected samples were determined to estimate the effect of type and experimental conditions of the manufacturing process on these properties. The results of the pressure tests were evaluated especially concerning the structure and porosity of the samples. Observed mechanical characteristics (e.g., yield strength, tensile strength) of the test specimens were compared.

Pressure Testing

Mechanical testing of samples and evaluation of their behavior under pressure exposure was performed on all six types of samples. The resulting deformations of the samples that occurred were bending (Figure 10a), fracturing (Figure 10b), and crushing (Figure 10c). The representative pictures of sample failure types are shown in Figure 10.
During the pressure test of sample type 1, an identical fracture occurred in 9 of the 10 testing samples. Due to the height of the sample, deformation occurred in the longitudinal direction (the sample began to deviate off the longitudinal axis). Subsequently, there was a diagonal break, the shear, caused by shear forces. The top and bottom of the sample were completely separated after failure. Fracture of the test specimens occurred at approximately 20% of deformation. The area of elastic deformation of type 1 sample lasted on average up to 775 MPa at a force of 52 kN, which is approximately 8% of the relative compression of the sample. The maximum stress that was applied to the failure of the samples was on average 1789 MPa at a maximum force of 81 kN. The difference between the yield strength and the fracture is approximately 400 MPa. The modulus of elasticity was around 10 GPa. The linear deformation of the samples can be seen from the diagram in Figure 10a. The yield strength is not visible and the transition between plastic and elastic deformation is smooth.
All type 2 specimens had the same behavior during pressure testing. The failure of the samples occurred due to shear stress, but further, the samples were deformed by crushing the individual layers of pores. Crushing occurred in the middle part of the sample. Fracture deformation of the samples began at approximately 25% of the relative compression of the sample. The samples began to plastically deform at an average value of 363 MPa, where the applied force was approximately 18 kN. The maximum stress generated in the test specimens is on average 481 MPa at a maximum applied force of 23 kN. The difference between the yield strength and the stress limit is 118 MPa. The modulus of elasticity was about 6.8 GPa. It can be seen from the diagram in Figure 11b that the area of plastic deformation is not linear. The area where the fracture of the samples occurred, and the subsequent failure of the individual pore layers was observed.
At the specific pore size of sample 3, the samples were deformed by crushing. The individual layers of the sample were crushed gradually. When the individual pore layer was loaded, the compressive force increased, and conversely, when the layer was deformed, the compressive force decreased. This process was repeated until a 60% deformation was reached. All samples in a testing group of sample 3 had the same course of deformation. Under load, the area of plastic deformation occurred at a load value of 8.9 kN. The resulting stresses at this load value 251 MPa. The value of the maximum stress induced in the samples is 302 MPa at a maximum force of 11 kN. The difference between the yield strength and the stress limit is about 50 MPa. All samples started crushing at about 7% of the relative compression. From the diagram in Figure 11c, it is possible to see the loading and unloading of individual crushed pore layers.
During the pressure testing of sample 4, not all manufactured pieces were evaluated because of the high strength of this type of specimen and due the machine limitation. The two specimens did not withstand the load and their deformation occurred due to a fracture caused by shear forces. For other samples, no external fracture has occurred. The whole course of deformation was similar to the samples of type 1. Fracture of the samples occurred at approximately 32% of relative compression. The area of plastic deformation occurred at a load value of 77 kN at a stress value of 1170 MPa. The average maximum stress that arose in the samples was 1618 MPa, which is the highest value of the maximum stress. The maximum loading force used was up to 120 kN. There is a difference of approximately 450 MPa between the onset of plastic deformation and fracture. The approximate modulus of elasticity ranged from 10 GPa to 11 GPa. The area of plastic deformation has a linear course (Figure 11d). The end of testing occurred at the breaking of the samples.
Disruption and fracture of sample type 5 occurred due to shear forces. In the first phase of deformation, the specimens began to deviate from the longitudinal axis, and in the second phase, fracture occurred. Unlike other samples that were deformed in this way, the top and bottom of the sample remained inseparable. There was no crushing of the material observed. In this type of sample, the specimens began to plastically deform at a loading force of approximately 31 kN, creating a stress of approximately 525 MPa in the specimens. The maximum stress at which the samples were mechanically disrupted was 1160 MPa at a maximum force of 82 kN. The average value of the modulus of elasticity in these samples was 8.6 GPa. The average value at which a fracture occurred is 30% of the relative compression. From the beginning of the plastic deformation to the fracture value, the difference is 635 MPa. It can be seen from the diagram in Figure 11e that after reaching the maximum stress, the samples began to break. In the first phase of the fracture, the sample was relieved and subsequently loaded. This was because the crushing of one layer of pores occurred at first, and subsequently, the sample was sheared.
During the pressure testing of the type 6 sample, the test specimens were disrupted due to shear forces. The resulting failure of the structure resembles a crack, which did not cause the separation of the upper and lower parts of the specimens. The sample fracture occurred at approximately 28% of the relative compression. The area of plastic deformation occurred at a stress value of 198 MPa on average, which arose under a force of 3.5 kN. The maximum stress that arose when loading the sample is on average 1033 MPa at a maximum force of 45 kN. To break specimens, the stress value had to be increased from the yield point by 835 MPa. The value of the modulus of elasticity is on average 5 GPa. The stress increase in the area of plastic deformation had a linear course. It can be seen from the diagram in Figure 11f that approximately 30% relative compression of the sample was required to break the sample. Crushing of pore layers can be seen on some samples. Results of mechanical testing of six types of prepared samples are listed in Table 6.
The yield strength and the area of elastic deformation decrease as the pore size increases. Samples with pore size of 600 µm had the lowest values and samples with pore size of 200 µm had the highest values of yield strength. Comparison of yield strength of each sample type with the pore size of the sample is shown in Figure 12.
A comparison of the maximum tensile strength of the 6 types of samples considering the pore size is shown graphically in Figure 13. The values of the maximum tensile strength depend not only on the size of the pores but also on the type of structure of the test specimens. The highest value of the maximum tensile strength was observed for sample type 4, with a pore size of 200 µm (Figure 13). The modulus of elasticity decreases with the pore size increasing. For samples with a pore size of 600 µm, the lowest values of the modulus of elasticity were evaluated. In contrast, for samples with a pore size of 200 µm, the modulus of elasticity exhibited the highest value. Figure 14 compares the approximate values of the modulus of elasticity of the tested samples. These values show the resistance of the samples to deformation.
For a detailed and deeper understanding of mechanical properties, it is necessary to look at the resulting values of mechanical characteristics for the specific structure of the sample. In the figures, the structures are numbered 1 and 2, where:
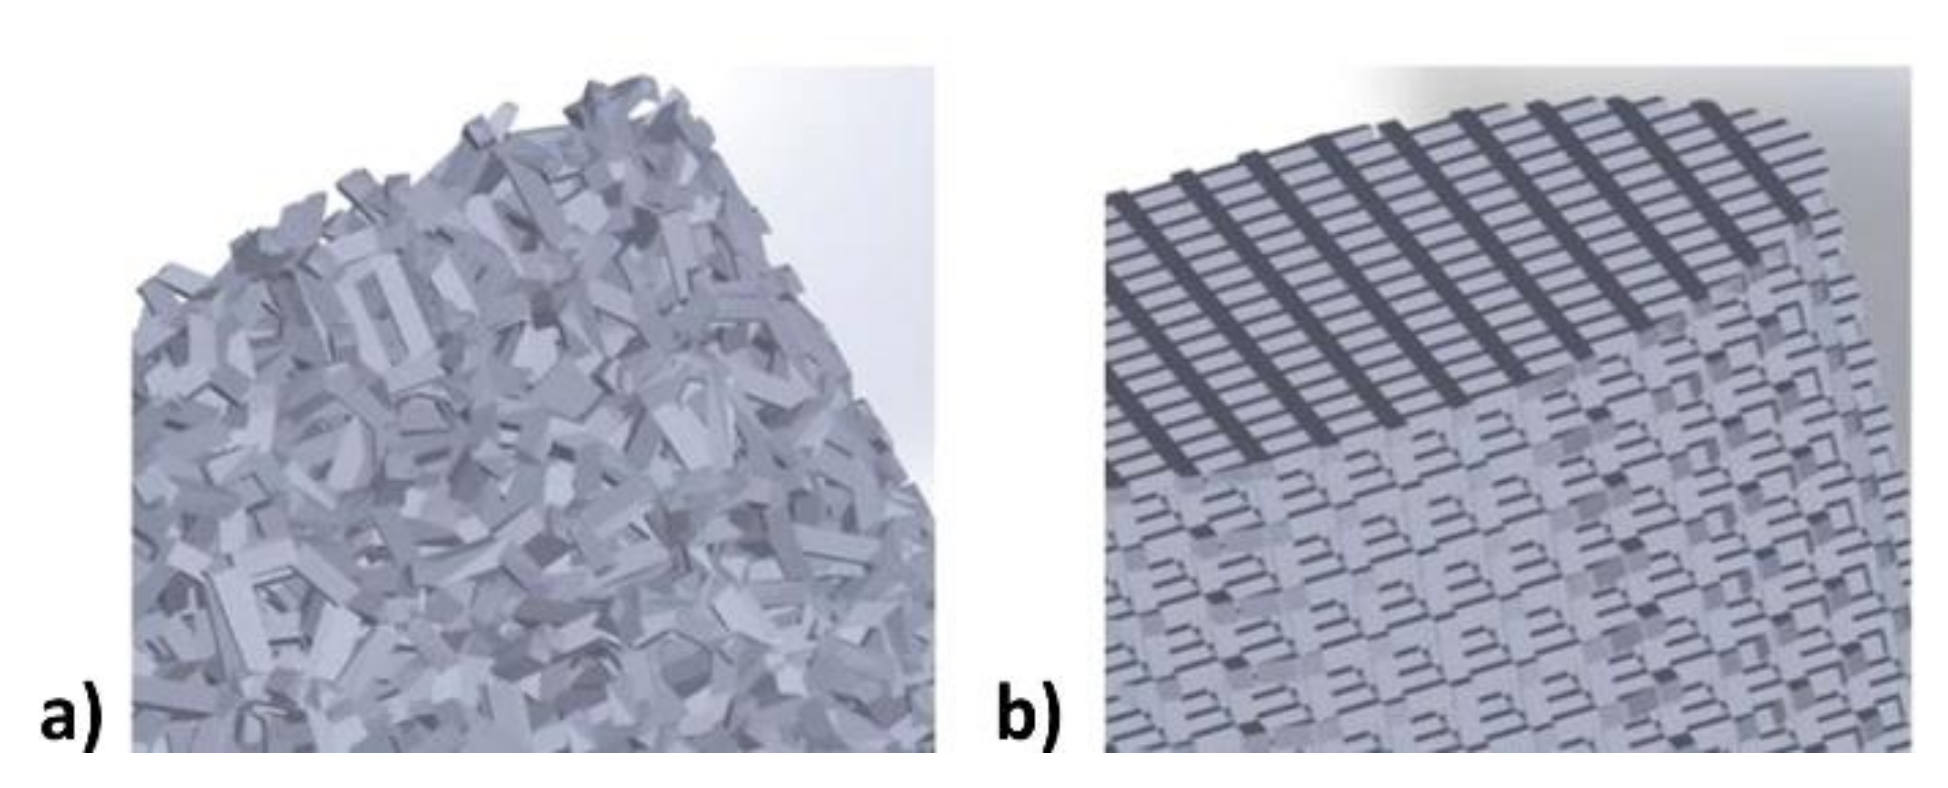
  • 1—trabecular structure
  • 2—cubic structure
It can be seen from Figure 15 that for the trabecular structure of the samples, the values of the yield strength were lower compared to the cubic structure. The lowest yield strength values were obtained for samples with a cubic structure, but at the same time, the highest yield strength values were achieved for these types of samples. It could be explained by the wide range of measured values for the cubic structures.
The highest values of maximum tensile strength were obtained for samples with a cubic structure, and vice versa, the tensile strength was the lowest for the trabecular structures. In Figure 16, the values of tensile strength for samples 1–6 in relation to the structure are shown.
As can be seen in Figure 17, the values for the modulus of elasticity are approximately in the same range for both types of structures.
From the data presented above, it can be concluded that a reduction in the weight of the tested samples was achieved by increasing their porosity. The highest porosity value was found for sample type 3. Generally, a higher porosity was achieved in the samples with a trabecular structure. The values of the mechanical properties of the test specimens, such as yield strength, tensile strength, and modulus of elasticity, increased with a decrease in pore size. Based on the obtained results it can be concluded that trabecular structures with larger pore sizes are more suitable for the production of biomaterials with desired mechanical properties matching the properties of the bone.

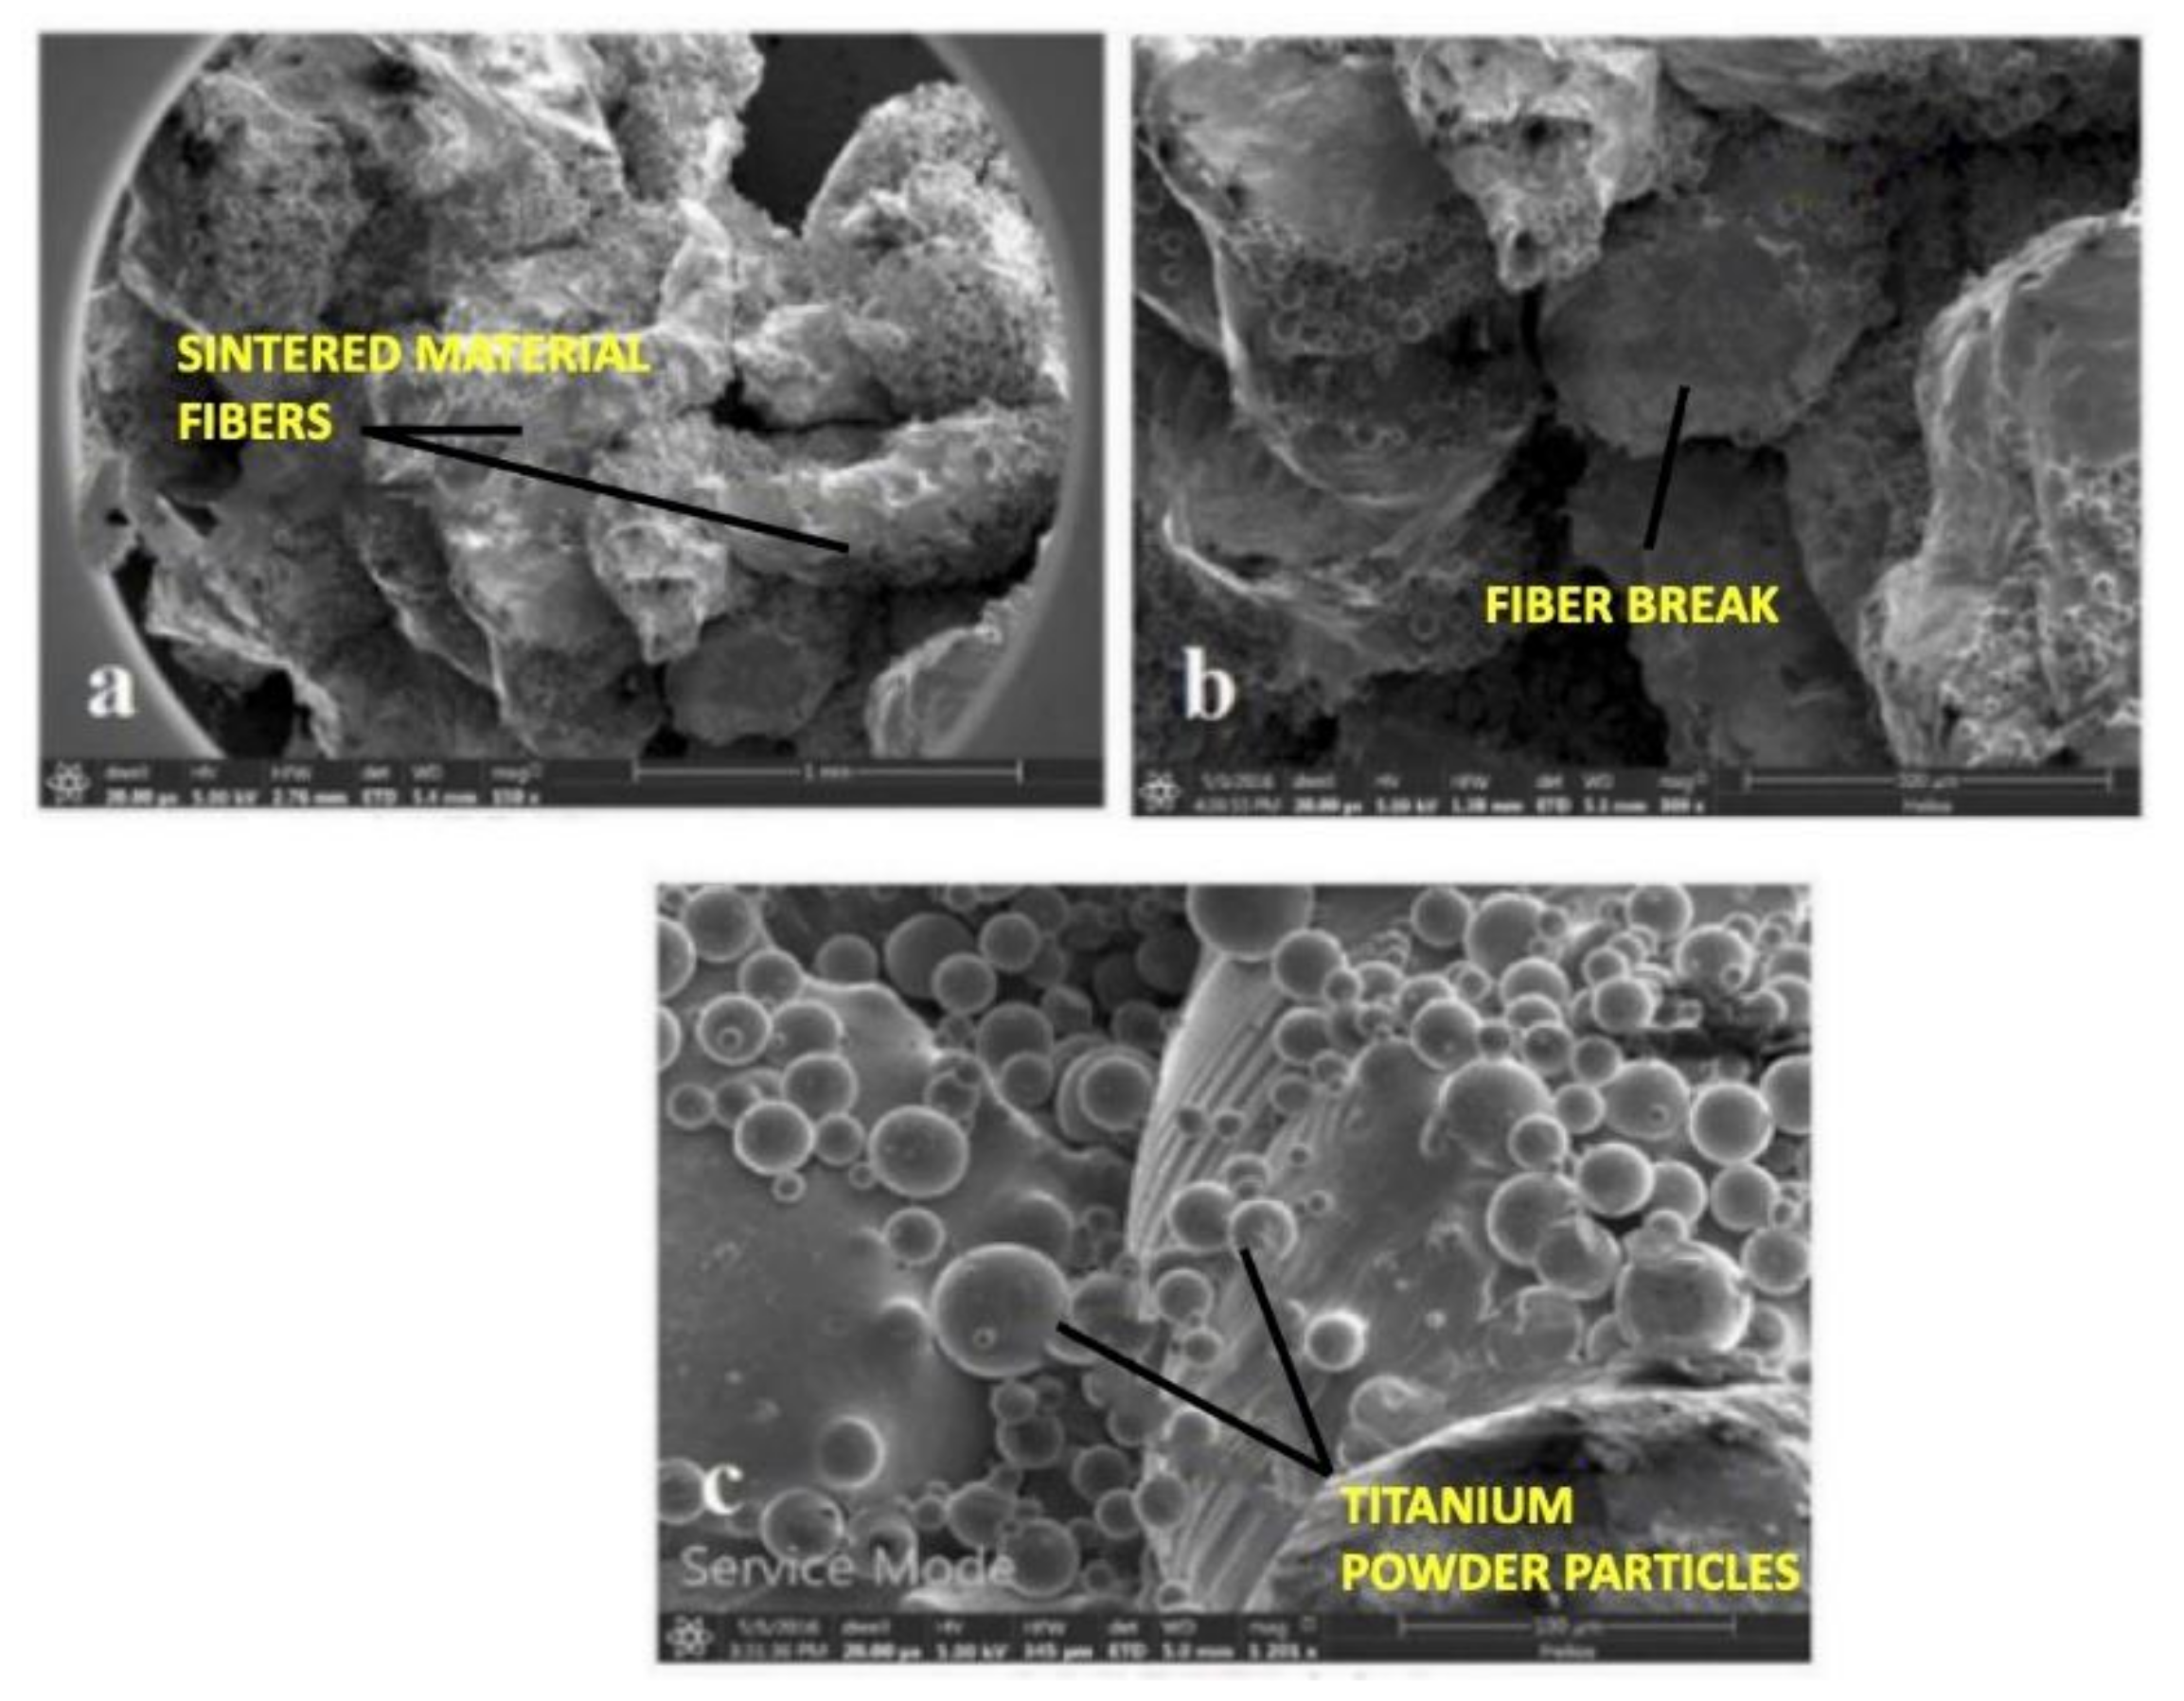
3.4. The Microstructure of Sintered Titanium Powder

Figure 18 shows the microstructure of the sintered Ti6Al4V powder after performing a pressure test. The following images show a selected part of the sample. The following images show the selected part of the testing sample with a size of 1 mm (Figure 18a), 100 μm (Figure 18b), and 500 μm (Figure 18c).
Figure 18a shows the fibers of the sintered material formed by the SLM. It represents a sintered powder in a compact form. The individual fibers are formed according to the direction of the laser beam layer by layer. More detailed objects are depicted in Figure 18c. The spherical objects represent titanium powder particles. This is a residual sintered titanium powder that could not be removed during the cleaning of the test specimens. Furthermore, it is possible to notice individual fibers that were mechanically damaged during the pressure test.

4. Discussion

Li et al. analyzed the mechanical properties of a porous biomaterial consisting of a titanium alloy Ti6Al4V. The test specimens were produced by additive electron beam melting (EBM) technology and tested for mechanical properties using a static pressure test. Cylindrical samples with a diameter of 10 mm were produced in three variants: honeycomb structure, orthogonal structure, and layer structure. Pore sizes ranged from 500 µm to 600 µm. The results showed that the porous structure of the material significantly reduced the stress shielding effect. The compressive strength of these materials was in the range of 163 MPa to 286 MPa and Young’s modulus of elasticity was in the range of 14.5 GPa to 38.5 GPa, which is similar to cortical bone values [27].
Arabnejad et al. in their study dealt with tetrahedron and octahedron topologies made of Ti6Al4V alloy. The samples were produced by SLM technology and had the shape of a block, the width varied from 9 mm to 14 mm and the height from 15 mm to 22 mm. The pore size for the tetrahedron was determined to 500 µm and for the octahedron to 770 µm. For each topology, four different percentual porosities were chosen (50%, 60%, 70%, and 75%) to ensure that the entire porosity range was covered. By mechanical testing, it was determined that the stiffness of the material was 1.2 GPa to 4.6 GPa, the maximum compressive strength was in the range of 31 MPa to 228 MPa, and Young’s modulus of elasticity decreased significantly with an increase in porosity [28]. This trend of decreasing Young’s modulus with increasing porosity percentage for porous structures made of Ti6Al4V alloy has also been reported in publications by other authors [12,29,30,31,32,33].
Another important factor in the formation of porous structures is the size of the individual pores. The change of these dimensions in porous structures has a fundamental effect on the permeability of cells and nutrients, the flow of blood through the pores of the material as well as the influence of growth factors. For this reason, the optimal pore size varies considerably depending on the application [34].
Itälä et al. conducted a study in which they implanted titanium prostheses into the rabbit femoral bone. They assumed that the optimal pore size for bone growth is in the range of 100 µm to 400 µm. They formed an implant structure made of titanium material, the pores of which reached a size of 50 µm to 125 µm It was found that 12 weeks after implantation the growth of bone structures was not affected by the pore size or the thickness of the implant structure itself. The average value of bone growth ranged from 64% to 78% under non-load-bearing conditions [35].
Braem et al. used a 4 mm diameter disk on which a coating of commercially pure titanium with a thickness of 1 mm was applied in their study. These implant structures were subsequently implanted into the rabbit tibial bone. Four weeks after implantation, they found that bone growth occurred in micropores smaller than 10 µm [36].
On the other hand, Taniguchi et al. used SLM technology to create porous plates and porous cylinders from commercially pure titanium powder. Titanium plates were implanted into the rabbit tibial bone and titanium cylinders were implanted into the rabbit femoral bone. The porosity was 65%, with pore sizes of 300 µm, 600 µm, and 900 μm. Individual observations were made after 2, 4, and 8 weeks. Histological examination revealed that the implant structure with a pore size of 600 μm showed a higher rate of bone overgrowth after 2 weeks. After 4 to 8 weeks, this condition equalized, and all porous structures achieved the same rate of bone growth. In the case of implants implanted in cancellous bone, significantly higher growth of bone cells was observed in a structure with a pore size of 900 μm compared to a structure with a pore size of 300 μm [37].
Based on the above-mentioned publications, it can be stated that the correctly chosen porous structure significantly contributes to reducing the stress shielding effect as well as to increasing the overgrowth of the implant by the bone structure while maintaining the required mechanical properties. Although opinions on pore size vary from author to author, additional animal testing of the created implantation structures would greatly contribute to achieving another relevant result in the field of implantology.

5. Conclusions

Knowledge of mechanical properties is a key insight to the successful application of porous structures in the production of bone implants. Titanium is successfully used in medical implants because it meets several biological and mechanical criteria. However, the mechanical properties of Ti-based materials differ from the properties of bones, which is undesirable because the most suitable replacement should possess mechanical characteristics as close as possible to the original biological bone. However, these differences can be largely eliminated by the suitable structure of the final titanium product, which does not adversely affect other desired properties of the implant, concerning the application to biological tissues. The presented study aimed to prepare samples with reduced weight and stress shielding effect suppression by introducing various types of porous structures. Porous samples with various pore sizes (200, 400, and 600 µm) with trabecular and cubic topology were produced in certified medical software via the SLM method. The highest porosity and thus the lowest weight were achieved in the trabecular samples with a 600 µm pore size. In general, the yield strength, tensile strength, and modulus of elasticity in-creased with a decrease in pore size. All tested samples showed optimal values of maximum stress and tensile strength. Trabecular structures with larger pores were evaluated as the most suitable to produce biomaterials with desired mechanical properties like those of human bone. In the future, the samples can be coated with ceramics or polymers to improve their biological and mechanical properties and cultured with biological tissue to study the process of osseointegration, bone overgrowth, and adaptation.

Author Contributions

R.H.: conceptualization, methodology, writing—original draft, funding acquisition, supervision, project administration; M.S.: methodology, writing—original draft, formal analysis; Z.O.K.: writing—original draft, writing—review and editing, visualization; R.G.: writing—original draft, writing—review and editing, visualization; L.M.: software, writing—original draft, data curation, investigation; V.R.: software, data curation, investigation; T.T.: writing—original draft, data curation, investigation; M.K.: data curation, investigation; M.R.: data curation, investigation; R.O.: writing—review and editing, supervision, project administration; J.Ž.: conceptualization, methodology, supervision. All authors have read and agreed to the published version of the manuscript.

Funding

This work was supported by the Slovak Research and Development Agency under the contract No. APVV-16-0029, APVV-17-0008, APVV-17-0278, Scientific Grant Agency of the Ministry of Education, Science, Research and Sport of the Slovak Republic (project VEGA 1/0095/21 and VEGA 1/0179/19). The achieved results were created within the investigation of the project Stimuli for research and development no. 2018/14432:1-26CO supported by the Ministry of Education of Science of Research and Sport and Centre of medical bio-additive research and the project implementation: “Open scientific Integrated Infrastructure for the project: Center for Medical Bioadditive Research and Production (CEMBAM), code ITMS2014 +: 313011V358, supported by the Operational Programme Integrated Infrastructure, funded by the ERDF”.

Institutional Review Board Statement

Not applicable.

Informed Consent Statement

Not applicable.

Data Availability Statement

Data available on request from the authors.

Conflicts of Interest

The authors declare no conflict of interest.

References

  1. El-Habashy, S.E.; Eltaher, H.M.; Gaballah, A.; Zaki, E.I.; Mehanna, R.A.; El-Kamel, A.H. Hybrid bioactive hydroxyapatite/polycaprolactone nanoparticles for enhanced osteogenesis. Mater. Sci. Eng. C 2021, 119, 111599. [Google Scholar] [CrossRef] [PubMed]
  2. Agripa, H.; Botef, I. Modern Production Methods for Titanium Alloys: A Review. Titan. Alloys Nov. Asp. Their Manuf. Process. 2019, 1, 1–15. [Google Scholar] [CrossRef] [Green Version]
  3. Kuhn, L.T. Biomaterials. In Introduction to Biomedical Engineering; Academic Press: Boston, MA, USA, 2005; pp. 255–312. ISBN 9780122386626. [Google Scholar]
  4. Chen, F.-M.; Liu, X.; Polym, P.; Author, S. Advancing biomaterials of human origin for tissue engineering HHS Public Access Author manuscript. Prog. Polym. Sci. 2016, 53, 86–168. [Google Scholar] [CrossRef] [Green Version]
  5. Kalantari, S.M.; Arabi, H.; Mirdamadi, S.; Mirsalehi, S.A. Biocompatibility and compressive properties of Ti-6Al-4V scaffolds having Mg element. J. Mech. Behav. Biomed. Mater. 2015, 48, 183–191. [Google Scholar] [CrossRef] [PubMed]
  6. Goharian, A.; Abdullah, M.R. Bioinert Metals (Stainless Steel, Titanium, Cobalt Chromium); Elsevier Inc.: Amsterdam, The Netherlands, 2017; ISBN 9780128047583. [Google Scholar]
  7. Dai, S.J.; Wang, Y.; Chen, F.; Yu, X.Q.; Zhang, Y.F. Design of new biomedical titanium alloy based on d-electron alloy design theory and JMatPro software. Trans. Nonferrous Met. Soc. China 2013, 23, 3027–3032. [Google Scholar] [CrossRef]
  8. Arifin, A.; Sulong, A.B.; Muhamad, N.; Syarif, J.; Ramli, M.I. Material processing of hydroxyapatite and titanium alloy (HA/Ti) composite as implant materials using powder metallurgy: A review. Mater. Des. 2014, 55, 165–175. [Google Scholar] [CrossRef]
  9. Takemoto, M.; Fujibayashi, S.; Neo, M.; Suzuki, J.; Kokubo, T.; Nakamura, T. Mechanical properties and osteoconductivity of porous bioactive titanium. Biomaterials 2005, 26, 6014–6023. [Google Scholar] [CrossRef]
  10. Lewallen, E.A.; Riester, S.M.; Bonin, C.A.; Kremers, H.M.; Dudakovic, A.; Kakar, S.; Cohen, R.C.; Westendorf, J.J.; Lewallen, D.G.; Van Wijnen, A.J. Biological strategies for improved osseointegration and osteoinduction of porous metal orthopedic implants. Tissue Eng. Part B Rev. 2015, 21, 218–230. [Google Scholar] [CrossRef] [PubMed] [Green Version]
  11. Rifai, A.; Houshyar, S.; Fox, K. Progress towards 3D-printing diamond for medical implants: A review. Ann. 3D Print. Med. 2021, 1, 100002. [Google Scholar] [CrossRef]
  12. Parthasarathy, J.; Starly, B.; Raman, S.; Christensen, A. Mechanical evaluation of porous titanium (Ti6Al4V) structures with electron beam melting (EBM). J. Mech. Behav. Biomed. Mater. 2010, 3, 249–259. [Google Scholar] [CrossRef]
  13. Khosravani, M.R.; Reinicke, T. On the Use of X-ray Computed Tomography in Assessment of 3D-Printed Components. J. Nondestruct. Eval. 2020, 39, 1–17. [Google Scholar] [CrossRef]
  14. Wang, Y.; Xu, Z.; Wu, D.; Bai, J. Current status and prospects of polymer powder 3D printing technologies. Materials 2020, 13, 2406. [Google Scholar] [CrossRef]
  15. Chin, S.Y.; Dikshit, V.; Priyadarshini, B.M.; Zhang, Y. Powder-based 3D printing for the fabrication of device with micro and mesoscale features. Micromachines 2020, 11, 29–40. [Google Scholar] [CrossRef] [PubMed]
  16. Munir, K.S.; Li, Y.; Wen, C. Metallic scaffolds manufactured by selective laser melting for biomedical applications. In Metallic Foam Bone: Processing, Modification and Characterization and Properties; Elsevier: Amsterdam, The Netherlands, 2017; pp. 1–23. ISBN 9780081012901. [Google Scholar]
  17. Chang Tu, C.; Tsai, P.I.; Chen, S.Y.; Kuo, M.Y.P.; Sun, J.S.; Chang, J.Z.C. 3D laser-printed porous Ti6Al4V dental implants for compromised bone support. J. Formos. Med. Assoc. 2020, 119, 420–429. [Google Scholar] [CrossRef]
  18. Ahmed, A.; Al-Rasheed, A.; Badwelan, M.; Alghamdi, H.S. Peri-Implant bone response around porous-surface dental implants: A preclinical meta-analysis. Saudi Dent. J. 2021. [Google Scholar] [CrossRef]
  19. Zheng, J.P.; Chen, L.J.; Chen, D.Y.; Shao, C.S.; Yi, M.F.; Zhang, B. Effects of pore size and porosity of surface-modified porous titanium implants on bone tissue ingrowth. Trans. Nonferrous Met. Soc. China 2019, 29, 2534–2545. [Google Scholar] [CrossRef]
  20. Jakus, A.E.; Geisendorfer, N.R.; Lewis, P.L.; Shah, R.N. 3D-printing porosity: A new approach to creating elevated porosity materials and structures. Acta Biomater. 2018, 72, 94–109. [Google Scholar] [CrossRef]
  21. Marin, E.; Fusi, S.; Pressacco, M.; Paussa, L.; Fedrizzi, L. Characterization of cellular solids in Ti6Al4V for orthopaedic implant applications: Trabecular titanium. J. Mech. Behav. Biomed. Mater. 2010, 3, 373–381. [Google Scholar] [CrossRef] [PubMed]
  22. Ran, Q.; Yang, W.; Hu, Y.; Shen, X.; Yu, Y.; Xiang, Y.; Cai, K. Osteogenesis of 3D printed porous Ti6Al4V implants with different pore sizes. J. Mech. Behav. Biomed. Mater. 2018, 84, 1–11. [Google Scholar] [CrossRef]
  23. Bandyopadhyay, A.; Espana, F.; Balla, V.K.; Bose, S.; Ohgami, Y.; Davies, N.M. Influence of porosity on mechanical properties and in vivo response of Ti6Al4V implants. Acta Biomater. 2010, 6, 1640–1648. [Google Scholar] [CrossRef] [PubMed] [Green Version]
  24. International Organization for Standardization. Mechanical Testing of Metals—Ductility Testing—Compression Test for Porous and Cellular Metals; ISO Standard No. 13314:2011(E); International Organization for Standardization: Geneva, Switzerland, 2011; pp. 1–7. [Google Scholar]
  25. Concept Laser Titanium Alloy (Powder) Acc. to EN ISO 9693/DIN EN ISO 22674, Type 4. Available online: https://www.dentaurum.de/files/989-800-03.pdf (accessed on 25 February 2021).
  26. Conceptlaser Mlab Cusing R Metal Laser Melting System. Available online: https://pdf.directindustry.com/pdf/concept-laser/mlab-cusing-r/15662-683559.html (accessed on 25 February 2021).
  27. Li, X.; Feng, Y.F.; Wang, C.T.; Li, G.C.; Lei, W.; Zhang, Z.Y.; Wang, L. Evaluation of Biological Properties of Electron Beam Melted Ti6Al4V Implant with Biomimetic Coating In Vitro and In Vivo. PLoS ONE 2012, 7, e52049. [Google Scholar] [CrossRef]
  28. Arabnejad, S.; Burnett Johnston, R.; Pura, J.A.; Singh, B.; Tanzer, M.; Pasini, D. High-strength porous biomaterials for bone replacement: A strategy to assess the interplay between cell morphology, mechanical properties, bone ingrowth and manufacturing constraints. Acta Biomater. 2016, 30, 345–356. [Google Scholar] [CrossRef] [Green Version]
  29. Weißmann, V.; Bader, R.; Hansmann, H.; Laufer, N. Influence of the structural orientation on the mechanical properties of selective laser melted Ti6Al4V open-porous scaffolds. Mater. Des. 2016, 95, 188–197. [Google Scholar] [CrossRef]
  30. Guo, M.; Li, X. Development of porous Ti6Al4V/chitosan sponge composite scaffold for orthopedic applications. Mater. Sci. Eng. C 2016, 58, 1177–1181. [Google Scholar] [CrossRef]
  31. Kadkhodapour, J.; Montazerian, H.; Darabi, A.C.; Anaraki, A.P.; Ahmadi, S.M.; Zadpoor, A.A.; Schmauder, S. Failure mechanisms of additively manufactured porous biomaterials: Effects of porosity and type of unit cell. J. Mech. Behav. Biomed. Mater. 2015, 50, 180–191. [Google Scholar] [CrossRef] [PubMed]
  32. Ahmadi, S.M.; Yavari, S.A.; Wauthle, R.; Pouran, B.; Schrooten, J.; Weinans, H.; Zadpoor, A.A. Additively manufactured open-cell porous biomaterials made from six different space-filling unit cells: The mechanical and morphological properties. Materials 2015, 8, 1871–1896. [Google Scholar] [CrossRef] [PubMed] [Green Version]
  33. Zhao, S.; Li, S.J.; Hou, W.T.; Hao, Y.L.; Yang, R.; Misra, R.D.K. The influence of cell morphology on the compressive fatigue behavior of Ti-6Al-4V meshes fabricated by electron beam melting. J. Mech. Behav. Biomed. Mater. 2016, 59, 251–264. [Google Scholar] [CrossRef] [PubMed]
  34. Wang, X.; Xu, S.; Zhou, S.; Xu, W.; Leary, M.; Choong, P.; Qian, M.; Brandt, M.; Xie, Y.M. Topological design and additive manufacturing of porous metals for bone scaffolds and orthopaedic implants: A review. Biomaterials 2016, 83, 127–141. [Google Scholar] [CrossRef]
  35. Itälä, A.I.; Ylänen, H.O.; Ekholm, C.; Karlsson, K.H.; Aro, H.T. Pore diameter of more than 100 μm is not requisite for bone ingrowth in rabbits. J. Biomed. Mater. Res. 2001, 58, 679–683. [Google Scholar] [CrossRef] [PubMed]
  36. Braem, A.; Chaudhari, A.; Vivan Cardoso, M.; Schrooten, J.; Duyck, J.; Vleugels, J. Peri- and intra-implant bone response to microporous Ti coatings with surface modification. Acta Biomater. 2014, 10, 986–995. [Google Scholar] [CrossRef] [PubMed] [Green Version]
  37. Taniguchi, N.; Fujibayashi, S.; Takemoto, M.; Sasaki, K.; Otsuki, B.; Nakamura, T.; Matsushita, T.; Kokubo, T.; Matsuda, S. Effect of pore size on bone ingrowth into porous titanium implants fabricated by additive manufacturing: An in vivo experiment. Mater. Sci. Eng. C 2016, 59, 690–701. [Google Scholar] [CrossRef] [PubMed] [Green Version]
Figure 1. Computer-aided design (CAD) models of the (a) base and (b) sample.
Applsci 11 02611 g001
Figure 2. 3D CAD models of porous samples: (a) trabecular with 200 µm pore size, (b) trabecular with 400 µm pore size, (c) trabecular with 600 µm pore size, (d) cubic with 200 µm pore size, (e) cubic with 400 µm pore size, (f) cubic with 600 µm pore size.
Applsci 11 02611 g002
Figure 3. Details of the (a) trabecular and (b) cubic sample structures.
Applsci 11 02611 g003
Figure 4. Heat treatment curve of titanium alloy.
Applsci 11 02611 g004
Figure 5. Process of additive manufacturing of testing Ti6Al4V samples.
Applsci 11 02611 g005
Figure 6. (a) test specimens after the thermal annealing process, (b) removal of specimens from the platform, (c) untreated and treated test specimen base.
Applsci 11 02611 g006
Figure 7. 3D scans of the tested specimens taken by PC-tomography (a) trabecular with 200 µm pore size, (b) trabecular with 400 µm pore size, (c) trabecular with 600 µm pore size, (d) cubic with 200 µm pore size, (e) cubic with 400 µm pore size, (f) cubic with 200 µm pore size.
Applsci 11 02611 g007
Figure 8. Sample 1 with a porosity of 200 µm with marked pores (a), 400 µm (b), 600 µm (c).
Applsci 11 02611 g008
Figure 9. Pore layout and shape: 200 µm (a), 400 µm (b), 600 µm (c).
Applsci 11 02611 g009
Figure 10. The resulting deformations of samples after pressure testing: (a) bending, (b) fracturing, (c) crushing.
Applsci 11 02611 g010
Figure 11. Pressure testing diagram of (a) sample 1, (b) sample 2, (c) sample 3, (d) sample 4, (e) sample 5, (f) sample 6.
Applsci 11 02611 g011
Figure 12. (a) Comparison of yield strength of 6 types of samples considering the pore size (b) Average values of yield strength for individual types of specimens.
Applsci 11 02611 g012
Figure 13. (a) Comparison of max. tensile strength with considering the pore size. (b) Average values of the maximum tensile strength of tested samples types 1–6.
Applsci 11 02611 g013
Figure 14. (a) Comparison of values of modulus of elasticity considering the pore size. (b) The average values of the modulus of elasticity of tested sample types 1–6.
Applsci 11 02611 g014
Figure 15. Comparison of yield strength considering the structure of the sample types 1–6.
Applsci 11 02611 g015
Figure 16. Comparison of the tensile strength of tested samples 1–6 considering the structure of the samples.
Applsci 11 02611 g016
Figure 17. Comparison of the modulus of elasticity considering both types of sample structures.
Applsci 11 02611 g017
Figure 18. Microstructure of sample: (a) 1 mm (b) 100 µm (c) 500 µm.
Applsci 11 02611 g018
Table 1. Chemical composition of rematitan CL alloy [25].
ComponentContent (%)
Ti90
Al6
V4
Other components < 1%: N, C, H, Fe, O.
Table 2. Technical parameters of rematitan CL alloy [25].
Yield Strength
(MPa)
Tensile Strength
(MPa)
Modulus of Elasticity
(MPa)
Melting Rate (°C)Density (g/cm3)Type
95010051151604–16554.54
Table 3. Characteristic parameters of the tested specimens.
Sample typeStructurePore Size (µm)Lamella Size (µm)
1trabecular200200
2trabecular400200
3trabecular600200
4cubic200200
5cubic400200
6cubic600200
7solid
Table 4. The basic parameters of the additive manufacturing selective laser melting (SLM) device settings [26].
Basic ParametersValue
Layer width (µm)25
Production speed (cm3/h)1–5
Laser system (W)Fiber laser 100
Maximum scanning rate (m/s)7
Operation conditions (°C)15 to 30
Materialrematitan CL—Ti6Al4V ELI
Table 5. Comparison of nominal and actual weight and porosity of the prepared samples.
TypePore size (µm)TopologyWeight (g)Porosity (%)
NominalActualDifferenceNominalActualDifference
1200trabecular7.086.14−0.9424.616.3−8.3
2400trabecular4.634.27−0.3635.935.6−0.3
3600trabecular2.883.12+0.2460.954.8−6.3
4200 */160 **cubic4.76.5+1.836.15.530.6
5400 */270 **cubic2.95.3+2.460.222.6−3.6
6600 */410 **cubic2.03.8+1.873.043.6−2.4
7-solid7.3ρ = 0.0043 g/mm3
* nominal; ** actual.
Table 6. Average values of mechanical properties of the tested samples.
Sample TypeMax.
Force (kN)
Yield Strength (MPa)Tensile Strength (MPa)Modulus of Elasticity
(GPa)
Energy
Absorption (kJ/mm3)
182.08 ± 4.49775.88 ± 36.331179.99 ± 64.4910.40 ± 0.8422 032.80 ± 2790.74
223.12 ± 1.16363.65 ± 8.99481.67 ± 24.256.80 ± 0.4216 412.20 ± 3137.35
310.57 ± 0.28251.77 ± 6.94302.00 ± 8.093.80 ± 0.4210 637.60 ± 521.71
4120.70 ± 3.071055.03 ± 135.901631.08 ± 41.4910.50 ± 0.5837 251.00 ± 2815.18
582.78 ± 5.08525.07 ± 44.481160.59 ± 74.428.60 ± 0.7028 658.90 ± 3862.16
644.92 ± 2.79198.45 ± 83.291032.64 ± 64.184.70 ± 1.9519 042.40 ± 1354.78
Publisher’s Note: MDPI stays neutral with regard to jurisdictional claims in published maps and institutional affiliations.

