
Evaluation of Accuracy of Traffic Flow Generation in SUMO


Abstract
1. Introduction
2. Simulation
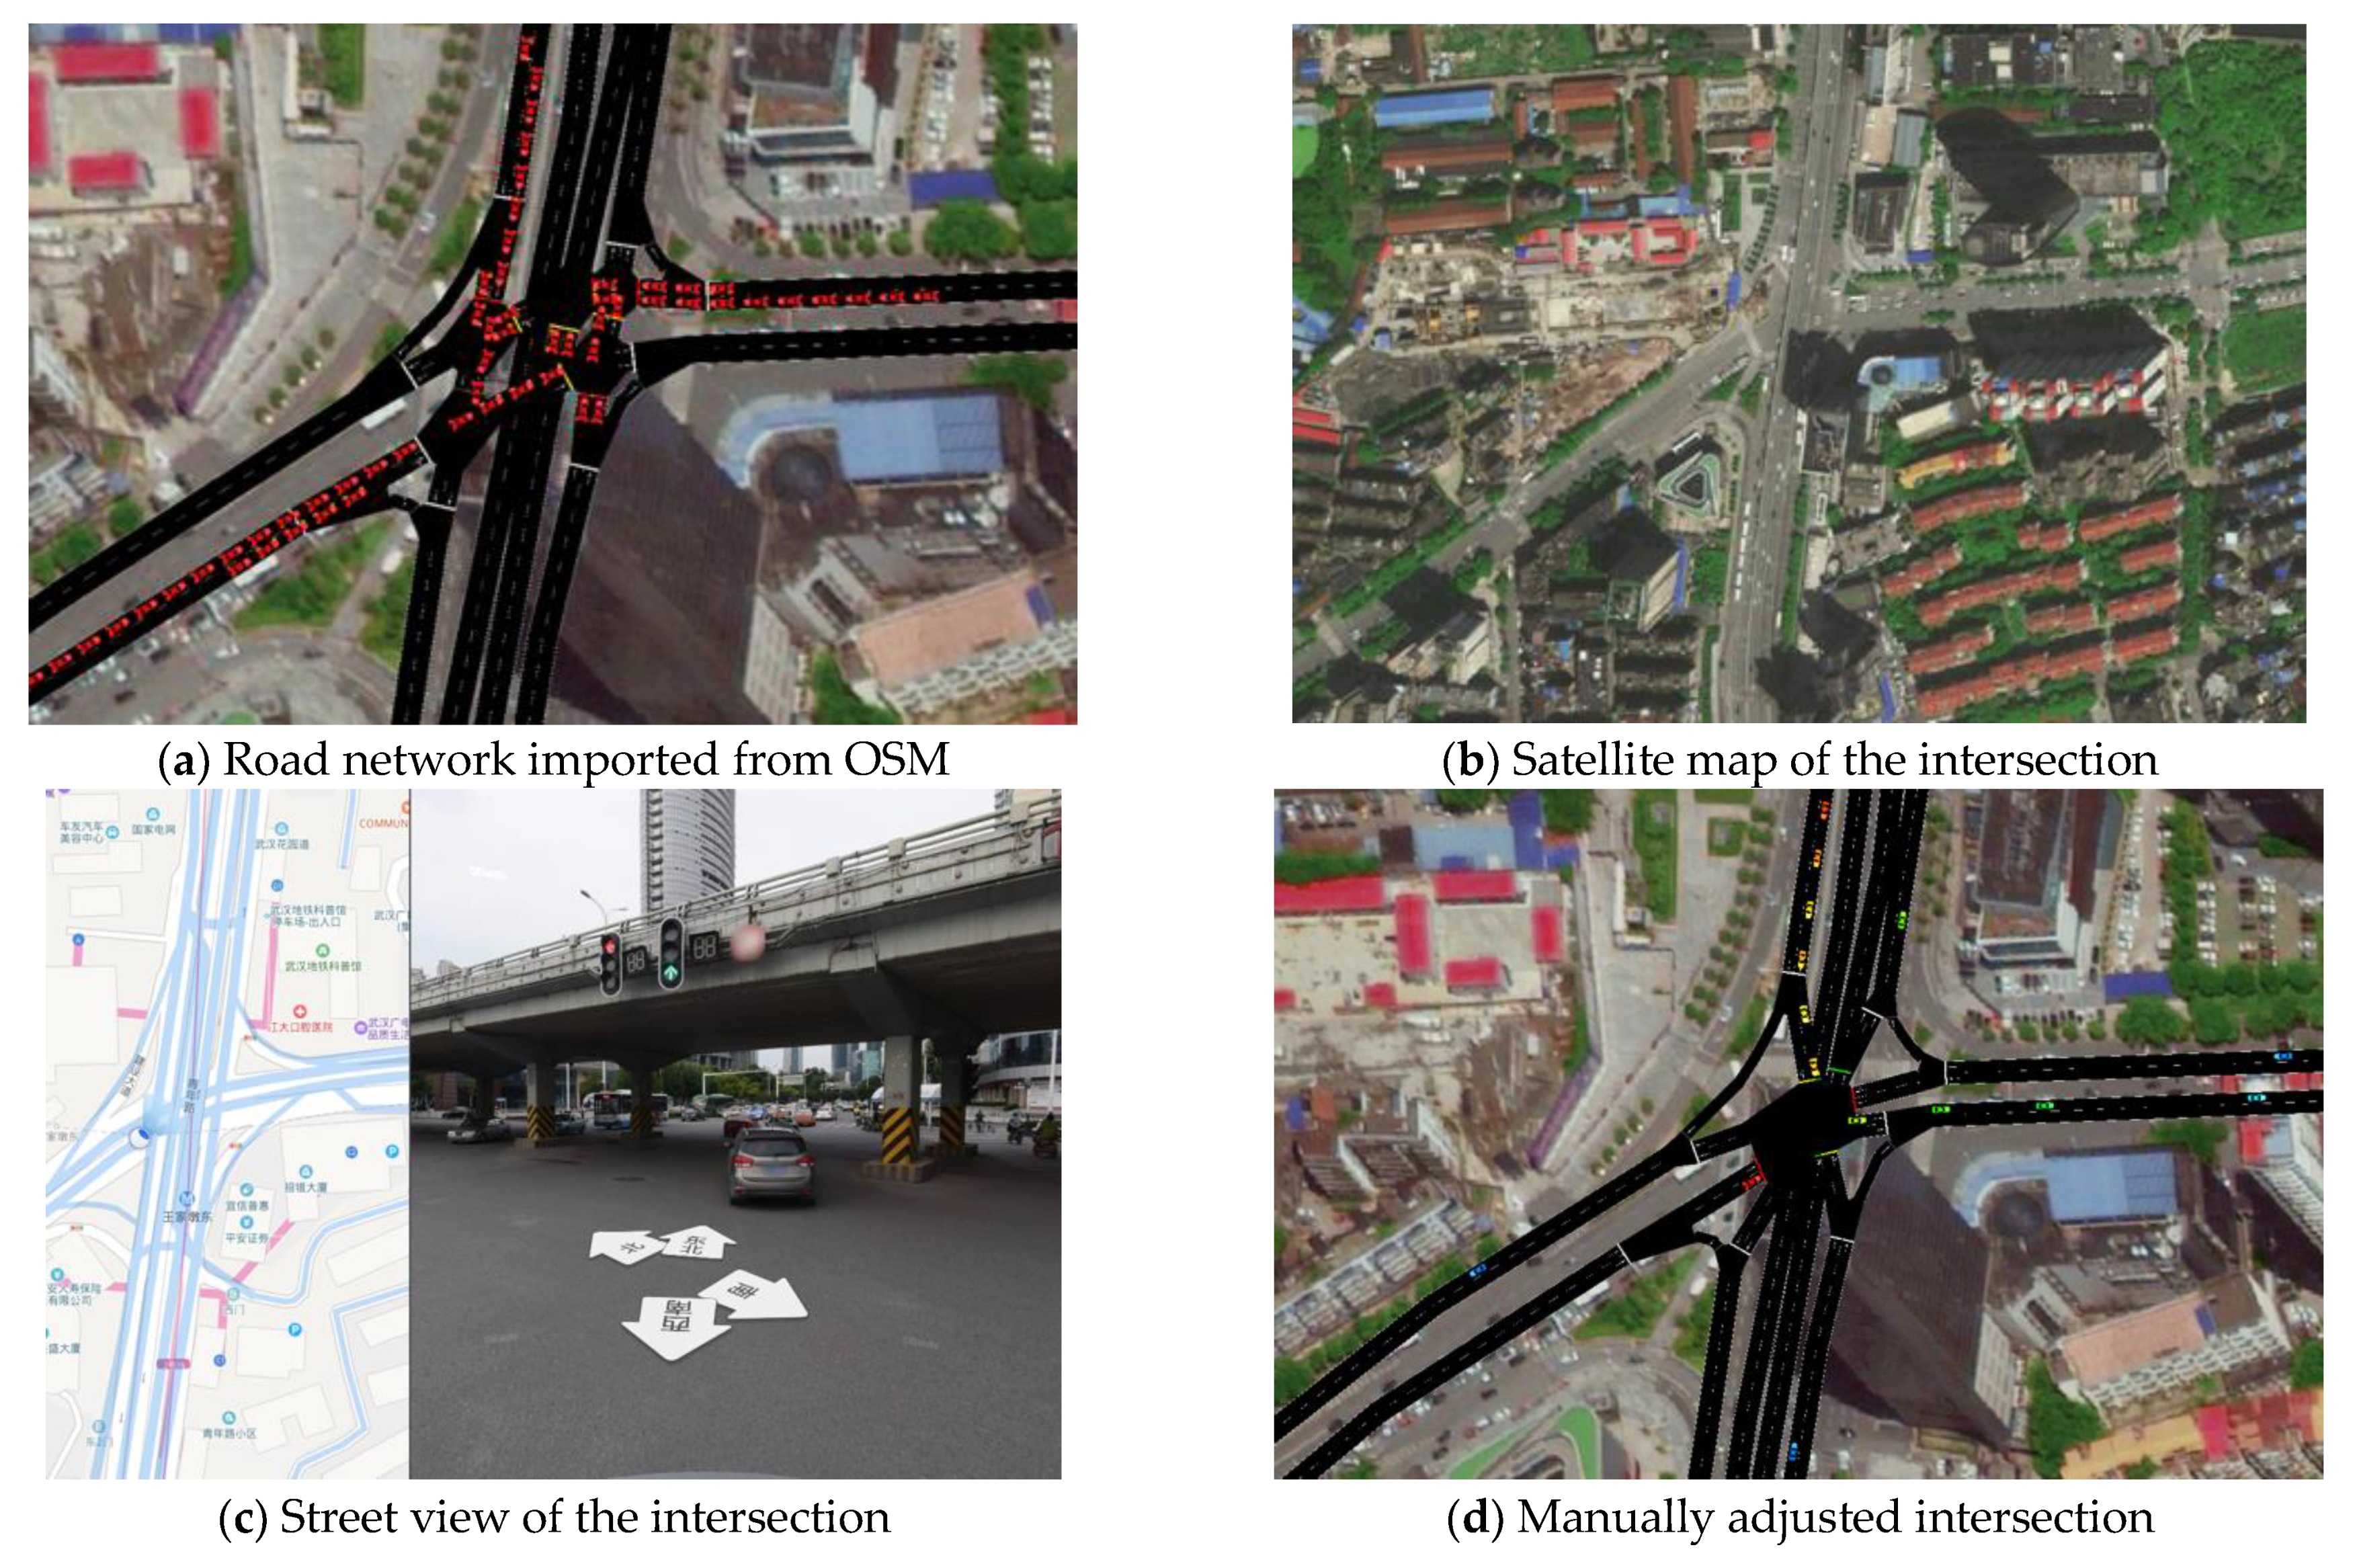
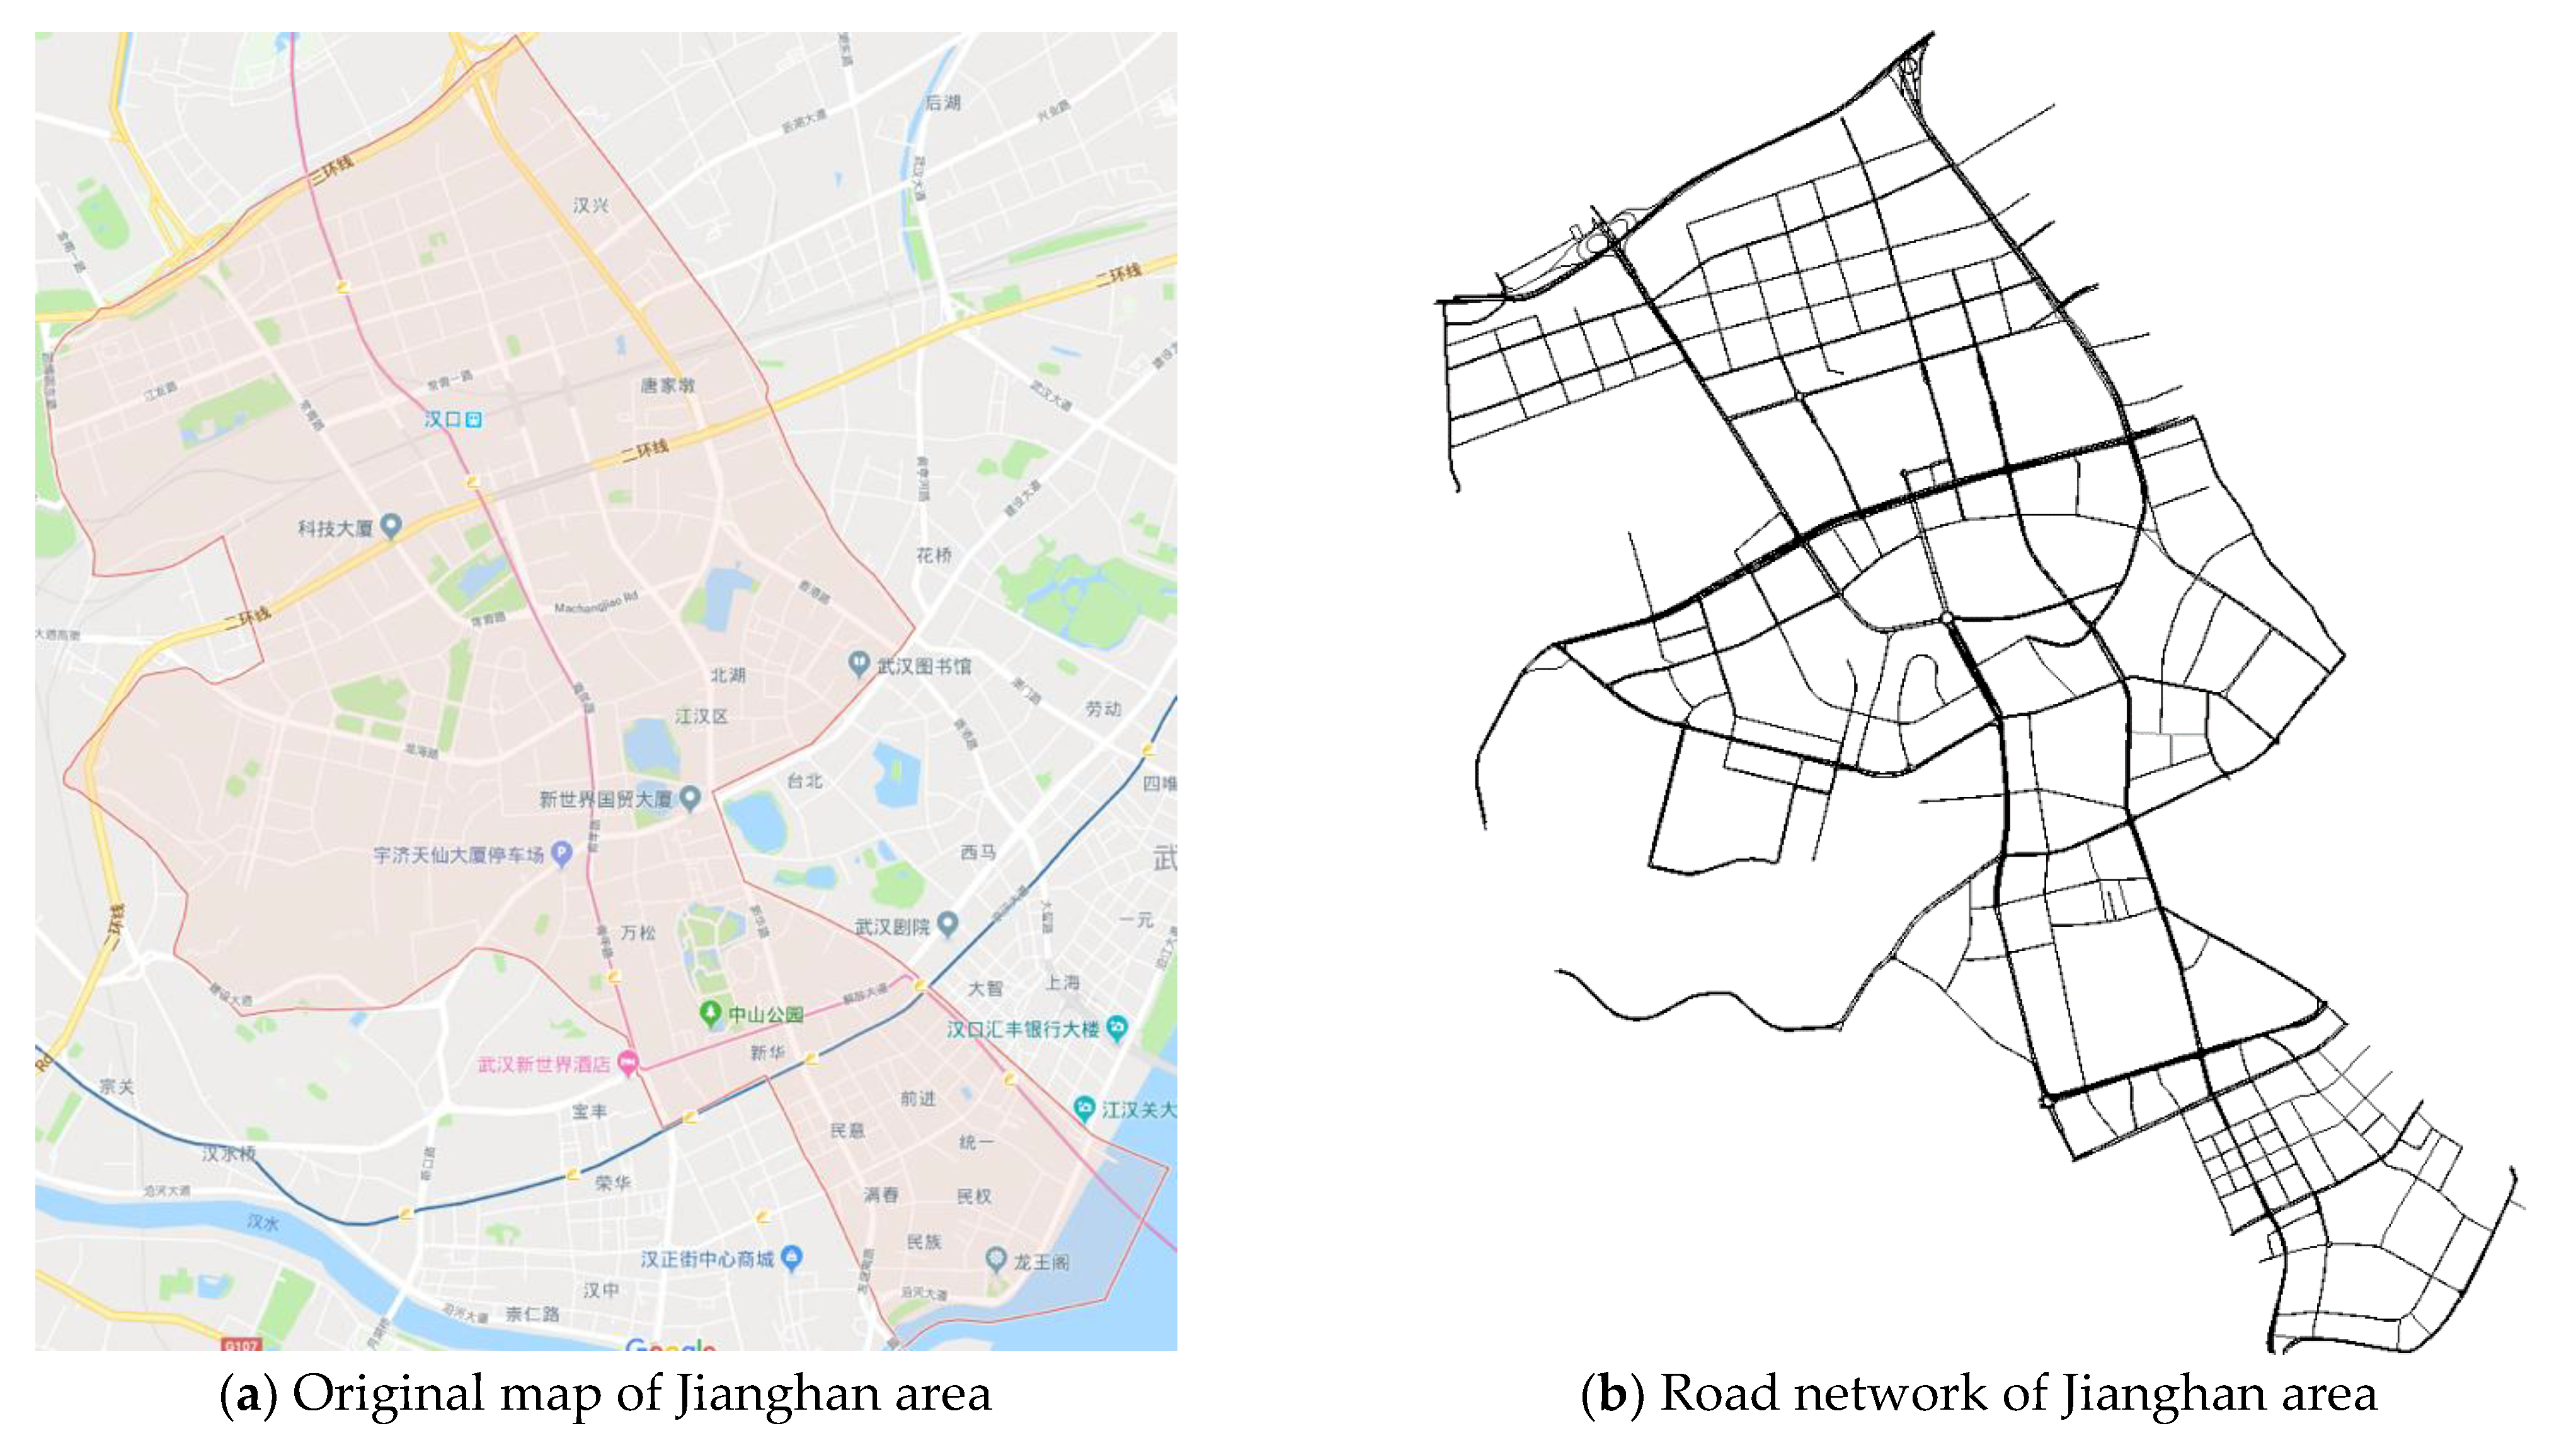
2.1. Road Structure
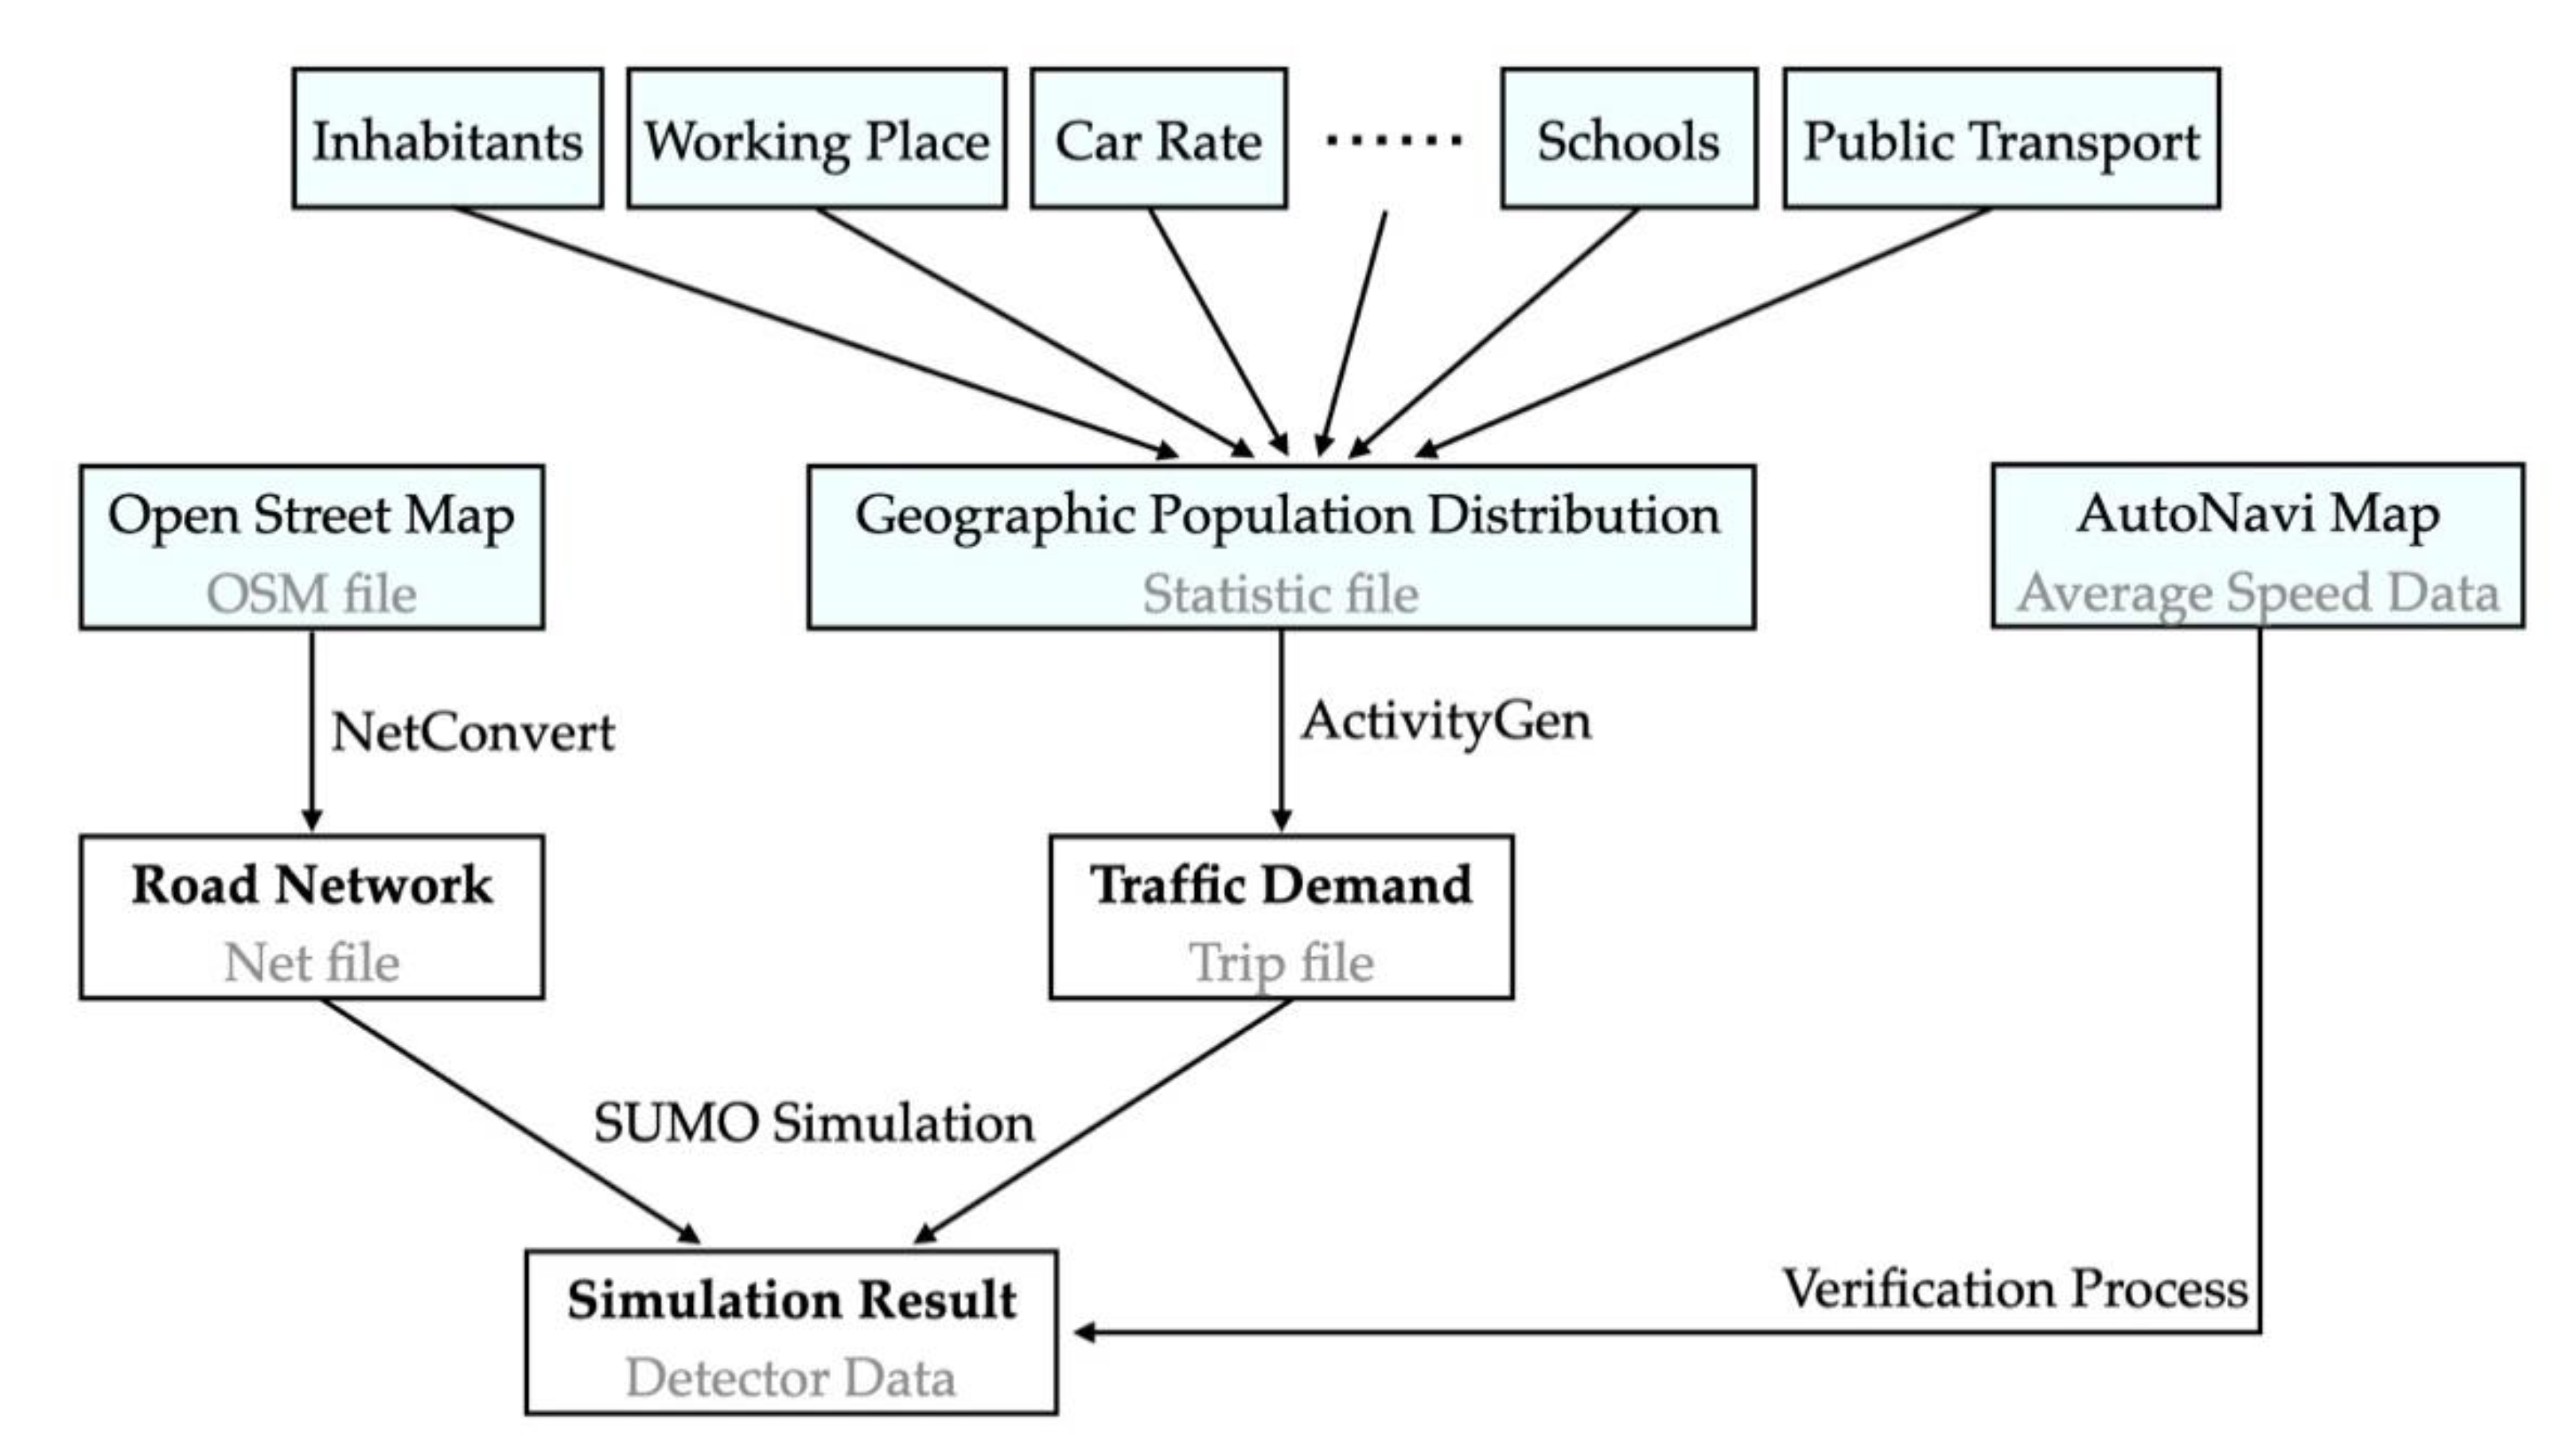
2.2. Trip Generation
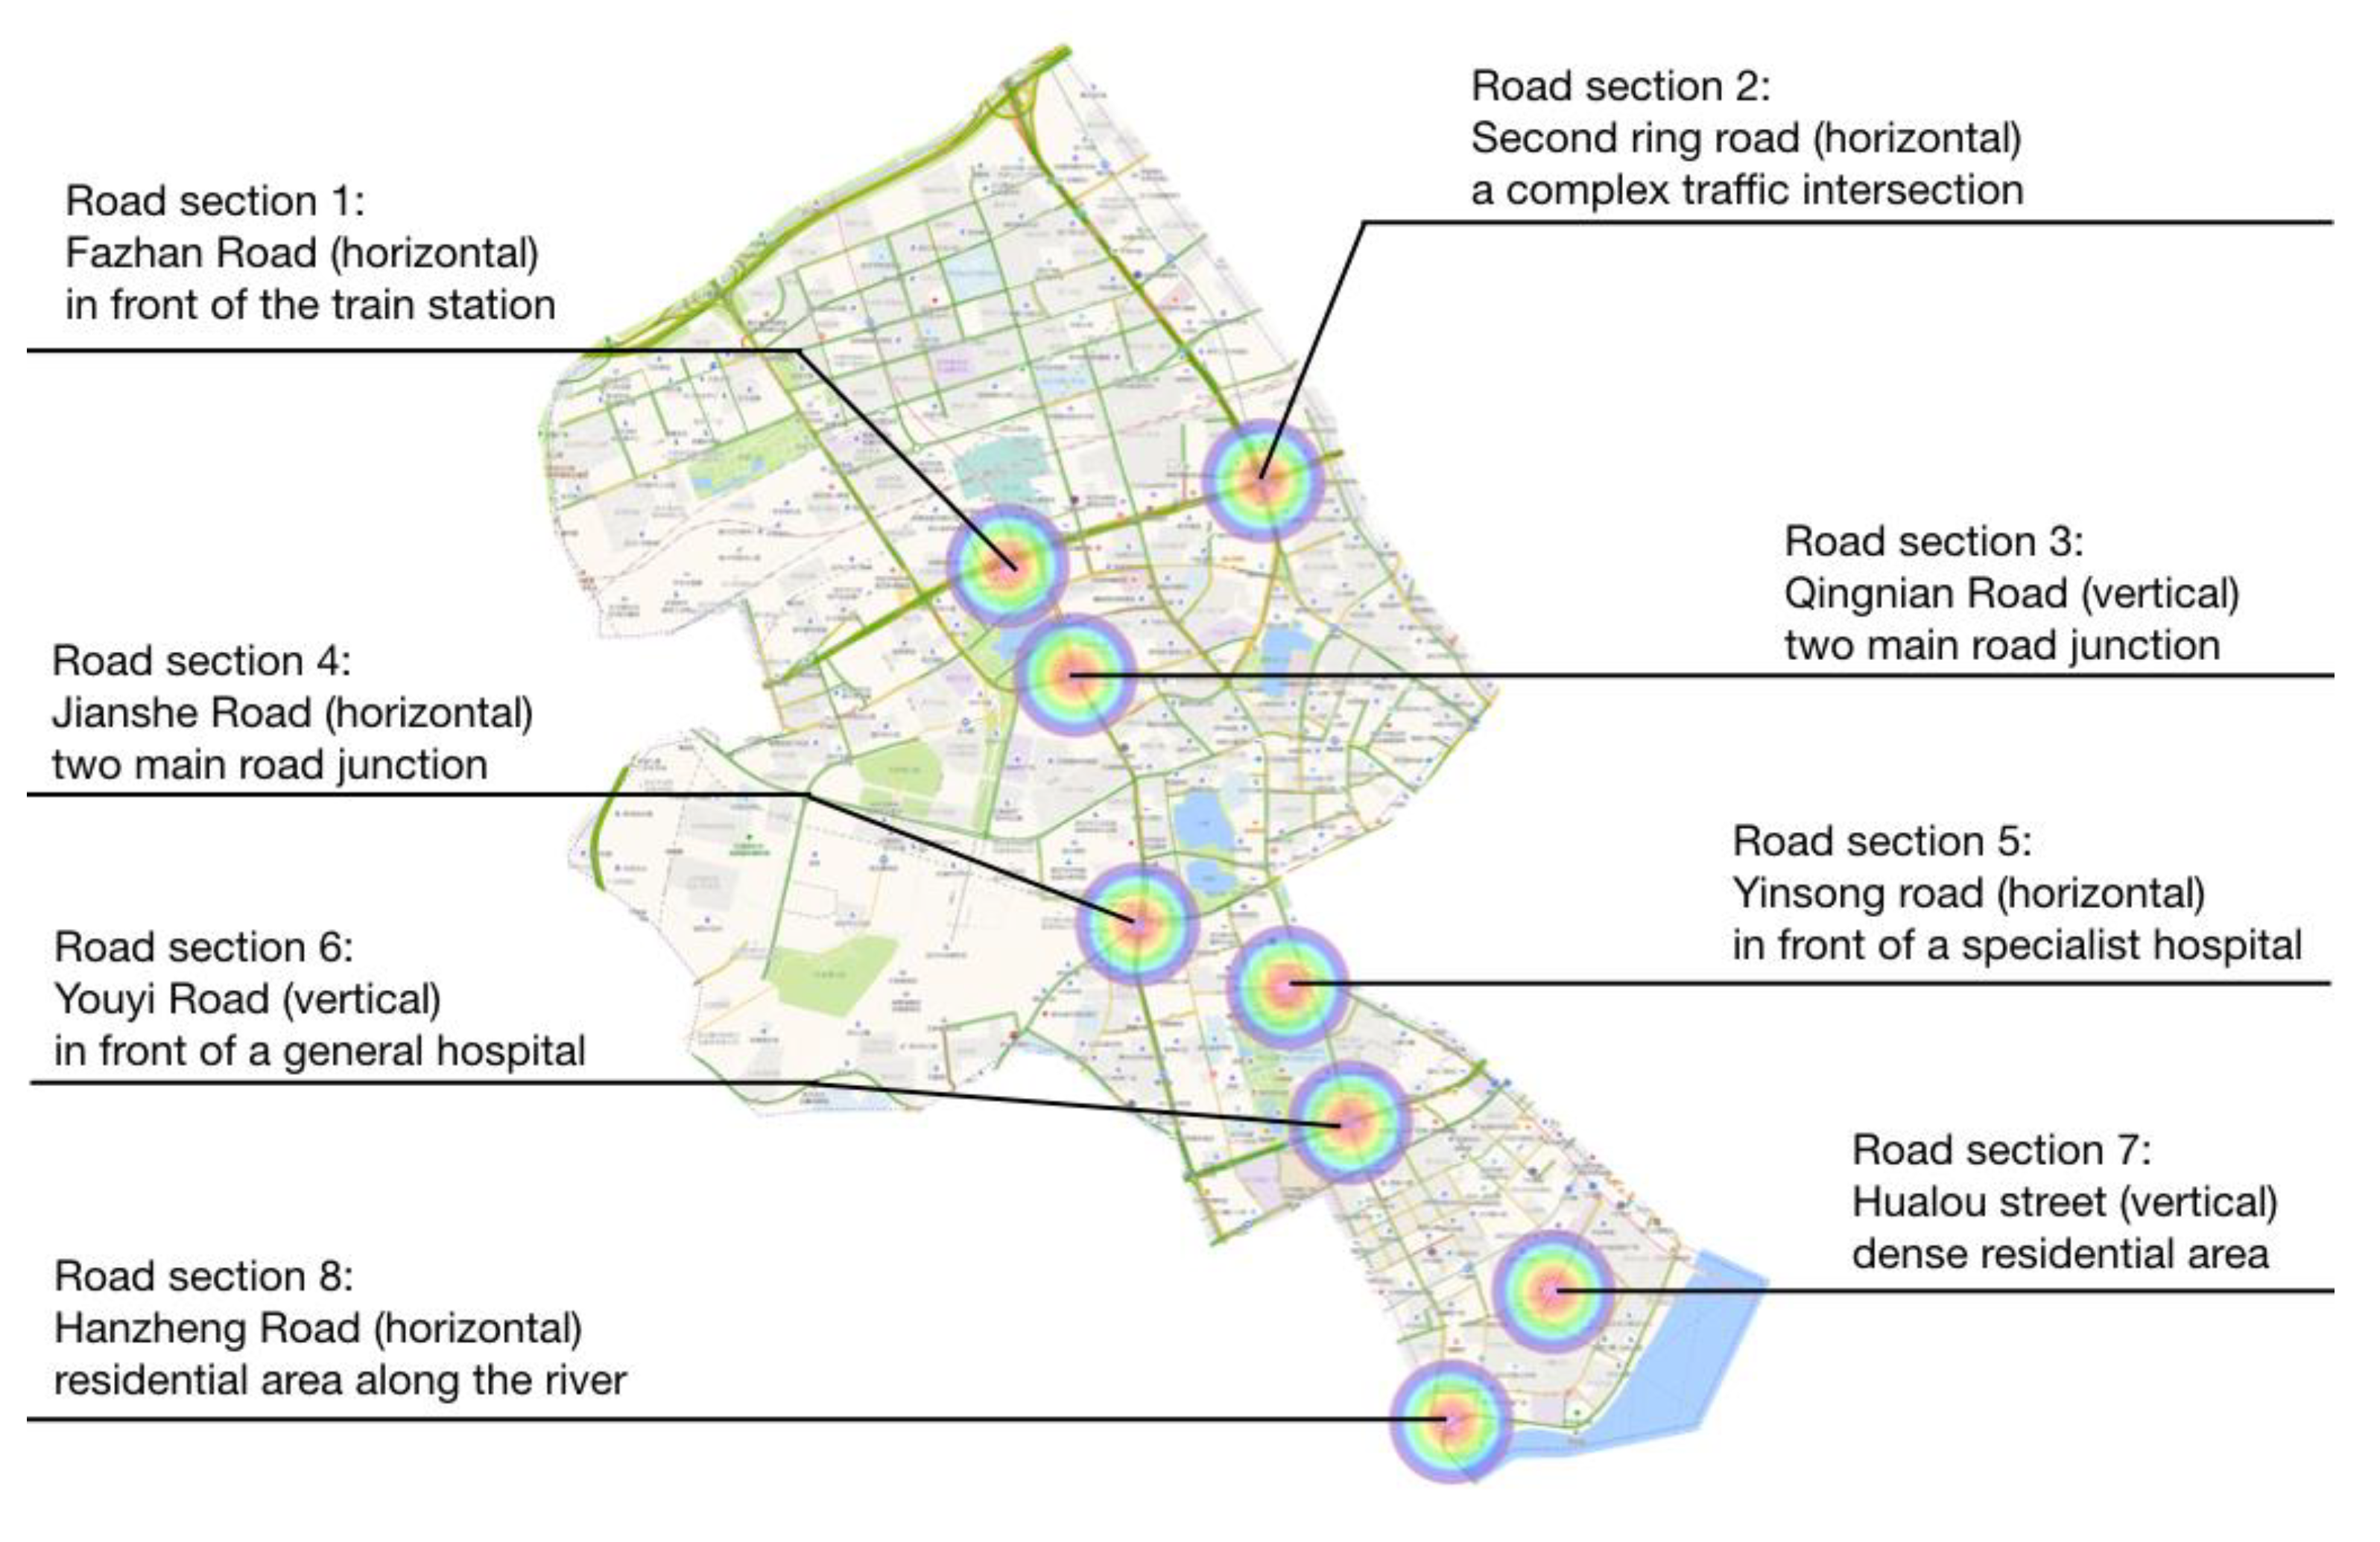
2.3. Traffic Information
3. Results and Discussion
3.1. Real-Time Traffic in AutoNavi Map
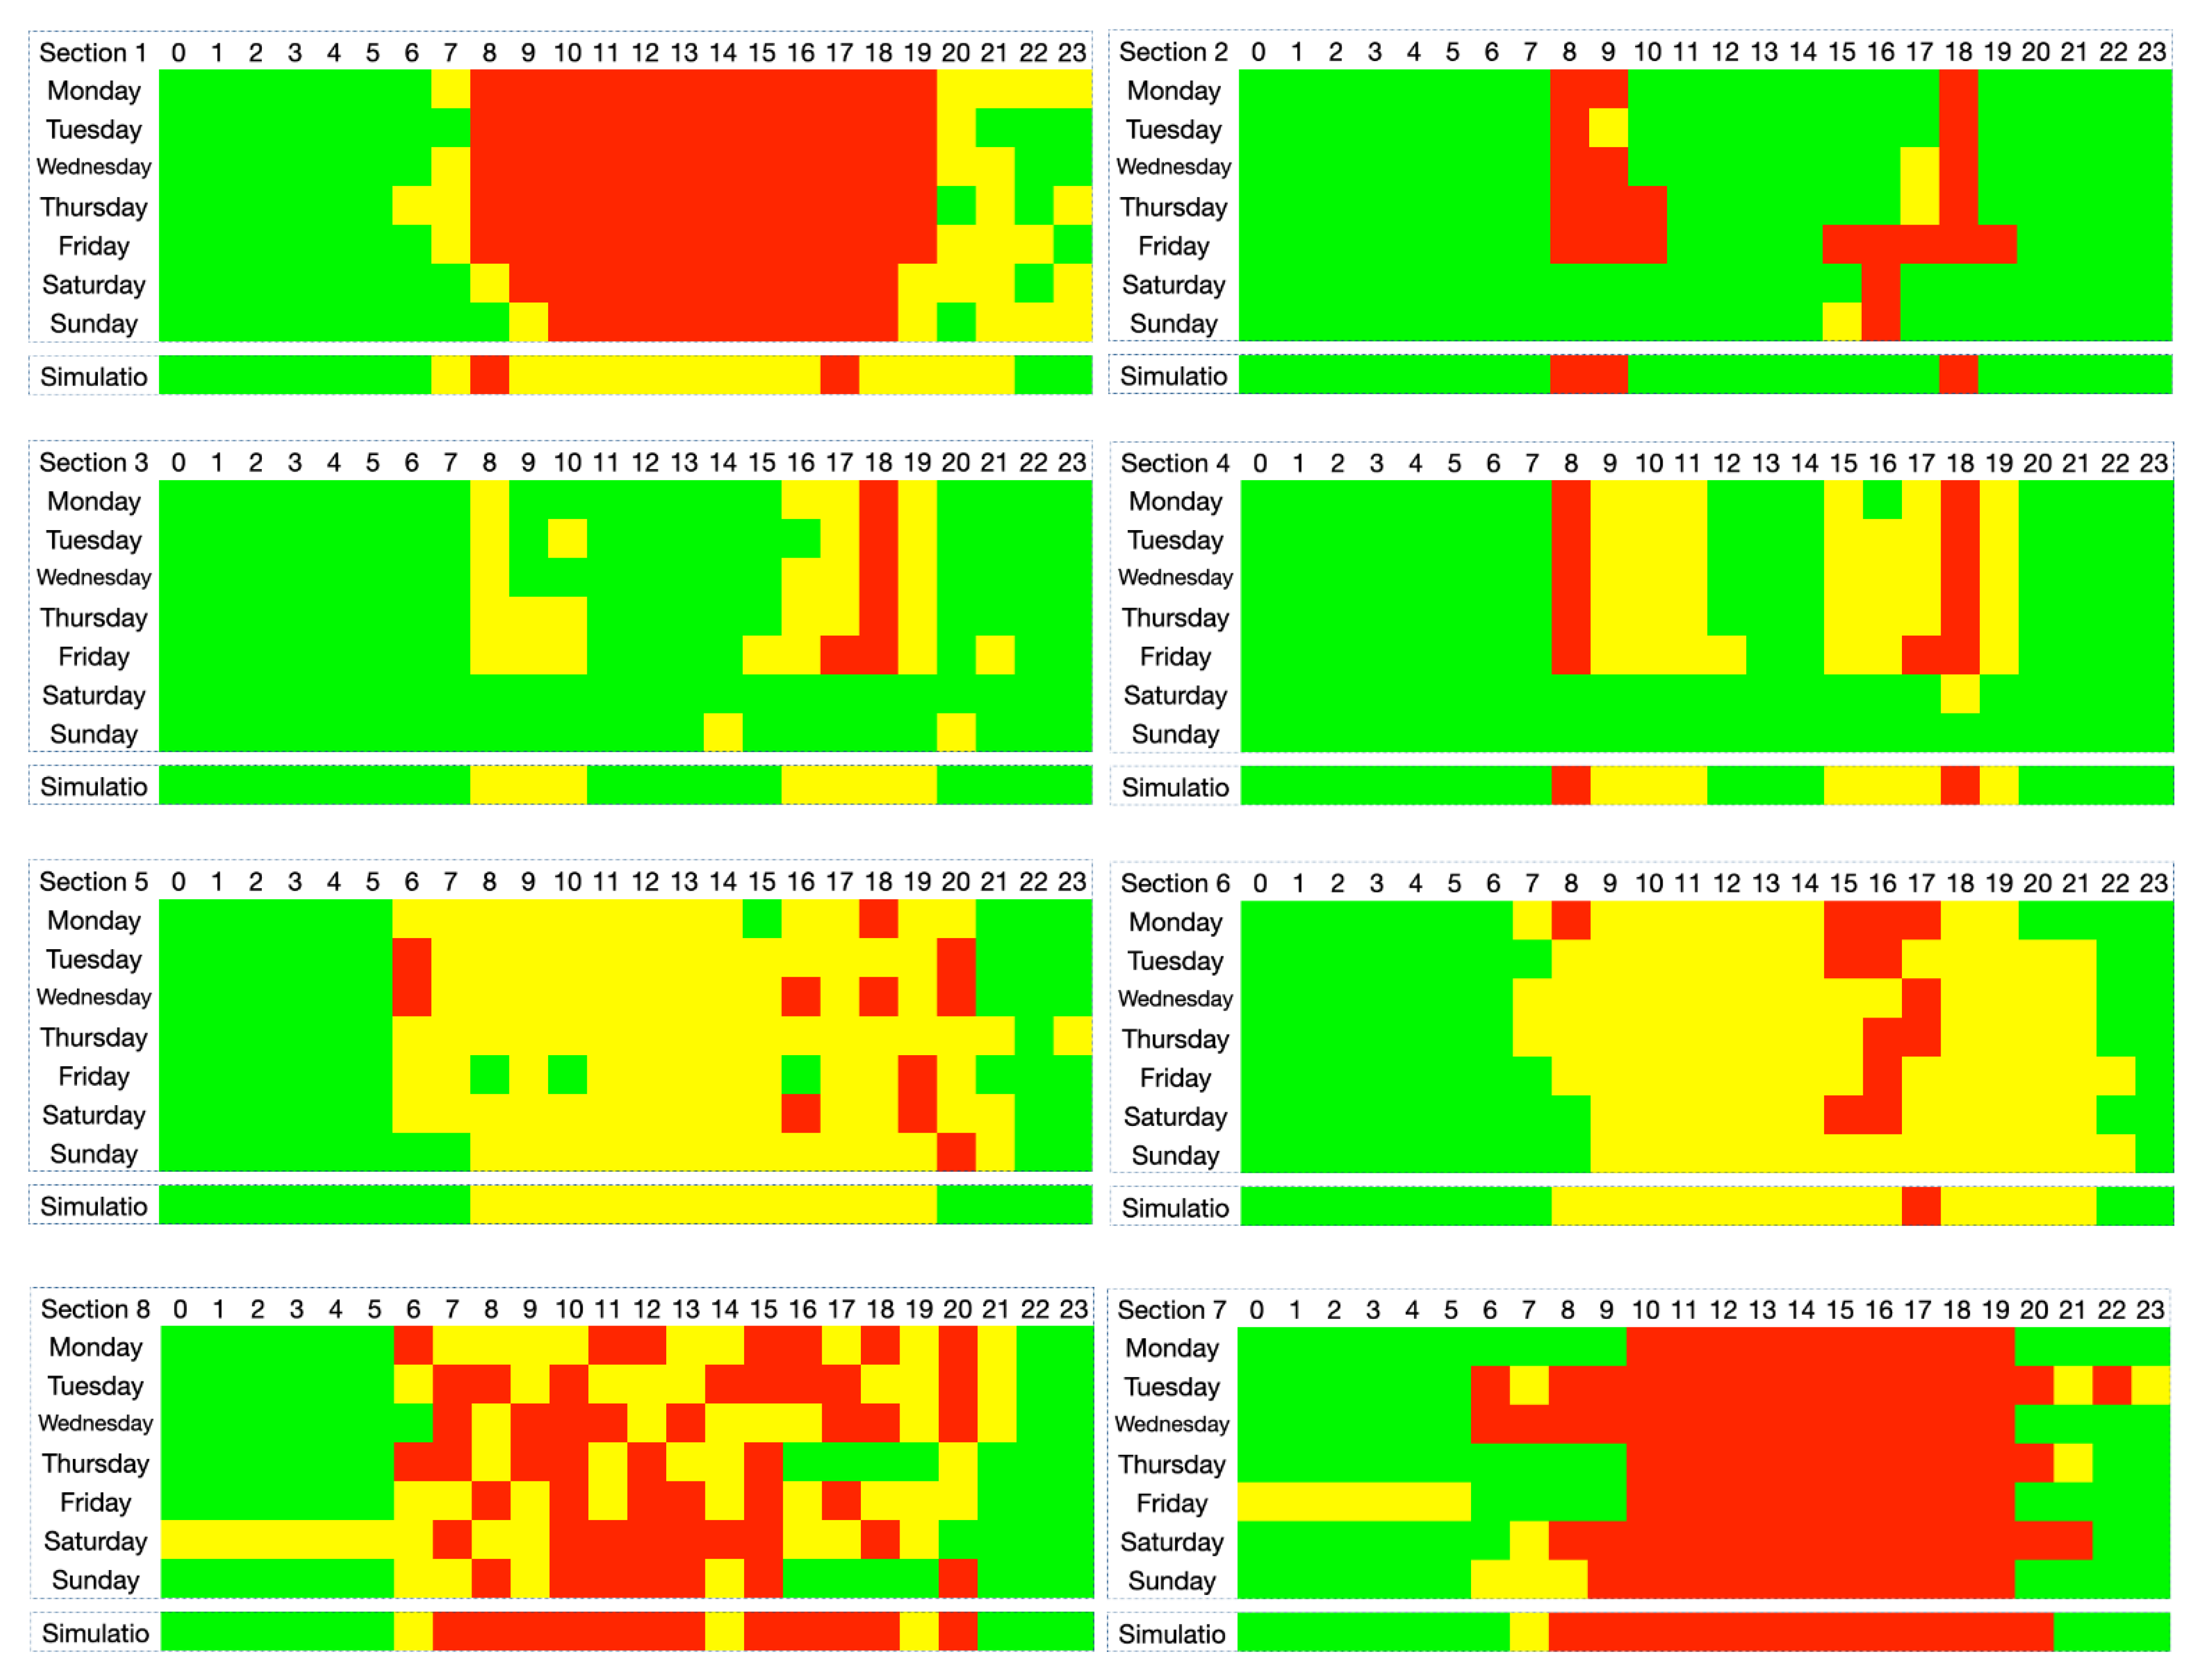
3.2. Comparison of Weekly Data with Simulation
4. Results
5. Conclusions
Author Contributions
Funding
Data Availability Statement
Acknowledgments
Conflicts of Interest
References
- ACEA. Economic and Market Report—EU Automotive Industry, Quarter 4 2016. 2016. Available online: https://www.acea.be/statistics (accessed on 3 December 2020).
- ACEA. Economic and Market Report—EU Automotive Industry, Quarter 4 2017. 2017. Available online: https://www.acea.be/statistics (accessed on 3 December 2020).
- Marmaras, C.; Xydas, E.; Cipcigan, L. Simualtion of electric vehicle driver behavior in road transport and electric power netowrks. Transp. Res. Part C Emerg. Technol. 2017, 80, 239–256. [Google Scholar] [CrossRef]
- Pell, A.; Meingast, A.; Schauer, O. Trends in real-time traffic simulation. Transp. Res. Procedia 2017, 25, 1477–1484. [Google Scholar] [CrossRef]
- Liang, X.; Du, X.; Wang, G.; Han, Z. A deep reinforcement learning network for traffic light cycle control. IEEE Trans. Veh. Technol. 2019, 68, 1243–1253. [Google Scholar] [CrossRef]
- Treiber, M.; Kesting, A. Traffic Flow Dynamics; Springer: Berlin/Heidelberg, Germany, 2013. [Google Scholar]
- De Fabritiis, C.; Ragona, R.; Valenti, G. Traffic Estimation and Prediction based on real time floating car data. In Proceedings of the 11th International IEEE Conference on Intelligent Transportation Systems, Beijing, China, 12–15 October 2008. [Google Scholar]
- Schaefer, R.-P.; Thiessenhusen, K.-U.; Wagner, P. A traffic information system by means of real-time floating-car data. In Proceedings of the World Congress on Intelligent Transport Systems, Chicago, IL, USA, 14–17 October 2002. [Google Scholar]
- Sunderrajan, A.; Viswanathan, V.; Cai, W.; Knoll, A. Traffic State Estimation Using Floating Car Data. Procedia Comput. Sci. 2016, 80, 2008–2018. [Google Scholar] [CrossRef]
- Kastner, K.H.; Keber, R.; Pau, P.; Samal, M. Real-time traffic conditions with SUMO for ITS Austria West. In Proceedings of the Simulation of Urban MObility User Conference, Berlin, Germany, 15–17 May 2013; Springer: Berlin/Heidelberg, Germany, 2013; pp. 146–159. [Google Scholar]
- Bieker, L.; Krajzewicz, D.; Morra, A.; Michelacci, C.; Cartolano, F. Traffic simulation for all: A real world traffic scenario from the city of Bologna. In Modeling Mobility with Open Data; Springer: Cham, Switzerland, 2015; pp. 47–60. [Google Scholar]
- Ma, X.; Hu, X.; Weber, T.; Schramm, D. Experiences with Establishing a Simulation Scenario of the City of Duisburg with Real Traffic Volume. Appl. Sci. 2021, 11, 1193. [Google Scholar] [CrossRef]
- Ma, X.; Hu, X.; Weber, T.; Schramm, D. Traffic Simulation of Future Intelligent Vehicles in Duisburg City Inner Ring. Appl. Sci. 2021, 11, 29. [Google Scholar] [CrossRef]
- Shafei, S.; Gu, Z.; Saberi, M. Calibration and validation of a simulation-based dynamic traffic assignment model for a large-scale congested network. Simul. Model. Pract. Theory 2018, 86, 169–186. [Google Scholar] [CrossRef]
- Krajzewicz, D.; Erdmann, J.; Behrisch, M.; Bieker, L. Recent Development and Applications of SUMO—Simulation of Urban MObility. Int. J. Adv. Syst. Meas. 2012, 5, 128–138. [Google Scholar]
- Codeca, L.; Frank, R.; Engel, T. LuST: A 24-hour Scenario of Luxembourg City for SUMO Traffic simulations. In Proceedings of the SUMO User Conference 2015—Intermodal Simulation for Intermodal Transport, Berlin, Germany, 7–8 May 2015. [Google Scholar]
- Asano, Y.; Ito, N.; Inaoka, H.; Imai, T.; Uchitane, T. Traffic Simulation of Kobe-City. In Proceedings of the International Con-ference on Social Modelling and Simulations, Plus Econophysic Colloquium 2014, Kobe, Japan, 4–6 November 2014. [Google Scholar] [CrossRef]
- Bian, C.; Yuan, C.; Kuang, W.; Wu, D. Evaluation, classification, and influential factors analysis of traffic congestion in chinese cities using the online map data. Math. Probl. Eng. 2016, 2016, 1693729. [Google Scholar] [CrossRef]
- National Bureau of Statistics of China. 2010. Available online: http://www.stats.gov.cn/english/ (accessed on 3 December 2020).
- Meng, W.; Chen, X. Wuhan Statistic Yearbook 2017. China Statistical Publishing House: China; ISBN 978-7-5037-8197-1.
- Provincial Transportation Management Bureau. 8 Kinds of Public Transport Modes in Wuhan Are Completed, the Travel Sharing Rate is Reaching 60%. 2017. Available online: http://www.hbys.gov.cn/ggxw/ywkb/157312.htm (accessed on 3 December 2020).
- Wuhan Transportation Committee. Statistics on the Total Number of Trips in Wuhan in 2017. 2017. Available online: http://jyw.wuhan.gov.cn/Category_137/Index.aspx (accessed on 3 December 2020).
- Dijkstra, E.W. A note on two problems in connexion with graphs. Numer. Math. 1959, 1, 269–271. [Google Scholar] [CrossRef]
- Liu, W.; Zhong, M.; Dai, N.; Chen, H.; Chen, J. Wuhan’s Three Major Railway Stations sent 350,000 Passengers on October 2. 2018. Available online: http://hb.people.com.cn/n2/2018/1003/c194063-32122666.html (accessed on 3 December 2020).
- Ma, X. (2021): Effects of Vehicles with Different Degrees of Automation on Traffic Flow in Urban Areas. Available online: https://duepublico2.uni-due.de/receive/duepublico_mods_00074070.
- Ma, X.; Hu, X.; Schramm, D. Effects of School Activities on Traffic Flow on the Example of Traffic Scenario from the City Wuhan. In Neue Dimensionen der Mobilität; Springer: Gabler, Wiesbaden, 2020; pp. 153–163. [Google Scholar]
- Jiang, B.; Fei, Y. Vehicle Speed Prediction by Two-Level Data Driven Models in Vehicular Networks. IEEE Trans. Intell. Transp. Syst. 2017, 18, 1793–1801. [Google Scholar] [CrossRef]
- Habtie, A.B.; Abraham, A.; Midekso, D. Cellular Network Based Real-Time Urban Road Traffic State Estimation Framework Using Neural Network Model Estimation. In Proceedings of the 2015 IEEE Symposium Series on Computational Intelligence, Cape Town, South Africa, 7–10 December 2015; pp. 38–44. [Google Scholar] [CrossRef]
- Song, H.; Min, O. Statistical traffic generation methods for urban traffic simulation. In Proceedings of the 2018 20th International Conference on Advanced Communication Technology (ICACT), Chuncheon, Korea, 11–14 February 2018; pp. 247–250. [Google Scholar] [CrossRef]


| Items | Amount | Data Source |
|---|---|---|
| Inhabitants | 683,500 | Jianghan District People’s Government |
| Number of households | 154,850 | Hubei Provincial Bureau of Statistics |
| Retirement age | 50–60 | State Council of China |
| Car rate | 0.28 | Hubei Provincial People’s Government |
| Unemployment rate | 0.02 | Human Resources and Social Security Department of Wuhan |
| Primary school age limit | 6–11 | Ministry of Education of China |
| Primary school students’ number | 30,531 | Hubei Provincial Bureau of Statics |
| Middle school age limit | 12–14 | Ministry of Education of China |
| Middle school students’ number | 13,420 | Hubei Provincial Bureau of Statics |
| High school age limit | 15–17 | Ministry of Education of China |
| High school students’ number | 7537 | Hubei Provincial Bureau of Statics |
| Vocational school students’ number | 5527 | Hubei Provincial Bureau of Statics |
Publisher’s Note: MDPI stays neutral with regard to jurisdictional claims in published maps and institutional affiliations. |
© 2021 by the authors. Licensee MDPI, Basel, Switzerland. This article is an open access article distributed under the terms and conditions of the Creative Commons Attribution (CC BY) license (http://creativecommons.org/licenses/by/4.0/).
Share and Cite
Ma, X.; Hu, X.; Weber, T.; Schramm, D. Evaluation of Accuracy of Traffic Flow Generation in SUMO. Appl. Sci. 2021, 11, 2584. https://doi.org/10.3390/app11062584
Ma X, Hu X, Weber T, Schramm D. Evaluation of Accuracy of Traffic Flow Generation in SUMO. Applied Sciences. 2021; 11(6):2584. https://doi.org/10.3390/app11062584
Chicago/Turabian StyleMa, Xiaoyi, Xiaowei Hu, Thomas Weber, and Dieter Schramm. 2021. "Evaluation of Accuracy of Traffic Flow Generation in SUMO" Applied Sciences 11, no. 6: 2584. https://doi.org/10.3390/app11062584
APA StyleMa, X., Hu, X., Weber, T., & Schramm, D. (2021). Evaluation of Accuracy of Traffic Flow Generation in SUMO. Applied Sciences, 11(6), 2584. https://doi.org/10.3390/app11062584