Abstract
Forest fires are severe disasters that cause significant damage in the Republic of Korea and the entire world, and an effort is being made to prevent forest fires internationally. The Republic of Korea budgets 3.38 million USD every year to prevent forest fires. However, an average of 430 wildfires occur nationwide annually. Thirty-eight percent of the forest fire budget is used for forest restoration. Restoring afforestation in the affected areas is a top priority. This study aimed to estimate the degree of vegetative regeneration using the Normalized Difference Vegetation Index (NDVI), Enhanced Vegetation Index (EVI), Soil-Adjustment Vegetation Index (SAVI), and Normalized Burn Ratio (NBR). Although many studies have used NBR with NDVI to extract plant regeneration regions, they suffer from atmospheric effects and soil brightness. Thus, this study utilizes NBR with NDVI, EVI, and SAVI to accurately select areas for targeted forest restoration. Furthermore, this study applies clustering analysis to extract the spatial boundary of vegetative regenerative regions. The proposed method suggests a pixel range of vegetation indices. These ranges can be used as an indicator, such as the NBR’s Fire Severity Level, which reflects the mountain’s local characteristics, meaning that it can be useful after forest fires. Using the three vegetation indices can extract more accurate vegetation areas than using NBR with NDVI and can help determine a forest restoration target area.
1. Introduction
The Republic of Korea is particularly vulnerable to forest fires because approximately 70% of the land within its borders is mountainous. According to statistics from the Korea Forest Service, over the past ten years, 653 forest fires have occurred, damaging 325,540,000 m of land []. The amount of significantly damaged forests caused by wildfire is immeasurable. The Republic of Korea spends 34.1 million USD annually on efforts to prevent forest fires. In particular, approximately 5.2 million USD per 1010 hectares are spent annually on vegetation restoration and forest facility reconstruction in areas affected by forest fires.
In 2019, forest fires in Gangwon province caused an overwhelming amount of damage and received a significant amount of attention due to the cost of restoration. Forest fires displaced more than 1300 people in Gangwon province, and damage occurred on 28,320,000 m of land due to a three-day fire. The damage was estimated at more than 117.5 million USD. The government provided 117.5 million USD, including 22.3 million USD for private facilities such as small businesses and agricultural practices and 63.4 million USD for forest restoration to revitalize tourism []. In the future, state support will be needed to help forests recover from such disasters.
Detecting the vegetation regeneration area’s exact boundary after a forest fire is a significant point in selecting a forest restoration target area. The Republic of Korean government categorizes forest fires as a major disaster and establishes comprehensive forest fire prevention and recovery measures nationwide []. When establishing a countermeasure against forest fires, it is essential to accurately divide regional boundaries for budget distribution. This study is meaningful because it accurately identifies the renewable area’s spatial boundary after a forest fire. Moreover, by providing a scientific and accurate methodology for detecting regeneration areas, it is possible to establish a forest fire recovery plan.
Following the forest fires in Yangyang county, Gangwon province, in 2005, it took more than three years for the trees to be restored; the environment is currently similar to that before the fires, but complete restoration of the ecosystem remains underway. Thus, an extensive period is required to restore forests after a fire. According to the National Institute of Forest Science, it takes an estimated two to thirty years to restore a forest and more than 100 years to restore acidified soil after a fire [].
In the aftermath of a forest fire, forest restoration is conducted using various methods; however, removing all of the damaged trees from the fire site and planting new trees is the most common method, which is the most straightforward technique for assisting vegetation regeneration []. However, this method is costly because it requires significant time, labor, and financial resources; healthy seedlings that were not damaged in the fire were also removed in this process, which is a more significant problem.
Satellite images are used for disaster management globally []. These images can be used to analyze large areas, such as forest fires [,]. Due to their broad-spectrum, multispectral images are the most widely used type of images for observing disaster-prone areas [,]. To explore fire-prone areas with multispectral images, studies have mainly been conducted using indices, such as the Vegetation Index (VI) and burn index, that are based on the band characteristics of different wavelengths []. Among these, Advanced Very-High-Resolution Radiometer (AVHRR) data and the Normalized Difference Vegetation Index (NDVI) were used to define a new hazard index in which the NDVI value is modulated to the fire probability map []. Other biological indices have been developed to compare various vegetation indices, such as the Soil-adjusted Vegetation Index (SAVI), Enhanced Vegetation Index (EVI), and Burn Area Index (BAI) [,,].
In a follow-up study on an affected area after a forest fire outbreak, the vegetation’s regenerative capacity was evaluated according to various vegetation indices and fire severity indices via the spectra of multispectral satellite images []. The correlation between damage and regenerative capacity was measured by monitoring vegetation regeneration by comparing the NDVI before and after a fire []. The regenerative vegetation capacity is mainly assessed by the burn index, which considers the long-term effects of fires on plants [,]. Normalized Burn Ratio (NBR) is generally used with NDVI. Furthermore, studies have also been conducted to derive correlations by analyzing the recovery period according to plant moisture conditions using the temporal patterns of NBR and NDVI [,,,]. In a similar pattern, the NDVI was assessed using SPOT(Satellite Pour l’Observation de la Terre) images to develop a vegetative recovery index [].
However, the method based on NBR with the vegetation index NDVI is vulnerable to noises due to atmospheric effects and soil brightness. This study utilizes several vegetative indices, including NDVI, SAVI, EVI, and NBR. The integration of vegetative indices can calculate the degree of vegetative regeneration robustly. Furthermore, this study employs clustering analysis to detect the accurate spatial boundary of vegetative regeneration areas.
2. Materials and Methods
2.1. Study Area
The study area was Okgye town, Gangneung city, Gangwon province, where a forest fire occurred in April 2019 (Figure 1). The forest fire in Okgye town, Gangneung city, began at approximately 11 p.m. on 4 April 2019. The wildfires caused by an electric short circuit on a power pole covered a wide area. The forest fires in Okgye town, Gangneung city, spread southward to Mangsang town and Mukho town and were finally completely extinguished on 5 April. Sokcho city, Goseong county, Inje county, and Donghae city, Gangwon province, Republic of Korea, were declared disaster areas during and after the fire.
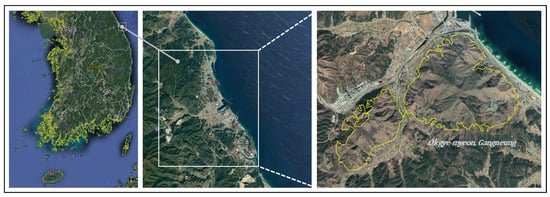
Figure 1.
Study area (37.59215114967223, 129.0474188183951).
The forest fire in Okgye town, Gangneung city, destroyed 7,148,000 m of forest land, and monetary and human resources are still being spent on recovery. In September 2019, after the fire was extinguished, the government began cleaning up the waste trees and other residues. The main tree species in the area affected by forest fires is . Forest fire residues of pine trees can generate high calories used as a good energy source []. The government is making efforts to utilize the fire remnants of Gangwon province as an eco-friendly energy source and is planting new seedlings, starting from April 2020, to restore the fire area []. The ongoing damage recovery project’s final purpose is to recreate the same forest as present before the fire, but this process is expected to take decades to complete.
2.2. Satellite Images
This study used multispectral images from the European Space Agency (ESA) satellites Sentinel-2A and Sentinel-2B []. The Sentinel-2 system, which was developed and operated by the ESA and manufactured by a consortium organized by Airbus DS, obtains images of the entire Earth every ten days from the same angles. Both satellites operate cooperatively to obtain images at frequent intervals. The Sentinel-2 images consist of 13 bands, ranging from visible to near-infrared. The filming area ranges from 56 S to 84 N and encompasses both land and sea. The bands have spatial resolutions of 10, 20, and 60 m.
In this study, only bands with spatial resolutions of 10 and 20 m were used. The multispectral Sentinel-2 images were used to observe chlorophyll in plants because this satellite is primarily used to observe vegetation with a combination of visual observations and various wavelength-specific bands []. Sentinel-2 is also used to monitor disaster situations such as forest fires because it has a short observation cycle and provides free images with sufficient spatial resolution. Sentinel-2 images can be accessed from the Copernicus database []. In this study, images taken before and after the forest fires in Okgye town, Gangneung city, were compared. The images from 26 March, 20 April, and 8 August 2019 were used for regular monitoring before and after the outbreak. Table 1 presents the details of the satellites used in this study.

Table 1.
Satellite details.
2.3. Data Processing
It is necessary to conduct the study using images at regular intervals starting from the forest fire date; however, multispectral images could not be acquired at precise intervals because they are affected by weather conditions, such as clouds. The analysis should be conducted through continuous image acquisition to extract vegetation regeneration areas, but no image has been acquired since September due to reclamation of the forest fire-hit areas in the Republic of Korea.
Images of the forests were compared to determine the degree of vegetation regeneration after the forest fire. The vegetation index NDVI was used for the comparison, but there is a lower accuracy limit when the forest is thick due to distortion, such as scattering by light. Therefore, the EVI and SAVI indices were further extracted to identify the final vegetative regeneration site to ensure more accurate reproduction. Figure 2 presents a flowchart of the study design. In the study flowchart, difference images refer to calculating the difference between two images.
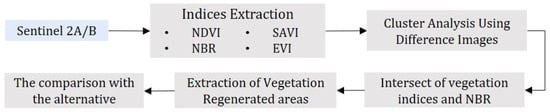
Figure 2.
Flowchart of the study.
2.4. Multispectral Image Analysis
Multispectral images represent data within a specific wavelength range in the electromagnetic spectrum. Images detected by multispectral sensors are extracted in red, green, blue, or RGB form, from which additional information that is not visually detectable can be obtained. Sentinel-2 images are widely used to monitor land vegetation and forests as well as for crop and environmental management, making them extremely useful for disaster management.
2.4.1. NDVI (Normalized Difference Vegetation Index)
NDVI can differentiate green leaves with high reflectivity of green wavelengths from withered or dead plant leaves []. This vegetation index is widely used in agricultural and environmental applications, such as plant growth and crop cultivation. NDVI is primarily used to monitor plant growth and can be modified by combining bands of the visible (RED) and near-infrared (NIR) regions in multispectral imaging. The chlorophyll in plant leaves is observed to characterize the vegetation. The NDVI formula is shown in Equation (1).
NDVI, which takes a value between −1 and 1, is used to quantify plants’ photosynthetic ability. Typically, a value between −1 and 0 indicates that plant regeneration is not possible or that there is no vegetation. Vegetation is determined to be alive and present only if the NDVI value is greater than zero.
2.4.2. EVI (Enhanced Vegetation Index)
EVI, similar to NDVI, is used to quantify the presence and health of photosynthetic plants. EVI is derived by improving the quality of images by eliminating noise caused by the distortion of reflected light by airborne particles, the effects of water pipes, and areas with high vegetation density. Unlike conventional vegetation indices, it is calculated using an atmospheric correction factor, a soil-adjustment coefficient, and a gain factor [].
EVI is calculated using near-infrared, red, and blue wavelength bands. However, a previous study showed that the blue band’s atmospheric calibration is difficult. The results vary significantly, leading to inconsistent computations when calculating EVI values from different sensors []. Thus, can be calculated without a blue band to reduce noise and uncertainty using formulas such as that shown in Equation (2), which are functionally identical to the EVI index and have atmospheric correction effects.
C indicates an atmospheric correction factor, L indicates a soil-adjustment coefficient, and G indicates a gain factor, respectively.
2.4.3. SAVI (Soil-Adjustment Vegetation Index)
Similar to NDVI, SAVI is used to measure the vegetation spectrum. It was introduced by Huete [] and is expressed mathematically by Equation (3). The reflection spectra of soil depend on its characteristics, including moisture, organic content, composition, and iron content. In areas of low vegetative cladding density (<40%) with exposed soil surfaces, the reflectance rates of red and near-infrared spectra can affect the vegetation index. Red and near-infrared wavelengths can be problematic when performing analyses depending on soil presence that can reflect the light of other wavelengths. SAVI can be used to compensate for this phenomenon and to adjust soil brightness when the vegetative sheath is low []. The soil brightness correction factor (L) is used as a value of 0.5 in most land cover types. This index is mainly useful in areas of concentrated vegetation.
2.4.4. NBR (Normalized Burn Ratio)
The main index used to monitor forest fire areas is the NBR, also called the burn index. NBR was developed to observe areas digested by large fires, such as forests fires []. It mainly provides visual confirmation of fire areas and is designed to estimate fire severity. NBR characterizes the extent of the fire and determines the degree of vegetation regeneration after the fire. It combines visible (RED) and short-wave near-infrared (SWIR) bands, as shown in Equation (4).
Fire severity (i.e., difference normalized burn ratio (dNBR)) can be estimated using two NBR images, one taken before and one after the fire, and is calculated by the formula shown in Equation (5). The higher the dNBR value, the more severe the fire damage, and the lower the dNBR value (the more negative), the more the vegetation regenerated after the fire. The U.S. Geological Survey (USGS) classifies fire severity into seven categories []. The dNBR ranges from –500 to 1300, corresponding to the high severity level and to the enhanced regrowth, high (post-fire) level, respectively. Table 2 is a fire severity classification table proposed by USGS.
Table 2.
U.S. Geological Survey (USGS) fire severity level.
2.5. Clustering Analysis
Traditional methods, such as NBR with NDVI, cannot identify the regenerated vegetation areas’ exact boundary. The NBR has a 20 m resolution, and the NDVI has a 10 m resolution. The aggregation of two analyses may give a distorted view in understanding the regenerated vegetation areas. This study uses clustering analysis to detect the regenerated areas accurately.
A non-hierarchical clustering method randomly forms a cluster of data and uses it as an appropriate cluster according to the change in the cluster’s median value. The number of clusters is initially determined by user input. During the analysis phase, a set number of clusters is repeatedly generated to determine the appropriate number of clusters; the algorithm proceeds to another cluster if the first is deemed inappropriate []. This process is repeated until n clusters are created.
2.5.1. K-Medoids and CLARA
The k-medoids clustering method (Partitioning Around Medoids (PAM)) helps compensate for the disadvantages of outlier-sensitive k-means analysis. Unlike k-means, the k-medoids clustering takes actual data points as the expected value []. The surrounding values form clusters according to the nearest representative value. These analytical methods have the advantage of being significantly more stable and less affected by noise when there are outliers in the data []. However, k-medoids clustering has inherent instability problems in large-scale data. This study used a sample-based method called Clustering LARge Application (CLARA) to improve instability [,,]. It extracts only a limited amount of data, selects a representative value, and performs PAM to calculate the optimal median value.
2.5.2. Internal Evaluation of Clusters
Internal evaluation of clusters is a mathematical intra-cluster evaluation method that determines whether it is appropriate to produce several clusters (k-values). A useful clustering indicates that the data are numerically separate from data in other clusters, and within the same cluster, each datum is similarly grouped []. Data points within one cluster are evaluated based on similarities rather than data within other clusters. Several different indices have been developed for the internal assessment of a cluster.
This study uses the Davies–Boulding Index (DBI) and Pakhira–Bandyopadhyay–Maulik Index (PBM) to evaluate the results of the clustering analysis. The DBI is based on the distance between clusters and the separation between data points within a given cluster [,]. The lower the Davies–Bouldin index, the better the clustering. PBM, which Pakhira, Bandyopadhyay, and Maulik designed, is an internal evaluation method that uses inter-cluster distances based on the intra-cluster density []. In contrast to DBI, the higher the PBM index, the better the clustering. The maximum value of PBM is a measure of an appropriate cluster [].
2.6. Detection of Vegetation Regeneration Areas
Previously, the fire severity index of NBR and vegetation index NDVI were mainly used to extract the vegetation recovery area. We performed the analysis using additional EVI and SAVI indices to reduce distortion due to light scattering, soil, and trees. The difference images after four months and immediately after the fire were extracted using three vegetation indices. Moreover, we calculated the correct reproduction boundary by performing cluster analysis of the extracted images. Finally, we extracted the final regeneration area (e.g., the extracted regions from cluster analysis on NDVI and the extracted regions from the fire severity index of the dNBR) by overlapping the regeneration area derived from the cluster analysis and the enhanced growth area derived by dNBR. The proposed method is robust to environmental effects using multispectral data and reliable by overlapping with dNBR.
3. Result and Discussion
3.1. Multispectral Data Processing
Vegetation indices from multispectral images before and after the fire were derived via the indices. However, four months after the fire, we can see that vegetation regenerates in some areas, such as the white part in (b). It can be better understood by viewing the differences in (c). The locations marked in green in Figure 3c are areas where the difference in pixel values is negative, indicating that vegetation regenerated for four months after the fire.
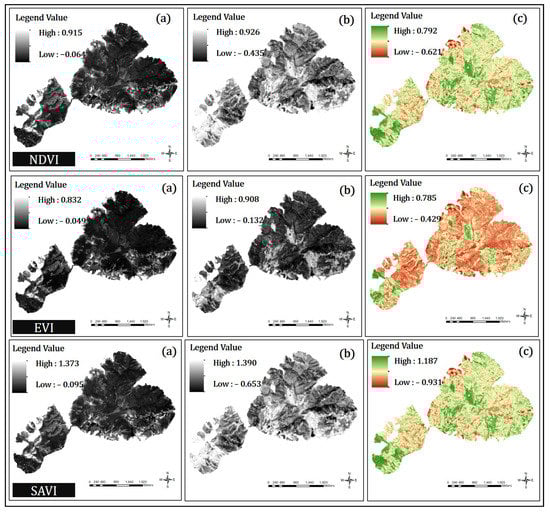
Figure 3.
Images derived from the vegetation indices (a) right after the fire, (b) four months later, and (c) the difference (b,a).
3.1.1. Verification of Regenerative Areas Using Vegetation Indices
Image processing was performed using the ArcGIS program. The min, max, and avg by date of observation of the vegetation indices (NDVI, EVI, and SAVI) were obtained. The calculated values are shown in Table 3. On 26 March 2019, the average pixel value before the fire occurred was positive (+), indicating that vegetation was actively growing before the fire occurred. The average pixel value on 20 April 2019, after the fire, was close to zero for most of the vegetation indices, indicating an absence of vegetation. The average pixel value on 8 August 2019, four months after the fire, increased compared to the value immediately after the fire, indicating that vegetation had regenerated during the four months since the fire. Furthermore, the difference between the average pixel value of the pre-fire image and the post-fire image was positive, which confirmed the vegetation’s average regeneration in the subtracted image.
Table 3.
Result of vegetation index pixel values.
3.1.2. Verification of Regeneration Areas Using NBR
NBR was used to derive images of the affected area before and after the fire, and negative images were extracted using dNBR. Figure 4 presents the NBR images; the details are shown in Table 4.
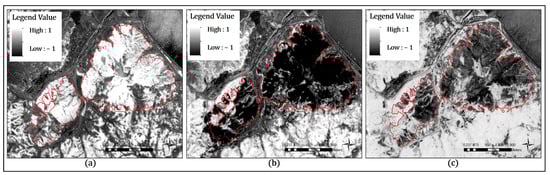
Figure 4.
Normalized Burn Ratio (NBR) images: (a) pre-fire, (b) right after the fire, and (c) four months later.
Table 4.
Result of NBR pixel values.
Figure 4a presents an image obtained on 26 March 2019, before the fire; it consists mostly of positive (+) pixel values, which indicates a healthy distribution of vegetation. Only a few negative (−) pixel values were observed due to the forests’ natural state. The average value was , indicating that the distribution of vegetation was healthy. Figure 4b depicts an image obtained on 20 April 2019, immediately after the fire, clearly demonstrating the destruction. Furthermore, the average pixel value of indicates that most areas were affected by the fire. The image presented in Figure 4c was obtained on 8 August 2019, four months after the fire; compared to the image from April 20, limited vegetation recovery can be observed. Additionally, the mean pixel value was . Compared to the average value in April, this indicates that vegetation regenerated.
The post-fire images were subtracted from the pre-fire images to conduct a quantitative assessment of the vegetative changes over time. Figure 5a presents an image of the difference between 26 March and 20 April 2019, with an average value of . According to the fire severity classification in Table 2, the average value corresponds to a moderate-high severity level. The average value in Figure 5b is , which is significantly lower than the average value in Figure 5a; this numerical decrease corresponds to a low fire severity classification.
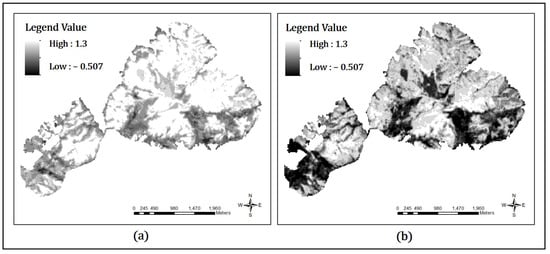
Figure 5.
Difference in NBR; based on the fire severity level’s legend: (a) pre-fire vs. immediately after the fire and (b) pre-fire vs. four months later.
3.2. Vegetation Indices: Clustering Analysis Results
We perform a cluster analysis, based on CLARA, on the vegetation index (NDVI, EVI, and SAVI) and burn index (NBR) to determine the pixel value range according to the cluster of vegetation regeneration areas for each index.
An internal assessment of the vegetation indices showed that it was most appropriate to divide all three vegetation indices into seven clusters. The results of the internal assessment are shown in Table 5 and Figure 6.
Table 5.
Optimal number of clusters in the vegetation index.
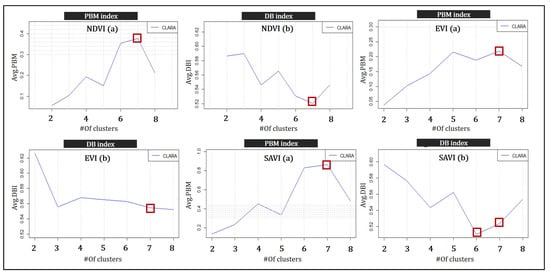
Figure 6.
Internal evaluation results: (a) Pakhira–Bandyopadhyay–Maulik Index (PBM) (b) Davies–Bouldin.
The optimal clusters by index are derived based on the internal evaluation results shown in Table 6. The results of the clustering analysis are shown in Figure 7.
Table 6.
Optimal cluster pixel range for the vegetation index.
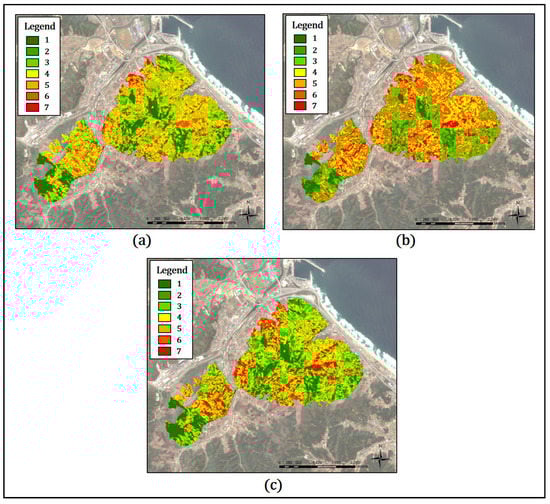
Figure 7.
Cluster analysis of vegetation indices: (a) Normalized Difference Vegetation Index (NDVI), (b) Enhanced Vegetation Index (EVI), and (c) Soil-Adjustment Vegetation Index (SAVI).
Figure 7a presents a cluster analysis according to NDVI. The green area that appears to be a reproduction zone corresponds to cluster number 1 of NDVI in Table 6 and is mainly consistent with the region at the enhanced regrowth level of dNBR. Figure 7b depicts the results obtained using EVI, which show the vegetation in the areas corresponding to cluster numbers 1 and 2 of EVI; further details are given in Table 6. As in the NDVI results, the observed regeneration zone matches most areas at the enhanced growth level of dNBR. Figure 7c presents the result of SAVI analysis and, like in the EVI results, regrowth of vegetation is evident in the areas corresponding to cluster numbers 1 and 2 of SAVI in Table 6. These regions match the regions at the enhanced growth level of dNBR. EVI was more limited in identifying regeneration areas than NDVI, with SAVI being intermediate between the two other indices.When visually compared using EVI or SAVI, it is evident that regrowth sites were sporadically distributed.
3.3. Extraction of the Final Regenerative Areas
The extraction of vegetation reproduction areas using satellite imagery aims to evaluate the correct area by focusing on correcting all distortions related to image quality. Distortion was removed using three vegetation indices, and the exact boundary was extracted through clustering analysis. The intersection of the regions derived from the three vegetation indices is judged as the vegetation regeneration region.
3.3.1. Intersection with the Results of the Vegetation Indices
The regeneration area extracted from the vegetation index was calculated using the ArcGIS program, and since the area of the regeneration area polygon is extracted based on the coordinates, an accurate area can be calculated.
To verify our findings, the method of obtaining ground truth data is the most appropriate. However, in the study area, all of the forest fire areas were cleared through artificial restoration. Since we cannot obtain the ground truth data, we performed verification using NBR. The regenerative area according to NDVI was 1,782,017 m, which was approximately 77.8% of the NBR-derived area of 2,291,425 m. It is shown in Figure 8A. The regenerative site according to EVI was 1,386,861 m, which was approximately 60.5% of the area obtained using NBR. It is shown in Figure 8B. The area of vegetative regeneration according to SAVI was 1,899,166 m, which was approximately 82.9% of the area according to NBR, as shown in Figure 8C. Figure 8D is an image of all three vegetation indices and NBR overlapping. The overlapped area is colored in brown and represents the finally derived vegetation regeneration area. The area of the final regenerative region is approximately 881,558 m, indicating that approximately 12.3% of the total area regenerated.
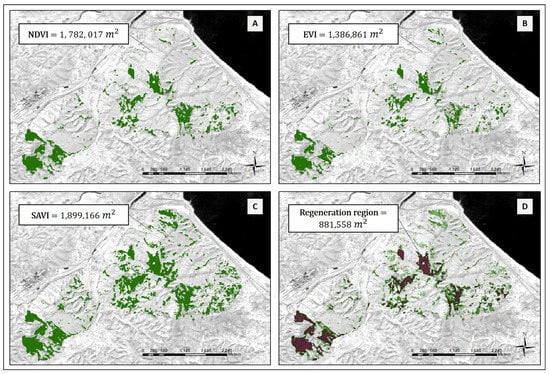
Figure 8.
Match between the vegetation indices and NBR: (A) NDVI, (B) EVI, (C) SAVI, and (D) overlapped region of the vegetation indices and NBR.
The results using the three vegetation indices showed that most of the clusters formed by NDVI, EVI, and SAVI were consistently identified as vegetative regeneration sites. Furthermore, to determine the vegetative regeneration sites, the final regeneration area (green color layer in Figure 9) was derived by extracting the intersection of the areas computed by the different indices.
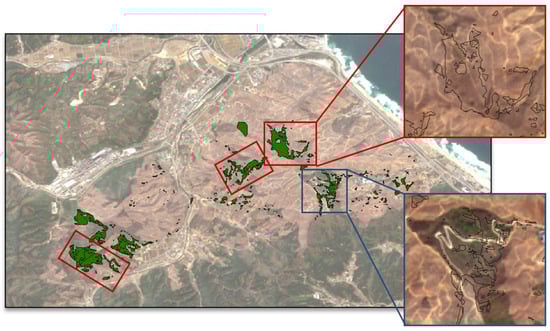
Figure 9.
Final vegetation regenerative regions based on the proposed method.
The background of Figure 9 is the true color image newly taken on 14 April 2020. When overlapped with the vegetation regeneration layer extracted in this study, it was found that some vegetation areas coincide, as shown in the blue square region in Figure 9. In contrast, in the area marked with a red square, it was possible to observe with the naked-eye that all trees were cut to proceed with the reconstruction project, which can be judged as an area where plants were removed even though plant regeneration was possible. Areas extracted in the form of small irregular patches can also be identified as regenerated areas. However, they may represent the growth of weeds, not clusters of vegetation.
The regenerated site’s final area was 881,558 m, representing approximately 12.3% of the total area affected by the forest fire. The dNBR fire severity calculations showed that the regenerated area had a moderate-low or low damage severity. The dNBR fire severity table showed that vegetation could be restored to normal levels.
In Figure 9, NDVI was found to represent a regenerative area when the image pixel value was approximately 0.62 or higher. Furthermore, if a pixel had a value of less than 0.1, it was determined to represent a non-regenerative area. EVI indicated a regenerative region when the pixel value was 0.48 or higher. With SAVI, values above 0.9 indicate regeneration. NBR can be used to extract a vegetative regeneration site based on the precise criteria for fire severity classification. However, because such clear criteria have not been defined for the vegetation indices, it is difficult to extract a regenerative area solely via a comparison of the vegetative indices.
3.3.2. Comparison between the Final Vegetation Regeneration Area and the Area Extracted Using NDVI and dNBR
For benchmarking, we compared the performance of the proposed method with the state-of-the-art alternative method using NDVI and NBR []. The method using NBR and NDVI detected more vegetation regeneration areas than the proposed method in Figure 10. The reason behind this is that the method using NBR and NDVI is sensitive to trees and light scattering. Our method can remove these distortions by using EVI and SAVI indices, thereby leading to smaller regenerative areas than the alternative method using the NBR and NDVI. Thus, the proposed method can detect vegetation regeneration areas with high probability.
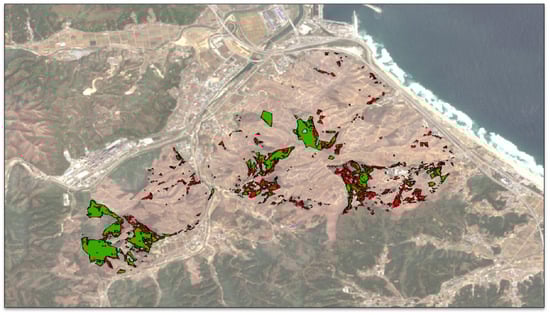
Figure 10.
Comparison of the proposed method and NDVI with NBR: green indicates the extracted areas of the proposed method and red indicates the extracted areas of difference normalized burn ratio (dNBR) with NDVI.
3.4. Verification of Significance of Vegetation Regeneration Area
The research area is currently carrying out a restoration project to plant new trees, and it is expected that it will take more than three years to complete restoration. A follow-up investigation is necessary to monitor the vegetation regeneration area, but the forest fire in the Gangneung area is also a recent event, making monitoring difficult.
Thus, in this study, we performed a spatial autocorrelation analysis based on Getis-Ord Gi* statistics for signature verification []. Spatial autocorrelation analysis derives the significance of the clustering results of pixels created based on coordinates. Getis-Ord Gi* statistics analyzes local clustering patterns to determine individual clustering tendencies with regions within a specific range. The results of NDVI show that the Z-score value was , the EVI value is , and the SAVI value is . All three indices are 99% significant. Spatial autocorrelation analysis can provide a good predictor of hotspot identification. If the p-value of each cluster is less than 0.05, this cluster indicates that vegetation is regenerating with statistical significance compared with other areas.
The green areas in Figure 11 indicate hot spot areas where vegetation regeneration statistically significantly occurs. Therefore, these regions can be preserved without removing all trees and residues.
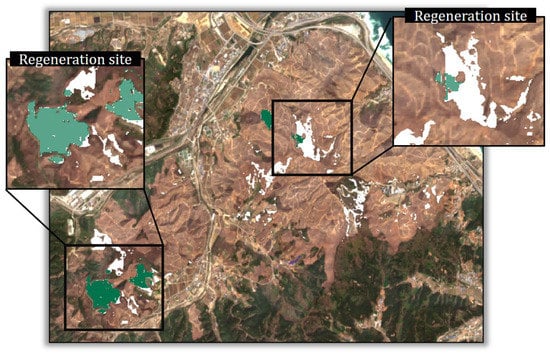
Figure 11.
Getis-Ord Gi* statistics analysis: the green areas indicate the Getis-Ord Gi* statistics results, and the brighter areas indicate the vegetation regeneration area extracted using three indices.
4. Conclusions
This study analyzed regenerated vegetation areas using multispectral images after a forest fire. The study asked whether these areas could be identified using pixel values. A hill in Okgye town, Gangneung city, where forest fires occurred, was set up as the research area.
Multispectral image analysis was conducted using images taken from 26 March to 8 August 2019. On average, it takes five months to begin a restoration project after a fire breaks out in the Republic of Korea; however, in this study, vegetative regeneration was found to have sufficiently progressed in four months. This finding can save human and financial resources used in recovery projects by extracting the vegetative regeneration areas that occur over a short period.
This study developed an analytical method that can be used to obtain primary data for the recovery plan after a forest fire using only the differences in vegetation index values. Assuming that the forest restoration budget for forest fires in Gangwon province in 2019 was 63.4 million USD, 0.2 million USD per 100,000 m was spent. As the regeneration site in Gangneung is 881,000 m, the extraction of vegetative regeneration sites in Gangneung can lead to savings of approximately 1.9 million USD.
Although satellite images are already used in the Republic of Korea to focus on disaster response, this study suggests a new methodology that can obtain a significant amount of data during the recovery phase. The study area consisted of a forest with very dense vegetation before the fire. The analysis was performed using NDVI, which is most commonly used; EVI to compensate for vegetative noise; and SAVI to eliminate noise due to increased soil exposure areas. Furthermore, this study applied clustering analysis to detect the boundary of regenerated vegetation areas accurately.
This study focuses on pixel values in multispectral images. There are currently no criteria to determine regeneration using these vegetation indices. To this end, this study has defined criteria, such as the dNBR fire severity level, by providing a range of pixel values that indicate regrowth after a forest fire outbreak.
Ultimately, future work should focus on localized factors for soil adjustment coefficient and atmospheric correction factor in vegetation indices, leading to improved satellite image noise correction. Moreover, if we can use commercial satellite images with better resolution, more precise boundaries can be extracted.
Author Contributions
Conceptualization, M.-H.J. and Y.K.; methodology, Y.K., M.Y. and J.K. (Junkyeong Kim); software, M.-H.J.; validation, Y.K. and J.K. (Jinpyung Kim); formal analysis, Y.K., M.Y. and M.-H.J.; investigation, J.K. (Jinpyung Kim) and J.K. (Junkyeong Kim); resources, M.-H.J. and Y.K.; data curation, Y.K.; writing—original draft preparation, Y.K. and M.-H.J.; writing—review and editing, M.-H.J., M.Y., Y.K., J.K. (Jinpyung Kim) and J.K. (Junkyeong Kim); visualization, Y.K. and J.K. (Jinpyung Kim); supervision, M.-H.J. and Y.K.; project administration, M.-H.J. and Y.K.; funding acquisition, J.K. (Jinpyung Kim) and M.Y. All authors have read and agreed to the published version of the manuscript.
Funding
This research was supported by a grant (2020-MOIS31-014) from the Fundamental Technology Development Program for Extreme Disaster Response funded by Ministry of Interior and Safety (MOIS, Korea).
Institutional Review Board Statement
Not applicable.
Informed Consent Statement
Not applicable.
Data Availability Statement
Not applicable.
Conflicts of Interest
The authors declare no conflict of interest.
References
- Ministry of the Interior and Safety. 2019 Gangwon East Coast Wildfire White Paper. Available online: https://www.mois.go.kr/frt/bbs/type001/commonSelectBoardArticle.do;jsessionid=vBcXfN21gat-4z9zh2Huh6Xr.node40?bbsId=BBSMSTR_000000000012&nttId=74858 (accessed on 20 December 2019).
- Ministry of the Interior and Safety. Korea Policy Briefing Home Page. Available online: https://www.korea.kr/news/policyNewsView.do?newsId=156367951 (accessed on 23 December 2019).
- National Institute of Forest Science. Research on Technology to Restore Forest Fires and Improve Fire Resistance of Forests; National Institute of Forest Science: Seoul, Korea, 2007; ISBN 978-89-8176-446-3. [Google Scholar]
- Vogler, K.C.; Ager, A.A.; Day, M.A.; Jennings, M.; Bailey, J.D. Prioritization of forest restoration projects: Tradeoffs between wildfire protection, ecological restoration and economic objectives. Forests 2015, 6, 4403–4420. [Google Scholar] [CrossRef]
- Francos, M.; Ubeda, X.; Tort, J.; Panareda, J.M.; Cerda, A. The role of forest fire severity on vegetation recovery after 18 years. Implications for forest management of Quercus suber L. in Iberian Peninsula. Glob. Planet. Change 2016, 145, 11–16. [Google Scholar] [CrossRef]
- Di Mauro, B.; Fava, F.; Busetto, L.; Crosta, G.F.; Colombo, R. Post-fire resilience in the Alpine region estimated from MODIS satellite multispectral data. Int. J. Appl. Earth Obs. Geoinf. 2014, 32, 163–172. [Google Scholar] [CrossRef]
- Keane, R.E.; Burgan, R.; van Wagtendonk, J. Mapping wildland fuels for fire management across multiple scales: Integrating remote sensing, GIS, and biophysical modeling. Int. J. Wildland Fire 2001, 10, 301–319. [Google Scholar] [CrossRef]
- Quan, Y.H.; Zhong, X.; Feng, W.; Dauphin, G.; Gao, L.R.; Xing, M.D. A Novel Feature Extension Method for the Forest Disaster Monitoring Using Multispectral Data. Remote Sens. 2020, 12, 25. [Google Scholar] [CrossRef]
- Assmann, J.J.; Kerby, J.T.; Cunliffe, A.M.; Myers-Smith, I.H. Vegetation monitoring using multispectral sensors - best practices and lessons learned from high latitudes. J. Unmanned Veh. Syst. 2019, 7, 54–75. [Google Scholar] [CrossRef]
- De Santis, A.; Asner, G.P.; Vaughan, P.J.; Knapp, D.E. Mapping burn severity and burning efficiency in California using simulation models and Landsat imagery. Remote Sens. Environ. 2010, 114, 1535–1545. [Google Scholar] [CrossRef]
- Gouveia, C.; DaCamara, C.C.; Trigo, R.M. Post-fire vegetation recovery in Portugal based on spot/vegetation data. Nat. Hazards Earth Syst. Sci. 2010, 10, 673–684. [Google Scholar] [CrossRef]
- Hernandez-Leal, P.A.; Arbelo, M.; Gonzalez-Calvo, A. Fire risk assessment using satellite data. In Natural Hazards and Oceanographic Processes from Satellite Data; Singh, R.P., Shea, M.A., Eds.; Elsevier Science Ltd.: Oxford, UK, 2006; Volume 37, pp. 741–746. [Google Scholar]
- Leblon, B.; Alexander, M.; Chen, J.; White, S. Monitoring fire danger of northern boreal forests with NOAA-AVHRR NDVI images. Int. J. Remote Sens. 2001, 22, 2839–2846. [Google Scholar] [CrossRef]
- Fernandez, A.; Illera, P.; Casanova, J.L. Automatic mapping of surfaces affected by forest fires in Spain using AVHRR NDVI composite image data. Remote Sens. Environ. 1997, 60, 153–162. [Google Scholar] [CrossRef]
- Dragozi, E.; Gitas, I.Z.; Bajocco, S.; Stavrakoudis, D.G. Exploring the Relationship between Burn Severity Field Data and Very High Resolution GeoEye Images: The Case of the 2011 Evros Wildfire in Greece. Remote Sens. 2016, 8, 15. [Google Scholar] [CrossRef]
- Diaz-Delgado, R.; Llorett, F.; Pons, X. Influence of fire severity on plant regeneration by means of remote sensing imagery. Int. J. Remote Sens. 2003, 24, 1751–1763. [Google Scholar] [CrossRef]
- Kuenzi, A.M.; Fule, P.Z.; Sieg, C.H. Effects of fire severity and pre-fire stand treatment on plant community recovery after a large wildfire. For. Ecol. Manag. 2008, 255, 855–865. [Google Scholar] [CrossRef]
- Verbyla, D.L.; Kasischke, E.S.; Hoy, E.E. Seasonal and topographic effects on estimating fire severity from Landsat TM/ETM+ data. Int. J. Wildland Fire 2008, 17, 527–534. [Google Scholar] [CrossRef]
- Ryu, J.H.; Han, K.S.; Hong, S.; Park, N.W.; Lee, Y.W.; Cho, J. Satellite-Based Evaluation of the Post-Fire Recovery Process from the Worst Forest Fire Case in South Korea. Remote Sens. 2018, 10, 918. [Google Scholar] [CrossRef]
- Maselli, F.; Romanelli, S.; Bottai, L.; Zipoli, G. Use of NOAA-AVHRR NDVI images for the estimation of dynamic fire risk in Mediterranean areas. Remote Sens. Environ. 2003, 86, 187–197. [Google Scholar] [CrossRef]
- Miller, J.D.; Thode, A.E. Quantifying burn severity in a heterogeneous landscape with a relative version of the delta Normalized Burn Ratio (dNBR). Remote Sens. Environ. 2007, 109, 66–80. [Google Scholar] [CrossRef]
- Roy, D.R.; Boschetti, L.; Trigg, S.N. Remote sensing of fire severity: Assesing the performance of the normalized Burn ratio. IEEE Geosci. Remote Sens. Lett. 2006, 3, 112–116. [Google Scholar] [CrossRef]
- Fox, D.; Maselli, F.; Carrega, P. Using SPOT images and field sampling to map burn severity and vegetation factors affecting post forest fire erosion risk. Catena 2008, 75, 326–335. [Google Scholar] [CrossRef]
- Nurek, T.; Gendek, A.; Roman, K. Forest residues as a renewable source of energy: Elemental composition and physical properties. BioResources 2019, 14, 6–20. [Google Scholar] [CrossRef]
- Forest For Life. Again, the Forest Campaign-Gangwon Fire Damage Restoration, the Story Now. Forest For Life Home Page. Available online: https://forest.or.kr/activity_stories/1889 (accessed on 5 May 2020).
- Drusch, M.; Del Bello, U.; Carlier, S.; Colin, O.; Fernandez, V.; Gascon, F.; Hoersch, B.; Isola, C.; Laberinti, P.; Martimort, P. Sentinel-2: ESA’s optical high-resolution mission for GMES operational services. Remote. Sens. Environ. 2012, 120, 25–36. [Google Scholar] [CrossRef]
- Van der Meer, F.; Van der Werff, H.; Van Ruitenbeek, F. Potential of ESA’s Sentinel-2 for geological applications. Remote Sens. Environ. 2014, 148. [Google Scholar] [CrossRef]
- Available online: https://scihub.copernicus.eu/dhus/#/home (accessed on 20 March 2019).
- Huete, A.; Didan, K.; Miura, T.; Rodriguez, E.P.; Gao, X.; Ferreira, L.G. Overview of the radiometric and biophysical performance of the MODIS vegetation indices. Remote Sens. Environ. 2002, 83, 195–213. [Google Scholar] [CrossRef]
- Jiang, Z.Y.; Huete, A.R.; Didan, K.; Miura, T. Development of a two-band enhanced vegetation index without a blue band. Remote Sens. Environ. 2008, 112, 3833–3845. [Google Scholar] [CrossRef]
- Matsushita, B.; Yang, W.; Chen, J.; Onda, Y.; Qiu, G.Y. Sensitivity of the Enhanced Vegetation Index (EVI) and Normalized Difference Vegetation Index (NDVI) to topographic effects: A case study in high-density cypress forest. Sensors 2007, 7, 2636–2651. [Google Scholar] [CrossRef]
- Qi, J.; Chehbouni, A.; Huete, A.R.; Kerr, Y.H.; Sorooshian, S. A modified soil adjusted vegetation index. Remote Sens. Environ. 1994, 48, 119–126. [Google Scholar] [CrossRef]
- Cocke, A.E.; Fule, P.Z.; Crouse, J.E. Comparison of burn severity assessments using Differenced Normalized Burn Ratio and ground data. Int. J. Wildland Fire 2005, 14, 189–198. [Google Scholar] [CrossRef]
- Bright, B.C.; Hudak, A.T.; Kennedy, R.E.; Braaten, J.D.; Khalyani, A.H. Examining post-fire vegetation recovery with Landsat time series analysis in three western North American forest types. Fire Ecol. 2019, 15, 8. [Google Scholar] [CrossRef]
- Ng, R.T.; Han, J. Efficient and Effective clustering methods for spatial data mining. In Proceedings of the VLDB, Santiago, Chile, 12–15 September 1994; pp. 144–155. [Google Scholar]
- Park, H.S.; Jun, C.H. A simple and fast algorithm for K-medoids clustering. Expert Syst. Appl. 2009, 36, 3336–3341. [Google Scholar] [CrossRef]
- Madhulatha, T.S. Comparison between k-means and k-medoids clustering algorithms. In Proceedings of the International Conference on Advances in Computing and Information Technology, Chennai, India, 15–17 July 2011; pp. 472–481. [Google Scholar] [CrossRef]
- Velmurugan, T.; Santhanam, T. Computational complexity between K-means and K-medoids clustering algorithms for normal and uniform distributions of data points. J. Comput. Sci. 2010, 6, 363. [Google Scholar] [CrossRef]
- Zhao, G.-F.; Qu, G.-Q. Analysis and implementation of CLARA algorithm on clustering. J. Shandong Univ. Technol. (Sci. Technol.) 2006, 2, 45–48. [Google Scholar]
- Renjith, S.; Sreekumar, A.; Jathavedan, M. Pragmatic evaluation of the impact of dimensionality reduction in the performance of clustering algorithms. In Advances in Electrical and Computer Technologies; Springer: Singapore, 2020; pp. 499–512. [Google Scholar]
- Hassani, M.; Seidl, T. Using internal evaluation measures to validate the quality of diverse stream clustering algorithms. Vietnam. J. Comput. Sci. 2017, 4, 171–183. [Google Scholar] [CrossRef]
- Pakhira, M.K. Fast image segmentation using modified CLARA algorithm. In Proceedings of the 2008 International Conference on Information Technology, Kuala Lumpur, Malaysia, 26–29 August 2008; pp. 14–18. [Google Scholar] [CrossRef]
- Thomas, J.C.R.; Peñas, M.S.; Mora, M. New version of Davies-Bouldin index for clustering validation based on cylindrical distance. In Proceedings of the 2013 32nd International Conference of the Chilean Computer Science Society (SCCC), Temuco, Cautin, Chile, 11–15 November 2013; pp. 49–53. [Google Scholar]
- Gupta, T.; Panda, S.P. A comparison of k-means clustering algorithm and clara clustering algorithm on iris dataset. Int. J. Eng. Technol. 2018, 7, 4766–4768. [Google Scholar]
- Pakhira, M.K.; Bandyopadhyay, S.; Maulik, U. Validity index for crisp and fuzzy clusters. Pattern Recognit. 2004, 37, 487–501. [Google Scholar] [CrossRef]
- Getis, A.; Ord, J.K. The analysis of spatial association by use of distance statistics. Perspect. Spat. Data Anal. 1992, 24, 189–206. [Google Scholar] [CrossRef]
Publisher’s Note: MDPI stays neutral with regard to jurisdictional claims in published maps and institutional affiliations. |
© 2021 by the authors. Licensee MDPI, Basel, Switzerland. This article is an open access article distributed under the terms and conditions of the Creative Commons Attribution (CC BY) license (http://creativecommons.org/licenses/by/4.0/).