Abstract
With the increasing proliferation of electric and hydrogen vehicles, noises to recognize the driving status at low speeds are legalized, so a virtual engine sound generator is required, and slimming is required for packaging it in vehicles. This study investigates an optimization method for improving the electromagnetic force performance and slimming of the magnetic circuit for the permanent magnet structure for the vertical magnetization of the actuator for the acoustic vehicle alerting system (AVAS) of a vehicle and the probabilistic optimization of manufacturing tolerance management. To investigate the impact of the design parameters of the magnetic circuit structure on the electromagnetic force performance and slimming, we performed an independent analysis based on a single variable and investigated the characteristic variations based on multiple variables using a full factorial design and derived a performance prediction regression model using the central composite design of response surface methodology, including the curvature effect, by adding a center point to verify and consider the nonlinear characteristics. Consequently, four effective design parameters were determined to analyze the electromagnetic force performance and slimming of the vertical magnetization structure of the AVAS actuator—permanent magnet thickness, magnetic force collecting plate thickness, yoke position, and yoke thickness. We then performed statistical analysis using Monte Carlo simulation and proposed an optimization management level of 3σ with excellent process capability as the design application tolerance that can occur in the manufacturing process of each design parameter, whereby the confidence level of electromagnetic force performance and slimming improved from 99.46% to 99.73% and 97.62% to 99.73%, respectively.
1. Introduction
The automotive industry is shifting its focus from vehicles with internal combustion engines to electric vehicles, powered by advancements in technology and increased environmental awareness of global warming. It is predicted that the use of eco-friendly vehicles such as electric vehicles (EVs) will continue to expand in the future. One of the advantages of vehicles using electric motors is that there is no noise pollution, which is in contrast to those using internal combustion engines [1]. However, the low noise level of an EV running at a low speed can lead to a situation where pedestrians cannot be acoustically alerted to the approaching vehicle, thus increasing the risk of accidents.
Vehicles generate noise owing to driving speed, powertrain, tire-to-road contact, and aerodynamic sound. When a vehicle is driven at a high speed, the noise generated by the aerodynamic sound and tire-to-road contact dominates over other noise sources, resulting in a sufficiently high noise level that can be easily heard by pedestrians and people in other vehicles. In the case of a vehicle with an internal combustion engine, pedestrians can recognize the movement of the vehicle by the noise generated by the combustion of air and fuel inside the engine even when it is driven at a low speed [2]. However, an electric vehicle running at a low speed (<30 km/h) has a low noise level, making it difficult for pedestrians to hear [3]. Moreover, when the background noise is high, pedestrians often fail to perceive the approaching vehicle early enough to avoid the risk of an accident [4,5].
In 2008, the University of California, Riverside, tested the time for a pedestrian or cyclist to acoustically perceive a vehicle running at a low speed. Consequently, it was observed that background noise, such as the noise generated by an idling vehicle motor, makes it impossible for pedestrians to recognize and cope with the approaching vehicle [6,7,8]. The US National Highway Traffic Safety Administration announced in its 2009 statistical report that when moving at a low speed, an EV is more prone to cause accidents than an internal combustion engine vehicle [1,9]. The US and EU countries mandate the installation of an acoustic vehicle alerting system (AVAS) on an electric or hybrid vehicle so that pedestrians and visually impaired people can perceive its movement from a minimum level of noise against road traffic noise and ambient background noise [10,11,12,13]. An AVAS for hybrid or electric vehicles is a useful device for cyclists and pedestrians, especially for the blind. However, there are arguments against the installation of AVASs because they can generate additional noise pollution. In this context, many studies have been conducted to minimize the side effects of AVASs and generate an effective alarm sound.
Felix and Alexander measured and analyzed the AVAS warning sound of several EVs and confirmed the difference in noise measured from the left and right of each vehicle [14]. Wagner and Gajda assumed that the manufacturer should comply with the AVAS minimum sound pressure level on all sides of the vehicle, making the warning sound excessive in a specific direction depending on the AVAS speaker installation method [15]. To address this problem, studies are underway, and it has been verified that high-quality warning sounds can be generated by creating a sound field controllable with a loudspeaker-based system [16,17]. However, although a loudspeaker can effectively emit sound, its installation requires vehicle design modification, resulting in increased production costs and interference with other vehicle systems. In addition, since the loudspeaker cone is exposed to external environments, such as wind, dust, and moisture, the durability of the system may be a problem [18]. Mounting a standard round loudspeaker inside the engine room in consideration of exposure to the external environment poses the problem of a warning sound transmitted only in a specific direction [19].
As an alternative to a speaker-based AVAS, research is being conducted on an actuator-based system that forces the vibration of a panel. The panel actuator system does not require a vehicle structure design change because it can be simply attached to an existing panel or vehicle. Moreover, it is more durable than the conventional loudspeaker-based system because of no exposure to the external environment [18,20]. Kournoutos et al. reported that an actuator system mounted on a panel reproduces the sound performance of a loudspeaker-based system and outperforms the sound characteristics of the speaker-based system at a certain frequency [21]. Given that the panel vibration AVAS has an omnidirectionally radiated sound field, the main focus of research has been on the sound field and control of the system by structural vibration [18,20,22,23,24,25], and little research has been dedicated to the shape and performance optimization of the actuator of the panel vibration type.
In general, electrical energy is converted into vibration (acoustic) energy in a vibration actuator or loudspeaker system, and research has been conducted to improve its performance [26,27,28,29,30]. Ko et al. studied the electromagnetic force characteristics and vibration performance of a permanent magnet according to its magnetization direction [31]. Since the basic architecture of a panel-type actuator is similar to that of a general actuator and loudspeaker system, its excitation can be improved by optimizing the electromagnetic circuit. The size and shape of the actuator are factors that affect panel excitation and vibration, and their performance can be improved by optimizing the magnetic circuit considering the design boundaries.
Against this background, this study compares the electromagnetic force performance of an AVAS actuator mounted on a vehicle hood depending on the magnetic circuit structure, selects the optimal magnetic circuit structure, and optimizes the design parameters and design tolerances for the electromagnetic force performance and slimming of the selected magnetic circuit structure. As a result of design factor analysis using design of experiment (DOE), the magnetic circuit design parameters applicable to electromagnetic force performance were set as the design parameters of each magnetization structure. With the selected design parameters, we optimized the magnetic circuit using the desirability function as a multi-objective function after deriving a nonlinear regression model using response surface methodology. Subsequently, we presented an optimum tolerance design capable of securing the electromagnetic force characteristics by minimizing the production and assembly process deviations, using the Monte Carlo simulation (MCS), to ensure a 3σ quality-level process capacity.
2. Analysis of the Design Model of the Virtual Engine Sound Actuator for AVAS
2.1. Architecture of the Virtual Engine Sound Actuator
The architecture of the virtual engine sound actuator is a structure with a vertically vibrating interior diaphragm under the influence of the magnetic field generated by the permanent magnet and coil, as illustrated in Figure 1, whereby the permanent magnet is magnetized in the vertical direction. Regarding the materials of the actuator components, magnetic substances were used as the components affecting the formation of the magnetic field (yoke, permanent magnet, magnetic force collecting plate, and cap) and paramagnetic substances for the components that do not affect the formation of the magnetic field (spring, coil, and frame), as defined in Table 1. The coil (copper wire) was wrapped with 238 turns of wire and had a resistivity of 8 Ω. Although it is not magnetized in a magnetic field, it forms part of the magnetic circuit, which affects the formation of the magnetic field when electricity is applied to the wire.
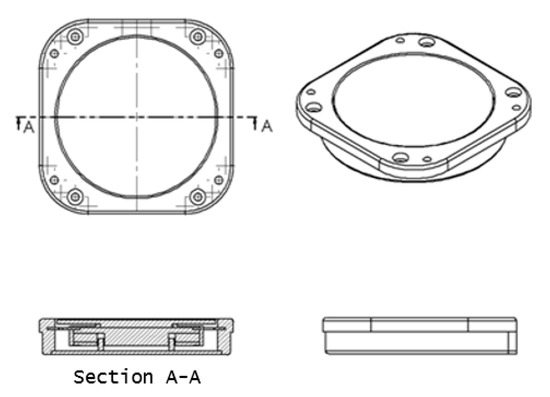

Figure 1.
Design model of virtual engine sound actuator.

Table 1.
Material property of virtual engine sound actuator.
2.2. Electric Field of the Initial Model and Magnetic Force Analysis
Electromagnetic Field of Actuator and Vibration and Response Analysis
Electromagnetic field analysis used FEMM 4.2 software.
The virtual engine sound actuator generates electromagnetic force by the current flowing through the coil and the magnetic field of the permanent magnet in accordance with Fleming’s left-hand rule, and the electromagnetic force is expressed as Equation (1) in accordance with the Lorentz force law.
where F is the electromagnetic force, I is current, l is coil length, and is magnetic field.
The operating conditions of the virtual engine sound actuator are as follows: rated voltage = 12.65 V, impedance = 8 Ω, and current = 1.65 A. Table 1 outlines the properties of the virtual engine sound actuator.
The basic design geometry of the magnetic circuit structure has cylindrical cyclic symmetry, and we performed an electromagnetic field analysis using a two-dimensional plane model. The electromagnetic field analysis model was constructed by applying the Robin boundary condition (mixed boundary condition), which can define both the Dirichlet boundary condition of zero tangential electric potential (V = 0) and the Neumann boundary condition that constrains the magnetic flux passing in the normal direction as the boundary condition to maintain the magnetic flux, as illustrated in Figure 2. Electromagnetic field analysis was used FEMM 4.2 software.
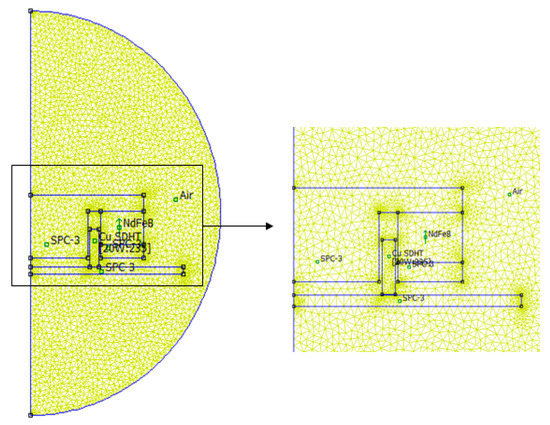
Figure 2.
Model of electromagnetic field analysis from vertical magnetization structure.
The electromagnetic field analysis enabled the calculation of the electromagnetic force generated by the coil current and the magnetic field formed by the yoke, magnetic force, and plate, as well as the magnetic flux density generated by the coil and the permanent magnet, as illustrated in Figure 3. The electromagnetic force was calculated at 19.80 N using Equation (1), which does not satisfy the design target of 20.00 N or higher. To meet the design target, a slimming optimization is necessary.

Figure 3.
Magnetic flux density result of vertical magnetization model.
3. Magnetic Circuit Optimization of a Virtual Engine Sound Actuator
3.1. Overview of the Magnetic Circuit Optimization Process
The electromagnetic force of the actuation was optimized using DOE, as illustrated in Figure 4. To set the design parameters, we selected the factors that may be associated with electromagnetic characteristics and analyzed their effectiveness using a full factorial design. The effective factors were subjected to factor screening, and the effectiveness and curvature were analyzed based on the response values for the electromagnetic force. The nonlinearity of the design parameters was verified using the central composite design of response surface methodology, and the regression model was used for design parameter optimization with the multi-objective function of the electromagnetic force, magnetic circuit, and cap distance.
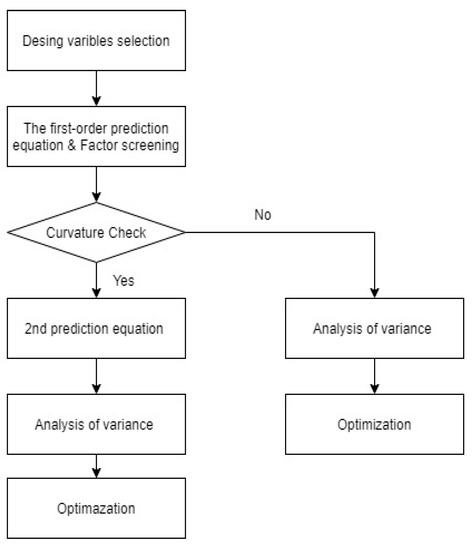
Figure 4.
Flow chart of design of experiment (DOE).
3.2. Design Parameter Optimization for the Magnetic Circuit
3.2.1. Selection of Design Parameters for the Magnetic Circuit and Factorial Design
We set the selection criteria for actuator design parameters as geometric factors that can minimize the volume necessary for the package while maximizing the electromagnetic force. As geometric variables affecting the performance [32], we selected the magnet thickness (MT), plate thickness (PT), yoke position (YP; distance between yoke and coil), and yoke thickness (YT), as shown in Figure 5, with the size based on the outer diameter (Φ = 65 mm) fixed.
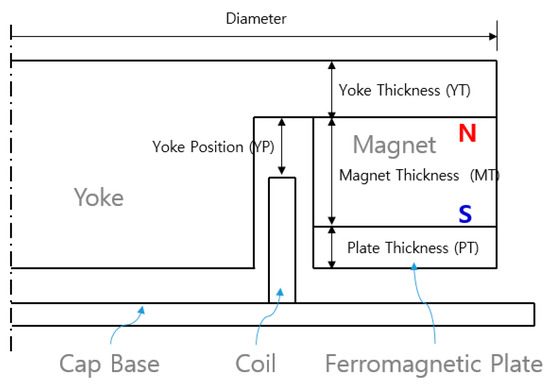
Figure 5.
Design cross-section and design parameters of vertical magnetized structure.
The range of design of the selected parameters was set as the range of design boundaries and the direction minimizing the magnetic circuit thickness, as defined in Table 2. The minimum yoke position was limited to 2.5 mm, which is the minimum separation distance necessary to prevent interference with other components.

Table 2.
Range of design variable dimensions for vertical magnetized structure. (unit: mm).
Among the selected design parameters, the one with the greatest effect was identified using factor analysis of the factorial design methodology [33]. As outlined in Table 3, the factorial design of the selected parameters was implemented as a total of 17 combinations consisting of 16 combinations of a four-factor two-level full factorial design, based on a two-level factorial design for the maximum and minimum values, and one center point of curvature analysis, expressing the electromagnetic force obtained by electromagnetic field analysis as response values.

Table 3.
Full factorial design matrix and results of vertical magnetized structure.
The analysis of variance (ANOVA) of the factorial design of the selected parameters is the adjusted sum of squares (Adj SS), as expressed by Equation (2).
where T1 and T0 are the sums of the response values for the high-level and low-level factors, respectively, and N is the number of experiments. Adj MS is the mean square obtained by dividing Adj SS by the degree of freedom (DF) presented in Table 4.

Table 4.
Full factorial design ANOVA of vertical magnetization model.
The effect of the design parameters can be verified via the analysis presented in Table 4, based on the importance of the response values for the electromagnetic force. The F-value can be obtained by dividing the Adj MS of each factor by the Adj MS of the error, whereby the higher the value, the higher the effect of the related factor on the response value. The p-value is inversely correlated with the F-value, and the significance is considered established at 0.05 or lower. Accordingly, Table 4 lists the significant probability values for the lack of fit of the response values for the electromagnetic force with regard to the magnet thickness (MT), plate thickness (PT), yoke position (YP), and yoke thickness (YT). The analysis revealed that all four design parameters were statistically significant at the 5% significance level. Figure 6 shows the results of the corresponding Pareto analysis. Its nonlinearity suggests that not only the main factors but also their interactions have significant effects.

Figure 6.
Responsivities of design parameters using full factorial design.
3.2.2. Design Parameter Analysis Using a Response Surface Design
Given the nonlinearity of the design parameters of factorial design analysis and the significant characteristics of their interactions, we optimized the performance for volume (thickness, distance) and electromagnetic force using a response surface design conducive to two-level or higher nonlinear prediction, thereby applying the face-centered design generally used to optimize nonlinear design parameters. In the face-centered design, which is a type of response surface methodology, a total of 25 DOE combinations are arrayed, and the analysis results for the electromagnetic force, magnetic circuit thickness, and cap distance are outlined in Table 5.

Table 5.
Response surface design matrix and results of vertical magnetization model.
As shown in Table 6, the ANOVA of the face-centered design confirmed the statistical significance of the main effects of the design parameters, square terms, and interaction effects. With respect to the main and interaction effects of the design parameters, from the electromagnetic force performance relationships, the yoke position (YP) and yoke thickness (YT) were identified as parameters that are more sensitive than magnetic thickness (MT) and plate thickness (PT), as shown in Figure 7 and Figure 8, and the interaction effects were sensitive to the correlations among all parameters.

Table 6.
Response surface design dispersion analysis.
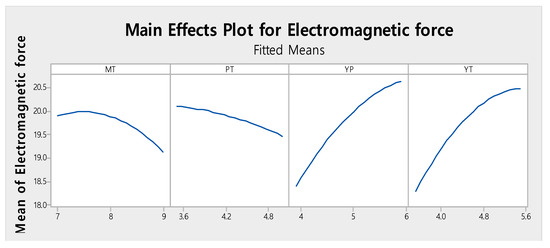
Figure 7.
Main effects plot for electromagnetic force.
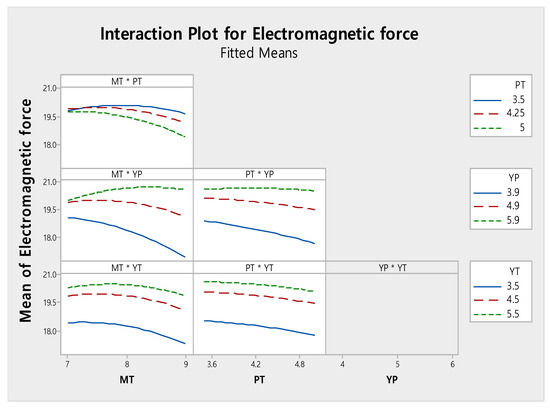
Figure 8.
Interaction effects plot for electromagnetic force.
The main effects were characterized by the negative correlations of MT and PT and the positive correlations of YT and YP with the electromagnetic force.
The interaction effects were characterized by the positive correlations between the value of YP × YT and electromagnetic force, with the correlations of other parameters showing contradictory tendencies.
The regression prediction model of the response value of the design parameters can derive the prediction equation from the results of the face-centered design, which can be obtained with the quadratic regression model for the independent variable K as a quadratic function of the face-centered design, using Equation (3).
where are the independent variables (design parameters), Y is the dependent variable (resulting value), and βi, βij are coefficients, which can be obtained by least squares [34,35]. From Equation (3) and the face-centered design analysis results, the regression prediction equation for the electromagnetic force can be expressed by Equation (4).
The distance between the PT and cap must have the minimum value necessary to avoid vibrational interference. Therefore, their geometric relationship can be derived from Figure 5 as expressed by Equation (5), where the height of the coil was set to a constant value of 10.1 mm.
where D is the distance between magnetic flux collecting plate and cap base, YP is the vertical distance between the coil and yoke, MT is the magnet thickness, and PT is the thickness of the magnetic flux collecting plate.
Moreover, the volume of the actuator is correlated with its thickness, with its diameter fixed, and the thickness can be determined using Equation (6) derived from the relationship shown in Figure 5, where the height of the coil is set at a constant value of 10.1 mm.
where T is the magnetic circuit thickness, YP is the vertical distance between the coil and yoke, and YT is the yoke thickness.
The coefficient of determination (R2) in Equation (4) indicates that the closer the value is to 1, the higher the degree of coincidence of the prediction model of the experiment with the actual value [36]. In this regard, Joglekar and May [37] proposed a coefficient of determination of 0.8, or higher, to establish a good fit of the prediction model. The coefficient of determination of the design parameters for the electromagnetic force was 0.9985 in the regression model, and the adjusted coefficient of determination (R2Adj) was 0.9974. Therefore, the model fit of the derived prediction regression model can be established according to the Joglekar and May criteria.
The electromagnetic force and magnetic circuit thickness are in a trade-off relationship, and among the objective functions of this trade-off relationship, we used a multi-objective function as an optimization method. As an algorithm for the multi-objective function, we used a desirability function, which is a method proposed by Derringer and Suich (1980) [38]. After calculating the individual desirability for each response, the composite desirability was derived. The composite desirability function D is the geometric mean of the values of the desirability function (di), as expressed by Equation (7):
(D = composite desirability, di = individual desirability, and n = total number of measured responses).
As shown in the above equation, the composite desirability is calculated as the geometric mean because if one of the response variables is not satisfied, the composite desirability is zero [39].
The individual desirability di of the composite desirability function is derived using Equations (8)–(10) according to the response characteristics. Equation (8) is the desirability function when the goal is to maximize the response value . and Equation (9) when the goal is to minimize the response value. Equation (10) is a desirability function when the response value approaches the target value.
where
- Li = lower limit for response i
- Ui = upper limit for response i
- Ti = target value for response i
To perform optimization with regard to electromagnetic force and magnetic circuit thickness, we set the following three optimization target functions:
(Q1) Maximization of electromagnetic force on the coil (≥20 N);
(Q2) A minimum distance of 2.5 mm between magnet and cap;
(Q3) Minimization of the magnetic circuit thickness.
Also, the geometric relationship of the optimization target functions is shown in Figure 9.

Figure 9.
Objective function of magnetic circuit.
The design parameters of the magnetic circuit structure were optimized using the desirability function of multi-objective functions for prediction Equation (4) and condition Equations (5) and (6). The optimization results are presented in Figure 10. The individual desirability of the electromagnetic force was 0.92, distance between the plate and base plate was 0.70, actuator thickness was 0.53, and composite desirability was 0.76. The corresponding optimum values of the design parameters were: magnet thickness (MT) = 8.0 mm, plate thickness (PT) = 3.5 mm, yoke position (YP) = 4.8 mm, and yoke thickness (YT) = 4.5 mm. That is, slimming was achieved for YP by 0.1 mm, and the minimum cap distance was secured (2.5–3.5 mm) owing to the slimming of PT by 1.0 mm, resulting in structural stabilization. The predicted electromagnetic force (F) was found to satisfy the design target of 20.02 N.
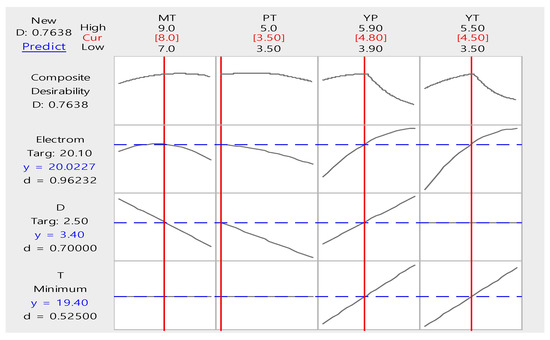
Figure 10.
Desirability chart of design variables for optimization to minimize volume.
4. Verification of the Response Characteristics of the Optimization Analysis Model
To test the reliability of the actuator analysis model, we fabricated an experimental model, as shown in Figure 6, and its validity was verified by comparing the vibration characteristics of the numerical analysis model and experimental model.
The actuator vibration analysis was configured as a finite element model (Figure 11) in which the diaphragm was induced into vertical vibrations by the electromagnetic force. The excitation and boundaries of the electromagnetic force are shown in Figure 12. For the vibration analysis, we analyzed the vibration response characteristics using the mode superposition method.
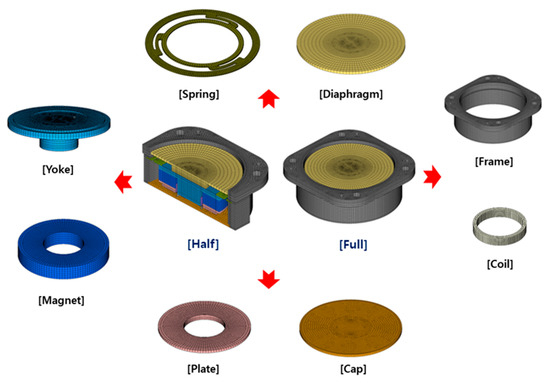
Figure 11.
Finite element model of vibration analysis.

Figure 12.
Boundary condition and load condition for vibration analysis.
Figure 13 presents the analysis equipment composition of the experimental model: a signal generator (B&K Type 4156), a power amplifier (B&K Type2706), and an accelerometer (PCB 356A01). The experimental conditions were set up as follows: applied voltage = 12.6 V (the same as the electromagnetic field analysis), applying a sine sweep method; frequency range = 30 to 1200 Hz; frequency interval = 1 Hz; sweep rate = 1 Hz/s. The measured acceleration signals were analyzed using Siemens LMS test lab equipment through the Siemens LMS front end.
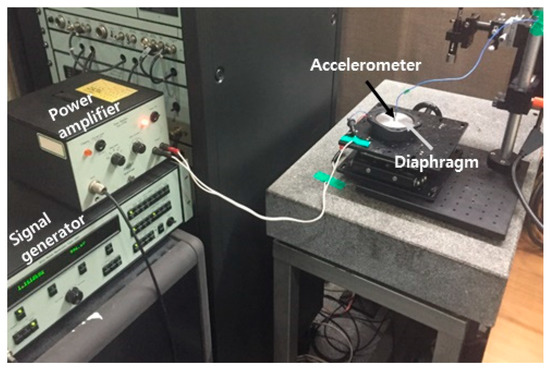
Figure 13.
Set-up of experiment for vibration response.
The analytical and experimental results are shown in Figure 14. The vibration response characteristics of the electromagnetic force excitation force were found to be similar. The resonant frequencies of the analysis model and the experimental model were generally in good agreement around 136 Hz, and the maximum amplitude for the analysis model was 377.6 m/s2 and 377.8 m/s2 for the experimental model. The reliability of the analytical model was verified with an error rate of approximately 0.04%.

Figure 14.
Graph of a comparison between vibration analysis and experimental results.
5. Stochastic Design Optimization
The methodology for analyzing and designing electronic devices and mechanical systems can be broadly classified into deterministic and stochastic methods, depending on whether the uncertainty of design or system parameters is considered. Of these, a stochastic method considers the uncertainty of design or system parameters using a stochastic model, which has been intensively researched from the perspective of reliability engineering [40,41,42]. In general, the uncertainty regarding electronic devices and mechanical systems is expressed by the term “tolerance” with respect to changes in utilization conditions and errors in the manufacturing and assembly processes.
Thus, tolerance of uncertainty causes uncertainty in the actual product, which can exhibit unexpected or unwanted performance by the designer. Therefore, to ensure more competitive product development and production, stochastic analysis and design considering uncertainties such as tolerances should be accompanied.
5.1. Definition of Tolerance and Process Capability
In the mechanical and electronic sectors, system-specific tolerance inevitably exists. The term “tolerance” generally refers to the amount to which variation is allowed. In mechanical engineering, tolerance is defined as the permissible range of variations of a given measure, i.e., the difference between the maximum and minimum values of these variations. Tolerance also means manufacturing limits within a range in which economically feasible manufacturing costs can be determined.
The term “process capability” can be defined as the ability of a manufacturing process to attain a certain level of quality and maintain the quality level in a stable state.
The process capability index (Cp) is obtained from the value calculated from the standard deviation of the upper and lower specification limits (USL and LSL) of the tolerance and the measured value of product performance attained by the related process, as defined by Equation (11).
5.2. Current Performance Prediction of the Design Parameters and Tolerance Designs
The basic tolerance of the optimum value for the design parameters of the magnetic circuit is shown in Figure 15 and Table 7. Owing to the difficulty in estimating the level of process capability level in the development stage, the probability distribution of the design parameters is defined as a triangular distribution that can assume an uncertain process capability level. For performance prediction, we performed stochastic analyses of the sensitivity of design parameters, performance distribution of electromagnetic force, and magnetic circuit thickness distribution after generating 10,000,000 random numbers for design parameters using the Markov chain Monte Carlo method.

Figure 15.
Design tolerance of performance factor from vertical magnetized structure.

Table 7.
Range of design tolerance for performance factor.
We defined the assumption of the probability distribution of the basic tolerance design as a triangular distribution that can assume an uncertain process capability level for the four design parameters, as illustrated in Figure 16. The triangular distribution of each design parameter was assumed to be a probability distribution that averages the minimum and maximum tolerances of the design parameters and the median of the tolerances. The maximum and minimum design ranges were set to the following conditions: magnet thickness (MT) = [] mm; plate thickness (PT) = [] mm; yoke position (YP) = [] mm; yoke thickness (YT) = [] mm.
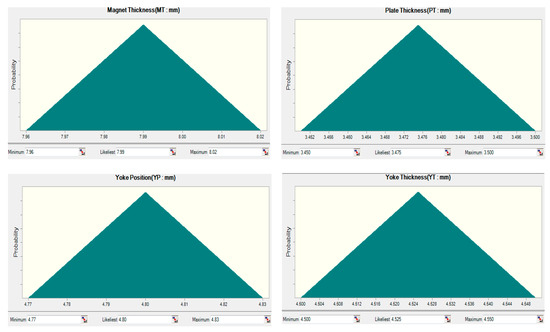
Figure 16.
Probability distribution of vertical magnetized structure performance factor in deScheme 17. The performance distribution of electromagnetic force by design tolerance.
The stochastic performance prediction of the basic tolerance design for the four design parameters is presented in Figure 17 and Figure 18, which plot the results of the stochastic analysis of the electromagnetic force performance distribution and magnetic circuit thickness distribution by generating random numbers within the design range for the upper and lower limits of each design parameter, respectively. As show in Figure 19 and Figure 20, considering the variations in the design parameters of the basic design tolerance, the sensitivity of the design parameters of electromagnetic force and magnetic circuit thickness was found to be mostly attributable to the effects of yoke thickness and yoke position, and the sensitivities of the permanent magnet and magnetic force collecting plate were found to be lower. It was found that the electromagnetic force performance distribution of the basic tolerance design variation attained a performance range of 20.01–20.09 N, and a magnetic circuit thickness of 19.3–19.47 mm.
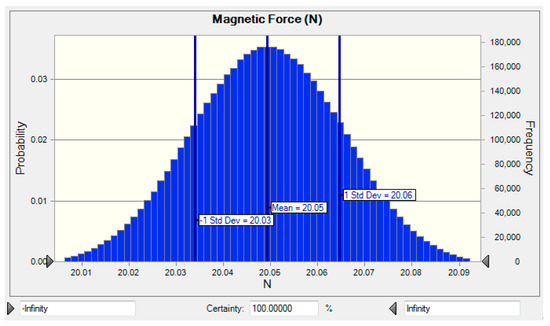
Figure 17.
The performance distribution of electromagnetic force by design tolerance.

Figure 18.
The performance distribution of thickness minimization by design tolerance.

Figure 19.
Analysis results of sensitivity by performance factor.
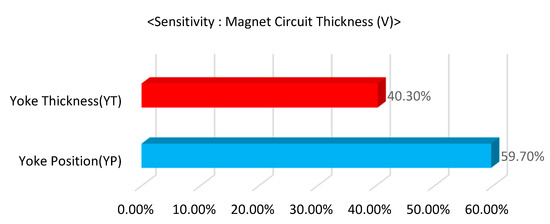
Figure 20.
Analysis results of sensitivity by performance factor of magnetic thickness minimization.
5.3. Tolerance Design Optimization for Performance Assurance for Design Parameters
Optimization of the tolerance for the design parameters can maximize the performance of a virtual engine sound actuator through production quality control. In the product design process, tolerance design is performed to control product quality and manufacturing cost once the conceptual and parameter designs are determined. Therefore, design tolerance optimization is a process for determining the best trade-off between performance and quality. By optimizing the tolerance for the design parameters, we sought to analyze the actuator thickness minimization and electromagnetic force performance distribution at the 3σ level, which is an excellent process capability.
Optimization of Design Parameters Tolerance
The tolerance of design parameters for the magnetic circuit was optimized by calculating the standard deviation at the 3σ level of design tolerance for each parameter, and stochastic analyses were performed based on the sensitivity of the design parameters, electromagnetic force performance distribution, and thickness variation by the probabilistic analysis method after generating 10,000,000 random numbers. The standard deviation of each design parameter can be obtained from the 3σ level process capability index (Cp = 1) and Equation (15).
The probability distribution of the design parameters is a normal distribution that averages the standard deviations calculated using Equations (13)–(16), and the median values of the upper and lower limits of the nominal dimension, as defined in Figure 21. The mean and standard deviation of each design parameter are listed in Table 8.
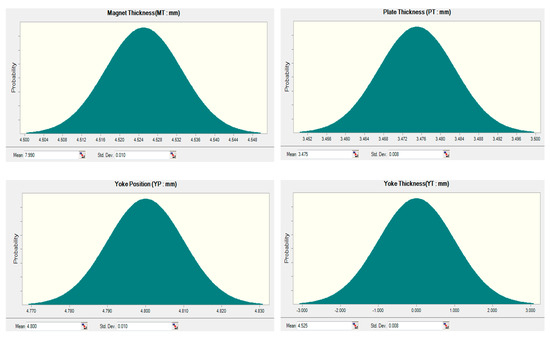
Figure 21.
Probability distribution of performance factor for 3 sigma level.

Table 8.
Mean and standard deviation for the design parameters.
Analysis of the design parameters assumed as a normal distribution, which was performed by applying the Monte Carlo method to the regression model, revealed the electromagnetic force performance distribution (Figure 22) and magnetic circuit thickness distribution (Figure 23). When the tolerance of the design parameters was constrained at the 3σ level, the yoke thickness (YT) and yoke position (YP) were found to be most sensitive in terms of electromagnetic force (Figure 24) and magnetic circuit thickness (Figure 25), with the sensitivity of YP increasing in tandem with an increase in the process capability. The electromagnetic force performance distribution showed a range of 20.02–20.08 N, and a magnetic circuit thickness distribution of 19.39–19.46 mm. The results of the comparison of the reliability of the electromagnetic force performance distribution and the magnetic circuit thickness distribution against the basic design tolerance and reliability at the 3σ level of 99.73% are plotted in Figure 26 and Figure 27, respectively. With the electromagnetic force ranging from 20.01–20.09 N based on the reliability of the 3σ level and the basic design tolerance of 99.46%, the similarity was confirmed with a difference of approximately 0.23% in reliability. By contrast, the magnetic circuit thickness showed a difference of approximately 2.11% in reliability, with its value ranging from 19.39–19.46 mm and basic design tolerance of 97.62%. From this, it can be inferred that the tolerance design of the magnetic circuit thickness minimization at the 3σ level had a greater effect on reliability compared to the reliability of the electromagnetic force performance. This allows the assumption that process stability can be attained by minimizing the variations in yoke thickness (YT) and yoke position (YP), resulting in tolerance optimization, as shown in Figure 28.

Figure 22.
Performance distribution of electromagnetic force by 3 sigma level.
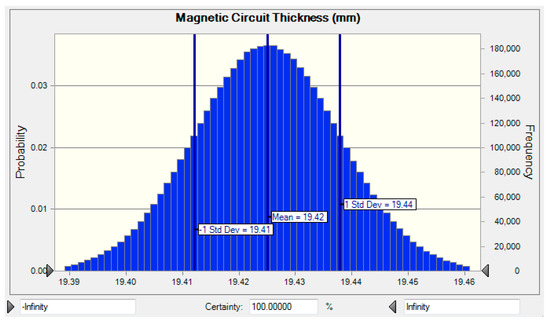
Figure 23.
Performance distribution of thickness minimization by 3 sigma level.
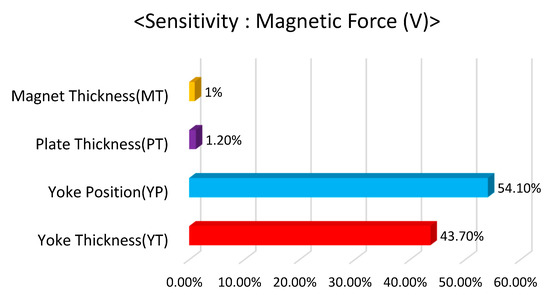
Figure 24.
Analysis results of sensitivity by performance factor of 3 sigma level.

Figure 25.
Analysis results of sensitivity for performance factor of magnetic thickness minimization by 3 sigma level.

Figure 26.
Comparison of reliability of electromagnetic force performance for design tolerance. (A) Electromagnetic force performance level within the range of design tolerance. (B) Electromagnetic force performance level in the range of design tolerance by the 3 sigma (3σ) level.
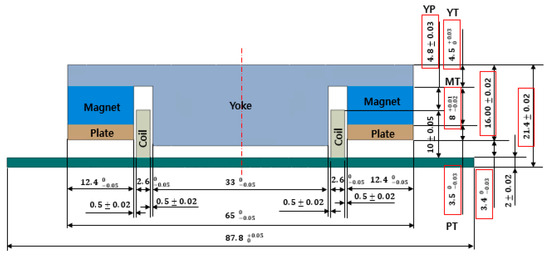
Figure 27.
Comparison of reliability of magnetic thickness minimization for design tolerance of vertical magnetized structure.

Figure 28.
Optimum design of 3 sigma level by performance factor. (A) Minimization level of the magnetic circuit thickness level in the range of design tolerance. (B) Minimization level of magnetic circuit thickness level in the range of design tolerance by 3 sigma level.
6. Conclusions
In this study, we analyzed the actuator’s operational performance, i.e., the effectiveness of the design parameters for the electromagnetic force performance and electromagnetic characteristics, and investigated the methods for magnetic circuit optimization and stochastic prediction of the performance of design parameter tolerance. As the research methods, we used a full factorial design for verifying the effectiveness and screening the characteristics of the design parameters and performed an experimental verification by applying the response surface design and multi-purpose functions for optimization. We also performed statistical analyses using the Markov chain Monte Carlo method to investigate the effects of the tolerances in the production process of design parameters on performance and verified its usefulness. In conclusion, the effectiveness factors for the electromagnetic force in the vertical magnetization magnetic circuit of a permanent magnet, which is the research object of this study, were identified to be the permanent magnet thickness, magnetic force collecting plate thickness, yoke position, and yoke thickness. With the effective factors showing the second-order nonlinear curvature characteristics including interactions, a response surface design was judged to be the most suitable model to attain optimization by modeling the curved surface characteristics that can consider the nonlinearity. As a result of optimizing the multi-objective function to minimize the boundary conditions of the design parameters and the magnetic circuit thickness and maximize the electromagnetic force, the magnetic circuit thickness was estimated at 19.40 mm, and the electromagnetic force was estimated at 20.02 N. It was found that the electromagnetic force performance can reach a range of 20.01–20.09 N, and the magnetic circuit slimming can reach 19.39–19.46 mm, in terms of the design tolerance and the design production tolerance at the 3σ level based on a reliability of 99.73%. A design tolerance optimization analysis revealed that minimizing the variations in yoke thickness and yoke position is advantageous for electromagnetic force performance, and minimizing the variations of yoke thickness and yoke position in the magnetic circuit thickness is advantageous for slimming an actuator. Regarding the vertical magnetization structure, an increase in yoke thickness (YT) and yoke position (YP) was found to have a positive effect on the electromagnetic field performance, which allowed the conclusion that slimming is possible up to 19.39 mm, even considering the 3σ process conditions. Taking these results together, it may be concluded that optimization using response surface design and optimization of tolerance management based on stochastic performance prediction using the Monte Carlo method are highly viable and a useful method for the optimum design of an AVAS.
Furthermore, we plan to analyze the mass production performance and perform ongoing data verification based on the accumulated data for tolerance management optimization and to pursue research that applies the AI-based optimization approach.
Author Contributions
All participating researchers discussed the idea, agreed to the result, and contributed to the thesis writing. In particular, D.-J.H. planned and organized the research contents as a whole, and contributed to the analysis of the results and improvement of the manuscript. D.-S.K. performed the tolerance design optimization analysis, and H.-J.L. contributed to the actuator performance optimization by the experimental design method. All authors have read and agreed to the published version of the manuscript.
Funding
This work was supported by a Korea Institute of Energy Technology Evaluation and Planning (KETEP) grant funded by the Korean government, MOTIE (No. 20172010000420).
Institutional Review Board Statement
Not applicable.
Informed Consent Statement
Not applicable.
Data Availability Statement
Not applicable.
Conflicts of Interest
The authors declare no conflict of interest.
References
- Lorencki, J. Warning sounds in electric and hybrid-electric vehicles. Zesz. Nauk. Inst. Pojazdow/Politech. Warsz. 2016, 5, 51–57. [Google Scholar]
- Park, H.W.; Bae, M.J. Virtual engine sound synthesis of eco-friendly vehicle. J. Eng. Appl. Sci. 2018, 13, 513–517. [Google Scholar]
- Misdariis, N.; Pardo, L.F. The Sound of Silence of Electric Vehicles—Issues and Answers. Inter-Noise, August 2017, Hong-Kong, China. 2018. Available online: https://hal.archives-ouvertes.fr/hal-01708883 (accessed on 13 February 2021).
- Kerber, S.; Fastl, H. Prediction of perceptibility of vehicle exterior noise in background noise. Ag Tech. Akust. 2008, 1, 623–624. [Google Scholar]
- Kerber, S. Perceptibility of Vehicle Exterior Noise in Background Noises: Psychoacoustic Evaluation and Model-Based Predictions (Wahrnehmbarkeit von Fahrzeugaußengeräuschen in Hintergrundgeräuschen: Psychoakustische Beurteilungen und modellbasierte Prognosen). Ph.D. Thesis, Faculty of Electrical Engineering and Information Technology Technical University, Muenchen, Germany, 2008. [Google Scholar]
- Rosenbaum, L.D. Testing the Audibility of Quiet Cars? Public Forum on Quiet Cars, Research Supported by National Federation of the Blind; University of California, Riverside, Presentation to the National Highway Transportation Safety Administration: Riverside, CA, USA, 2008. [Google Scholar]
- Sandberg, U.; Luc Goubert, L.; Mioduszewski, P. Are vehicles driven in electric mode so quiet that they need acoustic warning signals. In Proceedings of the 20th International Congress on Acoustics (ICA), Sydney, Australia, 23–27 August 2010. [Google Scholar]
- Van der Auweraer, H.; Janssens, K.; Sabbatini, D.; Sana, E.; De Lange, K. Electric Vehicle Exterior Sound and Sound Source Design for Increased Safety—LMS International; Internoise: Osaka, Japan, 2011. [Google Scholar]
- Hanna, R. Incidence of Pedestrian and Bicyclist Crashes by Hybrid Electric PassengerVehicles; National Highway Traffic Safety Administration Technical Report DOT; National Highway Traffic Safety Administration (NHTSA): Riverside, CA, USA, 2009; Volume 811, p. 204.
- Tabata, T.; Konet, H.; Kanuma, T. Development of Nissan Approaching Vehicle Sound for Pedestrians; Internoise: Osaka, Japan, 2011. [Google Scholar]
- Gillibrand, A.; Suffield, I.; Vinamata, X. An Initial Study to Develop Appropriate Warning Sound for a Luxury Vehicle Using an Exterior Sound Simulator, Jaguar Land Rover; SAE Technical Paper 2011-01-1727; SAE: Warrendale, PA, USA, 2011. [Google Scholar] [CrossRef]
- United Nations Economic Commission for Europe (UNECE). Regulation No 138 Uniform Provisions Concerning the Approval of Quiet Road Transport Vehicles with Regard to Their Reduced Audibility(QRTV). Off. J. Eur. Union 2017, 1, 33–63. [Google Scholar]
- Department of Transportation, National Highway Traffic Safety Administration. 49 CFR Parts 571 and 585 [Docket No. NHTSA?2016?0125] RIN 2127? AK93 Federal Motor Vehicle Safety Standards; Minimum Sound Requirements for Hybrid and Electric Vehicles; National Highway Traffic Safety Administration: Washington, DC, USA, 2016.
- Nyeste, P.; Wogalter, M.S. On adding sound to quiet vehicles. In Proceedings of the Human Factors and Ergonomics Society Annual Meeting, New York, NY, USA, 22–26 September 2008; Sage Publications: Los Angeles, CA, USA, 2008; Volume 52, pp. 1747–1750. [Google Scholar]
- Wagner, A.; Gajda, C. Akustische Landschaften—Wie laut ist das Elektroauto? Proc Daga: Munich, Germany, 2018; Volume 44, pp. 792–795. [Google Scholar]
- Elliott, S.J.; Cheer, J.; Murfet, H.; Holland, K.R. Minimally radiating sources for personal audio. J. Acoust. Soc. Am. 2010, 128, 1721–1728. [Google Scholar] [CrossRef] [PubMed]
- Simón Gálvez, M.F.; Elliott, S.J.; Cheer, J. A superdirective array of phase shift sources. J. Acoust. Soc. Am. 2012, 132, 746–756. [Google Scholar] [CrossRef]
- Kournoutos, N.; Cheer, J. Investigation of a directional warning sound system for electric vehicles based on structural vibration. J. Acoust. Soc. Am. 2020, 148, 588–598. [Google Scholar] [CrossRef] [PubMed]
- Rabiner, L.; Schafer, R. Theory and Applications of Digital Speech Processing; Prentice Hall Press: Upper Saddle River, NJ, USA, 2010. [Google Scholar]
- Kournoutos, N.; Cheer, J. A system for controlling the directivity of sound radiated from a structure. J. Acoust. Soc. Am. 2020, 147, 231–241. [Google Scholar] [CrossRef]
- Kournoutos, N.; Cheer, J.; Elliott, S. The Design of a Low-Cost Directional Warning Sound System for Electric Vehicles. In Proceedings of the International Conference on Noise and Vibration Engineering (ISMA), Leuven, Belgium, 16–18 September 2018. [Google Scholar]
- Deffayet, C.; Nelson, P.A. Active control of low-frequency harmonic sound radiated by a finite panel. J. Acoust. Soc. Am. 1988, 84, 2192–2199. [Google Scholar] [CrossRef]
- Pan, J.; Snyder, S.D.; Hansen, C.H.; Fuller, C.R. Active control of far-field sound radiated by a rectangular panel—A general analysis. J. Acoust. Soc. Am. 1992, 91, 2056–2066. [Google Scholar] [CrossRef]
- Fuller, C.R.; Hansen, C.H.; Snyder, S.D. Active control of sound radiation from a vibrating rectangular panel by sound sources and vibration inputs: An experimental comparison. J. Sound Vib. 1991, 145, 195–215. [Google Scholar] [CrossRef]
- Anderson, D.A.; Heilemann, M.C.; Bocko, M.F. Measures of vibrational localization on point-driven flat-panel loudspeakers. Proc. Mtgs. Acoust. 2016, 26, 065003. [Google Scholar]
- Lee, J.H.; Ko, D.S.; Kwon, S.Y.; Kim, J.Y.; Hur, D.J. A study of optimization for vibration performance and electromagnetic force of the bone conduction speaker actuator asymmetry. Proc. Inst. Mech. Eng. Part. C J. Mech. Eng. Sci. 2018, 232, 2032–2043. [Google Scholar] [CrossRef]
- Ko, D.S.; Hur, D.J.; Park, T.W.; Lee, J.H. A study on improving bone conduction speaker performance by electromagnetic prediction and performance distribution by statistical analysis method. J. Mech. Sci. Technol. 2017, 31, 1673–1681. [Google Scholar] [CrossRef]
- Lee, J.H.; Hur, D.J.; Ko, D.S.; Lee, H.J.; Kim, J.Y. Optimization of Electromagnetic force for Non-Directional Speaker. J. Korean Soc. Precis 2016, 1, 423–424. [Google Scholar]
- Lee, H.J.; Hur, D.J.; Ko, D.S.; Kim, J.Y. Optimization of Electromagnetic force for Omni-Directional Actuator. KNSVE 2017, 173. [Google Scholar]
- Marinescu, M.; Marinescu, N.; Kuhn, S. Optimization of magnetic circuits for loudspeakers 1970 and now. In Proceedings of the 2016 International Symposium on Fundamentals of Electrical Engineering (ISFEE), Bucharest, Romania, 30 June–2 July 2016; pp. 1–10. [Google Scholar]
- Ko, D.S.; Hur, D.J.; Park, T.W.; Lee, J.H.; Lee, S.S. A study of the vibration characteristics of a haptic vibrator for horizontal and vertical magnetization. Trans. Korean Soc. Mech. Eng. A 2015, 39, 415–421. [Google Scholar] [CrossRef][Green Version]
- Kim, B.W.; Hu, J. Optimizing design of side airbag inflator using DOE method. J. Korean Soc. Precis 2011, 28, 1189–1195. [Google Scholar]
- Sim, C.H. Optimization of process variables for insulation coating of conductive particles by response surface methodology. Korean Chem. Eng. Res. 2016, 54, 44–51. [Google Scholar] [CrossRef]
- Lee, S.B. Experiment Plan Focussing on Examples with MINITAB; Eretech Korea: Pocheon, Korea, 2014; pp. 321–331. [Google Scholar]
- Park, J.H.; Kwon, J.H.; Hwang, S.M. Design of Magnetic Circuit with Minimum Leakage Using Response Surface Methodology. Trans. Korean Soc. Mech. Eng. A 2010, 34, 27–33. [Google Scholar] [CrossRef]
- Cho, W.; Song, B.; Lee, J.; Kim, J.; Kim, J.; Yoon, Y.; Choi, J.; Kim, G.; Lee, J. Composition Analysis of Various Blueberries Produced in Korea and Manufacture of Blueberry Jam by Response Surface Methodology. J. Korean Soc. Food Sci. Nutr. 2010, 39, 319–323. [Google Scholar] [CrossRef]
- Joglekar, A.M.; May, A.T. Product excellence through design of experiments. Cereal Foods World 1987, 32, 857. [Google Scholar]
- Derringer, G.; Suich, R. Simultaneous optimization of several response variables. J. Qual. Technol. 1980, 12, 214–219. [Google Scholar] [CrossRef]
- Byun, J.H.; Lee, G.M.; Kim, S.H. Design of Experiments for Optimization of Helicopter Flight Tests. Trans. KSME C Technol. Innov. 2014, 2, 113–124. [Google Scholar] [CrossRef]
- Bennett, G.; Gupta, L.C. Least Cost Tolerance. I. Int. J. Prod. Res. 1969, 8, 65–74. [Google Scholar] [CrossRef]
- Spotts, M.F. Dimensioning Stacked Assemblies. Mach. Des. 1978, 1, 60–63. [Google Scholar]
- Spotts, M.F. Dimensioning and Tolerancing for Quantity Production; Prentice Hall: Englewood Cliffs, NJ, USA, 1985. [Google Scholar]
Publisher’s Note: MDPI stays neutral with regard to jurisdictional claims in published maps and institutional affiliations. |
© 2021 by the authors. Licensee MDPI, Basel, Switzerland. This article is an open access article distributed under the terms and conditions of the Creative Commons Attribution (CC BY) license (http://creativecommons.org/licenses/by/4.0/).