Article

Silver Nanoparticles Functionalized by Fluorescein Isothiocyanate or Rhodamine B Isothiocyanate: Fluorescent and Plasmonic Materials

1
Department of Chemistry, Sapienza University of Rome, P.le A. Moro, 5, 00185 Rome, Italy
2
Department of Sciences, Roma Tre University Via della Vasca Navale 79, 00146 Rome, Italy
3
Istituto di Struttura della Materia-CNR (ISM-CNR), Division of Ultrafast Processes in Materials (FLASHit), Via del Fosso del Cavaliere 100, 00133 Rome, Italy
4
Istituto di Struttura della Materia-CNR (ISM-CNR), Division of Ultrafast Processes in Materials (FLASHit), 00015 Monterotondo Scalo, Italy
5
IOM CNR, Laboratorio TASC, S.S. 14 Km 163.5 AREA Science Park Basovizza, 34149 Trieste, Italy
*
Author to whom correspondence should be addressed.
Appl. Sci. 2021, 11(6), 2472; https://doi.org/10.3390/app11062472
Submission received: 13 February 2021 / Revised: 3 March 2021 / Accepted: 5 March 2021 / Published: 10 March 2021
(This article belongs to the Special Issue Nanomaterials for Sensing and Imaging Applications)

Abstract

:
This paper presents the synthesis of silver nanoparticles (AgNPs) functionalized with fluorescent molecules, in particular with xanthene-based dyes, i.e., fluorescein isothiocyanate (FITC, λmax = 485 nm) and rhodamine B isothiocyanate (RITC, λmax = 555 nm). An in-depth characterization of the particle–dye systems, i.e., AgNPs–RITC and AgNPs–FITC, is presented to evaluate their chemical structure and optical properties due to the interaction between their plasmonic and absorption properties. UV–Vis spectroscopy and the dynamic light scattering (DLS) measurements confirmed the nanosize of the AgNPs–RITC and AgNPs–FITC. Synchrotron radiation X-ray photoelectron spectroscopy (SR-XPS) was used to study the chemical surface functionalization by structural characterization, confirming/examining the isothiocyanate–metal interaction. For AgNPs–RITC, in which the plasmonic and fluorescence peak are not superimposed, the transient dynamics of the dye fluorescence were also studied. Transient absorption measurements showed that by exciting the AgNPs–RITC sample at a wavelength corresponding to the AgNP plasmon resonance, it was possible to preferentially excite the RITC dye molecules attached to the surface of the NPs with respect to the free dye molecules in the solution. These results demonstrate how, by combining plasmonics and fluorescence, these AgNPs can be used as promising systems in biosensing and imaging applications.

1. Introduction

The interaction of organic molecules with metal nanoparticles (NPs) is of central importance for a large number of applications in several fields, such as chemical and biological sensing [1,2,3,4], optics [5,6,7], energy [8,9,10,11], catalysis [12,13,14,15], and nanomedicine [16,17,18,19]. Many of these applications are based on the effect of the localized surface plasmon resonance (LSPR) on the absorption, emission, and scattering of molecules attached to or in close vicinity to the NP surface [20,21,22,23]. NPs have the remarkable property of strongly enhancing the local electromagnetic near-field [24,25,26]. This, together with the effect of the LSPR, can lead to the light absorption and scattering of NPs to be extremely strong, e.g., their absorption cross-sections are up to five to six orders of magnitude higher than the most strongly absorbing organic dye molecules. This has led to the use of NPs as beacons to enhance processes in nearby molecules [27,28].
The interaction of fluorophores with Au and Ag NPs is slightly more complicated, and both enhancement and quenching of fluorophores have been reported [29,30,31,32,33]. Part of the reason for this apparent contradiction is that the interaction between fluorophores and the NP depends on the size and shape of the NPs, the distance of the fluorophore from the surface of the NPs, the orientation of the fluorophore dipole moment, and the overlap between the emission spectrum of the fluorophore and the plasmon resonance spectral feature of the NP [34,35,36].
The effect of dye quenching has been widely exploited for chemical and biological sensing applications, with one of the main techniques being fluorescence resonance energy transfer (FRET), in which the initially excited chromophore transfers its energy to an acceptor, thus quenching the fluorescence in the process [23,37,38]. In FRET, the donor and acceptor are molecules, and the energy transfer occurs via through space dipole–dipole interactions [39,40,41]. When a NP is used as an acceptor, the quenching is amplified up to 100 times, making the technique more sensitive. An elegant example of this technique is the use of single-stranded DNA (ssDNA) linked to a NP at one end and to a fluorophore at the other end. In the absence of a target DNA, the ssDNA is relaxed and the fluorophore is close to the surface of the NP, thus quenched through FRET. Only when the ssDNA is conjugated with the target DNA, the fluorophore moves away from the surface of the NP and the fluorescence is allowed to light up [42]. Based on this mechanism, a simultaneous recognition of ssDNA and double-stranded DNA (dsDNA) was also studied [43]. Biosensing often relies on fluorescence because this method is simple but sensitive. In some cases, nanomaterials can be an alternatives to traditional organic dyes or sometimes act as a solid support by simplifying the sensor design, increasing the labeling ratio for greater sensitivity and facilitating eventual recovery [44,45,46,47,48,49].
Among others, silver engineered nanomaterials are used in biosensing and imaging when conjugated with dyes [50,51,52]. Specially fluorescein isothiocyanate (FITC) and rhodamine B isothiocyanate (RITC) are widely used in sensing and as labeling systems [53,54,55,56]. To fully exploit the potential of AgNPs conjugated with fluorescent molecules, it is necessary to have a complete understanding of the details of the structures and the interaction between the fluorophore blocked in a position very close to the NP.
This paper focuses on the synthesis of AgNPs capped by FITC or RITC (i.e., AgNPs–FITC and AgNPs–RITC). The deep characterizations of these nanosystems allowed us to clarify the chemical structure and evaluate the optical properties due to the direct interaction between plasmonic nanoparticles and fluorescent dyes.

2. Materials and Methods

2.1. Materials

Silver nitrate (AgNO3, Aldrich, purity 99.9%), sodium borohydride (NaBH4, Aldrich, purity 99.99%), fluorescein isothiocyanate (FITC, Aldrich, purity ≥9%), and rhodamine B isothiocyanate (RITC, Aldrich, purity ≥90%) were used as received. Deionized water was degassed for 10 min with argon before use.

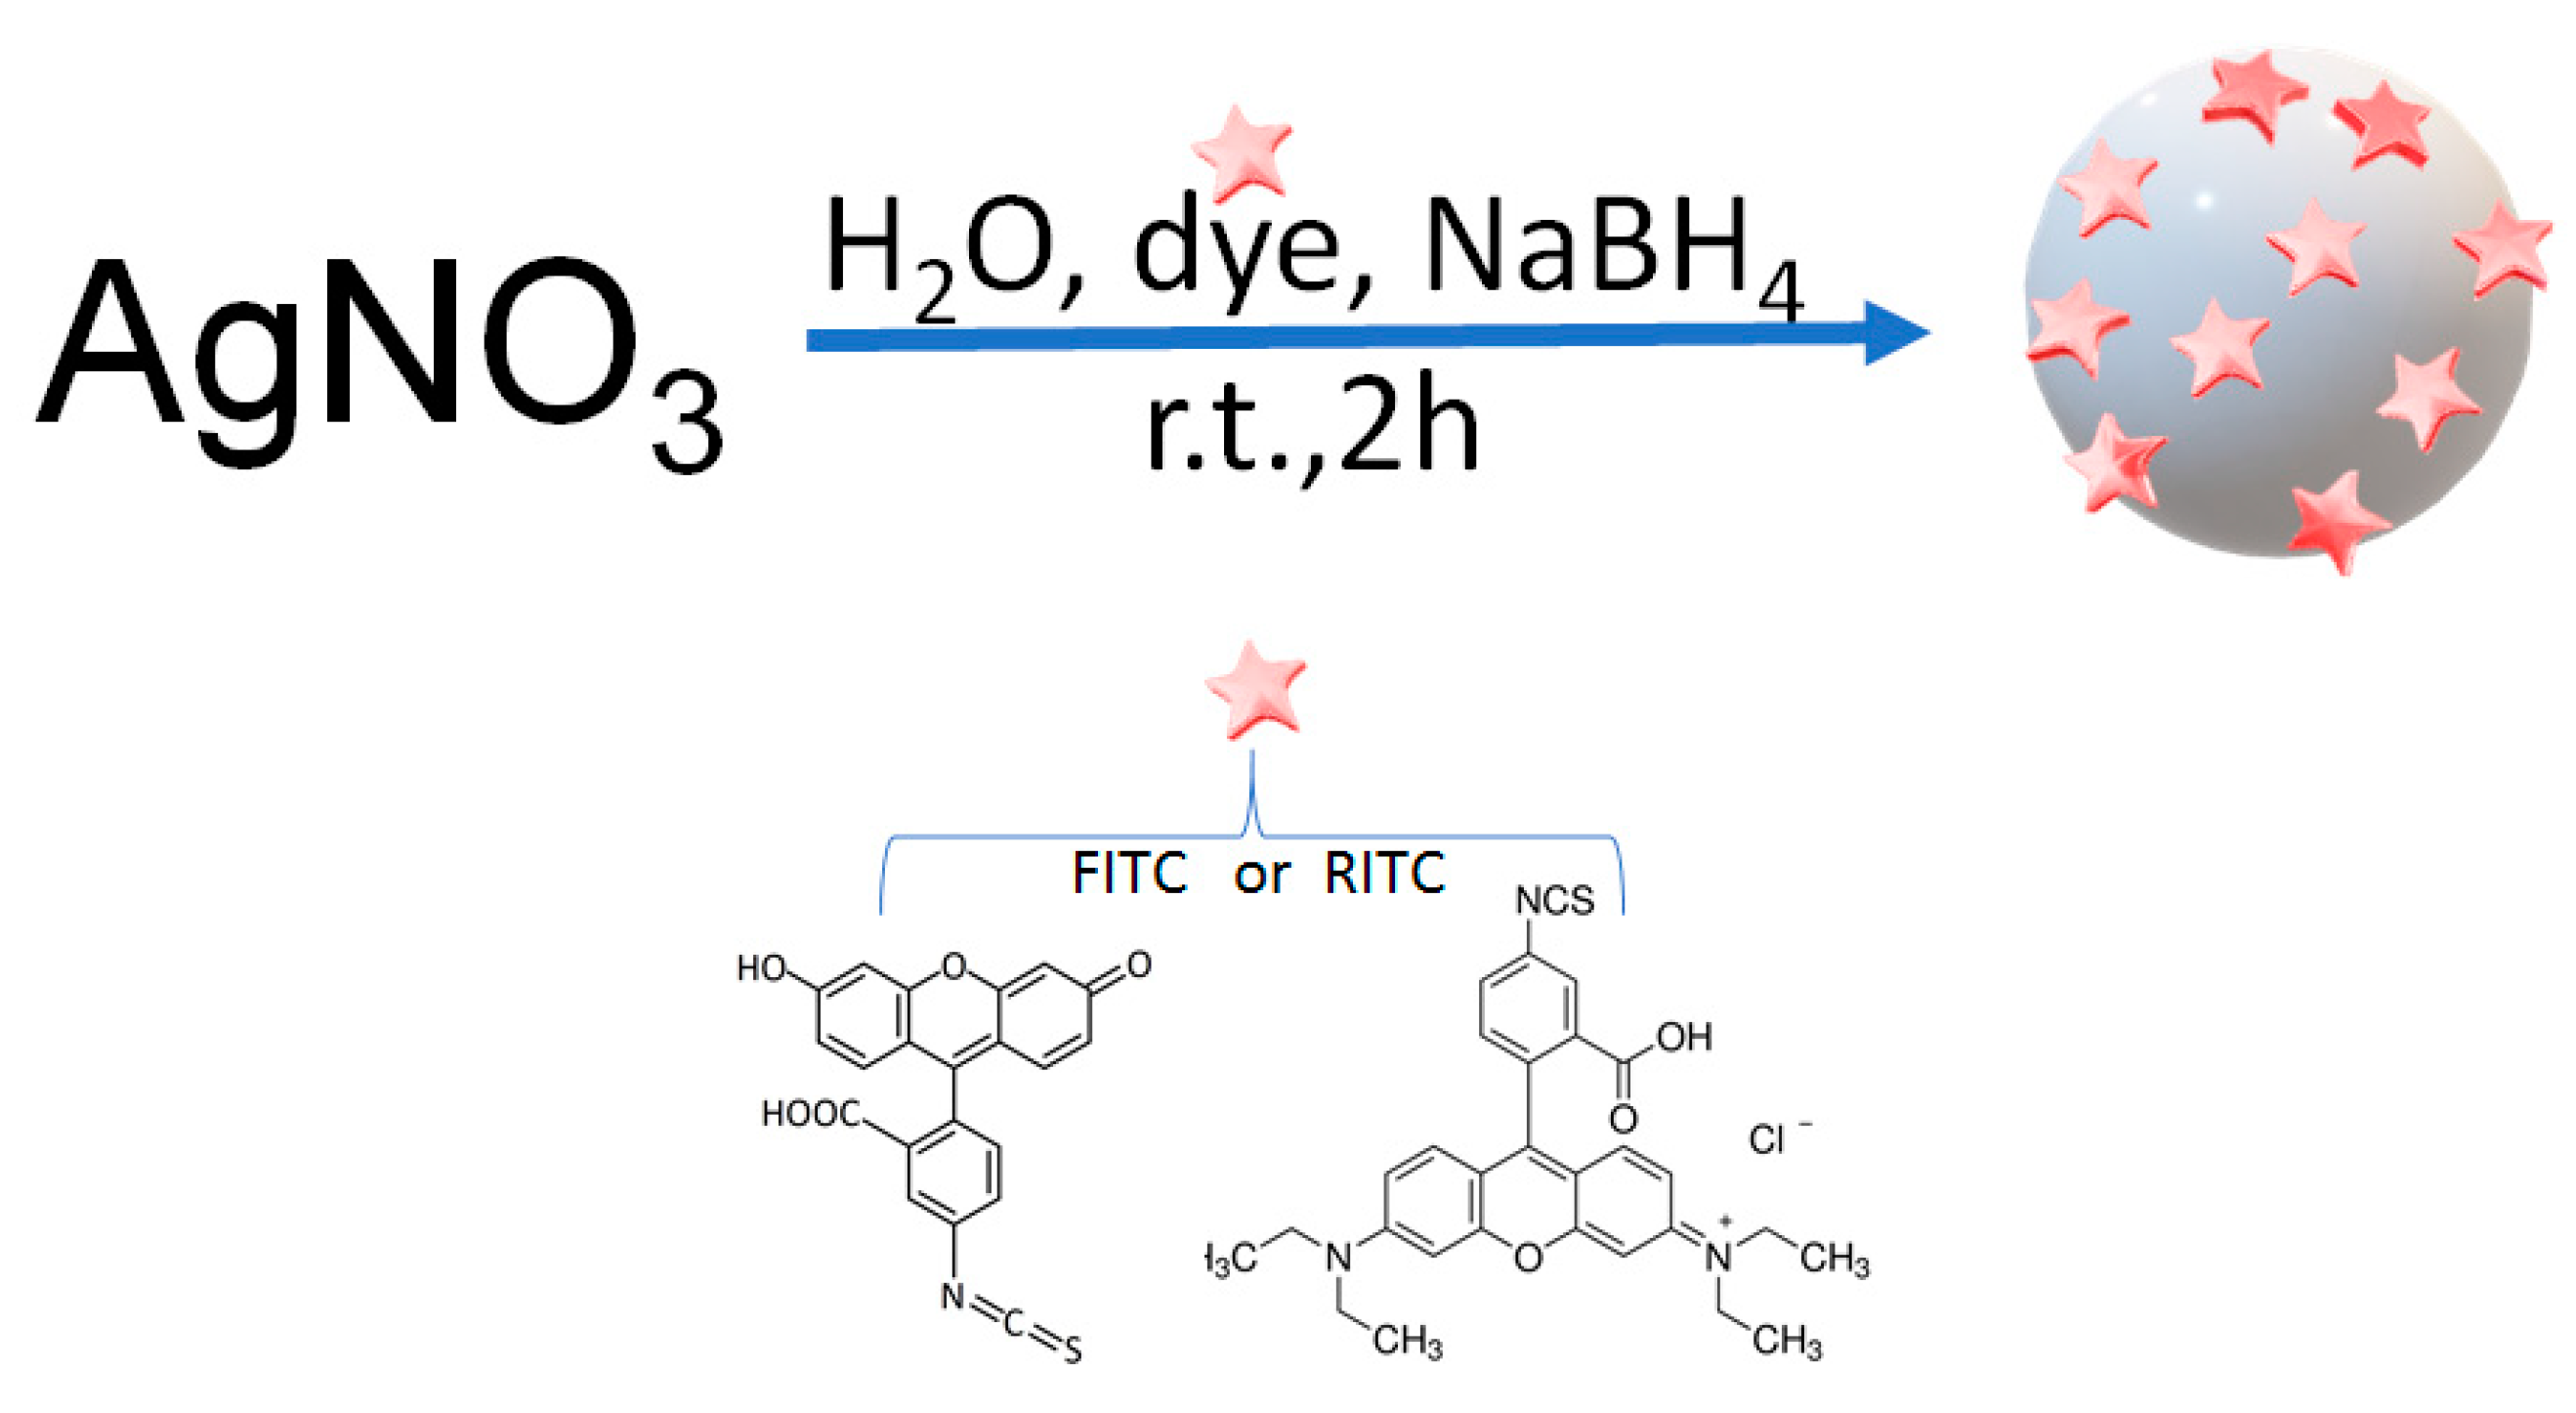
2.2. Synthesis of AgNPs–FITC and AgNPs–RITC

The synthesis procedure was similar to that reported in our previous works for RITC-functionalized AuNPs [57] and was performed using different metal precursor/dye molar ratios, (Ag/FITC = 1/2, 1/1, and 1/0.1, and Ag/RITC = 1/2, 1/1, and 1/0.1, see Supplementary Materials, Table S1a,b). For example, in a typical procedure, Ag/FITC = 1/1 (mol/mol) (AgNPs-FITC_1), a water solution of FITC (5.1 × 10⁻⁴ mol, in 10 mL of deionized water) was mixed with a water solution of the silver precursor (AgNO3, 5.1 × 10⁻⁴ mol, in 10 mL of deionized water), and the solution was bubbled under nitrogen at room temperature for 10 min. Subsequently, 0.096 g of NaBH4 (2.5 × 10⁻³ mol) dissolved in 10 mL of deionized water was added. After 2 h at room temperature, under magnetic stirring, the product was purified (by centrifugation by mini-spin centrifuge at 13,000 rpm, 20 min, 3 times). The main parameters of the characterizations for the samples are as follows:
AgNPs-FITC _1: UV–Vis (0.2 mg/mL in H2O), λmax (nm): 398, 474 nm; dynamic light scattering (DLS) in H2O, <2RH> (nm): 78 ± 12 nm; ζ-potential in H2O (mV): −17 ± 3 mV.
AgNPs-RITC_1: UV–Vis (0.2 mg/mL in H2O), λmax (nm): 414, 560 nm; DLS in H2O, <2RH> (nm): 68 ± 20 nm; ζ-potential in H2O (mV): −22 ± 3 mV.

2.3. Characterization of AgNPs–FITC NP and AgNPs–RITC

UV–Vis spectra were recorded in aqueous solution using quartz cells with a Varian Cary 100 Scan spectrophotometer. The sizes, size distributions, and Z-potential of AgNPs–RITC and AgNPs–FITC in aqueous solution were investigated using the dynamic light scattering (DLS) technique using a Zetasizer instrument (Malvern) at a temperature (T) of 25.0 ± 0.2 °C and NPs concentration of 0.02 mg/mL. Z-potential was measured by means of the laser microelectrophoresis technique in a thermostated cell (T = 25.0 ± 0.2 °C). DLS data were acquired and fitted in concordance to our previous works [58].
Synchrotron radiation (SR)-XPS measurements were carried out at the CNR beamline BACH (Beamline for Advanced DiCHroism) at the ELETTRA facility in Trieste (Italy). The BACH beam line exploits intense radiation emitted from an undulator front-end. XPS data were collected in angular mode (A21, pass energy = 50 eV), with the entrance and exit slits of the monochromator fixed at 30 and 20 μm, respectively. A photon energy of 360 eV was used for C1s and S2p spectral regions, while for the N1s, Ag3d, and O1s spectral regions, a photon energy value of 596 eV was selected to maximize signal intensity. The total binding energy resolution for C1s and S2p was 0.17 eV, while that for N1s, Ag3d, and O1s was 0.22 eV. The energy scale was calibrated using as reference the C1s aromatic signal at 284.7 eV and the Ag3d5/2 signal of AgNPs arising by the metallic silver core, always found at 367.80 eV.
Curve-fitting analysis of the C1s, S2p, N1s, O1s, and Ag3d spectra was performed using Gaussian curves as fitting functions identified using a peak-fitting procedure (fityk 1.3.1., http://fityk.nieto.pl accessed on 10 December 2020). S2p3/2,1/2 and Ag3d5/2,3/2 doublets were fitted using the same full width at half-maximum (FWHM) for each pair of components of the same core level, a spin-orbit splitting of 1.2 eV and 6.0 eV, and branching ratios of S2p3/2/S2p1/2 = 2/1 and Ag3d5/2/Ag3d3/2 = 3/2. When several different species were identified in a spectrum, the same FWHM value was used for all individual photoemission bands.
The pump-probe experiments were performed using a laser system consisting of a 1 kHz chirped pulse amplifier (800 nm, 4 mJ, 35 fs) seeded by a Ti:Sa oscillator. The pump pulse was either the second harmonic of the amplifier (400 nm) or the output of a tunable optical parametric amplifier seeded by the amplifier (560 nm). The probe was a white light supercontinuum (360–780 nm) generated in a commercial transient absorbance spectrometer (FemtoFrame II, IB Photonics) by focusing about 3 μJ of the amplifier beam into a rotating 3 mm thick CaF2 crystal. The pump pulse was loosely focused (circular spot of diameter = 700 μm) onto the sample contained in a 1 mm quartz cell, with a power density of 180 μJ/cm2. The spot diameter of the probe pulse was approximately 150 μm, and its delay time with respect to the pump pulse was scanned in time by varying the length of its optical path. The transmitted probe spectrum was collected in a monochromator and recorded on a CCD camera. The transient absorbance (TA) spectra were measured in two polarization states: the first in which the pump and probe pulses were parallel, and the second with polarizations at the magic angle. The instrument response function was measured to be approximately 50 fs. More experimental details of the setup can be found in previous publications [59].

3. Results and Discussion

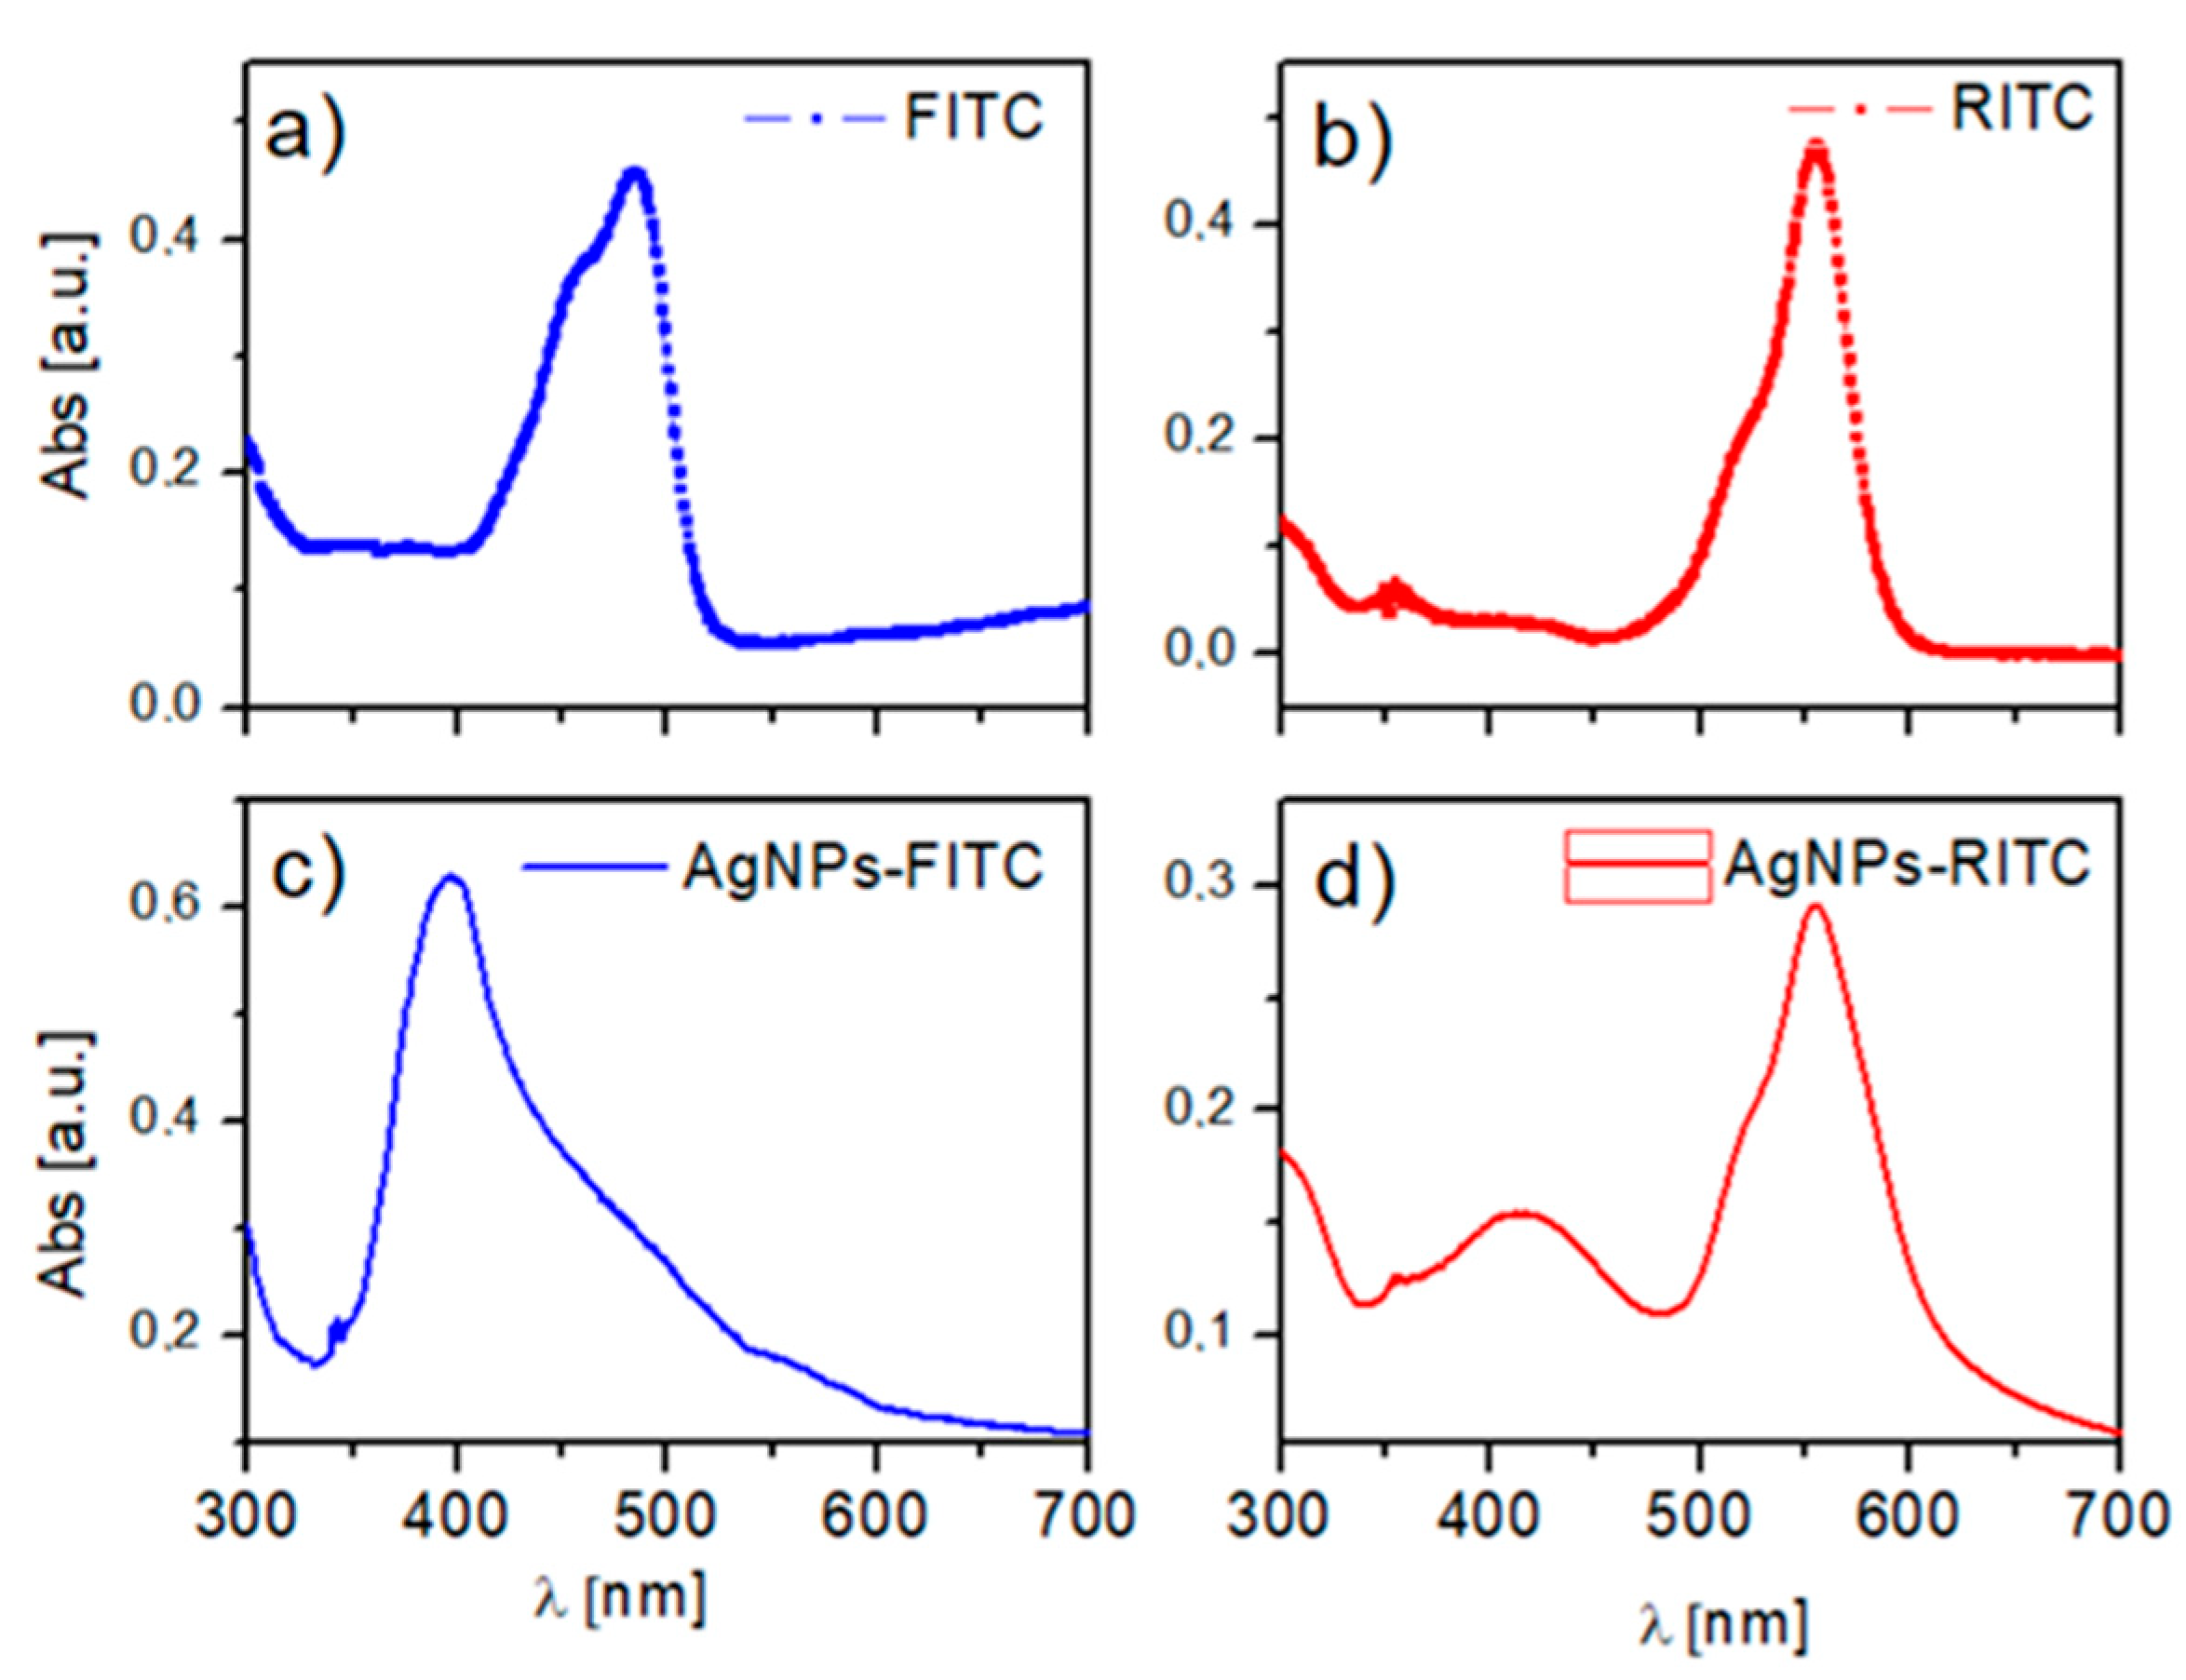
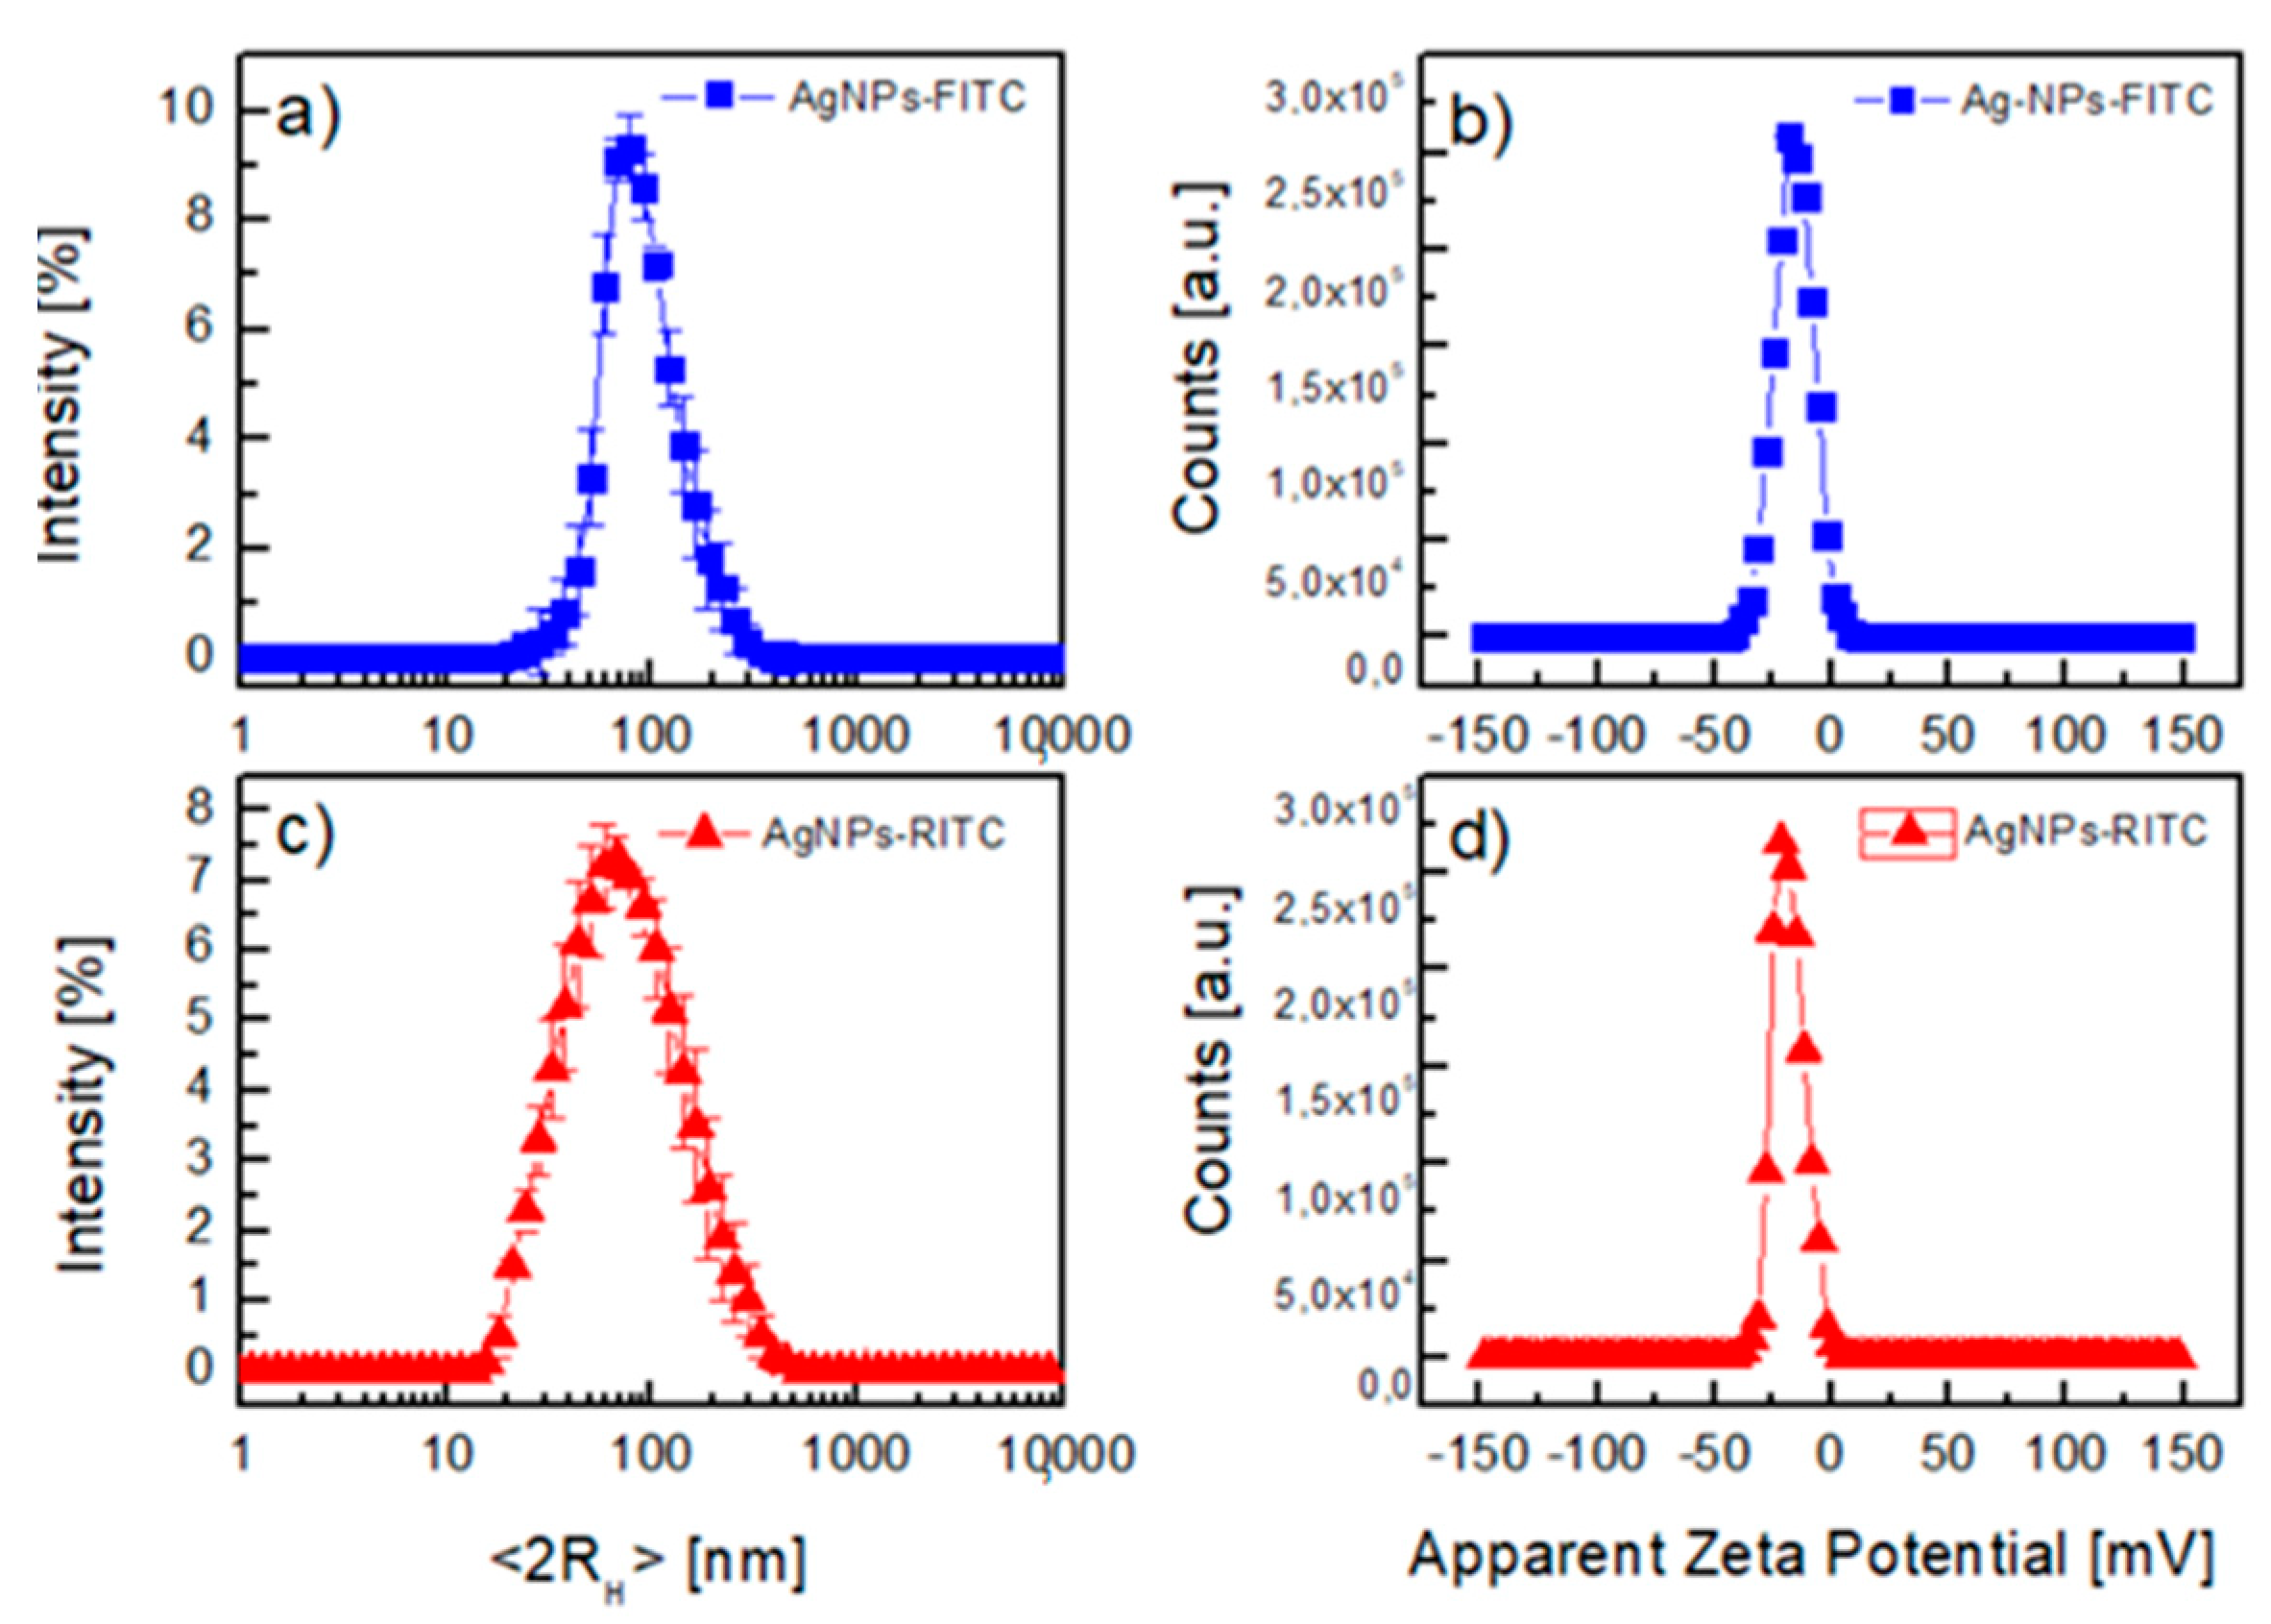
3.1. AgNPs–Dye Synthesis

In the synthesis procedure schematized in Figure 1, the choice of FITC or RITC as a capping agent makes it possible to optimize the proximity between the fluorescent xanthene-based dye and AgNPs. Three different silver/dye M ratios were initially used: 1/2, 1/1, and 1/0.1. The best result in terms of size, monodispersity, yield, and reproducibility of the samples was obtained with the 1/1 M ratio, which is the one on which the most in-depth characterizations were conducted (see Table S1a,b).
The choice of FITC and RITC is related to their widespread use in biotechnological applications, such as protein markers and sensors [60,61], and to their maximum absorption that is partially overlapped (FITC λmax = 485 nm) or not (RITC λmax = 555 nm) with respect to the localized surface plasmon resonance (LSPR). The AgNPs LSPR band occurs typically in the range of 380–480 nm, and its intensity and spectral width are controlled by the size, concentration, and monodispersity of AgNPs. In Figure 2a–d, the UV–Vis spectra of FITC, RITC, AgNPs–FITC, and AgNPs–RITC are shown. In particular, the absorption band of FITC is mostly overlapped with the LSPR at about 398 nm, producing a shoulder in the AgNPs–FITC sample with a slight shift compared with the free dye. The absorption peak of the AgNPs–RITC sample showed the presence of an LSPR due to the AgNPs at about 414 nm and a well-separated peak arising from the dye at about 560 nm.
The DLS measurements from water suspensions confirmed the nanosize of both prepared AgNPs, as can be observed in Figure 3a,c. AgNPs–FITC have <2RH> = 78 ± 12 nm and AgNPs–RITC have <2RH> = 68 ± 20 nm, with low or no aggregation as evidenced by repeating the measurements up to 3 months after synthesis. An evidence of the colloidal stability can also be obtained by looking at the zeta potential measurements, where both systems have a typical negative zeta potential, as shown in Figure 3b,d, with values indicating quite stable suspensions [57,62,63]. In this way, stable and monodispersed AgNPs were prepared [7,64,65].
It is important to underline that both AgNPs–FITC and AgNPs–RITC are hydrophilic systems; on the particles, other molecules can be conjugated on the surface. As such, these investigations open vast opportunities by creating a new generation of fluorescent markers with immense promise and potential in biological analysis and detection.

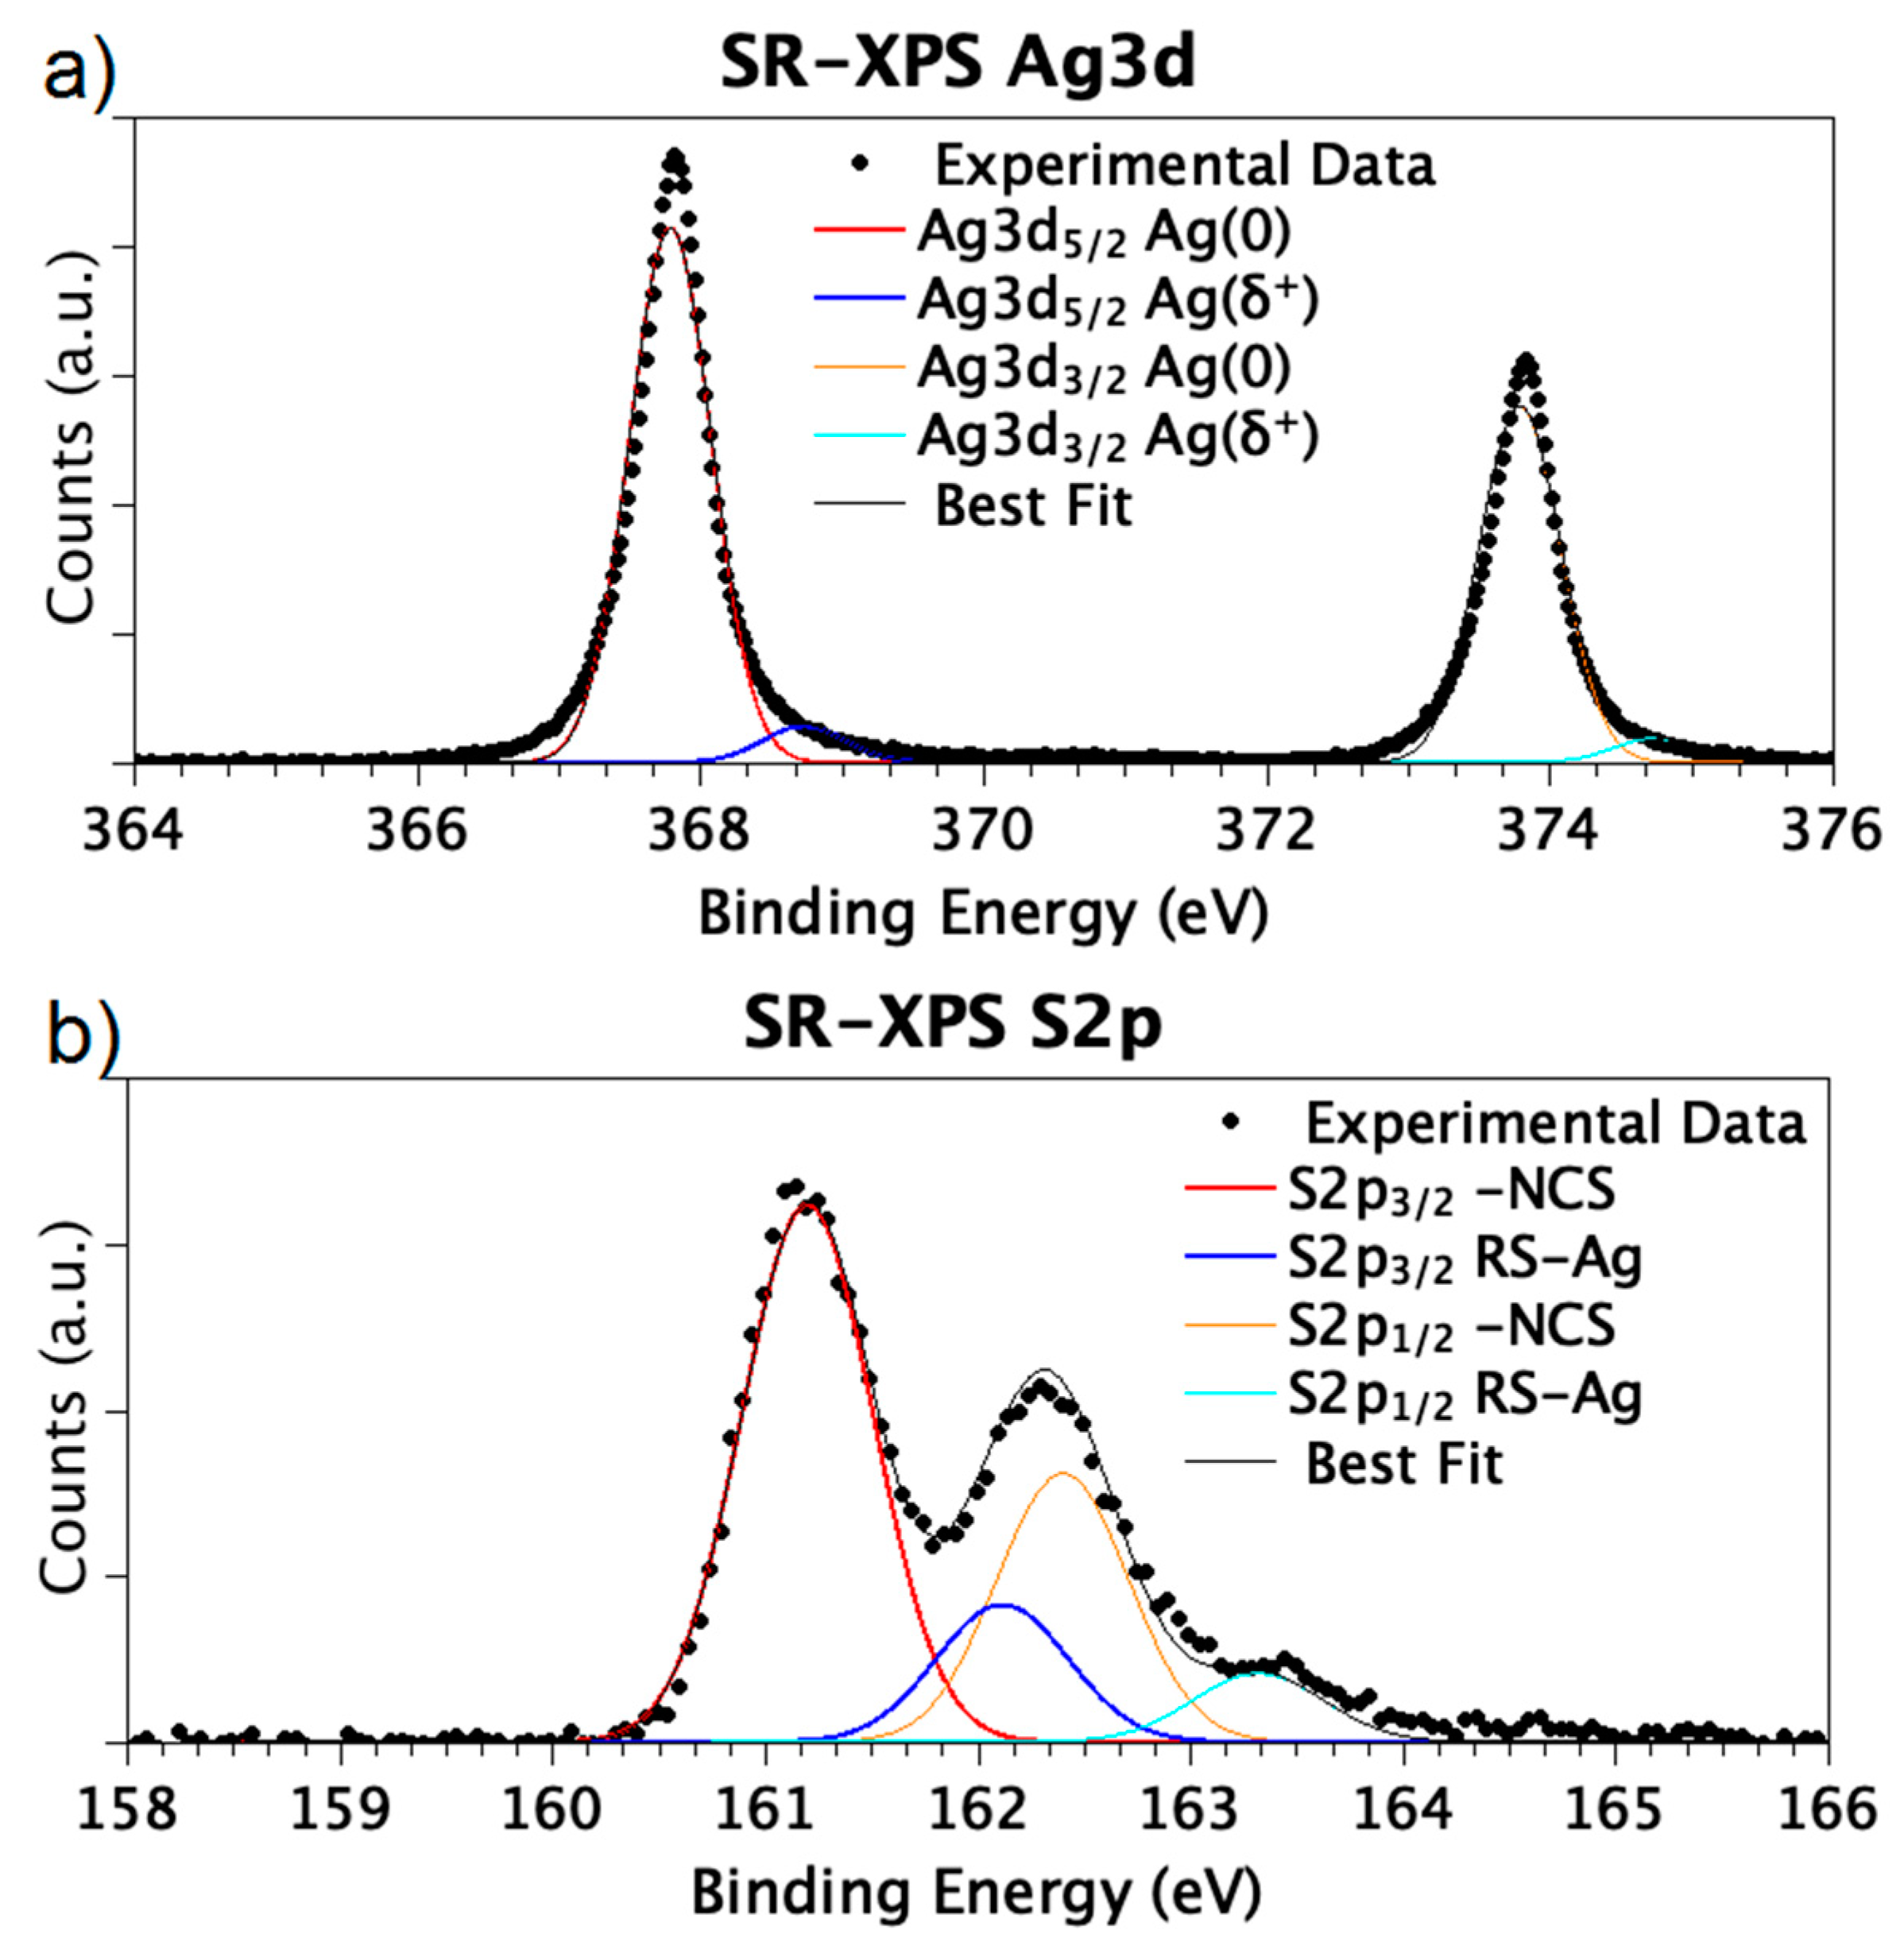
3.2. HR-XPS of AgNPs Dye

To investigate the chemical structure of AgNPs–FITC and AgNPs–RITC, SR-XPS studies were carried out. SR-XPS measurements were performed on samples with a 1/1 metal/dye molar ratio to obtain better insight into the dyes’ molecular structure stability and to probe the macromolecule–NP interaction at the dye/metal interface. Measurements were carried out at C1s, S2p, N1s, O1s, and Ag3d core levels; all data analysis results (binding energy (BE), full width half-maximum (FWHM), atomic ratio values, and proposed assignments) are collected in Table S2 in the Supplementary Materials. The measured C 1s core level spectra confirmed the stability of the dyes’ molecular structure, showing all the expected spectral components (see Figure 4a) in atomic ratios compatible with the theoretical values calculated by the molecular structure, as reported in the following Table 1.
N1s data also confirmed the chemical stability of both dyes; as expected, the N1s spectrum of AgNPs-FITC (Figure 4b, top) has a single component at 398.40 eV BE, as expected for N atoms in –N=C=S moieties; the N1s signal measured on AgNPs–FITC samples is asymmetric, with a main component ascribed to –NCS, tertiary amines at 398.48 eV, and a small feature of lower intensity at higher BE values (400.48 eV), as expected for positively charged N atoms.
Focusing on the dye/AgNPs interaction, Ag3d and S2p signals allowed a probing of the electronic structure at the organic molecule/metallic cluster interface. The S2p and Ag3d spectra of AgNPs-FITC are, respectively, shown in Figure 5a,b, and are representative also for the RITC-containing sample.
Both spectra appear structured, and by following a peak-fitting procedure, two pairs of spin-orbit components can be individuated for the two signals. The first feature in the Ag3d spectrum (Ag3d5/2 BE = 367.84 eV) is associated with metallic silver and arises by the Ag atoms at the nanoparticles’ core. The spin-orbit pair of very low intensity at higher BE values (Ag3d5/2 BE = 368.79 eV) is indicative for positively charged metal atoms, as expected for surface atoms interacting with the organic macromolecule [67]. The S2p spectra provide complementary information about the envisaged chemical interaction between the NCS functional groups of both dyes and the surface atoms of the silver clusters, as extensively discussed previously [57] for gold nanoparticles functionalized with RITC. As shown in Figure 5b, S2p spectrum shows two pair of spin-orbit components: the first pair (S2p3/2 = 161.50 eV BE) is indicative for sulfur atoms covalently bonded to carbon in isothiocyanate moieties [68,69]; the second signal, at higher BE values (S2p3/2 BE = 162.42 eV), is attributed to S atoms chemically interacting with metals at nanoclusters’ surface [58].

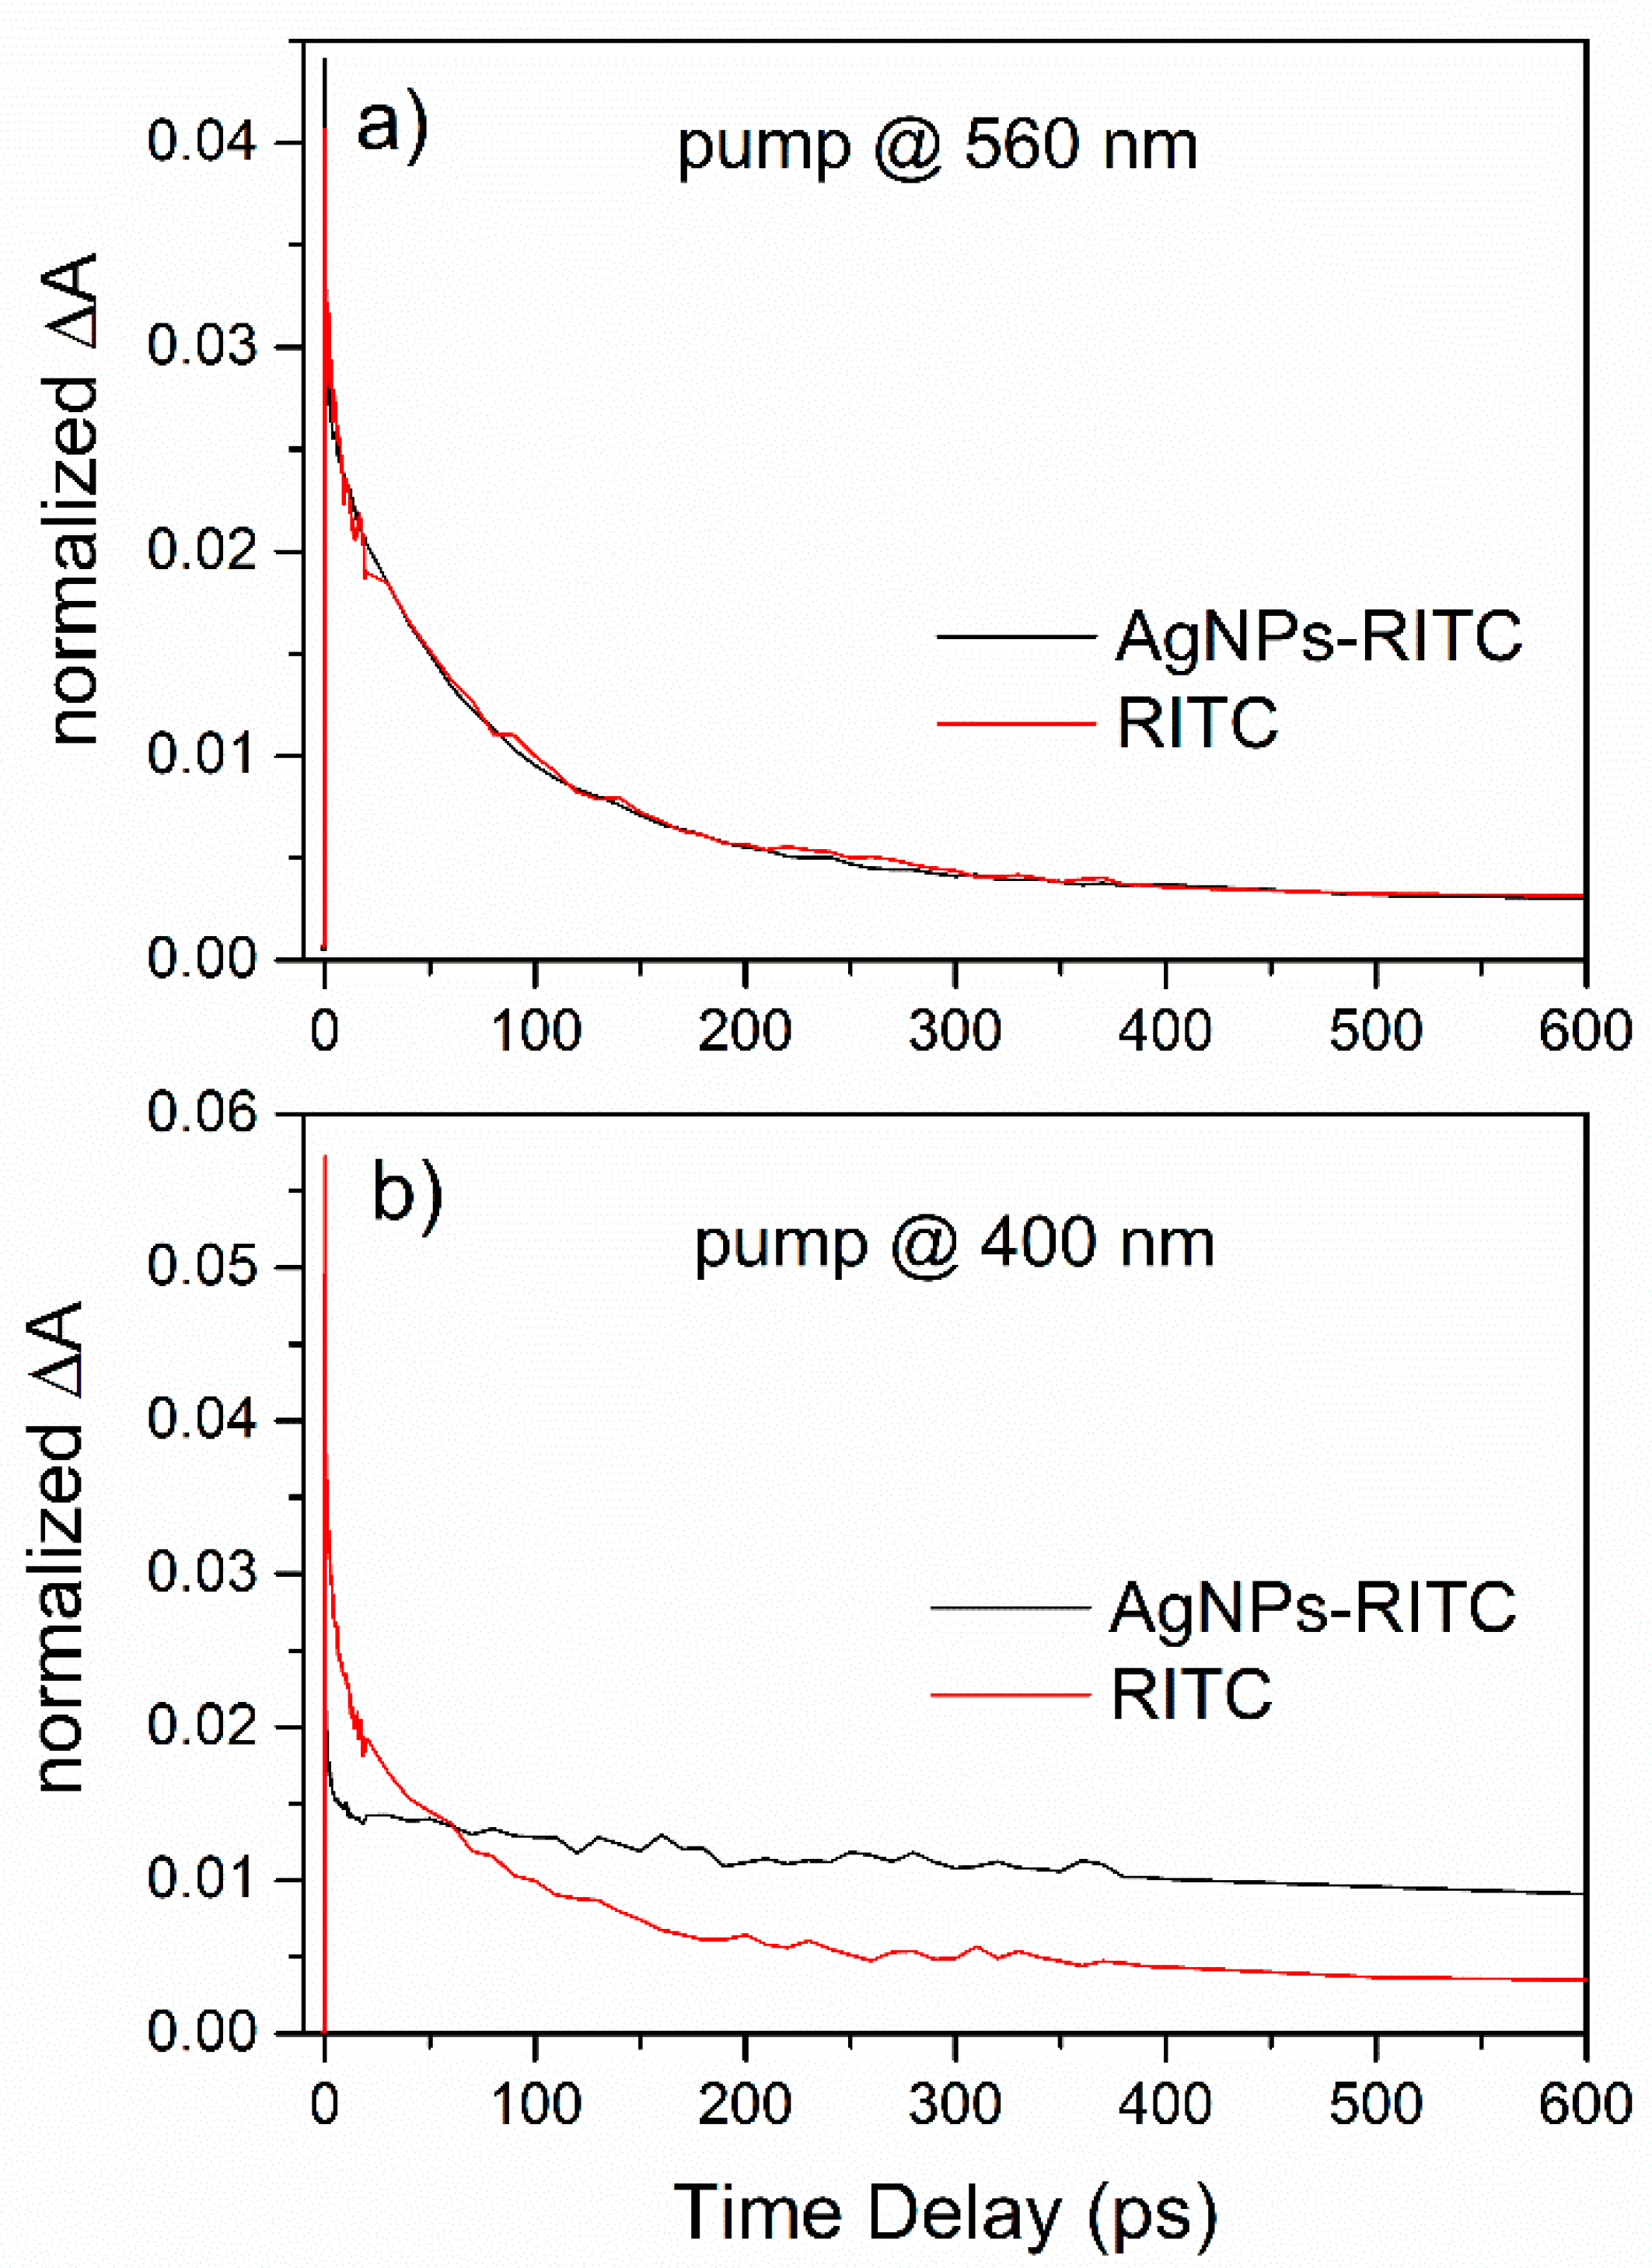
3.3. Pump-Probe Experiments

The TA spectrum of the RITC solution in water (10−4 mol/L) excited at 560 nm exhibited a strong negative feature centered at 560 nm related to the fluorescence/stimulated emission of the photoexcited state, which leads to decreased apparent absorbance of the probe (negative differential optical density, ΔOD) [57]. The lifetime of this transient fluorescence band can be characterized by a double exponential decay. This double exponential decay is assigned to the presence of both dimers and monomers of the dye. It is well-known that the lifetime of the fluorescence of the monomer is on the scale of a few nanoseconds (e.g., 1.6 ns for the case of rhodamine B [70]), whereas the interaction between molecules in the dimer (and larger aggregates) leads to strong quenching and a resulting reduction in the lifetime of the fluorescence (100 ps for the dimer [70]). Increasing concentrations of dimers, trimers, and larger aggregates result in a shortening of the fluorescence lifetime.
The same experiment was performed on the AgNPs–RITC sample in which the synthesis used a silver/dye = 1/1 M ratio. The dynamics of the fluorescence band are almost identical for the two systems: RITC alone and AgNPs–RITC (Figure 6a). The data in Figure 6 are normalized to the areas under the curves for easy comparison, which is why the signals are positive. Furthermore, in this case, we took a temporal cut at 590 nm and not at 560 nm at the maximum of the fluorescence because the strongly scattered light of the pump pulse distorts the signal at this wavelength. The identical dynamics of the two samples suggest that they have similar equilibria between dimer/trimers and the monomers. No features due to the LSPR of the NPs were observed in these spectra because the excitation wavelength does not excite this resonance of the NPs.
A comparison of the dynamics of the two samples when pumped at 400 nm revealed a significant difference in the dynamics of the transmitted probe light observed at 560 nm (Figure 6b). In particular, in the AgNPs–RITC case, we observed a strong reduction in the contribution of the short timescale constant (<100 ps) assigned to the typical dynamics of the dimers and higher aggregates to the signal. Exciting at 400 nm, which corresponds with the LSPR of the AgNPs, induces a strong concentration of the light on the surface of the NPs (this is the well-known effect responsible for surface-enhanced Raman spectroscopy [71]). In this way, molecules close to the surface of the AgNPs are preferentially excited (i.e., those chemically attached). It can be suggested that these dye molecules lack the short decay time as they are not quenched by the chromophore–chromophore interactions, which take place in the aggregates. Confirmation that we preferentially probed molecules on the surface of the AgNPs in this case can be found in the results of the polarization dependence of the latter signal for AgNPs–RITC. When probing freely rotating dye molecules in solution, relatively large differences of the dynamics at short times (t < 50 ps) with polarization of the probe light parallel to the pump were observed in comparison with the case in which the polarization of the probe light was at the magic angle [72]. This is due to the randomly rotating molecules changing their orientation with respect to the probe, which is only visible when the polarization is not at the magic angle. This is the basis of the common technique called time-resolved fluorescence anisotropy spectroscopy [72]. In the case of the AgNPs–RITC, these differences are minimal (Figure S1 in the Supplementary Materials), suggesting that the observed molecules are rotationally hindered with respect to the probe polarization which, of course, is exactly the case of dye molecules attached to the surface of the relatively massive AgNPs. These results are interesting because they show that by exciting at a wavelength corresponding to the LSPR, it is possible to preferentially probe the dye molecules on the surface of the NPs. This method works here as there is no spectral overlap between the LSPR of the NPs and the fluorescence of the dye [73]. In such cases, it is known that a strong quenching of the dye fluorescence occurs via resonant energy transfer to the quickly decaying plasmon resonance [73].

4. Conclusions

The synthesis of silver nanoparticles in the presence of dyes, such as RITC and FITC, made it possible to obtain systems with plasmonic and fluorescence properties. In particular, AgNPs–RITC and AgNPs–FITC systems were synthesized and characterized by UV–Vis spectroscopy and DLS and ζ-potential measurements, confirming the nanoscale and stability of these systems. Furthermore, we used SR-XPS spectroscopy to study the isothiocyanate–metal interaction, which leads to the surface functionalization of the nanoparticles, from a structural point of view. The transient dynamics of the fluorescence of the dye for AgNPs–RITC were also investigated, showing that by exciting the sample at a wavelength corresponding to the plasmon resonance of nanoparticles, one can preferentially excite the RITC dye molecules attached to the surface of the NPs. AgNPs–RITCs and AgNPs–FITCs therefore exhibit remarkable optical properties that make them suitable for biosensing and imaging applications. In particular, AgNPs–RITC is a promising material because it shows the possibility of preferentially probing the dye molecules on the surface of the NPs by exciting at a wavelength corresponding to the LSPR. This makes the material promising for biotechnological applications where silver nanoparticles can be easily followed by exploiting fluorescence.

Supplementary Materials

The following are available online at https://www.mdpi.com/2076-3417/11/6/2472/s1, Table S1a,b):Main characterizations of AgNPs–FITC and AgNPs–RITC synthesized using different Ag precursor/dye M/M ratios; Table S2. Measurements were carried out at C1s, S2p, N1s, O1s, and Ag3d core levels; all data analysis results (binding energy (BE), full width half-maximum (FWHM), atomic ratio values, and proposed assignments); Figure S1. Dynamics of the fluorescence of the RITC dye molecules in the AgNPs–RITC sample when excited at 400 nm (on the LSPR of the AgNPs). The lack of difference between the parallel (blue line) and magic angle (red line) polarizations of the pump probe signals is indicative of hindered rotation of the dye molecule.

Author Contributions

I.F. and I.V. designed and performed the chemical experimental synthesis. I.F., S.C., A.C., and I.V. performed the UV–Vis and DLS measurements and evaluations. C.B. and G.I. performed the XPS measurements and the data analysis. S.N. provided technical support with SR-XPS measurements. D.C., P.O., and A.P. performed the UV–Vis and pump-probe measurements and the data analysis. All authors contributed to the paper writing and revision. All authors have read and agreed to the published version of the manuscript.

Funding

This research received no external funding.

Institutional Review Board Statement

Not applicable.

Informed Consent Statement

Not applicable.

Data Availability Statement

All supporting data is in the Supporting Materials file.

Acknowledgments

The Grant of Excellence Departments, MIUR (ARTICOLO 1, COMMI 314–337 LEGGE 232/2016), is gratefully acknowledged by authors of Roma Tre University. The authors of the Science Department of the University of Roma Tre and of the CNR recognize the support of the Framework Agreement signed between the CNR and the University of Roma Tre, on 24 September 2019.

Conflicts of Interest

The authors declare no conflict of interest.

References

  1. Deng, W.; Goldysa, E.M. Chemical sensing with nanoparticles as optical reporters: From noble metal nanoparticles to quantum dots and upconverting nanoparticles. Analyst 2014, 139, 5321–5334. [Google Scholar] [CrossRef]
  2. Ma, X.; He, S.; Qiu, B.; Luo, F.; Guo, L.; Lin, Z. Noble Metal Nanoparticle-Based Multicolor Immunoassays: An Approach toward Visual Quantification of the Analytes with the Naked Eye. ACS Sens. 2019, 4, 782–791. [Google Scholar] [CrossRef]
  3. Prosposito, P.; Buratti, L.; Bellingeri, A.; Protano, G.; Faleri, C.; Corsi, I.; Battocchio, C.; Iucci, G.; Tortora, L.; Secchi, V.; et al. Biofunctionalized silver nanoparticles as Hg2+ plasmonic sensor in water: Synthesis characterizations and ecosafety. Nanomaterials 2019, 9, 1353. [Google Scholar] [CrossRef] [Green Version]
  4. Lu, Y.; Na, L. Noble Metal Nanoparticles-Based Colorimetric Biosensor for Visual Quantification: A Mini Review. Chemosensors 2019, 7, 53. [Google Scholar]
  5. Pilla, V.; Gonçalves, A.C.; Dos Santos, A.A.; Lodeiro, C. Lifetime and Fluorescence Quantum Yield of Two Fluorescein-Amino Acid-Based Compounds in Different Organic Solvents and Gold Colloidal Suspensions. Chemosensors 2018, 6, 26. [Google Scholar] [CrossRef] [Green Version]
  6. Cyprych, K.; Chateau, D.; Désert, A.; Parola, S.; Mysliwiec, J. Plasmonic Nanoparticles Driven Enhanced Light Amplification in a Local 2D and 3D Self-Assembly. Nanomaterials 2018, 8, 1051. [Google Scholar] [CrossRef] [Green Version]
  7. De Angelis, R.; Venditti, I.; Fratoddi, I.; De Matteis, F.; Prosposito, P.; Cacciotti, I.; D’Amico, L.; Nanni, F.; Yadav, A.; Casalboni, M.; et al. From nanospheres to microribbons: Self-assembled Eosin Y doped PMMA nanoparticles as photonic crystals. J. Colloid Interf. Sci. 2014, 414, 24–32. [Google Scholar] [CrossRef] [PubMed]
  8. Wang, Q.; Butburee, T.; Wu, X.; Chen, H.; Liu, G.; Wang, L. Enhanced performance of dye-sensitized solar cells by doping Au nanoparticles into photoanodes: A size effect study. J. Mater. Chem. A 2013, 1, 13524–13531. [Google Scholar] [CrossRef]
  9. Naponiello, G.; Venditti, I.; Zardetto, V.; Saccone, D.; Di Carlo, A.; Fratoddi, I.; Barolo, C.; Dini, D. Photoelectrochemical characterization of squaraine-sensitized nickel oxide cathodes deposited via screen-printing for p-type dye-sensitized solar cells. Appl. Surf. Sci. 2015, 356, 911–920. [Google Scholar] [CrossRef]
  10. Lou, Y.; Yuan, S.; Zhao, Y.; Hu, P.; Wang, Z.; Zhang, M.; Shi, L.; Lic, D. Molecular-scale interface engineering of metal nanoparticles for plasmon-enhanced dye sensitized solar cells. Dalton Trans. 2013, 42, 5330–5337. [Google Scholar] [CrossRef]
  11. Lee, C.-P.; Li, C.-T.; Ho, K.-C. Use of organic materials in dye-sensitized solar cells. Mater. Today 2017, 20, 267–283. [Google Scholar] [CrossRef]
  12. Zhang, H.; Tang, Q.; Li, Q.; Song, Q.; Wu, H.; Mao, N. Enhanced Photocatalytic Properties of PET Filaments Coated with Ag-N Co-Doped TiO2 Nanoparticles Sensitized with Disperse Blue Dyes. Nanomaterials 2020, 10, 987. [Google Scholar] [CrossRef]
  13. Johnson, R.L.; Perras, F.A.; Kobayashi, T.; Schwartz, T.J.; Dumesic, J.A.; Shanksa, B.H.; Pruski, M. Identifying low-coverage surface species on supported noble metal nanoparticle catalysts by DNP-NMR. Chem. Commun. 2016, 52, 1859–1862. [Google Scholar] [CrossRef] [Green Version]
  14. Carabineiro, S.A.C. Gold Nanoparticles for Catalytic Applications. Appl. Sci. 2019, 9, 2890. [Google Scholar] [CrossRef] [Green Version]
  15. Kunkel, B.; Seeburg, D.; Peppel, T.; Stier, M.; Wohlrab, S. Combination of Chemo- and Biocatalysis: Conversion of Biomethane to Methanol and Formic Acid. Appl. Sci. 2019, 9, 2798. [Google Scholar] [CrossRef] [Green Version]
  16. Quek, C.-H.; Leong, K.W. Near-Infrared Fluorescent Nanoprobes for in Vivo Optical Imaging. Nanomaterials 2012, 2, 92–112. [Google Scholar] [CrossRef] [Green Version]
  17. Venditti, I.; Cartoni, A.; Fontana, L.; Testa, G.; Scaramuzzo, F.A.; Faccini, R.; Mancini Terracciano, C.; Solfaroli Camillocci, E.; Morganti, S.; Giordano, A.; et al. Y3+ embebbed in polymeric nanoparticles: Morphology, dimension and stability of composite colloidal system. Colloid Surf. A 2017, 532, 125–131. [Google Scholar] [CrossRef]
  18. Zannella, C.; Shinde, S.; Vitiello, M.; Falanga, A.; Galdiero, E.; Fahmi, A.; Santella, B.; Nucci, L.; Gasparro, R.; Galdiero, M.; et al. Antibacterial Activity of Indolicidin-Coated Silver Nanoparticles in Oral Disease. Appl. Sci. 2020, 10, 1837. [Google Scholar] [CrossRef] [Green Version]
  19. Venditti, I. Morphologies and functionalities of polymeric nanocarriers as chemical tools for drug delivery: A review. J. King Saud Univ. Sci. 2019, 31, 398–411. [Google Scholar] [CrossRef]
  20. Shehata, N.; Samir, E.; Kandas, I. Gold/QDs-Embedded-Ceria Nanoparticles: Optical Fluorescence Enhancement as a Quenching Sensor. Appl. Sci. 2020, 10, 1236. [Google Scholar] [CrossRef] [Green Version]
  21. Fratoddi, I.; Matassa, R.; Fontana, L.; Venditti, I.; Familiari, G.; Battocchio, C.; Magnano, E.; Nappini, S.; Leahu, G.; Belardini, A.; et al. Electronic Properties of a Functionalized Noble Metal Nanoparticles Covalent Network. J. Phys. Chem. C 2017, 121, 18110–18119. [Google Scholar] [CrossRef]
  22. Roto, R.; Mellisani, B.; Kuncaka, A.; Mudasir, M.; Suratman, A. Colorimetric Sensing of Pb2+ Ion by Using Ag Nanoparticles in the Presence of Dithizone. Chemosensors 2019, 7, 28. [Google Scholar] [CrossRef] [Green Version]
  23. Saha, J.; Suklabaidya, S.; Nath, J.; Roy, A.D.; Dey, B.; Dey, D.; Bhattacharjee, D.; Hussain, S.A. Fluorescence- and FRET-based mercury (II) sensor. Int. J. Environ. Anal. Chem. 2020, 100, 789–807. [Google Scholar] [CrossRef] [Green Version]
  24. Prosposito, P.; Burratti, L.; Venditti, I. Silver nanoparticles as colorimetric sensors for water pollutants. Chemosensors 2020, 8, 26. [Google Scholar] [CrossRef] [Green Version]
  25. Huang, Y.; Ma, L.; Hou, M.; Li, J.; Xie, Z.; Zhang, Z. Hybridized plasmon modes and near-field enhancement of metallic nanoparticle-dimer on a mirror. Sci. Rep. 2016, 6, 30011. [Google Scholar] [CrossRef] [PubMed] [Green Version]
  26. Venditti, I. Engineered gold-based nanomaterials: Morphologies and functionalities in biomedical applications. A mini review. Bioengineering 2019, 6, 53. [Google Scholar] [CrossRef] [Green Version]
  27. He, Z.; Li, F.; Liu, Y.; Yao, F.; Xu, L.; Han, X.; Wang, K. Principle and Applications of the Coupling of Surface Plasmons and Excitons. Appl. Sci. 2020, 10, 1774. [Google Scholar] [CrossRef] [Green Version]
  28. Maccora, D.; Dini, V.; Battocchio, C.; Fratoddi, I.; Cartoni, A.; Rotili, D.; Castagnola, M.; Faccini, R.; Bruno, I.; Scotognella, T.; et al. Gold nanoparticles and nanorods in nuclear medicine: A mini review. Appl. Sci. 2019, 9, 3232. [Google Scholar] [CrossRef] [Green Version]
  29. Suslov, A.; Lama, P.T.; Dorsinville, R. Fluorescence enhancement of Rhodamine B by monodispersed silver nanoparticles. Opt. Commun. 2015, 345, 116–119. [Google Scholar] [CrossRef]
  30. Francisco, A.P.; Botequim, D.; Prazeres, D.M.F.; Serra, V.V.; Costa, S.M.B.; Laia, C.A.T.; Paulo, P.M.R. Extreme Enhancement of Single-Molecule Fluorescence from Porphyrins Induced by Gold Nanodimer Antennas. J. Phys. Chem. Lett. 2019, 10, 1542–1549. [Google Scholar] [CrossRef]
  31. Sarkar, A.; Thankappan, A.; Nampoori, V.P.N. Effect of silver nanoparticles on fluorescence and nonlinear properties of naturally occurring betacyanin dye. Opt. Mater. 2015, 39, 211–217. [Google Scholar] [CrossRef]
  32. Khatua, S.; Paulo, P.M.R.; Yuan, H.; Gupt, A.; Zijlstra, P.; Orrit, M. Resonant Plasmonic Enhancement of Single-Molecule Fluorescence by Individual Gold Nanorods. ACS Nano 2014, 8, 4440–4449. [Google Scholar] [CrossRef] [Green Version]
  33. Zhang, D.-F.; Li, S.; Xu, Q.-H.; Cao, Y. Aggregation-Induced Plasmon Coupling-Enhanced One- and TwoPhoton Excitation Fluorescence by Silver Nanoparticles. Langmuir 2020, 36, 4721–4727. [Google Scholar] [CrossRef] [PubMed]
  34. Xue, S.; Liu, X.; Chen, S.-L.; Gan, W.; Yuan, Q. Surface curvature-dependent adsorption and aggregation of fluorescein isothiocyanate on gold nanoparticles. Phys. Chem. Chem. Phys. 2019, 21, 26598–26605. [Google Scholar] [CrossRef] [PubMed]
  35. Yang, M.; Moroz, P.; Jin, Z.; Budkina, D.S.; Sundrani, N.; Porotnikov, D.; Cassidy, J.; Sugiyama, Y.; Tarnovsky, A.N.; Mattoussi, H.; et al. Delayed Photoluminescence in Metal-Conjugated Fluorophores. J. Am. Chem. Soc. 2019, 141, 11286–11297. [Google Scholar] [CrossRef] [PubMed]
  36. Zhao, J.; Jensen, L.; Sung, J.; Zou, S.; Schatz, G.C.; Van Duyne, R.P. Interaction of Plasmon and Molecular Resonances for Rhodamine 6G Adsorbed on Silver Nanoparticles. J. Am. Chem. Soc. 2007, 129, 7647–7656. [Google Scholar] [CrossRef]
  37. Zhao, T.; Lia, T.; Liu, Y. Silver nanoparticle plasmonic enhanced förster resonance energy transfer (FRET) imaging of protein-specific sialylation on the cell surface. Nanoscale 2017, 9, 9841–9847. [Google Scholar] [CrossRef] [Green Version]
  38. Koppala, V.V.; Patil, P.G.; Melavank, R.M.; Kusanur, R.A.; Afi, U.O.; Patil, N.R. Exploring the influence of silver nanoparticles on the mechanism of fluorescence quenching of coumarin dye using FRET. J. Mol. Liq. 2019, 292, 111419. [Google Scholar] [CrossRef]
  39. Banerjee, S.; Preeyanka, N.; Dey, H.; Seth, S.; Rahaman, A.; Sarkar, M. Highly Efficient Energy Transfer from Fluorescent Gold Nanoclusters to Organic J-Aggregates. J. Phys. Chem. C 2020, 124, 5009–5020. [Google Scholar] [CrossRef]
  40. Park, S.; Kim, H.; Lim, S.C.; Lim, K.; Lee, E.S.; Oh, K.T.; Choi, H.-G.; Youn, Y.S. Gold nanocluster-loaded hybrid albumin nanoparticles with fluorescence-based optical visualization and photothermal conversion for tumor detection/ablation. J. Control. Release 2019, 304, 7–18. [Google Scholar] [CrossRef]
  41. Dong, W.; Wang, R.; Gong, X.; Liang, W.; Dong, C. A far-red FRET fluorescent probe for ratiometric detection of L-cysteine based on carbon dots and N-acetylL-cysteine-capped gold nanoparticles. Spectrochim. Acta Part A Mol. Biomol. Spectrosc. 2019, 213, 90–96. [Google Scholar] [CrossRef] [PubMed]
  42. Dubertret, B.; Calame, M.; Libchaber, A.J. Single-mismatch detection using gold-quenched fluorescent oligonucleotides. Nat. Biotechnol. 2001, 19, 365–370. [Google Scholar]
  43. Ma, H.; Li, Z.; Xue, N.; Cheng, Z.; Miao, X. A gold nanoparticle based fluorescent probe for simultaneous recognition of single-stranded DNA and double-stranded DNA. Microchim. Acta 2018, 185, 93. [Google Scholar] [CrossRef]
  44. Siddique, S.; Chow, J.C.L. Application of Nanomaterials in Biomedical Imaging and Cancer Therapy. Nanomaterials 2020, 10, 1700. [Google Scholar] [CrossRef]
  45. Kravets, V.; Almemar, Z.; Jiang, K.; Culhane, K.; Machado, R.; Hagen, G.; Kotko, A.; Dmytruk, I.; Spendier, K.; Pinchuk, A. Imaging of Biological Cells Using Luminescent Silver Nanoparticles. Nanoscale Res. Lett. 2016, 11, 30. [Google Scholar] [CrossRef] [Green Version]
  46. Fernandes, D.A.; Fernandes, D.D.; Li, Y.; Wang, Y.; Zhang, Z.; Rousseau, D.R.; Gradinaru, C.C.; Kolios, M.C. Synthesis of stable multifunctional perfluorocarbon nanoemulsions for cancer therapy and imaging. Langmuir 2016, 32, 10870–10880. [Google Scholar] [CrossRef] [PubMed]
  47. Fernandes, D.A.; Kolios, M.C. Perfluorocarbon bubbles as photoacoustic signal amplifiers for cancer theranostics. Opt. Mater. Express 2019, 9, 4532–4544. [Google Scholar] [CrossRef]
  48. Yan, N.; Tang, B.Z.; Wang, W.-X. In Vivo Bioimaging of Silver Nanoparticle Dissolution in the Gut Environment of Zooplankton. ACS Nano 2018, 12, 12212–12223. [Google Scholar] [CrossRef]
  49. Poon, C.K.; Tang, O.; Chen, X.M.; Kim, B.; Hartlieb, M.; Pollock, C.A.; Hawkett, B.S.; Perrier, S. Fluorescent Labeling and Biodistribution of Latex Nanoparticles Formed by Surfactant-Free RAFT Emulsion Polymerization. Macromol. Biosci. 2017, 17, 1600366. [Google Scholar] [CrossRef] [PubMed]
  50. Tang, F.; Wang, C.; Wang, X.; Li, L. Facile Synthesis of Biocompatible Fluorescent Nanoparticles for Cellular Imaging and Targeted Detection of Cancer Cells. ACS Appl. Mater. Interfaces 2015, 7, 25077–25083. [Google Scholar] [CrossRef] [PubMed]
  51. Xiao, Y.; Zhang, Y.; Huang, H.; Zhang, Y.; Du, B.; Zheng, Q.; He, X.; Wang, K.; Chen, F. Conjugated polyelectrolyte-stabilized silver nanoparticles coupled with pyrene derivative for ultrasensitive fluorescent detection of iodide. Talanta 2015, 131, 678–683. [Google Scholar] [CrossRef]
  52. Swanner, J.; Singh, R. Synthesis, Purification, Characterization, and Imaging of Cy3Functionalized Fluorescent Silver Nanoparticles in 2D and 3D Tumor Models. Methods Mol. Biol. 2018, 1790, 209–218. [Google Scholar] [PubMed]
  53. Aslan, K.; Gryczynski, I.; Malicka, J.; Matveeva, E.; Lakowicz, J.R.; Geddes, C.D. Metal-enhanced fluorescence: An emerging tool in biotechnology. Curr. Opin. Biotechnol. 2005, 16, 55–62. [Google Scholar] [CrossRef] [PubMed]
  54. Chaganti, L.K.; Venkatakrishnan, N.; Bose, K. An efficient method for FITC labelling of proteins using tandem affinity purification. Biosci. Rep. 2018, 38, BSR20181764. [Google Scholar] [CrossRef] [PubMed] [Green Version]
  55. Tira, D.S.; Focsan, M.; Ulinici, S.; Maniu, D.; Astilean, S. Rhodamine B-Coated Gold Nanoparticles as Effective “Turn-on” Fluorescent Sensors for Detection of Zinc II Ions in Water. Spectrosc. Lett. 2013, 47, 153–159. [Google Scholar] [CrossRef]
  56. Petri, L.; Szijj, P.A.; Kelemen, A.; Imre, T.; Gomory, A.; Lee, M.T.W.; Hegedus, K.; Abranyi-Balogh, P.; Chudasama, V.; Miklos Keser, G. Cysteine specific bioconjugation with benzyl isothiocyanates. RSC Adv. 2020, 10, 14928–14936. [Google Scholar] [CrossRef]
  57. Fratoddi, I.; Cartoni, A.; Venditti, I.; Catone, D.; O’Keeffe, P.; Paladini, A.; Toschi, F.; Turchini, S.; Sciubba, F.; Testa, G.; et al. Gold nanoparticles functionalized by rhodamine B isothiocyanate to tune plasmonic effects. J. Colloid Interf. Sci. 2018, 513, 10–19. [Google Scholar] [CrossRef]
  58. Rossi, S.; Donadio, S.; Fontana, L.; Porcaro, F.; Battocchio, C.; Venditti, I.; Bracci, L.; Fratoddi, I. Negatively charged gold nanoparticles as dexamethasone carrier: Stability and citotoxic activity. RCS Adv. 2016, 6, 99016–99022. [Google Scholar]
  59. Catone, D.; Di Mario, L.; Martelli, F.; O’Keeffe, P.; Paladini, A.; Jacopo Stefano Pelli Cresi, J.S.; Sivan, A.K.; Tian, L.; Toschi, F.; Turchini, S. Ultrafast optical spectroscopy of semiconducting and plasmonic nanostructures and their hybrids. Nanotechnology. 2020, 32, 025703. [Google Scholar] [CrossRef]
  60. Sinigaglia, G.; Magro, M.; Miotto, G.; Cardillo, S.; Agostinelli, E.; Zboril, R.; Bidollari, E.; Vianello, F. Catalytically active bovine serum amine oxidase bound to fluorescent and magnetically drivable nanoparticles. Int. J. Nanomed. 2012, 7, 2249–2259. [Google Scholar]
  61. Bardsley, K.; Wimpenny, I.; Yang, Y.; El Haj, A.J. Fluorescent, online monitoring of PLGA degradation for regenerative medicine applications. RSC Adv. 2016, 6, 44364–44370. [Google Scholar] [CrossRef]
  62. Dou, X.; Zhang, L.; Liu, C.; Li, Q.; Luo, J.; Yang, M. Fluorometric competitive immunoassay for chlorpyrifos using rhodamine-modified gold nanoparticles as a label. Microchim. Acta 2018, 185, 41. [Google Scholar] [CrossRef]
  63. Bhattacharjee, S. DLS and zeta potential—What they are and what they are not? J. Control. Rel. 2016, 235, 337–351. [Google Scholar] [CrossRef] [PubMed]
  64. Eaton, P.; Quaresma, P.; Soares, C.; Neves, C.; de Almeida, M.P.; Pereira, E.; West, P. A direct comparison of experimental methods to measure dimensions of synthetic nanoparticles. Ultramicroscopy 2017, 182, 179–190. [Google Scholar] [CrossRef] [PubMed]
  65. Lim, J.K.; Yeap, S.P.; Che, H.X.; Low, S.C. Characterization of magnetic nanoparticle by dynamic light scattering. Nanoscale Res. Lett. 2013, 8, 381. [Google Scholar] [CrossRef] [PubMed] [Green Version]
  66. Swift, P.; Shuttleworth, D.; Seah, M.P. Practical Surface Analysis by Auger and X-ray Photoelectron Spectroscopy; Briggs, D., Seah, M.P., Eds.; J. Wiley & Sons: Chichester, UK, 1983; Chapter 4. [Google Scholar]
  67. Schiesaro, I.; Burratti, L.; Meneghini, C.; Fratoddi, I.; Prosposito, P.; Lim, J.; Scheu, C.; Venditti, I.; Iucci, G.; Battocchio, C. Hydrophilic Silver Nanoparticles for Hg(II) Detection in Water: Direct evidence for Mercury-Silver Interaction. J. Phys. Chem. C 2020, 124, 25975–25983. [Google Scholar] [CrossRef]
  68. Linstorm, P. NIST Chemistry webbook, NIST standard reference database number 69. J. Phys. Chem. Ref. Data Monogr. 1998, 9, 1–1951. [Google Scholar]
  69. Loscutoff, P.W.; Wong, K.T.; Bent, S.F. Reaction of phenyl isocyanate and phenyl isothiocyanate with the Ge(100)-2x1 surface J. Phys. Chem. C 2010, 114, 14193–14201. [Google Scholar] [CrossRef]
  70. Smirl, A.L.; Clark, J.B.; Van Stryland, E.W.; Russell, B.R. Population and rotational kinetics of the rhodamine B monomer and dimer: Picosecond transient spectrometry. J. Chem. Phys. 1982, 77, 631–640. [Google Scholar] [CrossRef] [Green Version]
  71. Pilot, R.; Signorini, R.; Durante, C.; Orian, L.; Bhamidipati, M.; Fabris, L. A Review on Surface-Enhanced Raman Scattering. Biosensors 2019, 9, 57. [Google Scholar] [CrossRef] [Green Version]
  72. Smith, T.; Irwanto, M.; Haines, D.J.; Ghiggino, K.P.; Millar, D.P. Time-resolved fluorescence anisotropy measurements of the adsorption of Rhodamine-B and a labelled polyelectrolyte onto colloidal silica. Colloid Polym. Sci. 1998, 276, 1032–1037. [Google Scholar] [CrossRef]
  73. Olejnik, M.; Bujak, L.; Mackowski, S. Plasmonic molecular nanohybrids-spectral dependence of fluorescence quenching. Int. J. Mol. Sci. 2012, 13, 1018–1028. [Google Scholar] [CrossRef] [PubMed]
Figure 1. Scheme of silver nanoparticle–fluorescein isothiocyanate (AgNPs–FITC) and silver nanoparticle–rhodamine B isothiocyanate (AgNPs–RITC) synthesis.
Applsci 11 02472 g001
Figure 2. UV–Vis spectra of (a) FITC; (b) RITC; (c) AgNPs–FITC; (d) AgNPs–RITC samples in water solution.
Applsci 11 02472 g002
Figure 3. Dynamic light scattering (DLS) and zeta potential measurements for AgNPs in water at 25 °C: (a) AgNPs–FITC DLS <2RH> = 78 ± 12 nm; (b) AgNPs–FITC ζ potential = −16 ± 3 mV; (c) AgNPs–RITC DLS <2RH> = 68 ± 20 nm; (d) AgNPs–RITC ζ potential = −22 ± 3 mV.
Applsci 11 02472 g003
Figure 4. (a) C1s SR-XPS spectra and (b) N1s SR-XPS spectra collected on AgNPs–FITC (top) and AgNPs–RITC (bottom).
Applsci 11 02472 g004
Figure 5. (a) Ag3d SR-XPS spectrum and (b) S2p spectrum collected on AgNPs–FITC. Data for AgNPs–RITC are analogous (Table S2 in Supplementary Materials).
Applsci 11 02472 g005
Figure 6. (a) Normalized dynamics of fluorescence of AgNPs–RITC (black) and RITC (red) probed by transient absorption following photoexcitation on the dye absorption band at 560 nm (the probe was at 590 nm to avoid the scattering of the pump). (b) The normalized dynamics of the same band (probed at 560 nm in this case) revealed by transient absorption following photoexcitation on the localized surface plasmon resonance (LSPR) band of the Ag nanoparticles at 400 nm.
Applsci 11 02472 g006
Table 1. Synchrotron radiation (SR)-XPS C1s core level data fit results: BE, binding energy; FWHM, full width half-maximum; atomic ratios; and proposed assignments (the statistical incertitude in semiquantitative evaluation by XPS was estimated as 5% of the calculated value [66]).
SampleBE (eV)FWHM (eV)Exp. Atomic Ratio* Theor. Atomic RatioAssignment
AgNPs–FITC 284.71.117.57.5C–C
285.841.1111C–N, SCN
286.431.111.21C–O
287.661.110.51.5C=O
288.841.11--COOH (impurities)
AgNPs–RITC284.71.3120.918C–C
285.81.318.17C–N, SCN
286.781.313.42C–O
287.851.3122C=O
288.921.3111COOH
* Intensity ratios: for AgNPs–FITC, calculated as signal intensity/C–N, SCN signal intensity; for AgNPs–FITC, calculated as signal intensity/COOH signal intensity.
Publisher’s Note: MDPI stays neutral with regard to jurisdictional claims in published maps and institutional affiliations.

