Article

Effects of Supplementary Cementitious Materials and Curing Condition on Mechanical Properties of Ultra-High-Performance, Strain-Hardening Cementitious Composites

Department of Architectural Engineering, Hanyang University, 222 Wangsimni-ro, Seongdong-gu, Seoul 04763, Korea
*
Author to whom correspondence should be addressed.
Appl. Sci. 2021, 11(5), 2394; https://doi.org/10.3390/app11052394
Submission received: 4 February 2021 / Revised: 2 March 2021 / Accepted: 3 March 2021 / Published: 8 March 2021
(This article belongs to the Section Materials Science and Engineering)

Abstract

:
This study investigated the influence of ordinary Portland cement (OPC) and reactive and non-reactive mineral additives on the characteristic microstructure and mechanical performance of ultra-high-performance, strain-hardening cementitious composites (UHP–SHCCs). Nine mixes of cementitious composites were considered composed of reactive and non-reactive materials, such as ground granulated blast furnace slag (GGBS), silica fume (SF), cement kiln dust (CKD), and silica flour. Compressive strength and direct tensile tests were performed on the nine mixes cured for 7 d and 28 d. The test result was analyzed based on microstructural inspections, including thermogravimetry and scanning electron microscopy. The test result and analysis showed that the microstructural property of the UHP–SHCC impacted the compressive strength and the tensile behavior and also influenced the fiber-matrix interaction. Although most of the 7 d cured specimens did not exhibit notable strain-hardening behaviors, the specimen containing the CKD exhibited a tensile strength of 11.6 MPa and a very high strain capacity of 7.5%. All the specimens with OPC, silica flour, GGBS, or SF exhibited considerably improved tensile behavior at 28 d. The specimen with only OPC as a binder could achieve the tensile strength of 11.6 MPa and strain capacity of 6.2%.

1. Introduction

Numerous studies [1,2,3,4] have been conducted to improve the mechanical properties of cementitious composites concerning both strength and ductility. One of the effective ways for enhancing tensile ductility is to incorporate reinforcing fibers into cementitious composites. Thus, various methods of reinforcing cementitious composites with steel or polymeric fibers have been developed and improved upon by researchers. Slurry infiltrated concrete (SIFCON), engineered cementitious composite (ECC), reactive powder concrete (RPC), and ultra-high-performance concrete (UHPC) are a few strain-hardening cementitious composites (SHCCs) that have been investigated in the past [1,2,3,4]. Among the diverse materials, ECC and UHPC are the two most representative SHCCs that continue to be improved upon and applied in structural elements.
UHPC containing 2 vol.% steel fibers typically has compressive strength, tensile strength, and strain capacity of around 150 MPa, 8 MPa, and 0.5%, respectively. Particle packing theory of the reactive and non-reactive mineral additives was designed to improve performance significantly [5,6]. Thus, the UHPC generally consists of ordinary Portland cement (OPC), silica fume (SF), silica sand, and silica flour, to develop a more compact and homogeneous microstructure. Engineered cementitious composite (ECC) is Pa different type of cementitious composite that exhibits high ductility by incorporating 2 vol.% of polymeric fibers. Unlike steel fibers, polymeric fibers, with a low surface hardness, damage the fiber-matrix interface less when the fibers are pulled out. Therefore, the cementitious matrix can persistently resist to pullout of the polymeric fibers and obtain a higher strain capacity of 5% or more [2,7,8]. The tensile strength of ECC, however, is generally lower than that of the UHPC ranging between 5–8 MPa. Thus, many researchers have been working toward improving the mechanical performance of cementitious composites further to obtain enhanced strength and high ductility.
In general, ground granulated blast furnace slag (GGBS), silica fume (SF), silica flour have been considered in designing fiber-reinforced cement composites (FRCCs) to improve the physical properties. The GGBS is also well known as a mineral additive that goes through the second hydration process after the dissolution of its glassy shell. This was the reason why researchers used the alkaline substances to activate GGBS-based polyethylene (PE) fiber-reinforced composites [7,8]. Thus, the rate of the development of microstructure and mechanical performance is slower than that of the OPC, which directly reacts with water. The SF is also a representative pozzolanic mineral additive, which has frequently been used in FRCCs. Due to its very fine particular size, it has many benefits from the points of reactivity, particle packing and compressive strength, and flowability of the fresh FRCC mixes [9,10,11,12]. Cement kiln dust (CKD) can also be effectively used in cementitious composites as binders when its alkali and sulfur concentrations can be reduced. By controlling the alkali and sulfur concentrations, the CKD becomes highly reactive and promotes the development of early strength or activation of the GGBS [13,14].
Although a number of studies have investigated the influence of the reactive and non-reactive supplementary materials, only a few studies were relevant to ultra-high-performance, strain-hardening cementitious composites (UHP–SHCCs). Recently, researchers have reported ultra-high-performance, strain-hardening composite materials reinforced with polyethylene (PE) fibers [7,8,15]. Alkali-activated GGBS–based composites showed tensile strengths ranging between 8–17.4 MPa and strain capacities between 7–8% [7,8]. Nguyễn et al. [7] and Choi et al. [8] tried to eliminate the OPC from the composites and fix the binder types by using 90% or 100% of GGBS. In [7,8], they focused on examining the influence of types of alkaline substances and water to binder ratios on mechanical performance. Without the alkali activation process, in the meantime, researchers [15,16,17,18] have developed PE–FRCCs consisting of combinations of the OPC with mineral additives such as GGBS, SF, and silica flour. They reported the materials exhibited high tensile strength and strain capacity of up to 17.4 MPa and 8.2%, respectively [15]. Despite all the previous endeavors, however, no study has specifically investigated the influence of the type of mineral additives and curing conditions on the microstructural and mechanical properties of the composites. SHCCs are very fragile and complex due to the different physical and chemical characteristics of the combined materials. The OPC and other mineral additives have different mineralogical and reactive features, and they have to be analyzed independently [19]. Curing conditions, including the curing temperature and time, also significantly affect the porosity and formation of the microstructure of cementitious composites [20]. Prior studies [7,8,15,16,17,18], however, have mainly focused on optimizing the mechanical performance of the materials and have been unable to clarify specific mechanisms for the ultra-high performances. Moreover, the microstructural and micromechanical influences of the curing conditions have not yet been analyzed enough.
Therefore, this study examined nine types of UHP–SHCC mixes incorporating the reactive OPC, GGBS, SF, and CKD along with the non-reactive silica flour at the curing ages of 7 d and 28 d. A total of 18 composites were fabricated and have gone through microstructural inspections which were thermogravimetry (TG) and scanning electron microscopy (SEM) analyses followed by the compressive and direct tensile tests.

2. Experiments

2.1. Materials and Mixture Proportions

Table 1 shows the density, specific surface area, and chemical compositions of the mineral additives used in this study. The specific surface areas of OPC, SF, GGBS, and CKD were 3350 cm2/g, 200,000 cm2/g, 4360 cm2/g, and 8200 cm2/g, respectively. The CKD used in this study also contained very low concentrations of alkali and SO3 that deteriorate the microstructure. Figure 1 shows the cumulative volume percentages and particle size distribution obtained from the sieving test of the materials. Finally, 2 vol.% of ultra-high molecular PE fibers were incorporated into the mixes.
Table 2 describes the mix proportions of the cementitious composites used in this study. Four types of reactive materials—Type 1 OPC, GGBS, SF, CKD—and two types of non-reactive materials—silica flour and silica sand—were used. One of the main aims of this study was to identify the influence of the properties of binders on the mechanical behavior of UHP–SHCCs. Thus, the amount of silica sand (fine aggregate) was kept at 30% of the reactive binder materials. Each mixture incorporated only one or two reactive mineral additives to individually examine their influence under the same fabrication and curing conditions. Table 3 summarizes the physical properties of the PE fiber.
As suggested in Table 2, specimen A only included OPC as a binder, while the mixes D to I additionally contained one of the mineral additives GGBS, SF, and CKD, respectively. Mixes B and C also contained silica flour in a weight ratio of 0.15 and 0.3 to OPC, respectively. They were considered as test variables to clarify the effect of reactive and non-reactive mineral additives. The amount of water and superplasticizer (SP) was controlled not to impact the workability of the mixture. Although the silica flour does not react with water, it considerably decreases the workability. This can cause a severe problem when PE fibers are dispersed in the mixture. Therefore, the amount of water into the mixes B and C was set to 20% of the weight of the silica flour to obtain the proper workability.

2.2. Specimen Fabrication

The specimen fabrication was carried out in the following order.
  • Mixing the dry reactive and non-reactive powders for 3 min;
  • Adding water and superplasticizer and wet mix for 3–5 min according to the type of binders;
  • Incorporating the PE fibers and mix for 5 min to disperse the PE fibers in the mortar evenly;
  • Pouring the mixture into the prepared molds and cover them with a plastic sheet;
  • Curing the specimens at a room temperature of 20 °C and 60% relative humidity for 2 d and in a 40 °C water tank for 5 d and 26 d to accelerate the hydration and pozzolanic reactions of the mineral additives while minimizing the detrimental influences of the elevated temperature on the microstructure [20,21,22].
Different curing times for the same specimens were adopted to examine the influence of the microstructure development on the mechanical performance of the UHP–SHCC. Specimens A to I cured for a total of 7 d and 28 d were denoted as from A7 to I7 and A28 to I28, respectively.

2.3. Compressive Strength and Direct Tensile Test Setups

The compressive strength test was performed with a 50 mm3 cubic specimen. A universal testing machine (UTM) with a maximum load capacity of 25 t was used to apply a uniaxial and monotonic load to the specimen. The measurements of three samples for each mix proportion were recorded and averaged to ensure the accuracy of the test.
The uniaxial direct tensile test was performed following the recommendations of the Japan Society of Civil Engineers (JSCE) [23]. Figure 2 illustrates the test setup and details of the test specimens. The tensile test was conducted using another UTM with a loading capacity of 25 t. Two linear variable displacement transducers (LVDTs) were installed, as shown in Figure 2a, to measure the displacement only between the gauge region of the specimen. The measured tensile load and displacement in the gauge region were converted to the tensile stress and strain of the hatched region with a cross-sectional area of 30 mm × 13 mm and a height of 80 mm, as shown in Figure 2b. Additionally, a uniaxial load was applied based on a displacement control with a loading rate of 0.8 mm/min. Five specimens for each variable were tested, and their results were averaged.

2.4. Thermogravimetric Analysis

Thermogravimetric analysis was performed using the SDT Q600 simultaneous thermal analyzer (Horizontal Balance & Furnace, TA Instruments, New Castle, DE, USA) at a heating rate of 10 °C/min under nitrogen gas flow. The weight loss was measured between 20 °C and 1000 °C. The test was performed using approximately 8 mg of the previously ground sample for each variable.

2.5. Scanning Electron Microscopy

The specimens were polished using epoxy resin and with increasing meshes of sandpapers from 400 to 2500 to improve the inspection of the microstructure and fiber–matrix interface of the UHP–SHCCs. The samples were observed and studied using a scanning electron microscope (S-4700, FESEM, Hitachi, Ltd., Japan, 1994) with a resolution of 1.2 nm.

3. Microstructural Analysis Results

3.1. Thermogravimetric Analysis

The secondary reactions of the GGBS and SF require or consume calcium hydroxide (CH) in the hydrating mortar to form additional calcium silicate hydrates (C–S–H) in the composite. These additional hydrates enhance the microstructure of the composite by filling the voids and increasing the bond strength between the fiber and the matrix. The rates of the secondary reactions, however, are typically slower than that of the direct hydration of the OPC with similar particle size. The GGBS was found to reduce the rate of development of the early age strength of the cementitious composites as it requires the alkaline mortar to dissolve its glassy surface. The SF, on the contrary, accelerates the production and consumption of CH from the beginning of the hydration due to its large contact area with water and high reactivity [12,24]. The CKD is known to contain a high concentration of sulfate, chloride, and alkaline substances that accelerates the reaction of the cementitious composite at the initial stage but consequently deteriorates the microstructure [13]. The CKD used in this study, however, contained a low sulfate content, lower than that of the OPC, and an alkali content of 0.41%, as described in Table 2. Additionally, the CKD had a specific surface area of 8200 cm2/g, over twice that of the OPC (3550 cm2/g).
Figure 3 shows the result of the differential thermogravimetric (DTG) inspection for the five specimens of each mineral additive used in this study. It is noted in the DTG curves of the first peak increased, and that of the second peak decreased as the curing time increases from 7 d to 28 d. The notable decrease in the second peak is attributed to the simultaneous reduction in the amount of CH due to the continuous formation of C–S–H after hydration and pozzolanic reactions of the matrix and the continued curing at 40 °C after the initial 7 d of curing. Subsequently, from the first peak to before the second peak, the DTG curve is influenced by dehydration of a few types of hydrates, including C–S–H, ettringite, and mono-sulfate. However, a clear increase in the amount of C–S–H is observed during the additional curing phase after 7 d to 28 d when the notable difference between the DTG curves of the 7 d and 28 d cured specimens is observed in the dehydration section.
The type of mineral additives also discernably affected the DTG curves, as shown in Figure 3. The DTG curves show that specimen B with the non-reactive silica flour did not notably differ from specimen A at both ages of 7 d and 28 d. However, specimens D and F, with GGBS and SF, showed a notable decrease in the second peak at both ages of 7 d and 28 d, compared to specimen A. Although the GGBS requires a certain degree of CH concentration to activate its hydration process, the process itself does not consume a considerable amount of CH. Thus, the decrease in the amount of CH, caused by the inclusion of the GGBS, was because a large dosage of OPC was substituted by the GGBS. The SF consumes the CH in the pozzolanic reaction forming the C–S–H and accelerates the production of the CH from the hydrating matrix [12,24]. Thus, its first peak was extremely high compared to that of the other specimens, while the second peak was significantly lower at both ages of 7 d and 28 d. The second peak of specimen H7, with the CKD, was higher than that of specimen A7, and that of specimen H28 was lower than that of specimen A28, similar to that of the other 28 d cured specimens. Considering that CKD is composed of approximately 38% of calcium carbonate, it is clear that the 15% OPC substitution by the CKD decreases the total amount of the C–S–H and CH. However, the higher specific surface area of CKD accelerates the hydration of the matrix at an early age, and the total amount of essential hydrates, such as C–S–H and CH, became lower at the age of 28 d.

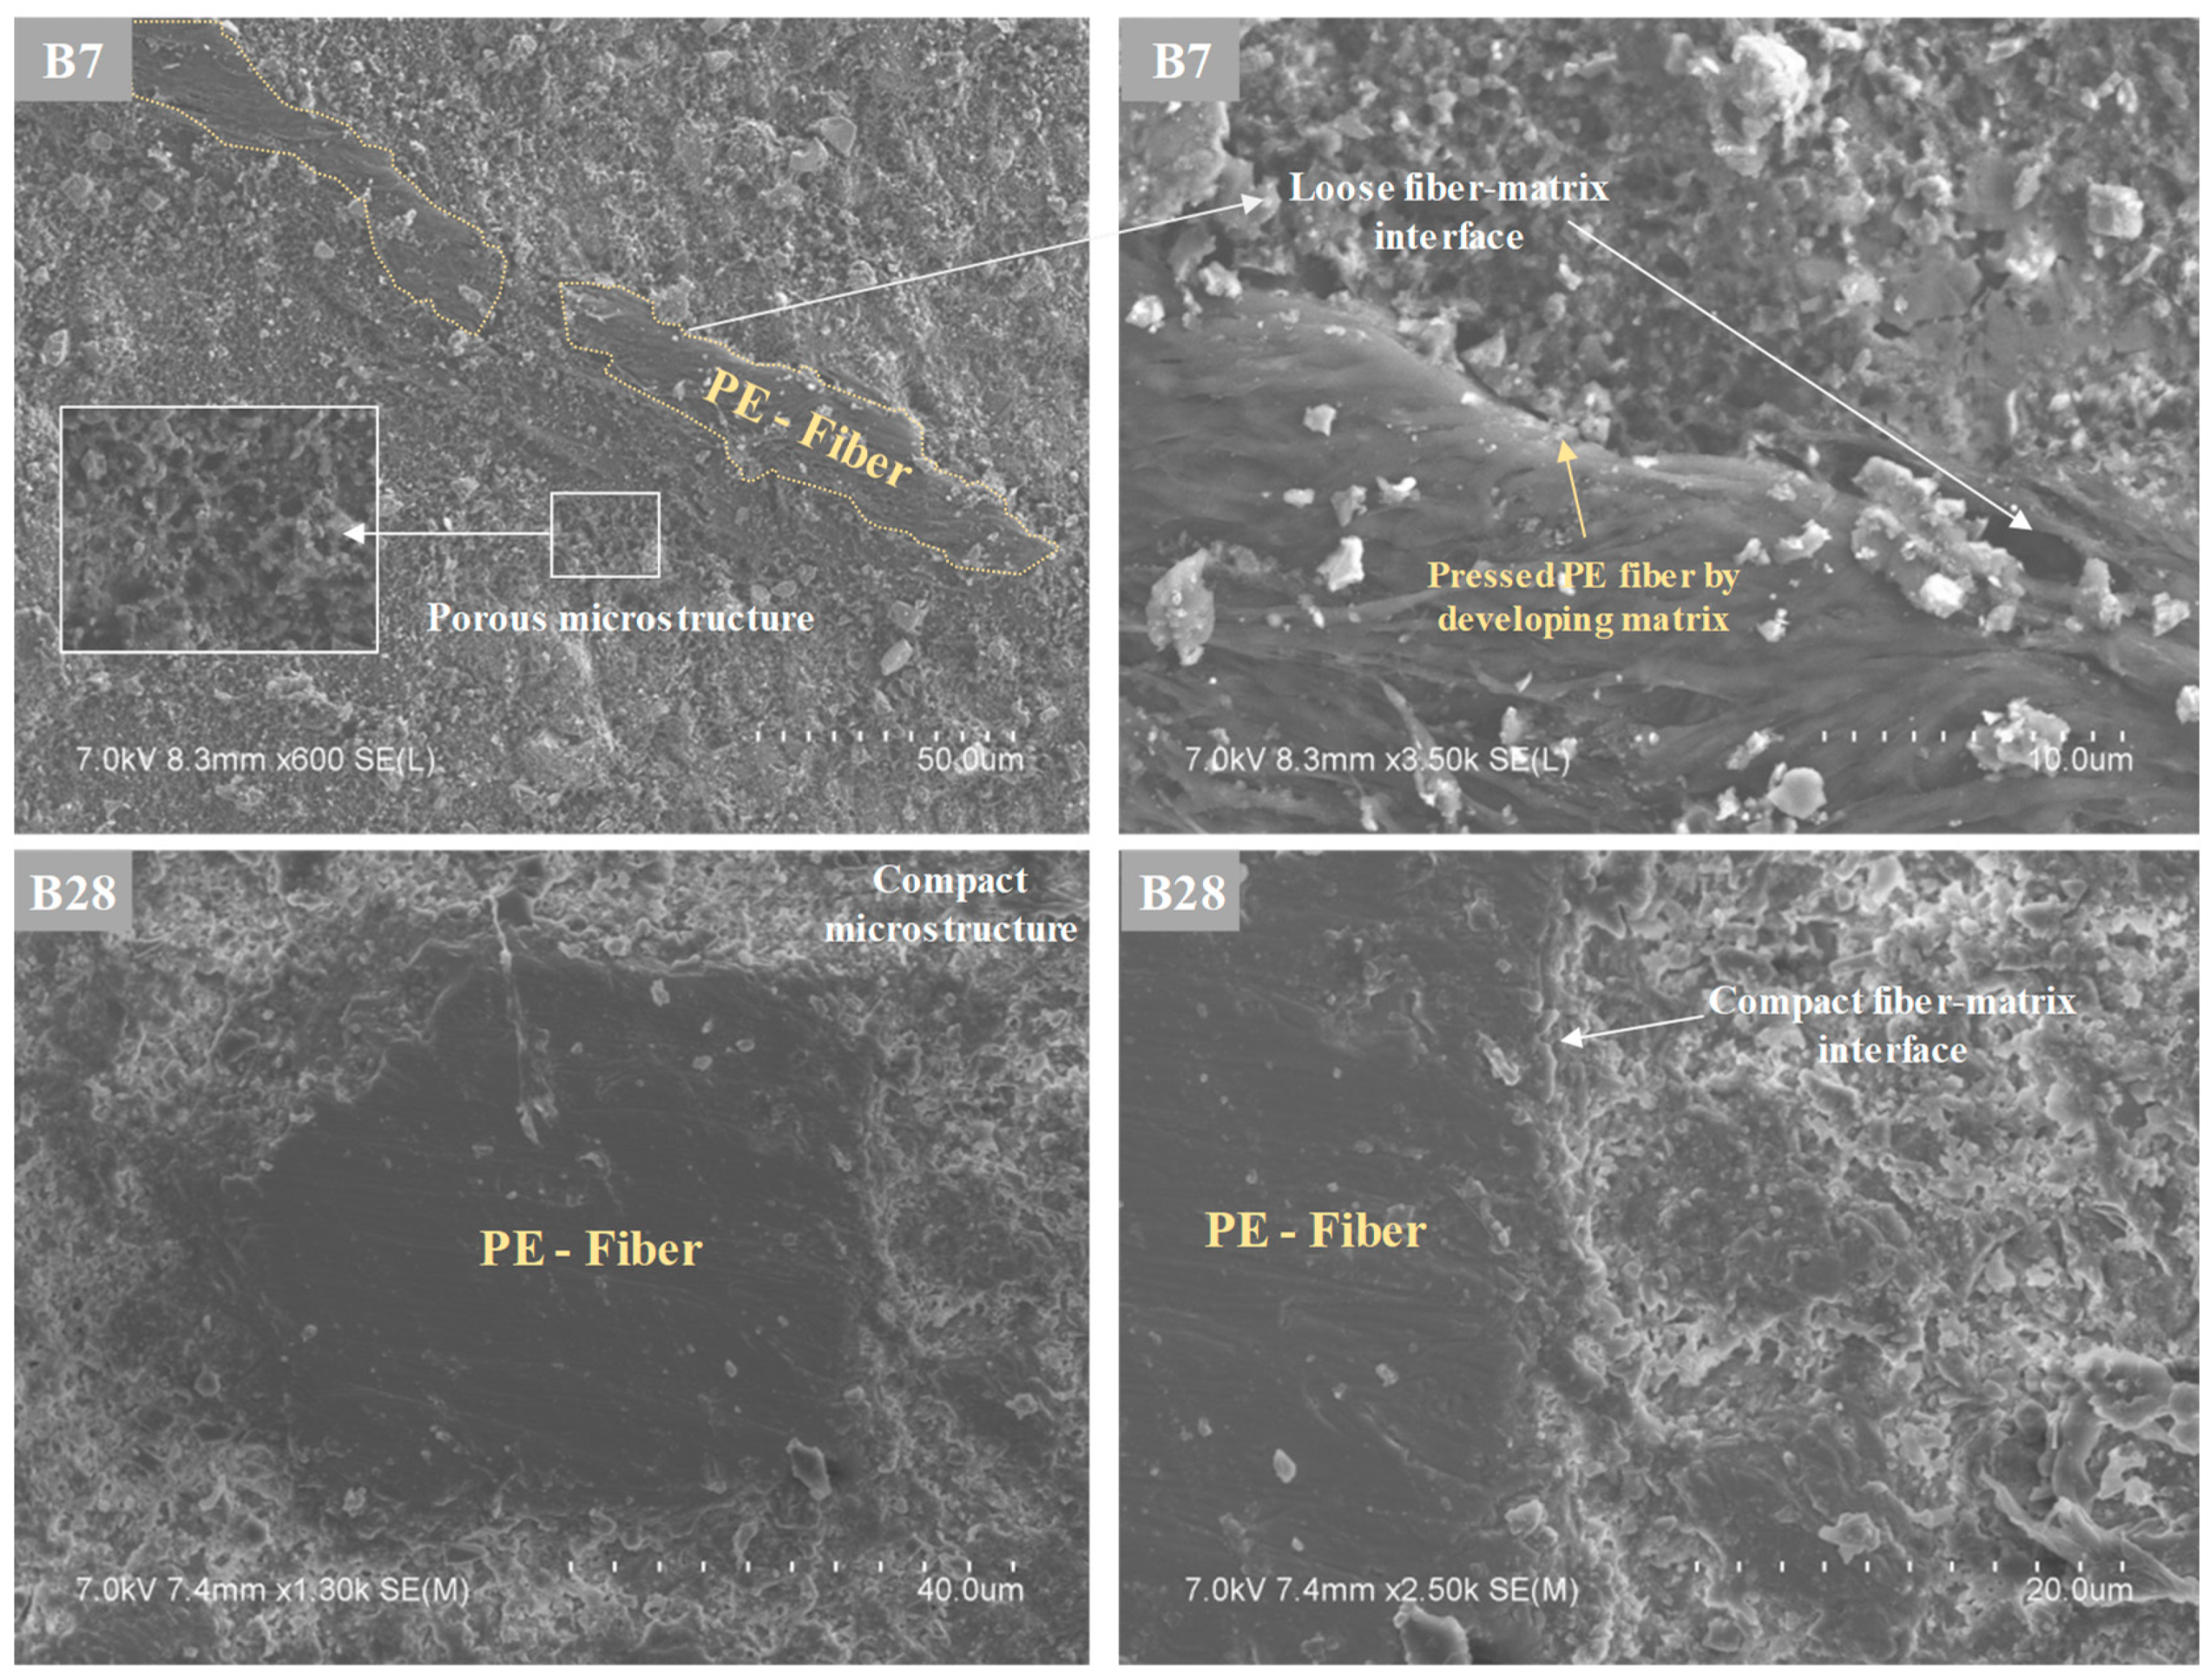
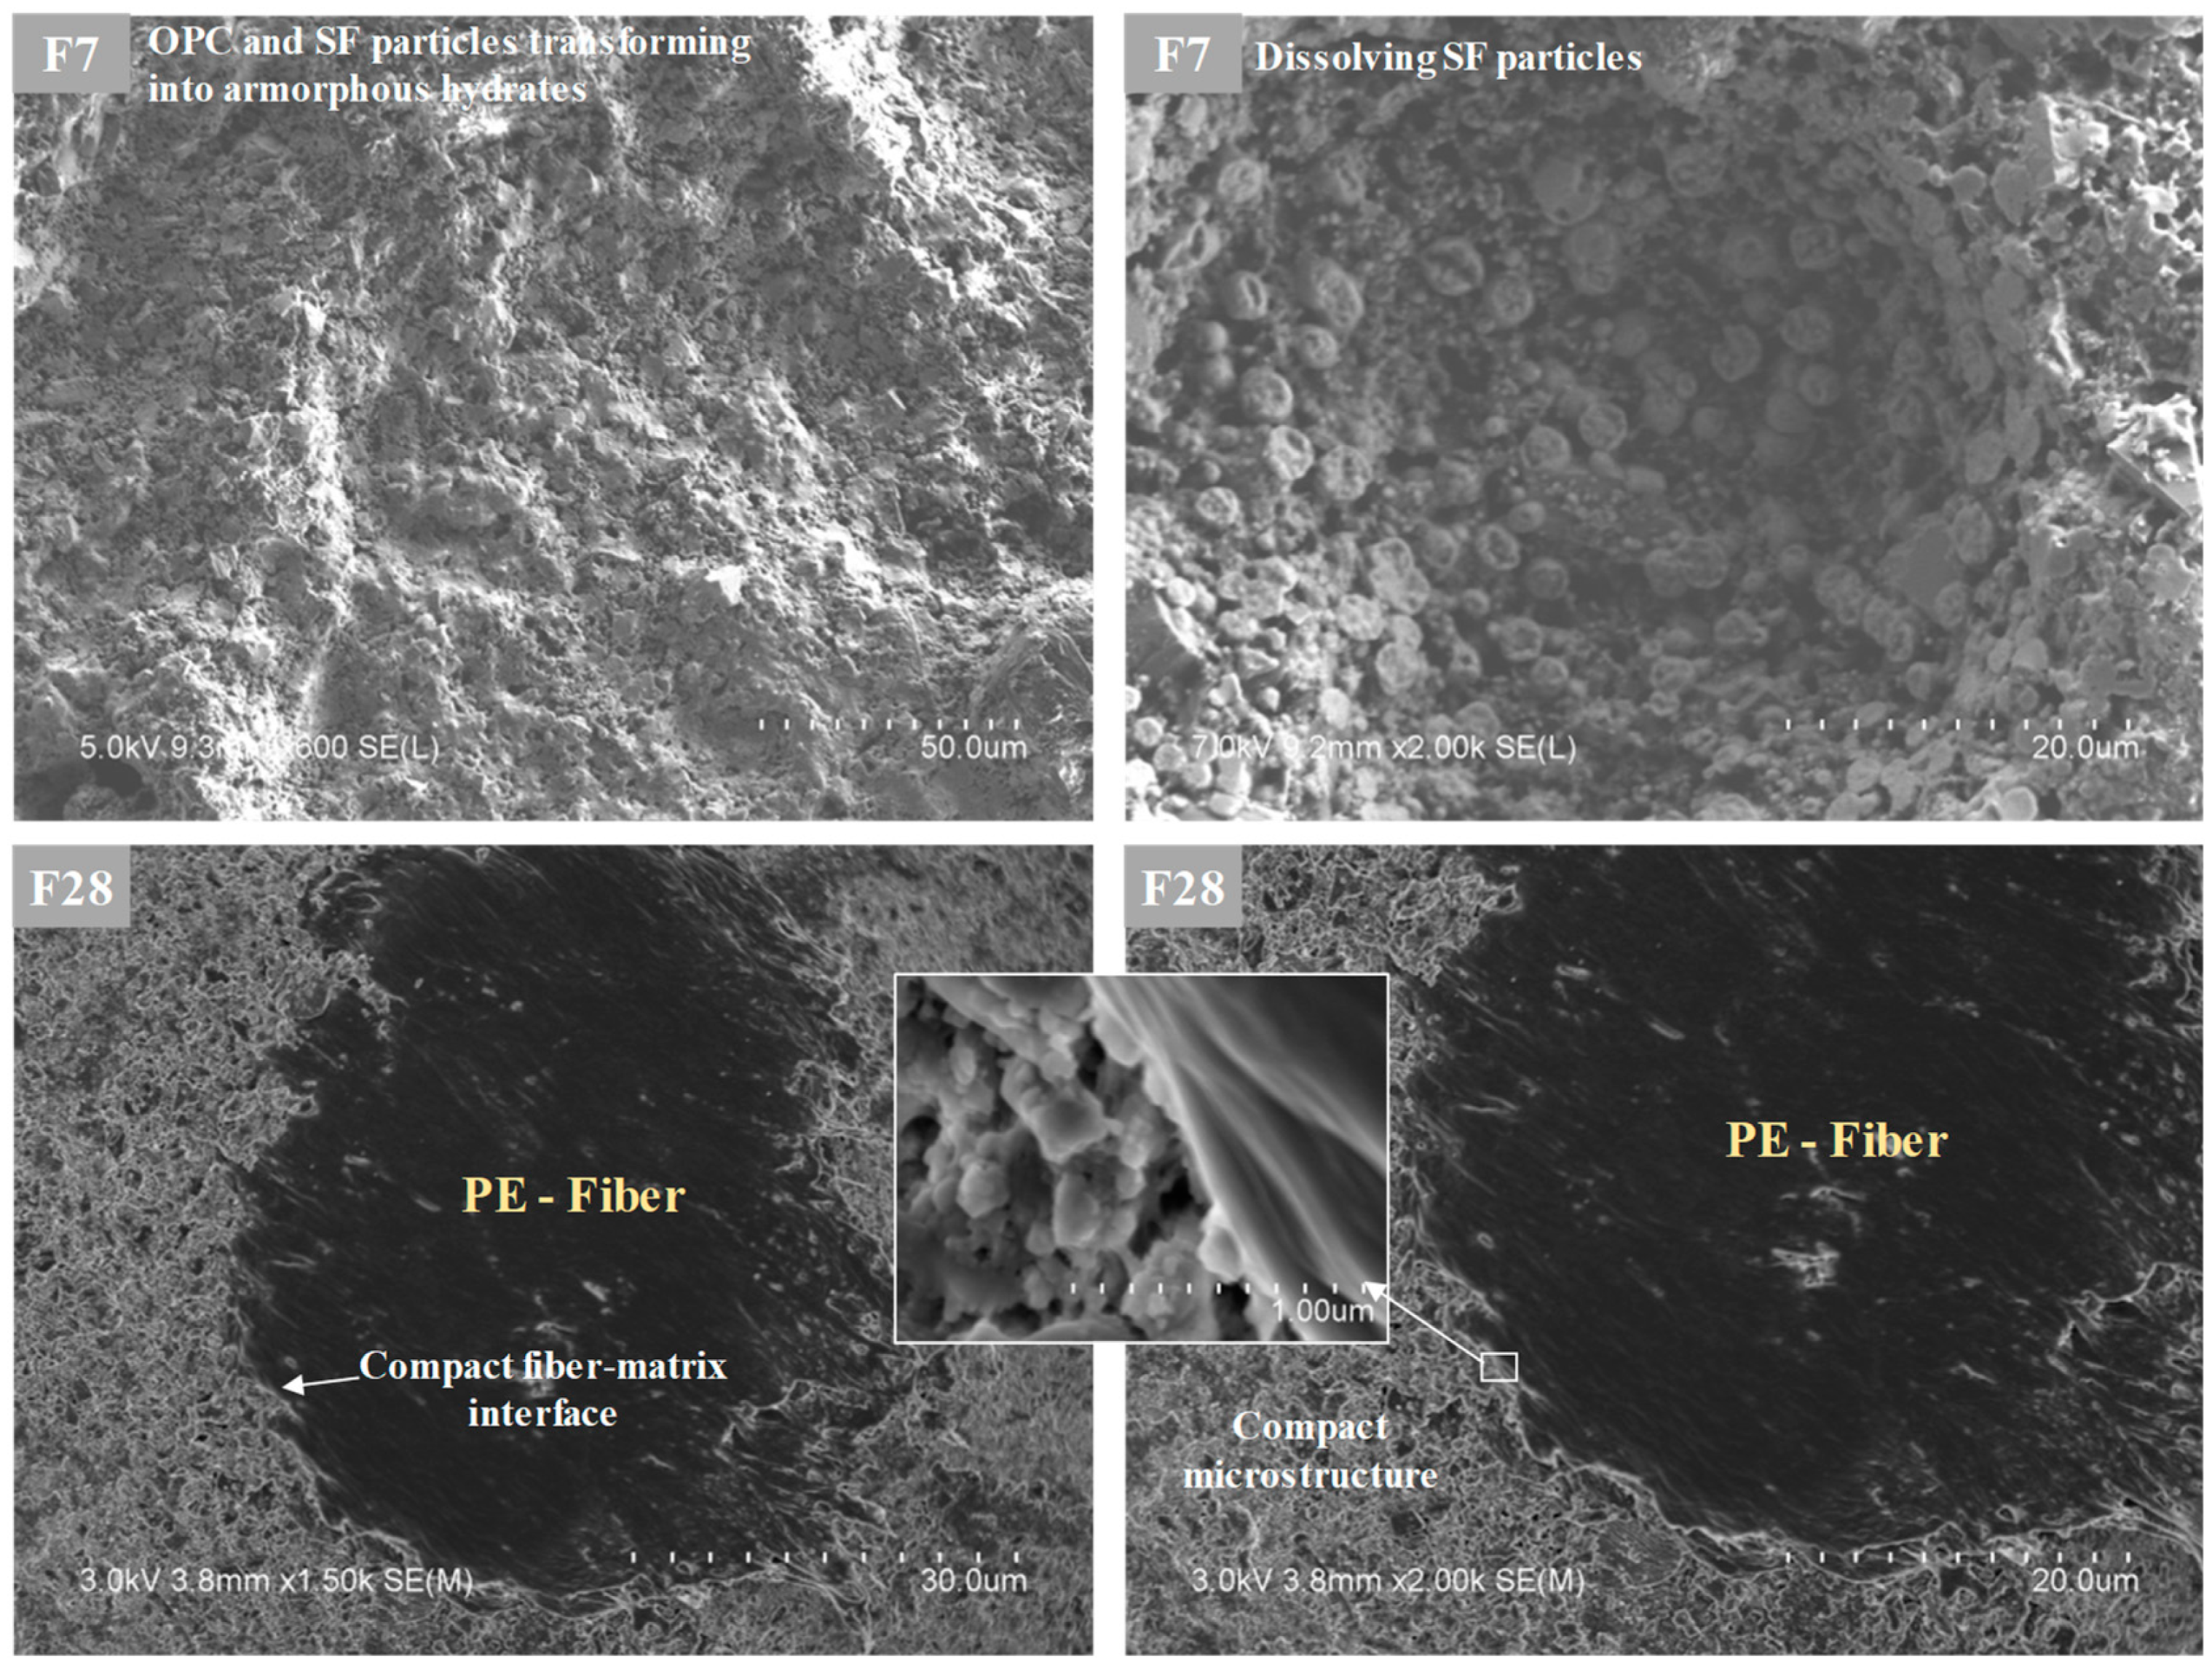
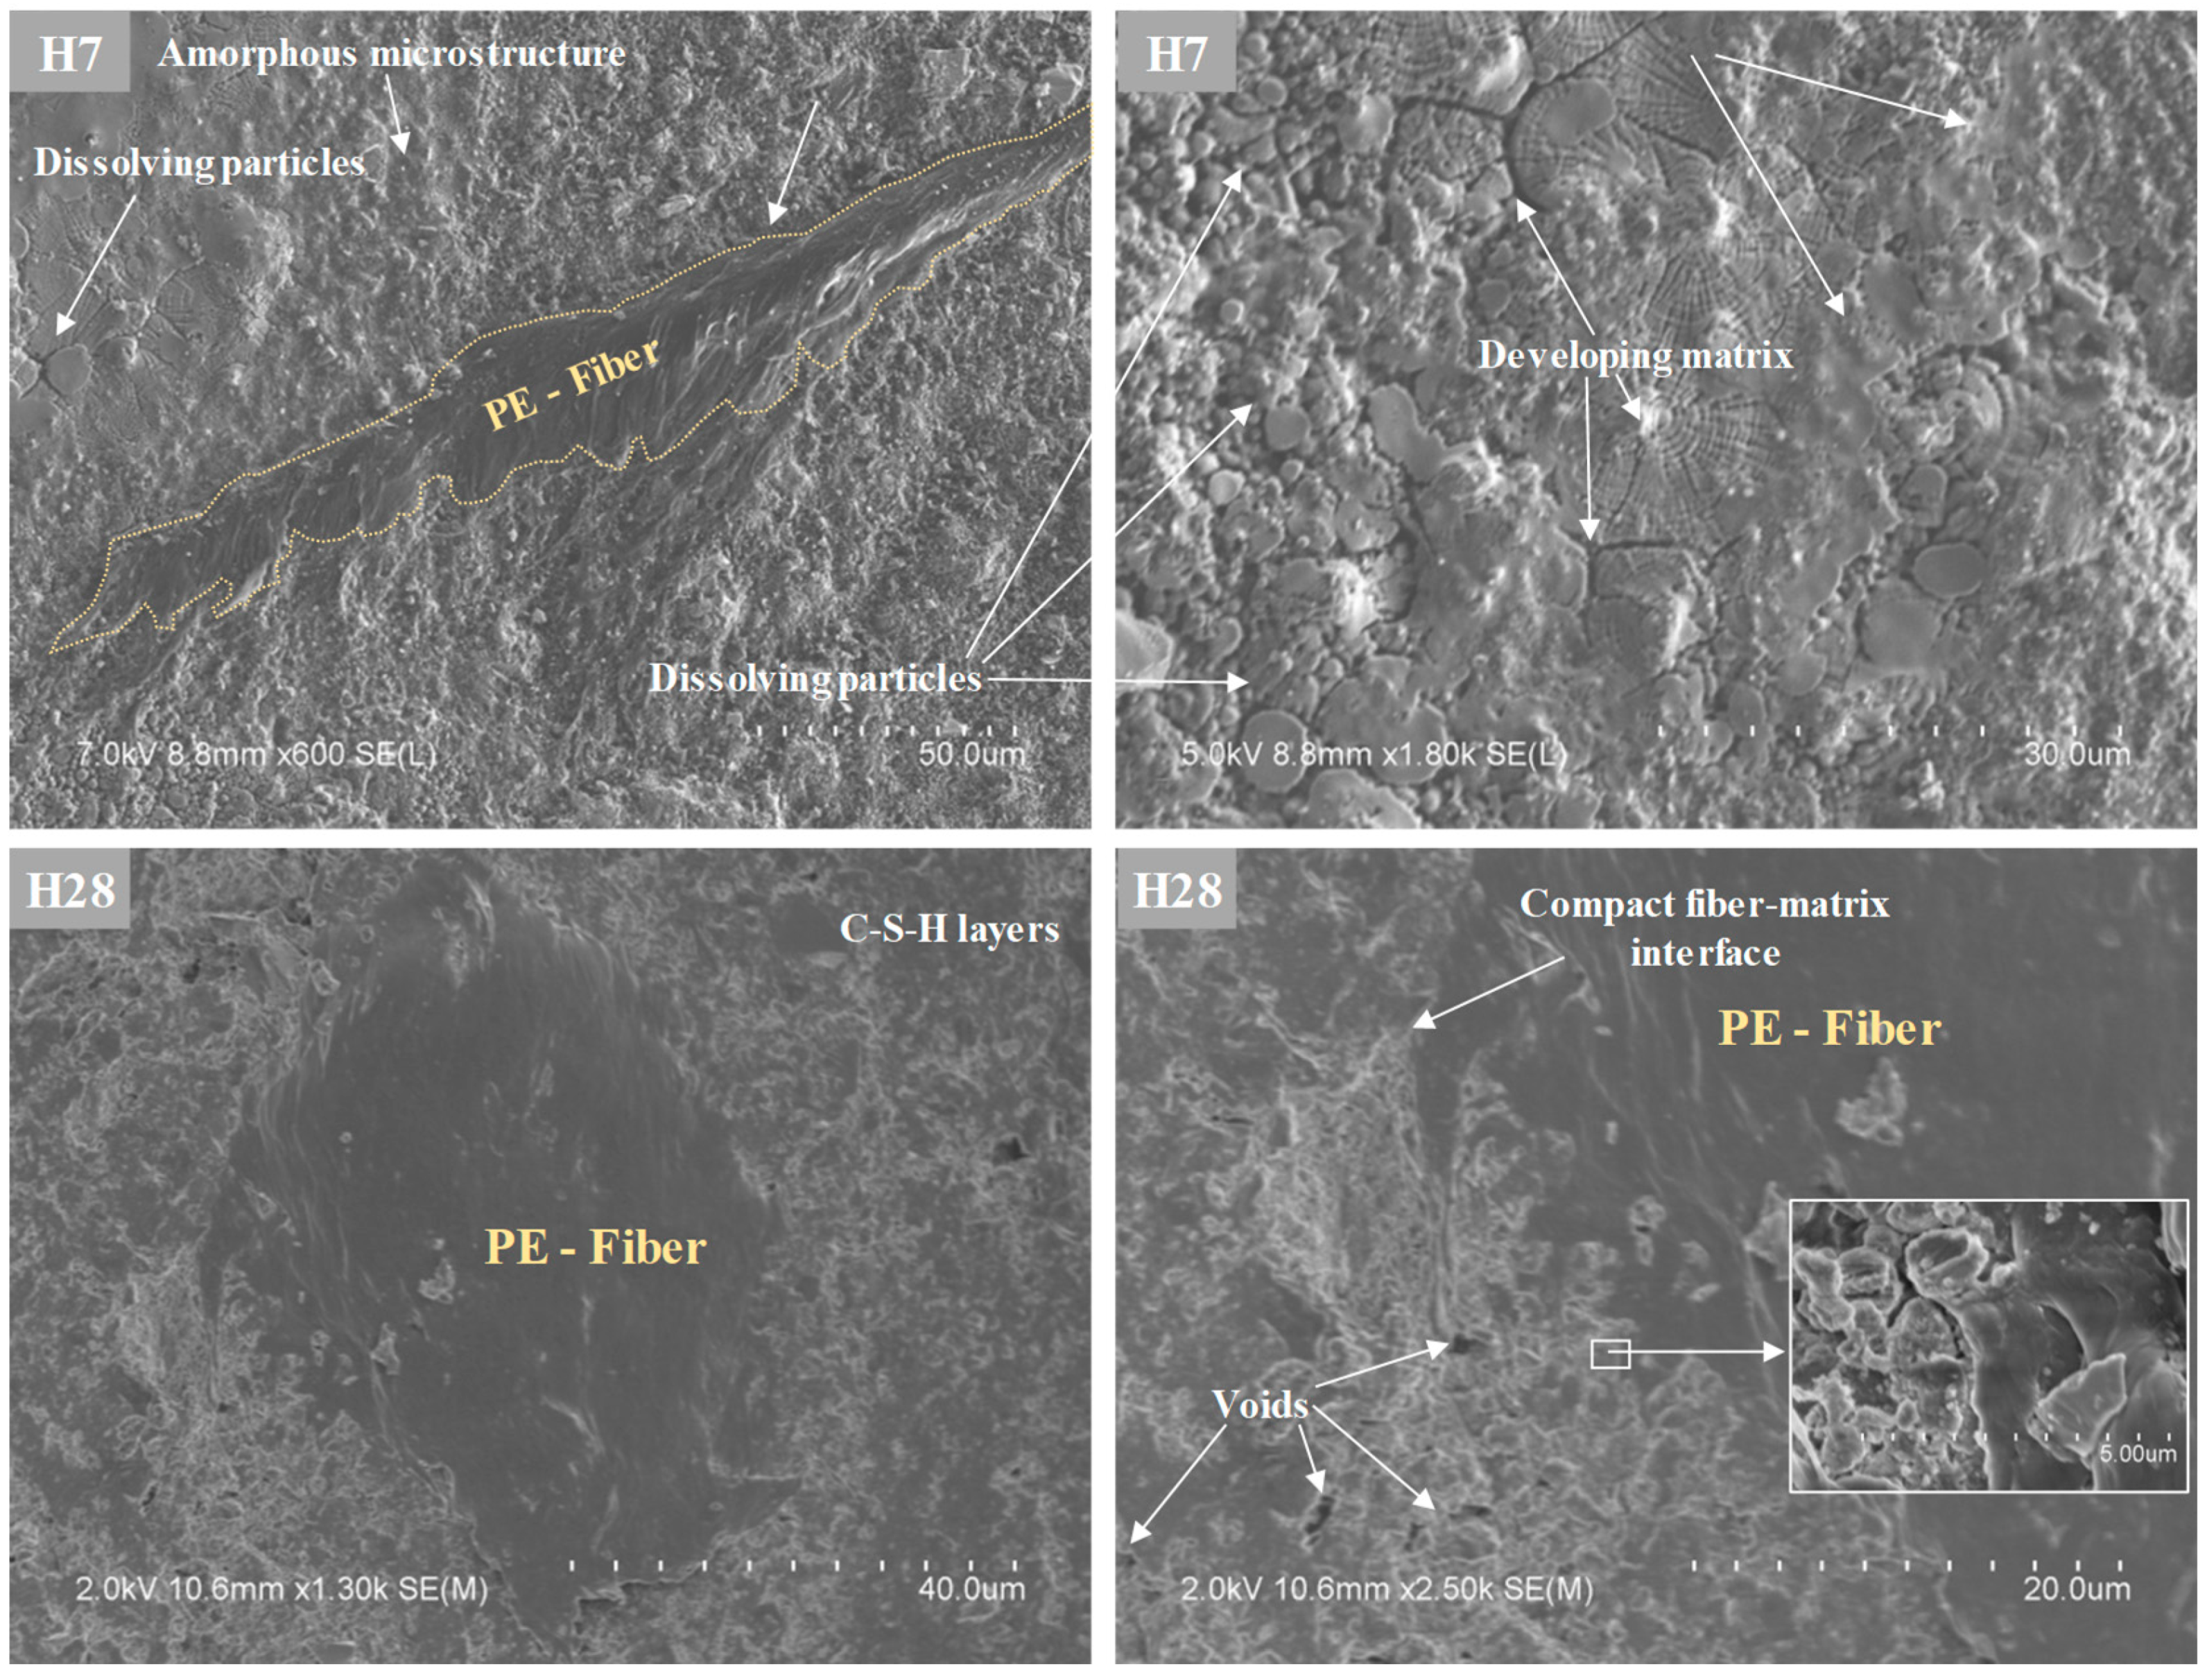
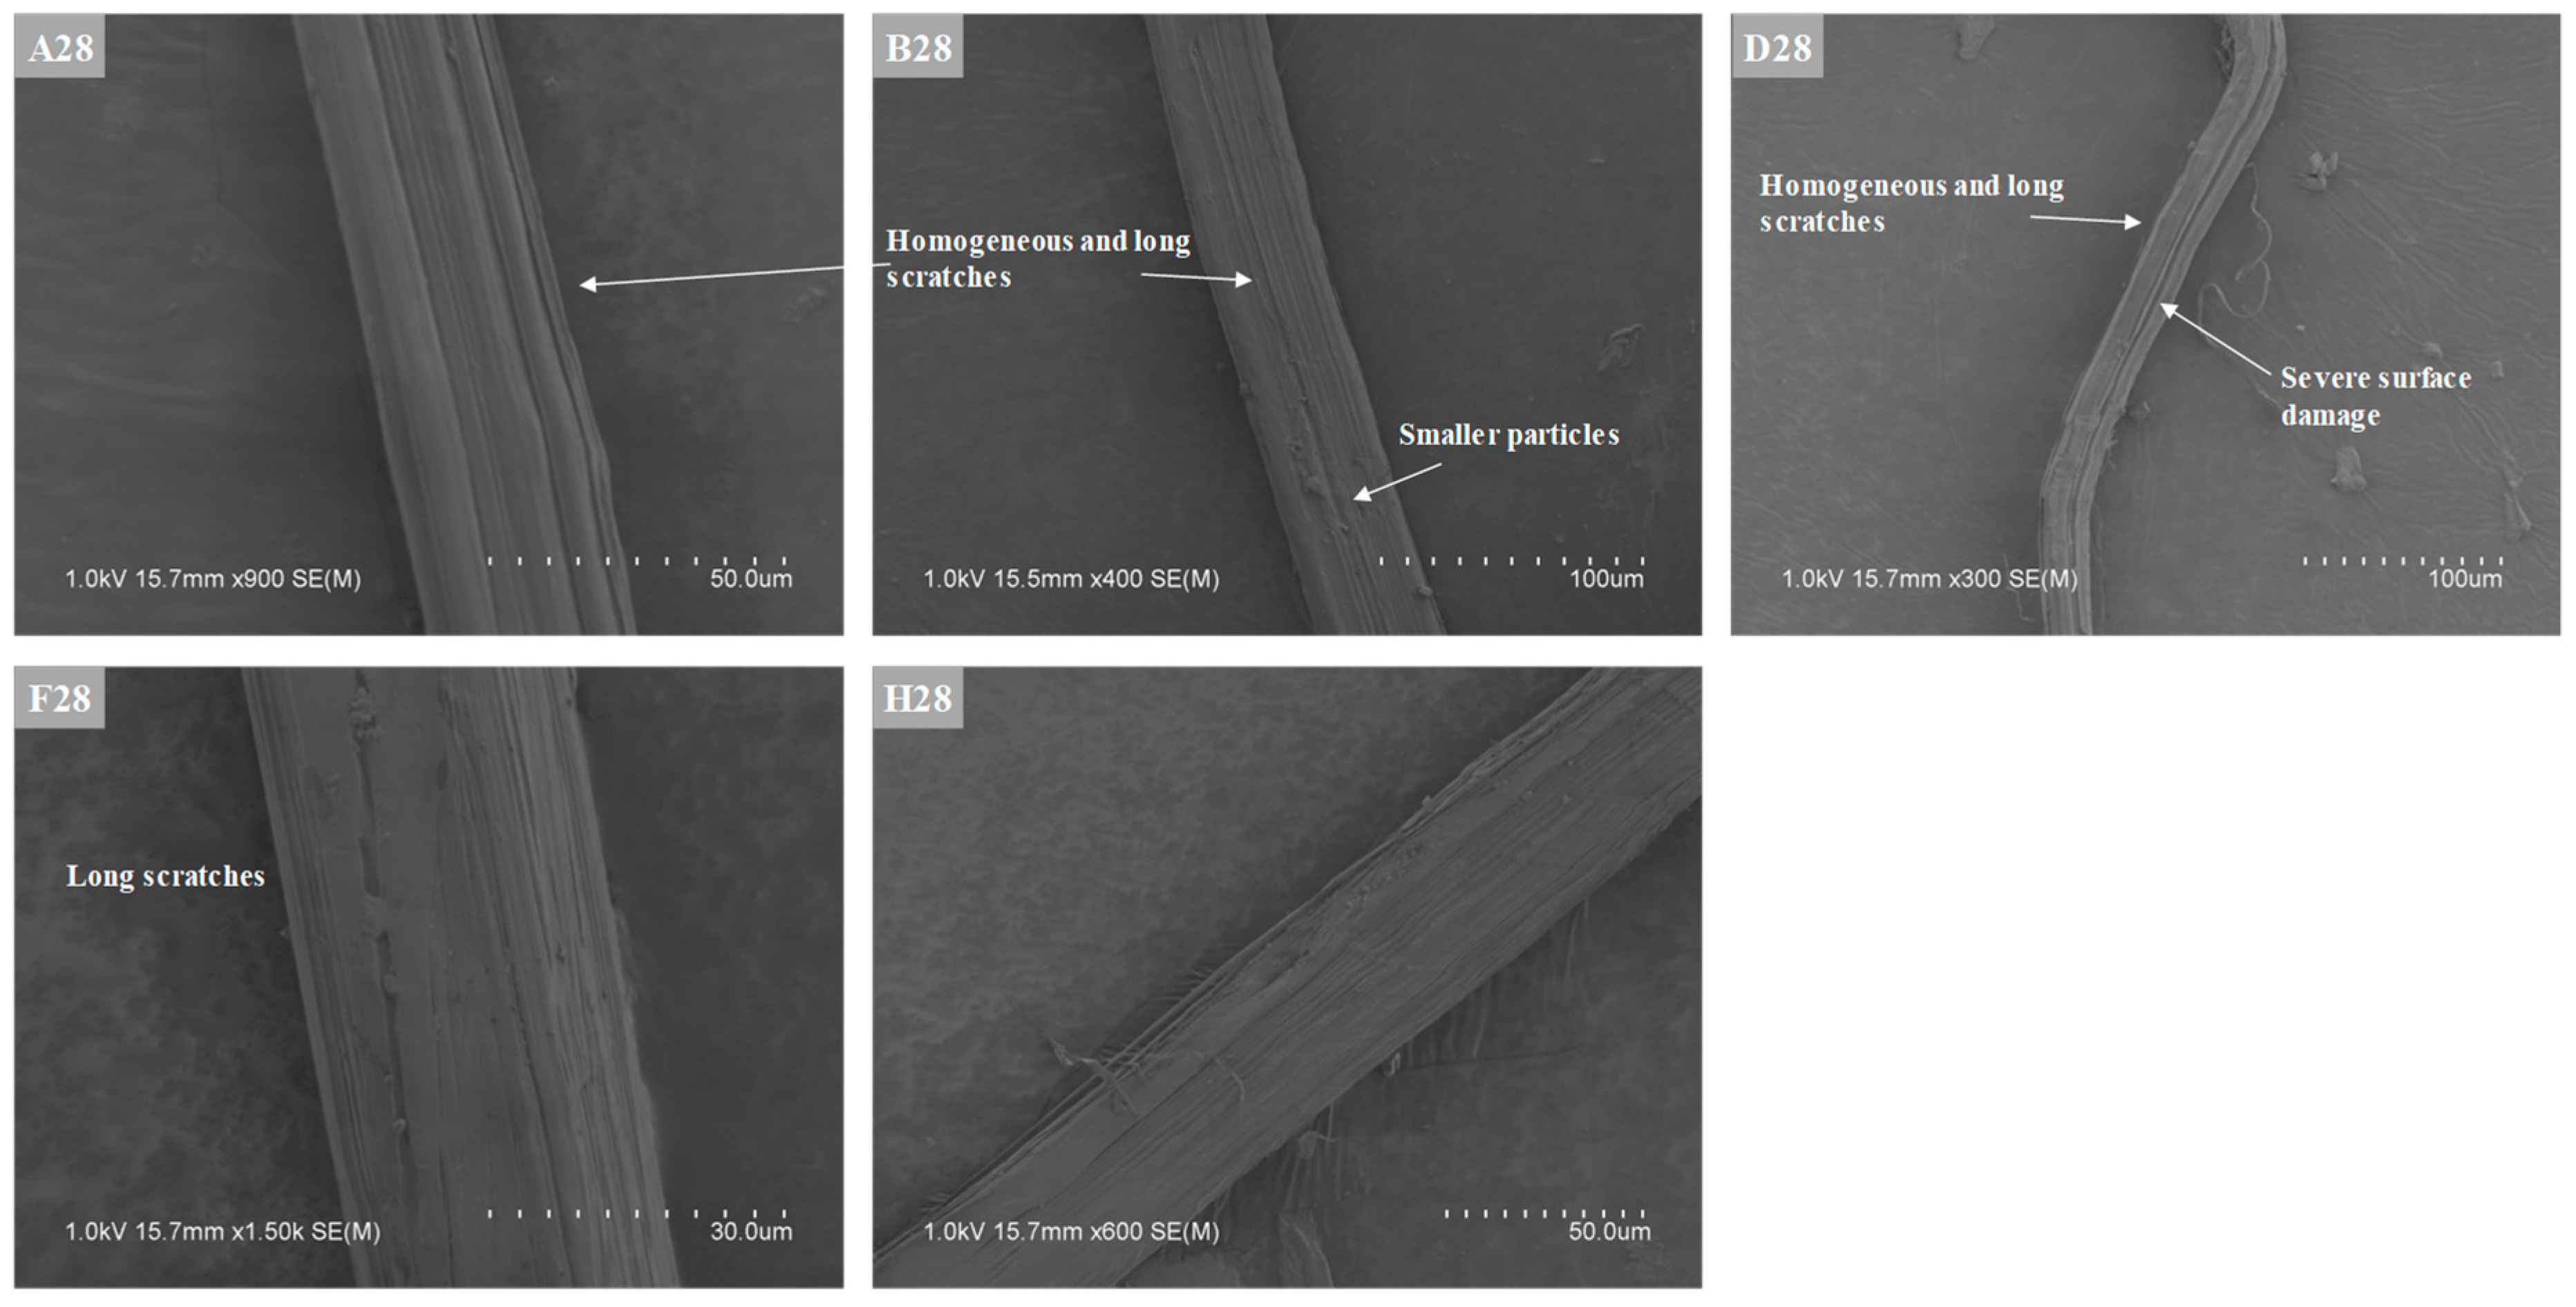
3.2. SEM Image Analysis

Figure 4, Figure 5, Figure 6, Figure 7 and Figure 8 display the SEM images on the microstructures of the UHP–SHCCs according to both the type of mineral additives included and curing time. Each figure exhibits the difference between the microstructure of the UHP–SHCC based on the curing age. Figure 4 shows the microstructure of specimens A7 and A28, respectively. It is seen that numerous spherically agglomerated particles of varying diameters were still reacting in specimen A7. Thus, the amorphous C–S–H layers did not develop enough to fill and cover the voids, resulting in a loose and irregular fiber–matrix interface. The growing hydrates observed in specimen A7 were not observed on the surface of specimen A28 as the hydrates had grown enough and formed denser amorphous C–S–H layers. The amorphous hydrates also effectively filled the empty spaces between the PE fibers and the matrix, forming a compact interface.
Because the silica flour, SF, CKD used in this study had smaller particle sizes compared to OPC, the voids in the microstructure were filled before the additives were fully reacted and dissolved. This effect becomes clearer as the small particles of the reactive additives hydrate and grow. Figure 5 shows the microstructures of specimens B7 and B28 that included the non-reactive silica flour. Unlike in specimen A7, the spherically agglomerated hydrates particles were not present in specimen B7. This can be attributed to the smaller particle size of silica flour compared to OPC that effectively fills the voids in the microstructure and disperse the particles. The microstructure of specimen B7, however, still had a porous microstructure with voids and loose fiber–matrix interfaces. In the case of specimen B28, however, the voids were filled with well-developed hydrates, and the fiber–matrix interface was compact.
Figure 6 shows the microstructures of specimens D7 and D28 with GGBS. Specimen D7 also had a porous microstructure, but it was denser than specimen A7. Although many voids and unreacted large GGBS particles were present, the microstructure of specimen D7 had a portion of developed amorphous hydrates. This can be attributed to particle size distribution in GGBS and higher specific surface area than that of the OPC. The small GGBS particles filled the voids and reacted faster than the larger ones. A clear difference in the amount of the unreacted large GGBS particles was observed between specimens D7 and D28. It was observed that while the microstructure was denser after 28 d of curing, a few unreacted GGBS particles remained.
Figure 7 presents the microstructure of specimens F7 and F28 with SF. It was observed that numbers of reacting SF particles remained in specimen F7, but most of these began to lose their spherical shape and transform into amorphous hydrates, developing the compact microstructure. Thus, the size of the voids in specimen F7 was small. In specimen F28, the amorphous hydrates covered the surface and formed a dense fiber–matrix interface. Figure 8 shows the SEM images of specimens H7 and H28 with CKD. It is observed that the microstructure and the fiber–matrix interface of specimen H7 were dense because CKD is smaller than those of the OPC. Specimen H7 had a high portion of developed amorphous layers and a more compact microstructure than the other 7 d cured specimens. It was also observed that the hydrate particles of diverse sizes were still dissolving and transforming into the amorphous layer in the microstructure of specimen H7. The hydrates continued to develop after the 7 d age, and the microstructure of specimen H28 became more compact.
The rate of the reaction of the mineral additives depends primarily on the surface area in contact with water [25]. Therefore, many hydrates with more diverse particle sizes can be generated and grow faster than when only OPC was used as the binder in the composite. Additionally, many voids in the microstructure can effectively be filled by the smaller particles of the mineral additives and their hydrates. This causes the matrix to become more compact and stronger, resulting in improved mechanical performance.

4. Mechanical Test Results and Discussion

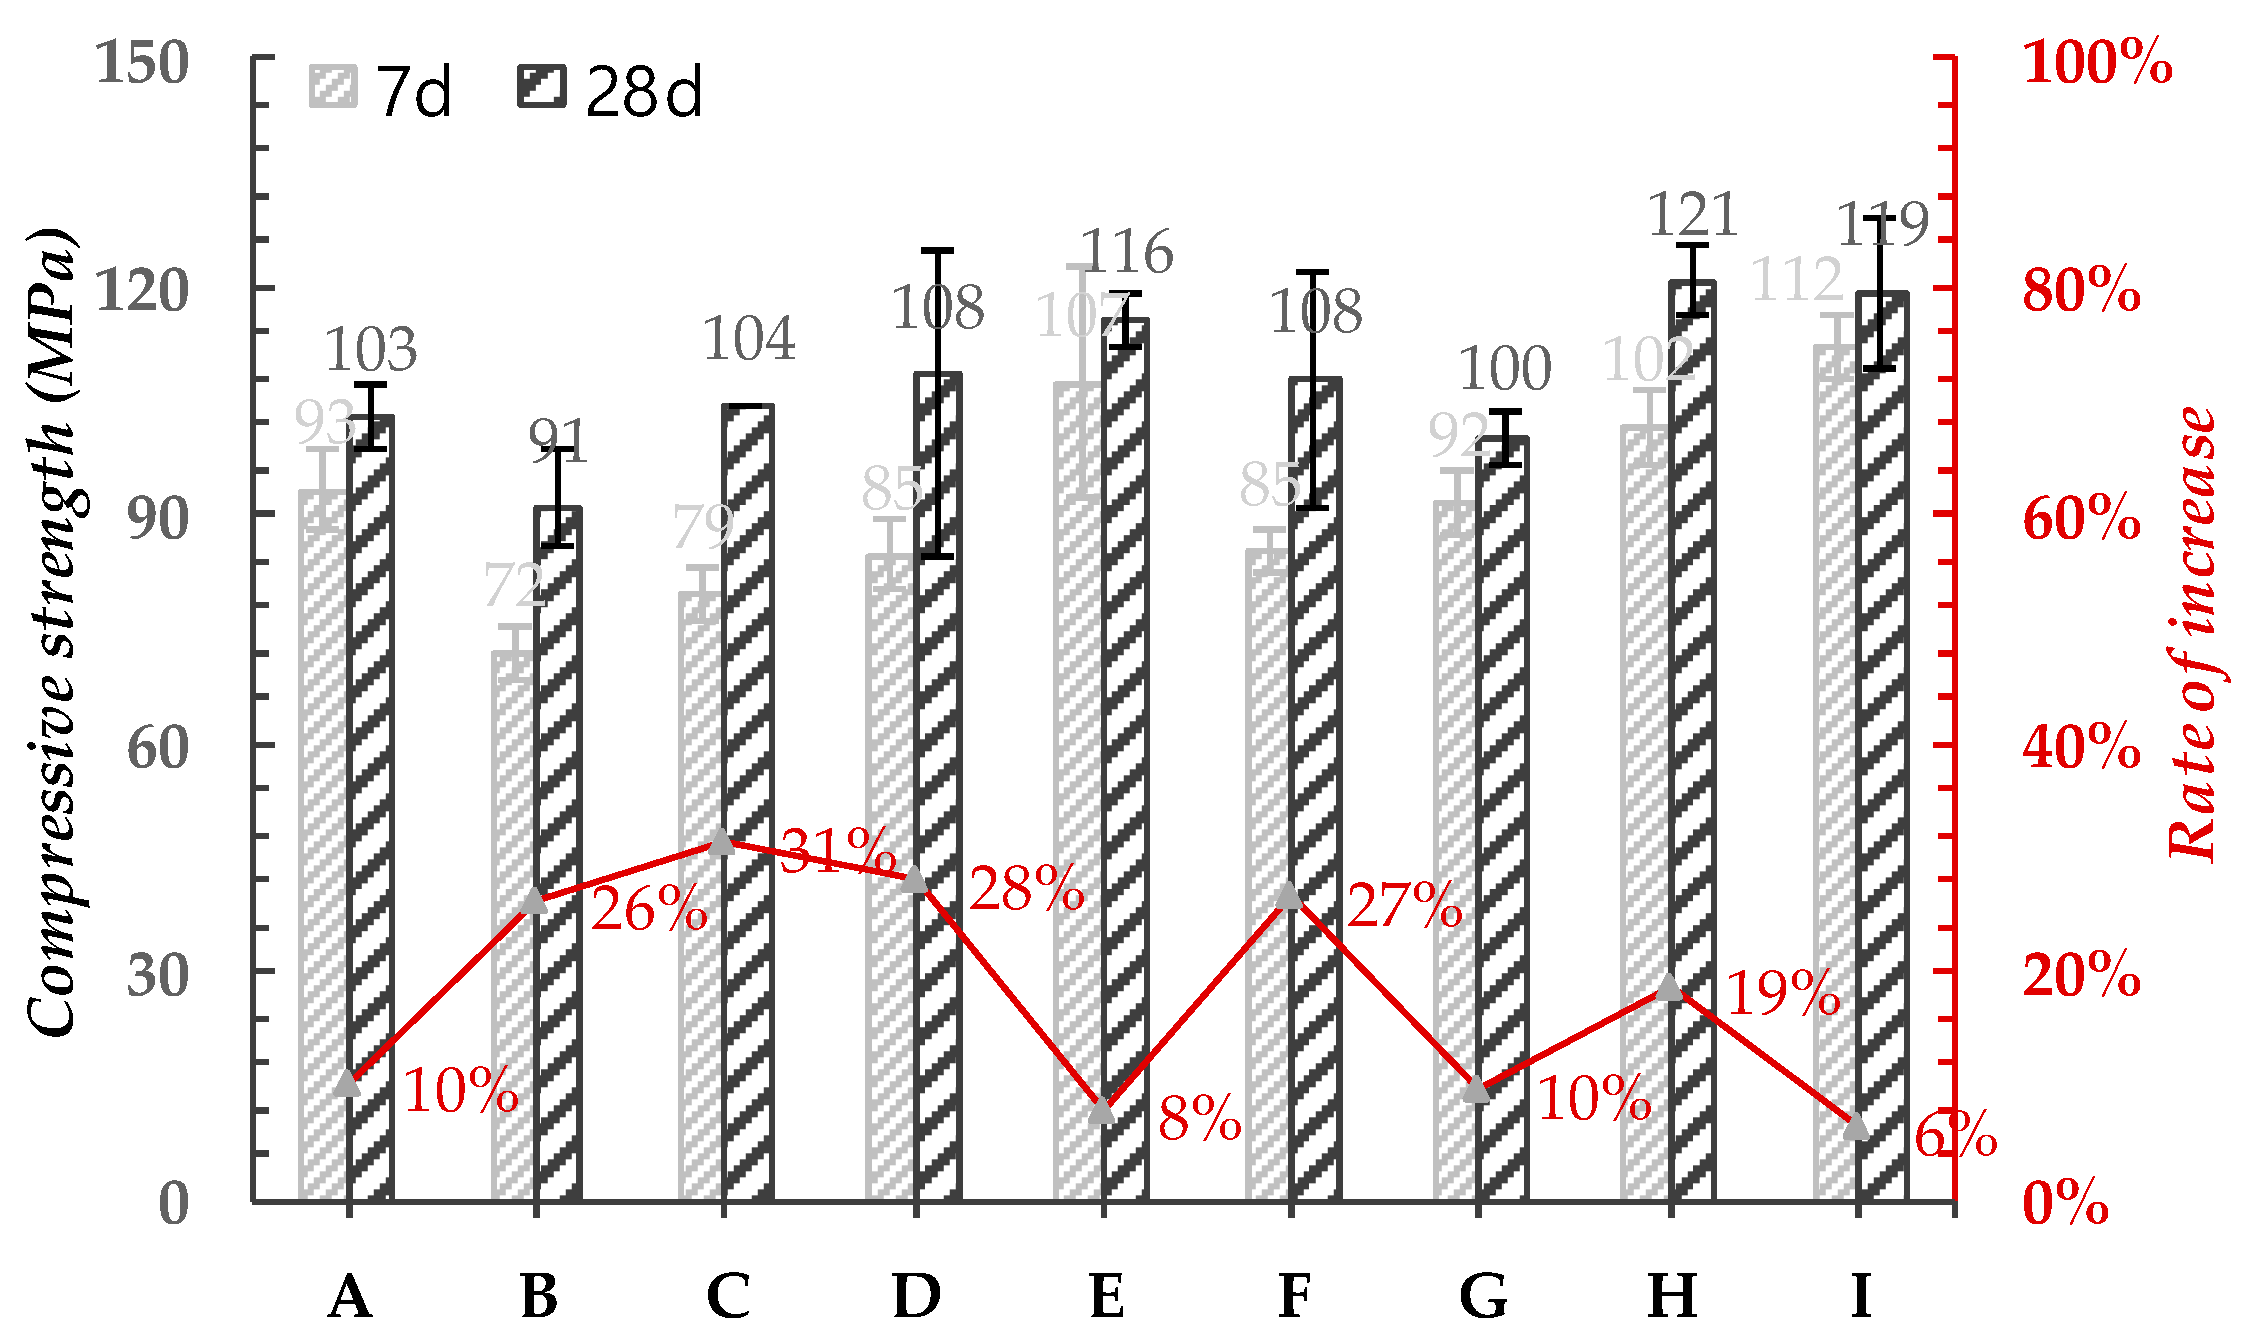
4.1. Compressive Strength

Figure 9 shows the compressive strength test results of the 7 d and 28 d cured specimens. Specimen A7, containing only OPC as a binder, exhibited a compressive strength of 93 MPa. This value varied based on the type and dosage of the mineral additives and the curing time of the specimen. Generally, the substitution of OPC with other reactive or non-reactive mineral additives lowered the compressive strength at the age of 7 d. The silica flour notably decreased the compressive strength at the early curing age to 72 and 79 MPa for specimens B7 and C7, respectively. Specimen D7, with 50% GGBS, also had a lower compressive strength of 85 MPa. Specimen E7, with 100% GGBS, however, had a higher compressive strength of 107 MPa. Specimens F7 and G7, with SF, also had lower compressive strengths of 85 MPa and 92 MPa, respectively. Lastly, specimens H7 and I7, with 15% and 30% dosages of CKD, exhibited significantly higher compressive strengths of 102 MPa and 112 MPa, respectively.
Figure 9 shows that the additional curing at 40 °C from 7 d to 28 d enhanced the compressive strength, and the degree of increase varied according to the types and dosages of the mineral additives used. Specimen A28 had a compressive strength of 103 MPa, 10.3% higher than specimen A7. Silica flour decreased the compressive strength of the 7 d cured specimens B7 and C7, as mentioned previously. However, specimens B28 and C28 showed compressive strengths of 91 MPa and 104 MPa, respectively. The rate of increase in specimens B28 and C28, compared to B7 and C7, were 26.3% and 31.2%, respectively. GGBS enhanced the compressive strength of the cementitious composites after 28 d of curing at 40 °C. Specimen D7 had a lower compressive strength than specimen A7, whereas specimens D28 and E28 had higher compressive strengths than specimen A28, measuring at 108 MPa and 116 MPa, respectively. Their rates of increase from specimens D7 and E7 were 28.0% and 7.8%, respectively. Specimens F28 and G28, with SF, also increased by 26.5% and 9.6% from those of specimens F7 and G7 to 108 MPa and 100 MPa, respectively. Lastly, the compressive strengths of specimens H28 and I28 with CKD increased by 18.8% and 6.4%, measuring 121 MPa and 119 MPa from specimens H7 and I7, respectively.
After 28 d of curing, the reactive GGBS, SF, and CKD improved the compressive strength of the specimens in comparison to that of specimen A28, which only employed OPC, except for specimen G28, which constituted 30% of SF. On the other hand, in the case of specimens B28 and C28, containing silica flour, the compressive strength was not enhanced in comparison to that of specimen A28, which employed OPC.
As mentioned earlier, the mineral additives, which secondarily react in the hydrating cementitious composite, require more time than OPC. Even though the mineral additives contain smaller sizes than those present in OPC and fill the voids, the rate of compressive strength development resulting from the bond between various components generally becomes slower. It was observed from the SEM images shown in Figure 4, Figure 5, Figure 6, Figure 7 and Figure 8 that the particles in the mineral additives could effectively densify the matrix in the cementitious matrix but still dissolved in the matrix of the 7 d cured specimens. However, in the case of CKD, the specimens exhibited direct reactivity and a higher specific surface area than OPC. This led to the rapid growth of hydrates of various sizes and properties that could bind the matrix. However, as reported by Naseer [10], the SF substituting more than 20% of OPC decreases the rate of compressive strength development at an early stage due to a limit on the concentration of the CH. Figure 7 also shows that the microscopic SF particles could fill the voids in the cementitious matrix but continued to dissolve in the matrix of specimen F7. Therefore, the 7 d cured specimens, including SF, had lower compressive strength as compared to specimen A7.

4.2. Tensile Behavior

4.2.1. Tensile Stress and Strain Curve

In Figure 10, the tensile stress versus strain curves for specimens cured in a 40 °C water tank for 7 d and 28 d are presented. It was shown that some of the 7 d cured specimens have higher post-cracking stiffness than that of 28 d cured specimens. For the 7 d cured specimens, the tensile stress drastically increased up to 1.6% of the strain. Then, the post-cracking stiffness decreased until the strain hardening behavior stopped. On the other hand, in cases of 28 d cured specimens, the post-cracking stiffness was maintained almost linearly up to the peak point. Moreover, it was noted that the tensile stress–strain curves consistently fluctuated, exhibiting rapid stress drops in the strain-hardening section. In general, the 7 d cured specimens generally had a lower number of drops in tensile stress in the strain-hardening section as compared to those of 28 d cured specimens.
The types of mineral additives also largely influenced the post-cracking behavior, as shown in Figure 10. Specimen A7, constituting only OPC as a binder, exhibited a drastic increase and few drops in tensile stress in the strain-hardening section. The silica flour and GGBS increased the initial post-cracking stiffness of specimens ranging from B7 to E7 without increasing the number of drops in the tensile stress. Specimens F7 and G7 uniquely demonstrated linear post-cracking stiffness without a drastic increase at an early stage as compared to other 7 d cured specimens. CKD also reduced the initial post-cracking stiffness in specimens H7 and I7 as compared to that of specimen A7. However, the post-cracking stiffness was still higher than those of specimens F7 and G7, using SF. Nevertheless, CKD enabled the 7 d cured specimens to exhibit excellent strain hardening performance similar to that of the 28 d cured specimens. For all specimens, the post-cracking stiffness decreased as the curing time increased from 7 d to 28 d, and the 28 d cured specimens demonstrated a higher number of drops in tensile stress and maintained strain hardening behaviors over 6%.

4.2.2. Tensile Strength and Strain Capacity

The actual tensile strength and strain capacities are summarized in Figure 11. Furthermore, the actual test parameters do not precisely match the averaged curves shown in Figure 10. Figure 11 shows that the substitution of OPC with silica flour, GGBS, and CKD resulted in higher tensile strength at 7 d, whereas SF decreased the tensile strength. Moreover, the strain capacity of the 7 d and 28 d cured specimens was notably improved by substituting OPC with reactive mineral additives. The specimens A7, B7, and C7, which only constituted OPC as a binder, developed tensile strengths of 9.7 MPa, 10.8 MPa, and 10.2 MPa and strain capacities of 1.7%, 1.1%, and 2.6%, respectively. However, specimens D7 and E7, employing GGBS, had tensile strengths of 13.7 MPa and 10.3 MPa, and their strain capacities were higher than that of specimen A7, measured at 2.9% and 2.6%, respectively. This became more significant for the specimens ranging from F7 to I7, consisting of SF and CKD. The specimens F7 and G7, using SF, exhibited tensile strengths of 8.5 MPa and 6.6 MPa and strain capacities of 4.6% and 2.8%, respectively. Moreover, specimens H7 and I7, containing CKD, exhibited the tensile strengths of 11.6 MPa and 10.5 MPa and very high strain capacities of 7.5% and 5.2%, respectively.
It was also noted that an increase in the amount of the mineral additives resulted in a decrease in the tensile performance of the specimens ranging from D7 to I7, consisting of GGBS, SF, and CKD. The specimens D7, F7, and H7, with smaller dosages of GGBS, SF, and CKD, exhibited greater tensile strength and strain capacities than that of specimens E7, G7, and I7, respectively. The tensile strength and strain capacity of specimen D7, which comprised 50% of GGBS, was 13.7 MPa and 2.9%, respectively. However, these values decreased to 10.3 MPa and 2.6%, respectively, as the proportion of GGBS was increased to 100% for specimen E7. Similarly, specimens F7 and H7, which contained 20% of SF and 15% of CKD, exhibited tensile strengths of 8.3 MPa and 11.6 MPa and strain capacities of 4.6% and 7.5%, respectively. These values also decreased to 6.6 MPa and 10.5 MPa and 2.8% and 5.2%, respectively, as 10% of the SF and 15% of the CKD substituted the OPC in specimens G7 and I7, as shown in Figure 11.
Figure 10b also shows the tensile stress–strain curves for the same specimens cured for 28 d in the 40 °C water tank. Figure 11b summarizes the tensile strength and strain capacities of the five specimens for each variable. All the specimens ranging from A28 to G28 and consisting of OPC, silica flour, GGBS, or SF exhibited considerably improved tensile behavior as compared to the 7 d cured specimens except for specimens H28 and I28 using CKD. The strain-hardening behavior of the specimens ranging from A28 to E28 was extended by over 6.0% and exhibited tensile strengths ranging between 8.2 MPa and 11.6 MPa. Moreover, it is notable that even specimen A28, which only comprised OPC as a binder along with silica sand, attained fine strain-hardening behavior. The specimen A28 exhibited a tensile strength of 11.6 MPa and a strain capacity of 6.2%, respectively. Subsequently, specimens B28 and C28 comprising silica flour had tensile strengths of 8.5 MPa and 10.1 MPa and strain capacity of 6.6% and 7.3%, respectively. Specimens D28 and E2, using GGBS, exhibited a tensile strength of 10.2 MPa and 11.3 MPa and strain capacities of 6.9% and 6.6%, respectively. Specimens F28 and G28, using SF, exhibited relatively low tensile strengths of 8.2 MPa and 8.7 MPa, but high strain capacities of 7.2% and 6.0%, respectively. Moreover, the tensile performance of specimens H28 and I28, using CKD, was also high, exhibiting tensile strengths of 9.7 MPa and 9.6 MPa and strain capacities of 6.8% and 6.9%, respectively.
It was noted that the increase in the dosage of the mineral additives resulted in greater tensile strength for the 28 d cured specimens in contrast with the cases of the 7 d cured specimens. As introduced previously, the tensile strength of specimens B7, D7, F7, and H7 consistently decreased with an increase in the dosage of the mineral additives. The tensile strength of specimens C7, E7, G7, and I7 were 6%, 25%, 22%, and 9% lower than those of specimens B7, D7, F7, and H7, respectively. On the contrary, in the case of specimens B28, D28, F28, and H28, the tensile strength increased by 20%, 11%, 5%, and 0% for specimens C28, E28, G28, and I28, respectively. The strain capacities, meanwhile, consistently decreased as the dosage of substituted OPC increased for both 7 d and 28 d cured specimens. The degrees of decrease, according to the increases in contents of substituted OPC, however, were lower for the 28 d cured specimens. The strain capacities of specimens B7, D7, F7, and H7 changed by 105%, −10%, −39%, and −31% for specimens C7, E7, G7, and I7, respectively. These rates for specimens B28, D28, F28, and H28 were 11%, −5%, −17%, and 2%, respectively.

4.2.3. Discussion on Tensile Behavior

In general, the 7 d cured specimens, containing GGBS, SF, or CKD, exhibited a more significant strain-hardening behavior than specimen A7 comprising only OPC. As discussed previously, the microstructural analysis found that the matrix of 7 d cured specimens was densified by substituting OPC with the mineral additives that contained smaller particles even prior to their complete reaction. Moreover, specimens employing CKD showed significantly higher strain capacities than other 7 d cured specimens. With regards to the tensile behavior of fiber-reinforced cement composites (FRCCs), fiber–matrix interaction constitutes one of the essential factors. Thus, the surface of PE fibers, pulled from each specimen, was captured in SEM images, as shown in Figure 12 and Figure 13. It was observed that the fibers of 7 d cured specimens using OPC, silica flour, and GGBS, namely, A7, B7, and D7, had irregular patterns of scratches or pits on their surface regardless of the degree of damage. In other words, the length, width, depth, and direction of the scratches and pits were irregular in the 7 d cured specimens. This is thought to result from the unreacted particles, constituting the microstructure, captured in Figure 4, Figure 5, Figure 6, Figure 7 and Figure 8. Figure 12 also shows that the fibers of 7 d cured specimens, using SF and CKD, had more homogeneous scratches that stretched longer than the other fibers of 7 d cured specimens. This is attributed to the faster formation of the compact microstructure of the specimens containing SF and CKD. Both materials have a high specific surface area to fill the voids and reactivity to react and enhance the bond between components, as explained earlier based on Figure 7 and Figure 8. The two materials, thus, could result in higher strain-hardening behavior in the cementitious composite earlier than other mineral additives. Therefore, the difference in the microstructure and tensile behavior, caused by the longer curing time, was not as considerable, as in the case of the other specimens.
In the case of the fibers of 28 d cured specimens, the homogeneous scratches, running through the fiber, covered the fiber surface, as shown in Figure 13. This indicates that the 28 d cured matrices provided each fiber with more homogeneous and longer-lasting pullout resistance as compared to the 7 d cured specimens. Figure 10 already demonstrated that the tensile stress–strain curves fluctuated while the strain-hardening behavior and the height of the drops were generally more prominent for the 7 d cured specimens than of the 28 d cured specimens. As the large particles, rather than the compact amorphous hydrates, form the loose and irregular fiber–matrix interface, not only are many voids present, but the particles can also cause a concentration of the pullout resistance and damage specific points of the fibers. This facilitates deterioration of the fiber–matrix interaction and results in a higher drop in the tensile stress when the fiber–matrix interface is broken. Moreover, this eventually reduces the strain capacity of the UHP–SHCC. This mechanism will further be discussed alongside the cracking behavior, later in this paper. In Figure 12 and Figure 13, it was also noted that matrix particles with diverse diameters were detached from the matrix during the tensile test and stuck to the fiber surface. This implies that the fiber–matrix interface consisting of large particles lost their pullout resistance rapidly when the particles detached from the matrix.

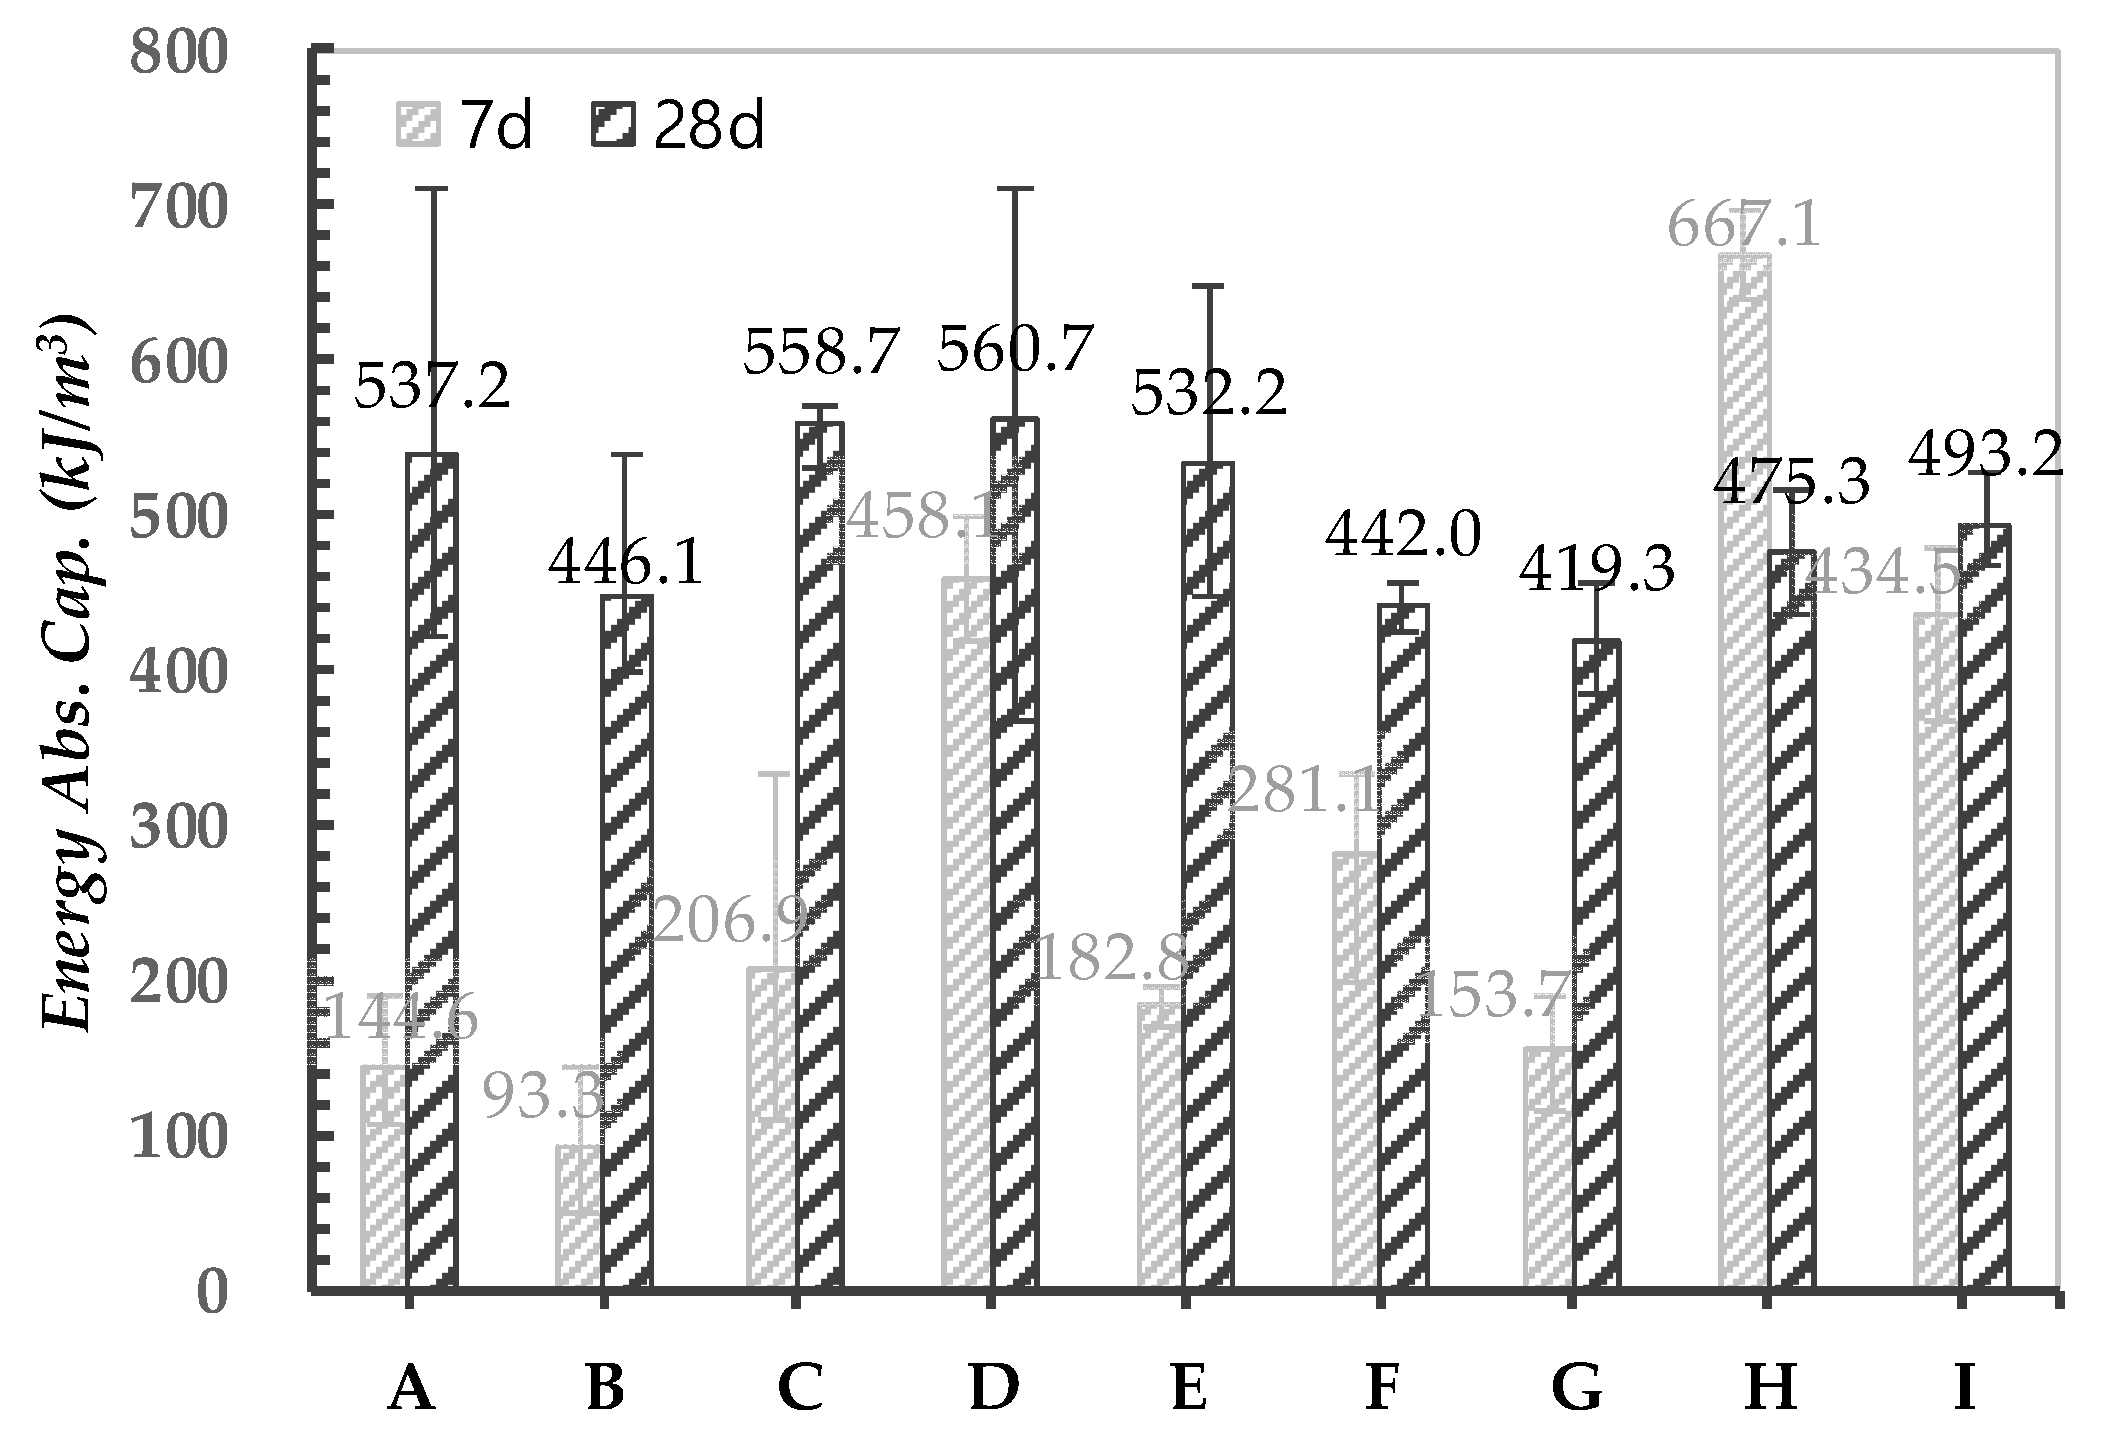
4.2.4. Energy Absorption Capacity

Figure 14 shows the energy absorption capacity of the 7 d and 28 d cured specimens, obtained by measuring the area under the stress–strain curves up to the peak point, as shown in Figure 10a,b. It is seen that specimens D7, F7, and H7 with smaller dosages of GGBS, SF, and CKD absorbed considerable energies with values of 458.1 kJ/m3, 281.1 kJ/m3, and 667.1 kJ/m3, respectively. However, as the contents of the mineral additives increased, the values decreased to 182.8 kJ/m3, 153.7 kJ/m3, and 434.5 kJ/m3 for specimens E7, G7, and I7, respectively. On the other hand, specimens A7, B7, and C7 absorbed relatively low energies of 144.6 kJ/m3, 93.3 kJ/m3, and 206.9 kJ/m3 and exhibited higher energy absorption capacities on increasing the proportion of silica flour.
As the curing time increased to 28 d, the energy absorption capacity increased enormously as compared to that of 7 d cured specimens except for specimen H. Specimens D28, F28, and H28 with smaller dosages of GGBS, SF, and CKD exhibited energy absorption capacities of 560.7 kJ/m3, 442.0 kJ/m3, and 475.3 kJ/m3, respectively. Moreover, energy absorption capacities of specimens E28, G28, and I28, with higher dosages of mineral additives, were measured at 532.2 kJ/m3, 419.3 kJ/m3, and 493.2 kJ/m3, respectively. Unlike in the case of 7 d cured specimens, the increase in the contents of the mineral additives did not cause significant decreases in the energy absorption capacity of the 28 d cured specimens. In the case of GGBS and SF, this is attributed to the slower rate of reaction than that of OPC. On the other hand, in the case of CKD, the higher energy absorption capacity of specimen I28, as compared to that of H28, can be attributed to the fast reaction of the materials and the lower amount of the total hydrates, as discussed earlier. The higher amount of the non-reactive silica flour also resulted in the higher energy absorption capacity of specimen C than that of specimen B at both 7 d and 28 d. Specimens A28, B28, and C28 exhibited significantly increased energy absorption capacities as compared to those of the 7 d cured specimens with values of 537.2 kJ/m3, 446.1 kJ/m3, and 558.7 kJ/m3, respectively.

4.2.5. Ratio of Test Parameters

Figure 15 shows the ratios of the test parameters at 7 d and 28 d, namely, compressive strength, tensile strength, strain capacity, and energy absorption capacity. As mentioned previously, it was noted that most of the 7 d cured specimens exhibited higher tensile strength than those of 28 d cured specimens, unlike in the case of the compressive strength. All the 7 d–28 d tensile strength ratios were higher than 77%, and most of them exceeded 100%, whereas those of the compressive strength ranged between 76% and 94%. This denotes that the tensile strength was not proportional to the development of compressive strength. Meanwhile, the 7 d–28 d strain capacity ratios were measured down to 16%. As discussed previously, this can be attributed to the porous and irregular microstructure and to large particles at the fiber–matrix interface of the 7 d cured specimens. For the energy absorption capacity, the 7 d–28 d ratios also measured below 88% except for specimen H, which was measured as 140%. Furthermore, it is also noted that the 7 d–28 d ratios for the energy absorption capacity significantly increased as GGBS, SF, CKD was incorporated into the mix. This denotes that the property and development of the microstructure primarily influence the tensile performance when considering the results of microstructural inspections.

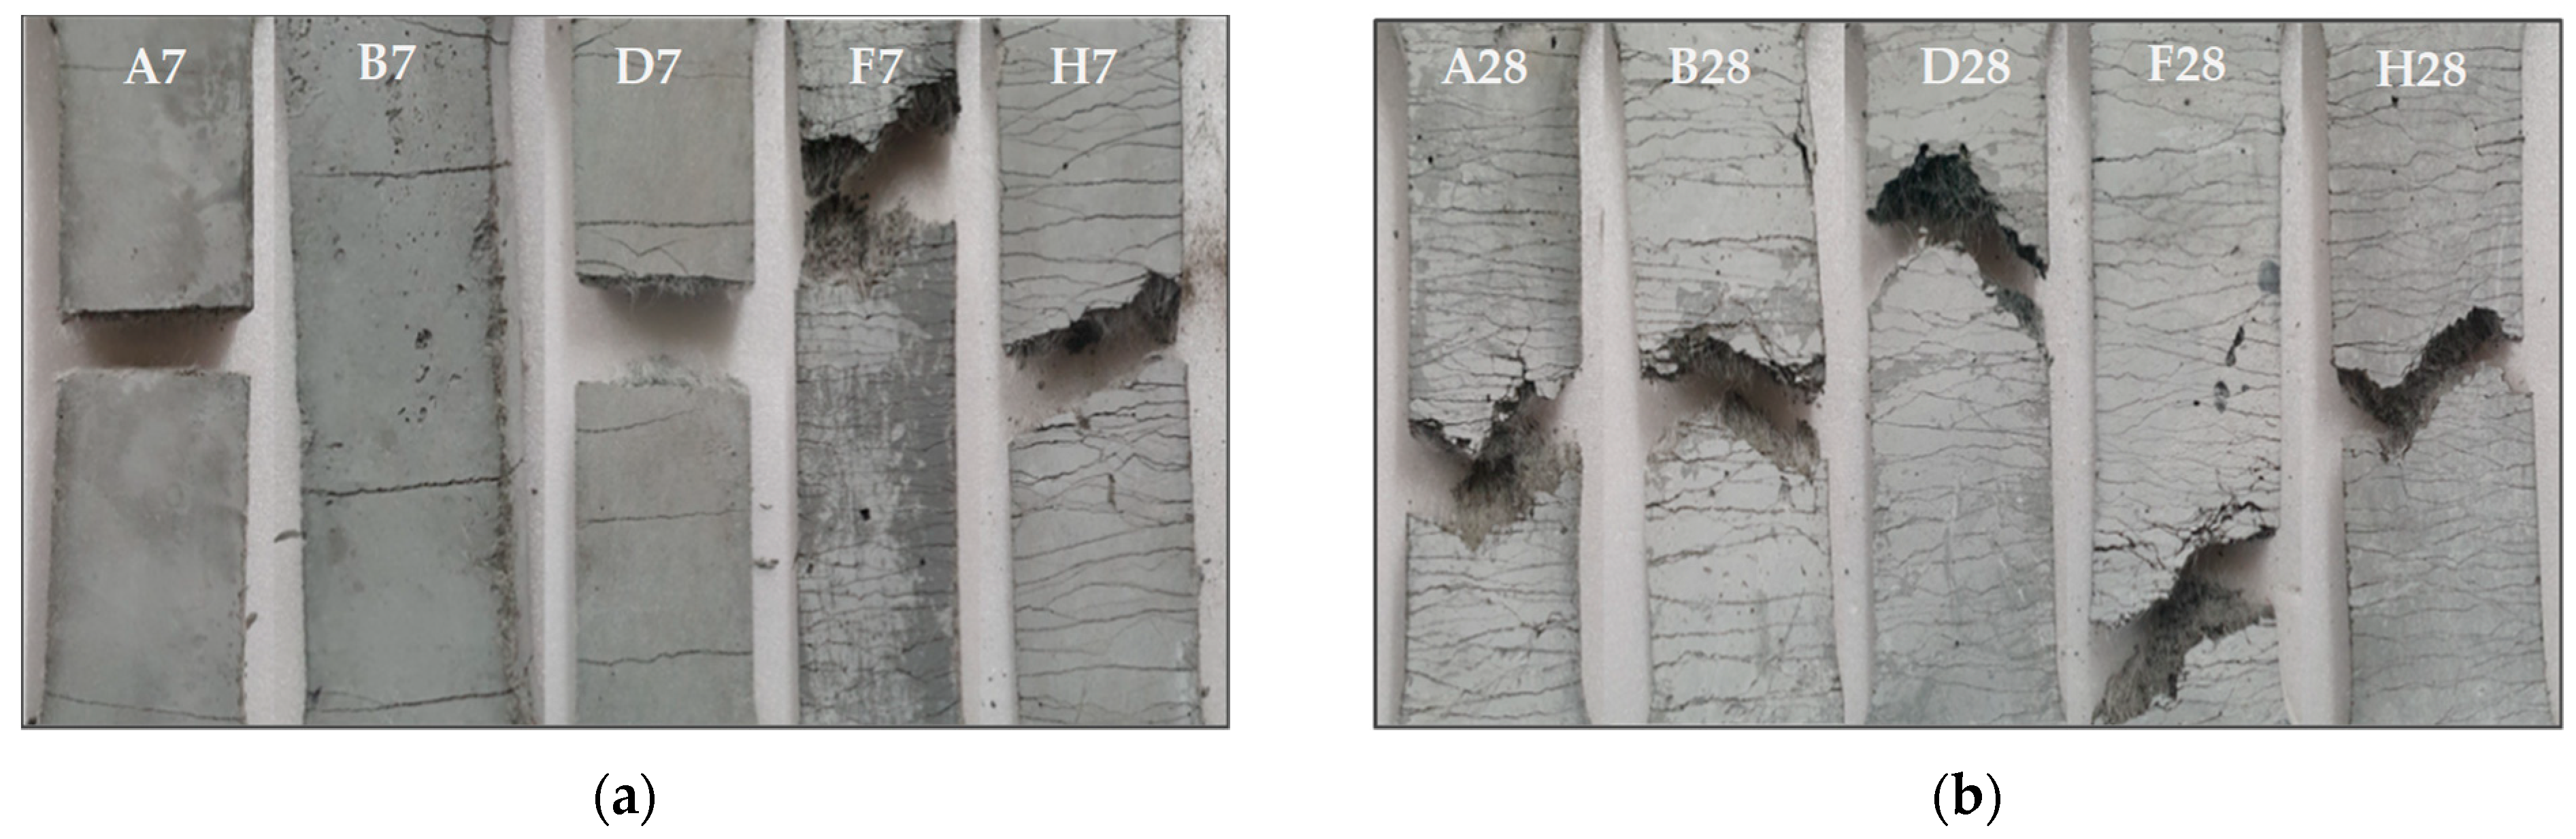
4.2.6. Crack Patterns

Figure 16 shows the representative cracking patterns of the UHP–SHCCs tested in this study. Table 4 summarizes the number of cracks, the number of drops in the tensile stress in the strain-hardening section, strain capacity, and energy absorption capacity. The number of cracks in each specimen was obtained by averaging the numbers of cracks counted on the top and bottom of the gauge region. Furthermore, the number of drops in the tensile stress was counted from the tensile stress–strain curve of the individual specimens for each variable and averaged.
During the tensile test, it was observed that the cracks formed when there were drops in the tensile stress and that the cracking behavior varied according to the type of mineral additives and curing time. Table 4 suggests that the specimens ranging from A7 to E7 using OPC, silica flour, or GGBS had cracks less than 13 ea, whereas the specimens ranging from F7 to I7 using SF or CKD had cracks ranging between 17 and 29 ea. All the 28 d cured specimens, on the other hand, had more cracks ranging between 27 and 39 ea. It was noted that specimens F, H, and I that had the highest number of cracks among the 7 d cured specimens did not have the highest number of cracks among the 28 d cured specimens. The specimens C28 and D28 using silica flour or GGBS had the most cracks, measured at 39 ea.
Figure 17 demonstrates that the number of cracks was linearly proportional to the test parameters, namely, the number of drops in tensile stress, strain capacity, and energy absorption capacity. It is observed in Table 4 that the number of drops in tensile stress–strain curves was consistently higher than the number of cracks. The drops of the tensile stress have occurred because of the crack formation and the deterioration of the fiber–matrix interactions. As the tensile stress increases high enough to damage certain fiber–matrix interfaces at the most vulnerable section, the weakest interface would be broken and the fiber would abruptly be pulled out. Then, the section fails to hold the drastically increased tensile stress until the other fibers seize it and transfer the increased stress [26]. The process may produce cracks but may not all the time. This was the reason why the numbers of drops in curves were higher than the number of cracks observed on the tested specimens.

5. Conclusions

Compressive strength and direct tensile tests were performed on nine mixes of UHP–SHCCs. The nine mixes consisted of OPC and reactive and non-reactive mineral additives, namely, silica flour, GGBS, SF, and CKD that substituted a portion of the OPC in each specimen. The microstructural characteristics, resulting from the type of the mineral additives and curing conditions were investigated with TG–DTG and SEM inspections. The mechanical test results were analyzed to specifically examine the influence of each type of mineral additive, and the following conclusions were derived:
  • At the curing age of 7 d, only the CKD-included specimens exhibited higher compressive strength than the mix with only OPC as a binding material. After 28 d of curing, the reactive GGBS, SF, and CKD have strengthened the compressive strength of the specimens in comparison to that of the specimen with only OPC, except for the specimen incorporating 30% of SF. On the other hand, in the case of specimens containing the non-reactive silica flour, the compressive strength decreased;
  • The strain capacity of the 7 d cured specimens was improved by substituting the OPC with the reactive mineral additives. In particular, specimen H7, containing the 15% CKD, demonstrated the highest tensile performance with a tensile strength of 11.6 MPa and strain capacity of 7.5%;
  • Most of the 28 d cured specimens with OPC, silica flour, GGBS, or SF, exhibited considerably improved tensile behavior compared to the 7 d cured specimens, except for specimens H28 and I28, with CKD. The strain-hardening behavior of specimens A28 to E28 was extended by over 6.0%, and the tensile strength ranged between 8.2 MPa and 11.6 MPa;
  • At the curing age of 7 d, specimens with OPC and silica flour, absorbed lower energies than the specimens with the GGBS, SF, and CKD. Moreover, the 28 d cured specimens, exhibited significantly increased energy absorption capacities compared to the 7 d cured specimens, reaching 558.7 kJ/m3;
  • For practical applications of UHP–SHCCs, the use of 15% of CKD is recommended when securing the early age mechanical performance is a priority, and the use of 50–100% of GGBS and 20% of SF is recommended to optimize mid- to long-term performance.

Author Contributions

Conceptualization, M.-J.K.; methodology, M.-J.K., B.C., and H.-J.C.; formal analysis, M.-J.K. and W.S.; investigation, M.-J.K.; data curation, M.-J.K. and H.-J.C.; writing—original draft preparation, M.-J.K.; writing—review and editing, D.-Y.Y.; visualization, M.-J.K.; supervision, D.-Y.Y.; funding acquisition, D.-Y.Y. All authors have read and agreed to the published version of the manuscript.

Funding

This research was supported by a Grant (21CTAP-C152069-03) from the Technology Advancement Research Program funded by the Ministry of Land, Infrastructure, and Transport of the Korean government.

Institutional Review Board Statement

Not applicable.

Informed Consent Statement

Not applicable.

Data Availability Statement

Not applicable.

Conflicts of Interest

The authors declare no conflict of interest.

References

  1. Lankard, D.R. Slurry infiltrated fiber concrete (SIFCON): Properties and applications. Mat. Res. Soc. Symp. 1985, 42, 277–286. [Google Scholar] [CrossRef]
  2. Li, V.C.; Chan, Y. Dtermination of interfacial debond mode for fiber-reinforced cementitious composites. J. Eng. Mech. 1994, 120, 707–719. [Google Scholar] [CrossRef] [Green Version]
  3. Richard, P.; Cheyrezy, M. Composition of reactive powder concretes. Cem. Concr. Res. 1995, 25, 1501–1511. [Google Scholar] [CrossRef]
  4. Ranade, R.; Stults, M.D.; Li, V.C.; Rushing, T.S.; Roth, J.; Heard, W.F. Development of high strength high ductility concrete. In Proceedings of the 2nd International RILEM Conference on Strain Hardening Cementitious Composites, Rio de Janeiro, Brazil, 12–14 December 2011; pp. 1–8. [Google Scholar]
  5. Wong, H.H.C.; Kwan, A.K.H. Packing density: A key concept for mix design of high performance concrete. In Proceedings of the Materials Science and Technology in Engineering Conference, Pittsburgh, PA, USA, 25–28 September 2005; pp. 1–15. [Google Scholar]
  6. Larrard, F. Ultrafine particles for the making of very high strength concretes. Cem. Concr. Res. 1989, 19, 161–172. [Google Scholar] [CrossRef]
  7. Li, V.C.; Wang, Y.; Backer, S. Effect of inclining angle, bundling and surface treatment on synthetic fibre pull-out from a cement matrix. Composites 1990, 21, 132–140. [Google Scholar] [CrossRef]
  8. Nguyễn, H.H.; Choi, J.I.; Kim, H.K.; Lee, B.Y. Mechanical properties and self-healing capacity of eco-friendly ultra-high ductile fiber-reinforced slag-based composites. Compos. Struct. 2019, 229, 111401. [Google Scholar] [CrossRef]
  9. Choi, J.I.; Lee, B.Y.; Ranade, R.; Li, V.C.; Lee, Y. Ultra-high-ductile behavior of a polyethylene fiber-reinforced alkali-activated slag-based composite. Cem. Concr. Compos. 2016, 70, 153–158. [Google Scholar] [CrossRef]
  10. Mazloom, M.; Ramezanianpour, A.A.; Brooks, J.J. Effect of silica fume on mechanical properties of high-strength concrete. Cem. Concr. Compos. 2004, 26, 347–357. [Google Scholar] [CrossRef]
  11. Naseer, S.; Sohail, M.R. Experiemental Study on Strength of Concrete using Silica Fumes as Supplementary Cementitious Material. In Proceedings of the First International Conference on Emerging Trends in Engineering, Management and Sciences, Peshawar, Pakistan, 29–30 December 2014; pp. 1–6. [Google Scholar]
  12. Chan, Y.W.; Chu, S.H. Effect of silica fume on steel fiber bond characteristics in reactive powder concrete. Cem. Concr. Res. 2004, 34, 1167–1172. [Google Scholar] [CrossRef]
  13. Cheng-yi, H.; Feldman, R.F. Influence of silica fume on the microstructural development in cement mortars. Cem. Concr. Res. 1985, 15, 285–294. [Google Scholar] [CrossRef] [Green Version]
  14. Wang, K.; Konsta-Gdoutos, M.S.; Shah, S.P. Hydration, rheology, and strength of ordinary portland cement (OPC)-cement kiln dust (CKD)-slag binders. ACI Mater. J. 2002, 99, 173–179. [Google Scholar]
  15. Konsta-Gdoutos, M.S.; Shah, S.P. Hydration and properties of novel blended cements based on cement kiln dust and blast furnace slag. Cem. Concr. Res. 2003, 33, 1269–1276. [Google Scholar] [CrossRef]
  16. Yu, K.Q.; Yu, J.T.; Dai, J.G.; Lu, Z.D.; Shah, S.P. Development of ultra-high performance engineered cementitious composites using polyethylene (PE) fibers. Constr. Build. Mater. 2018, 158, 217–227. [Google Scholar] [CrossRef]
  17. Choi, J.I.; Jang, S.Y.; Kwon, S.J.; Lee, B.Y. Tensile Behavior and Cracking Pattern of an Ultra-High Performance Mortar Reinforced by Polyethylene Fiber. Adv. Mater. Sci. Eng. 2017, 2017, 5383982. [Google Scholar] [CrossRef] [Green Version]
  18. Yu, K.Q.; Zhu, W.J.; Ding, Y.; Lu, Z.D.; Yu, J.T.; Xiao, J.Z. Micro-structural and mechanical properties of ultra-high performance engineered cementitious composites (UHP-ECC) incorporation of recycled fine powder (RFP). Cem. Concr. Res. 2019, 124, 105813. [Google Scholar] [CrossRef]
  19. Curosu, I.; Liebscher, M.; Mechtcherine, V.; Bellmann, C.; Michel, S. Tensile behavior of high-strength strain-hardening cement-based composites (HS-SHCC) made with high-performance polyethylene, aramid and PBO fibers. Cem. Concr. Res. 2017, 98, 71–81. [Google Scholar] [CrossRef]
  20. Haque, M.N.; Kayali, O. Properties of high-strength concrete using a fine fly ash. Cem. Concr. Res. 1998, 28, 1445–1452. [Google Scholar] [CrossRef]
  21. Gallucci, E.; Zhang, X.; Scrivener, K.L. Effect of temperature on the microstructure of calcium silicate hydrate (C-S-H). Cem. Concr. Res. 2013, 53, 185–195. [Google Scholar] [CrossRef]
  22. Payá, J.; Monzó, J.; Borrachero, M.V.; Peris-Mora, E.; Amahjour, F. Mechanical treatment of fly ashes—Part IV. Strength development of ground fly ash-cement mortars cured at different temperatures. Cem. Concr. Res. 2000, 30, 543–551. [Google Scholar] [CrossRef]
  23. Monzo, J.; Borrachero, M.V. Mechanical treatment of fly ashes: Strength development and workability of mortars containing ground fly ashes, fly ash, silica fume, slag and natural pozzolans in concrete. In Proceedings of the Fifth International Conference, Milwaukee, WI, USA, 4–9 June 1995; pp. 339–354. [Google Scholar]
  24. Cheng-yi, H.; Feldman, R.F. Hydration reactions in portland cement-silica fume blends. Cem. Concr. Res. 1985, 15, 585–592. [Google Scholar] [CrossRef] [Green Version]
  25. Kuhlmann, K.; Ellerbrock, H.-G.; Sprung, S. Particle size distribution and properties of cement. Part I: Strength of Portland cement. ZKG Int. Cem. 1985, 38, 169–178. [Google Scholar]
  26. Kim, M.J.; Kim, S.; Lee, S.K.; Kim, J.H.; Lee, K.; Yoo, D.Y. Mechanical properties of ultra-high-performance fiber-reinforced concrete at cryogenic temperatures. Constr. Build. Mater. 2017, 157, 498–508. [Google Scholar] [CrossRef]
Figure 1. Cumulative volume percentage and particle size distribution.
Applsci 11 02394 g001
Figure 2. Japan Society of Civil Engineers (JSCE) direct tensile test: (a) test setup and (b) specimen detail.
Applsci 11 02394 g002
Figure 3. Derivative thermogravimetry (DTG) result of (a) 7 d and (b) 28 d cured specimens.
Applsci 11 02394 g003
Figure 4. Scanning electron microscopy (SEM) images on the microstructure of specimens A7 and A28.
Applsci 11 02394 g004
Figure 5. SEM images on the microstructure of specimens B7 and B28.
Applsci 11 02394 g005
Figure 6. SEM images on the microstructure of specimens D7 and D28.
Applsci 11 02394 g006
Figure 7. SEM images on the microstructure of specimens F7 and F28.
Applsci 11 02394 g007
Figure 8. SEM images on the microstructure of specimens H7 and H28.
Applsci 11 02394 g008
Figure 9. Compressive strength test result.
Applsci 11 02394 g009
Figure 10. Tensile stress–strain curves of (a) 7 d and (b) 28 d cured specimens.
Applsci 11 02394 g010
Figure 11. Tensile strength and strain capacity of (a) 7 d and (b) 28 d cured specimens.
Applsci 11 02394 g011
Figure 12. SEM images on polyethylene (PE) fibers pulled out of 7 d cured specimens.
Applsci 11 02394 g012
Figure 13. SEM images on PE fibers pulled out of 28 d cured specimens.
Applsci 11 02394 g013
Figure 14. The energy absorption capacity of 7 d and 28 d cured specimens.
Applsci 11 02394 g014
Figure 15. Ratios of 7 d–28 d cured for test parameters.
Applsci 11 02394 g015
Figure 16. Representative cracking behaviors of (a) 7 d and (b) 28 d cured specimens.
Applsci 11 02394 g016
Figure 17. Correlation of #cracks with (a) #drops in tensile stress–strain curve; (b) strain capacity; and (c) and energy absorption capacity.
Applsci 11 02394 g017
Table 1. Chemical compositions and physical properties of materials.
TypeDensity (g/cm3)Specific Surface
Area (cm2/g)
Chemical Composition (%)Sum (%)
SiO2Al2O3Fe2O3CaOMgOSO3K2ONa2O
OPC3.15335021.016.403.1261.333.022.30--97.18
SF2.20200,00096.000.250.120.380.10---96.85
GGBS2.90436033.0014.000.5042.006.312.01--97.82
CKD2.6782009.653.701.5443.601.400.770.350.0661.07
Silica Sand2.65-99.500.080.020.020.02---99.64
Silica Flour2.65-99.800.060.040.020.02--0.0199.95
OPC = ordinary Portland cement; SF = silica fume; GGBS = ground granulated blast furnace slag; and CKD = cement kiln dust.
Table 2. Mixture proportions of ultra-high-performance, strain-hardening cementitious composites (UHP–SHCCs).
TypeW/BCementSilica
Flour
GGBSSFCKDS/BSP *
A0.221.0----0.30.010
B0.250.15---0.012
C0.280.3---0.013
D0.21-0.5--0.016
E0.21-1.0--0.021
F0.22--0.2-0.012
G0.22--0.3-0.014
H0.22---0.150.012
I0.22---0.30.014
W/B = water–binder ratio; GGBS = ground granulated blast furnace slag; SF = silica fume; CKD = cement kiln dust; S/B = sand-binder ratio; and SP = superplasticizer. * Superplasticizer includes 30% solid (=15.8 kg/m3) and 70% water (=36.8 kg/m3).
Table 3. Geometrical and physical properties of ultra-high-molecular-weight polyethylene (UHMWPE) fiber.
TypeDiameter, df
(μm)
Length, lf
(mm)
Aspect Ratio
(lf/df)
Density
(g/cm3)
Tensile Strength, ft (MPa)Elastic Modulus,
Ef (GPa)
Elongation
(%)
UHMWPE fiber30–3218.0562.5–600.00.9730001003–4
Table 4. Test indexes for tensile and cracking behaviors of UHP–SHCCs.
SpecimenA7B7C7D7E7F7G7H7I7
#Cracks (ea)104961329172521
#Drops (time)11 10 18 17 19 40 29 48 33
Strain capacity (%)1.7 1.1 2.2 2.9 2.6 4.6 2.8 7.5 5.2
Energy absorption capacity (kJ/m3)144.6 93.3 206.9 458.1 182.8 281.1 153.7 667.1 434.5
SpecimenA28B28C28D28E28F28G28H28I28
#Cracks (ea)272839393536363433
#Drops (time)57 43 59 52 64 65 64 78 66
Strain capacity (%)6.2 6.6 7.3 6.9 6.6 7.2 6.0 6.8 6.9
Energy absorption capacity (kJ/m3)537.2 446.1 558.7 560.7 532.2 442.0 419.3 475.3 493.2
#Cracks = number of cracks and #Drops = number of drops in tensile stress.
Publisher’s Note: MDPI stays neutral with regard to jurisdictional claims in published maps and institutional affiliations.

