
Machine Learning-Based Identification of the Strongest Predictive Variables of Winning and Losing in Belgian Professional Soccer


Abstract
1. Introduction
2. Materials and Methods
2.1. Sample
2.2. Variables
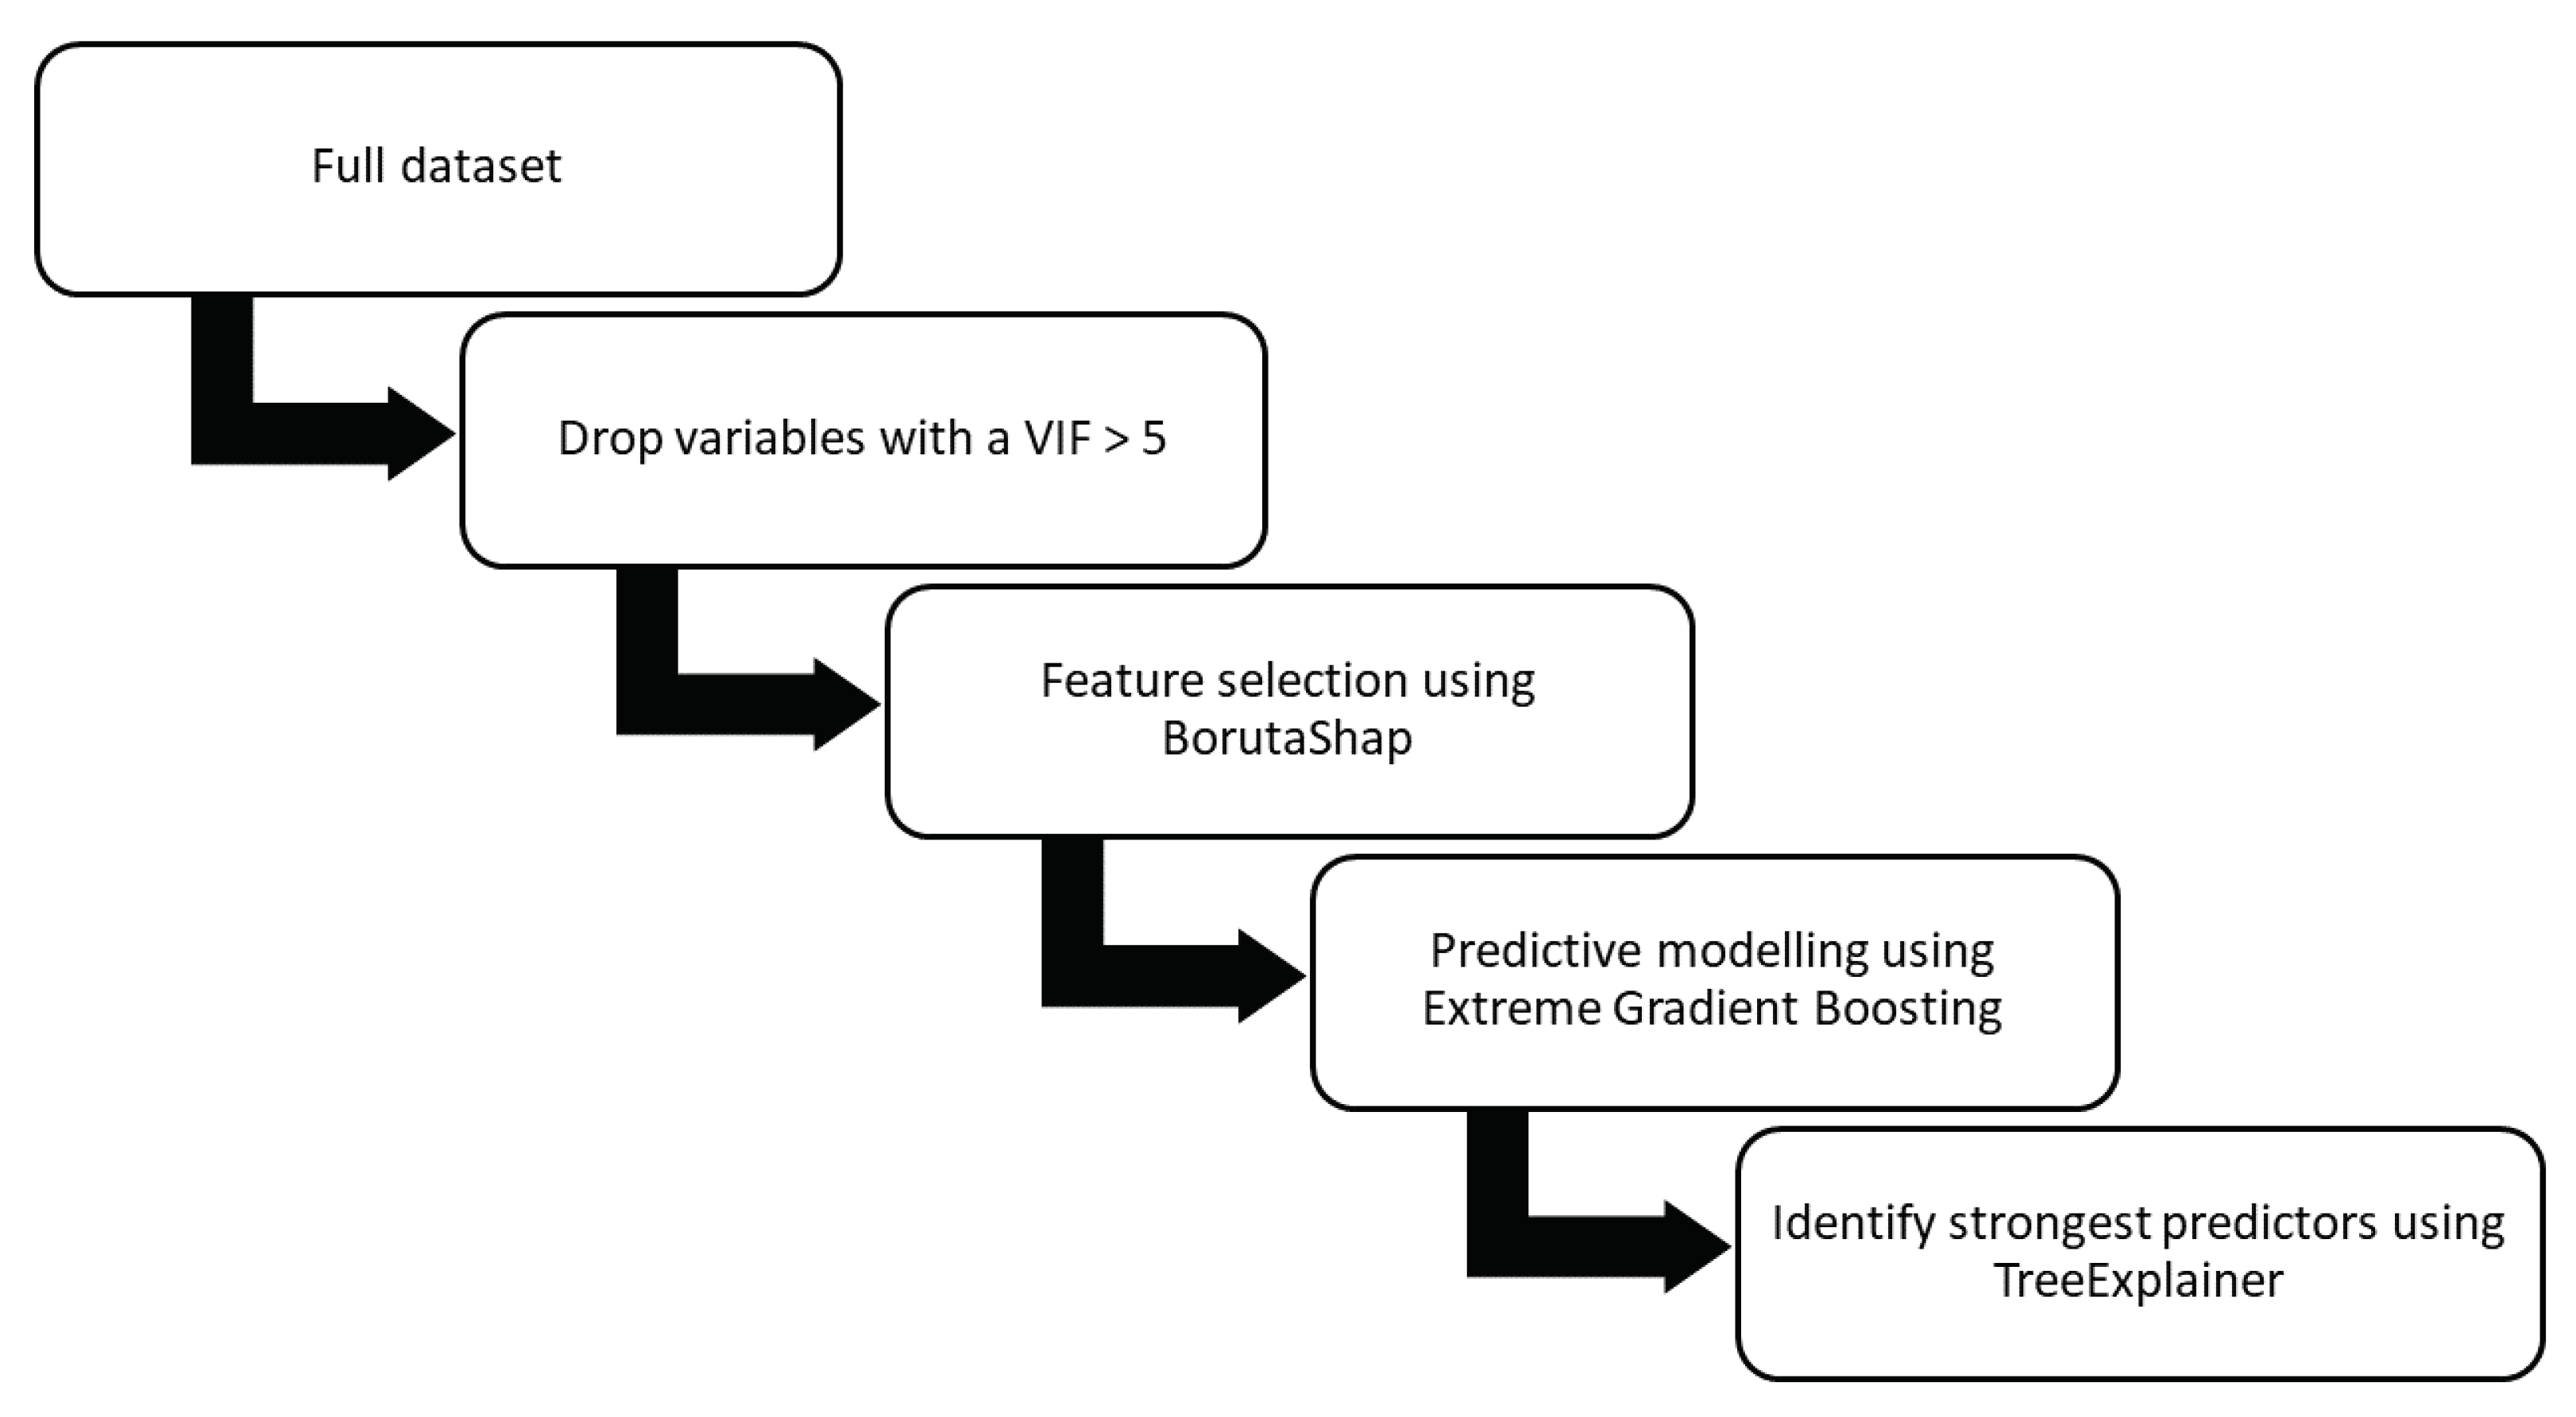
2.3. Procedures
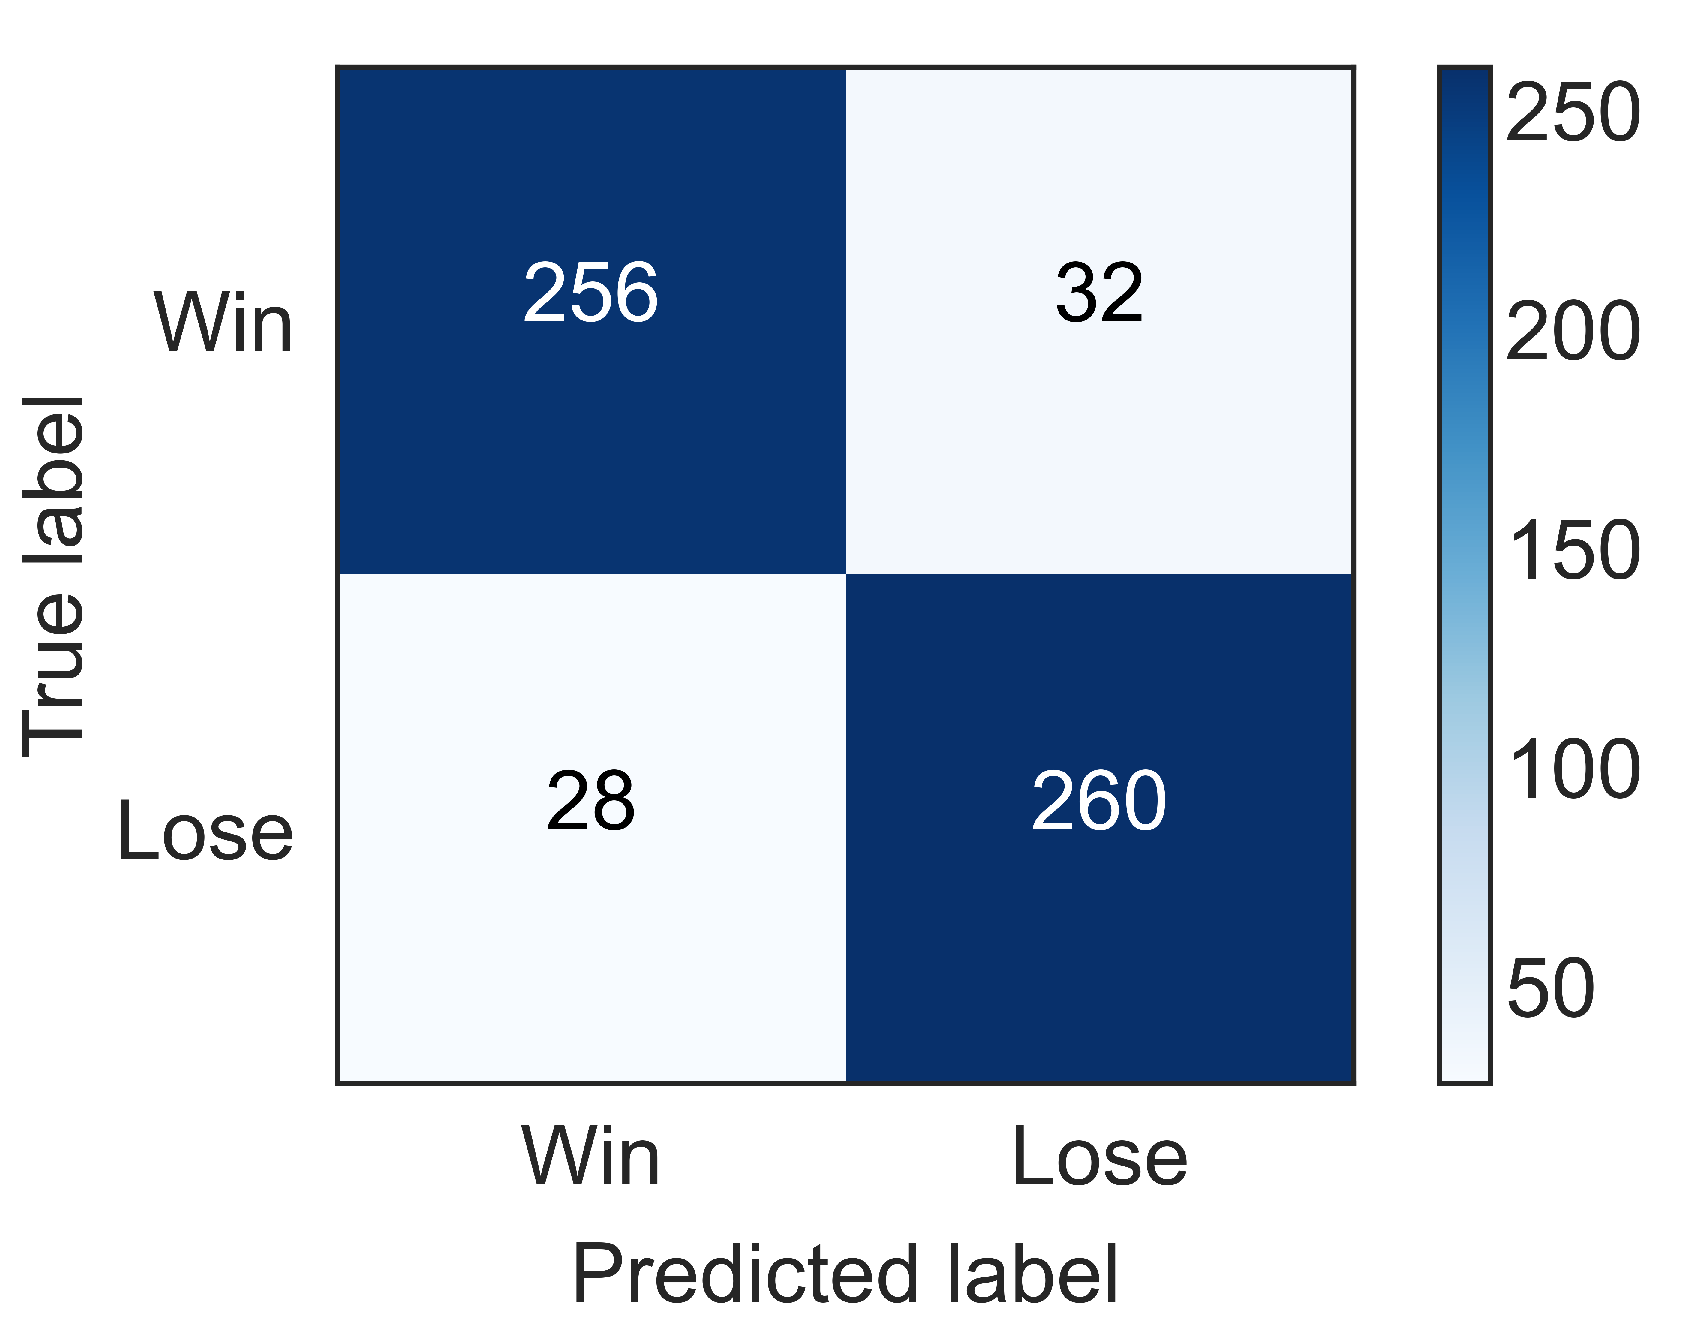
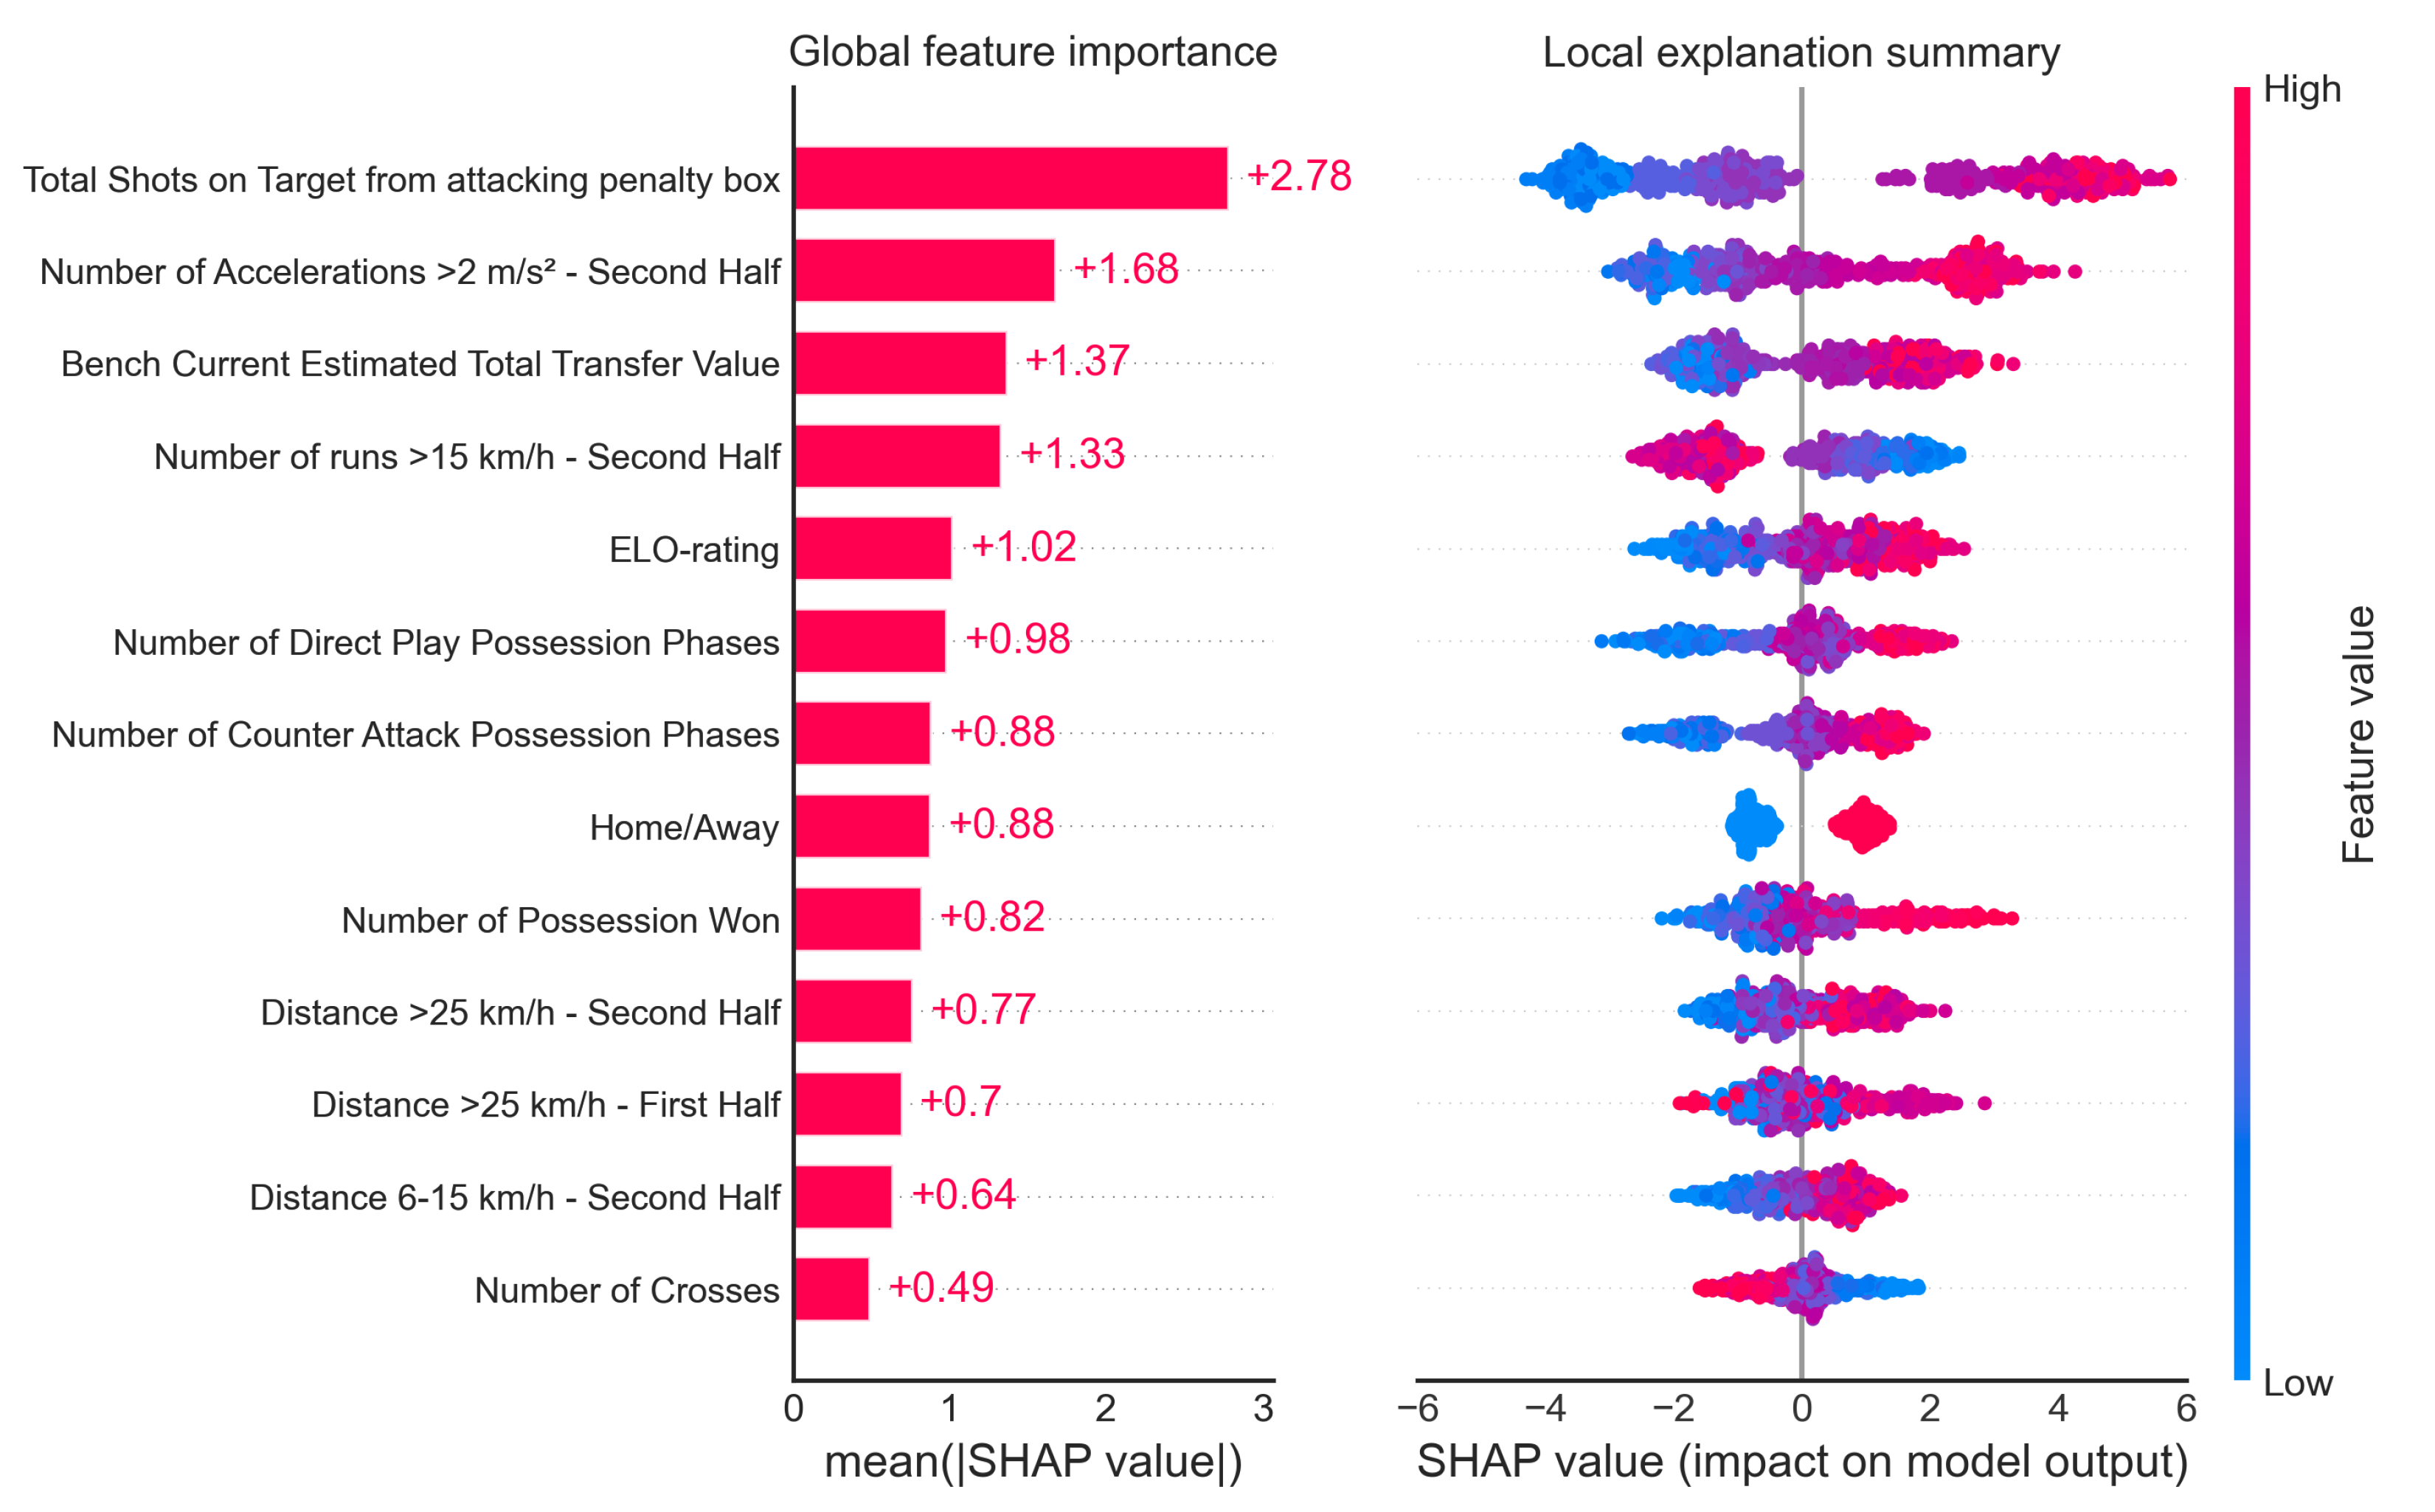
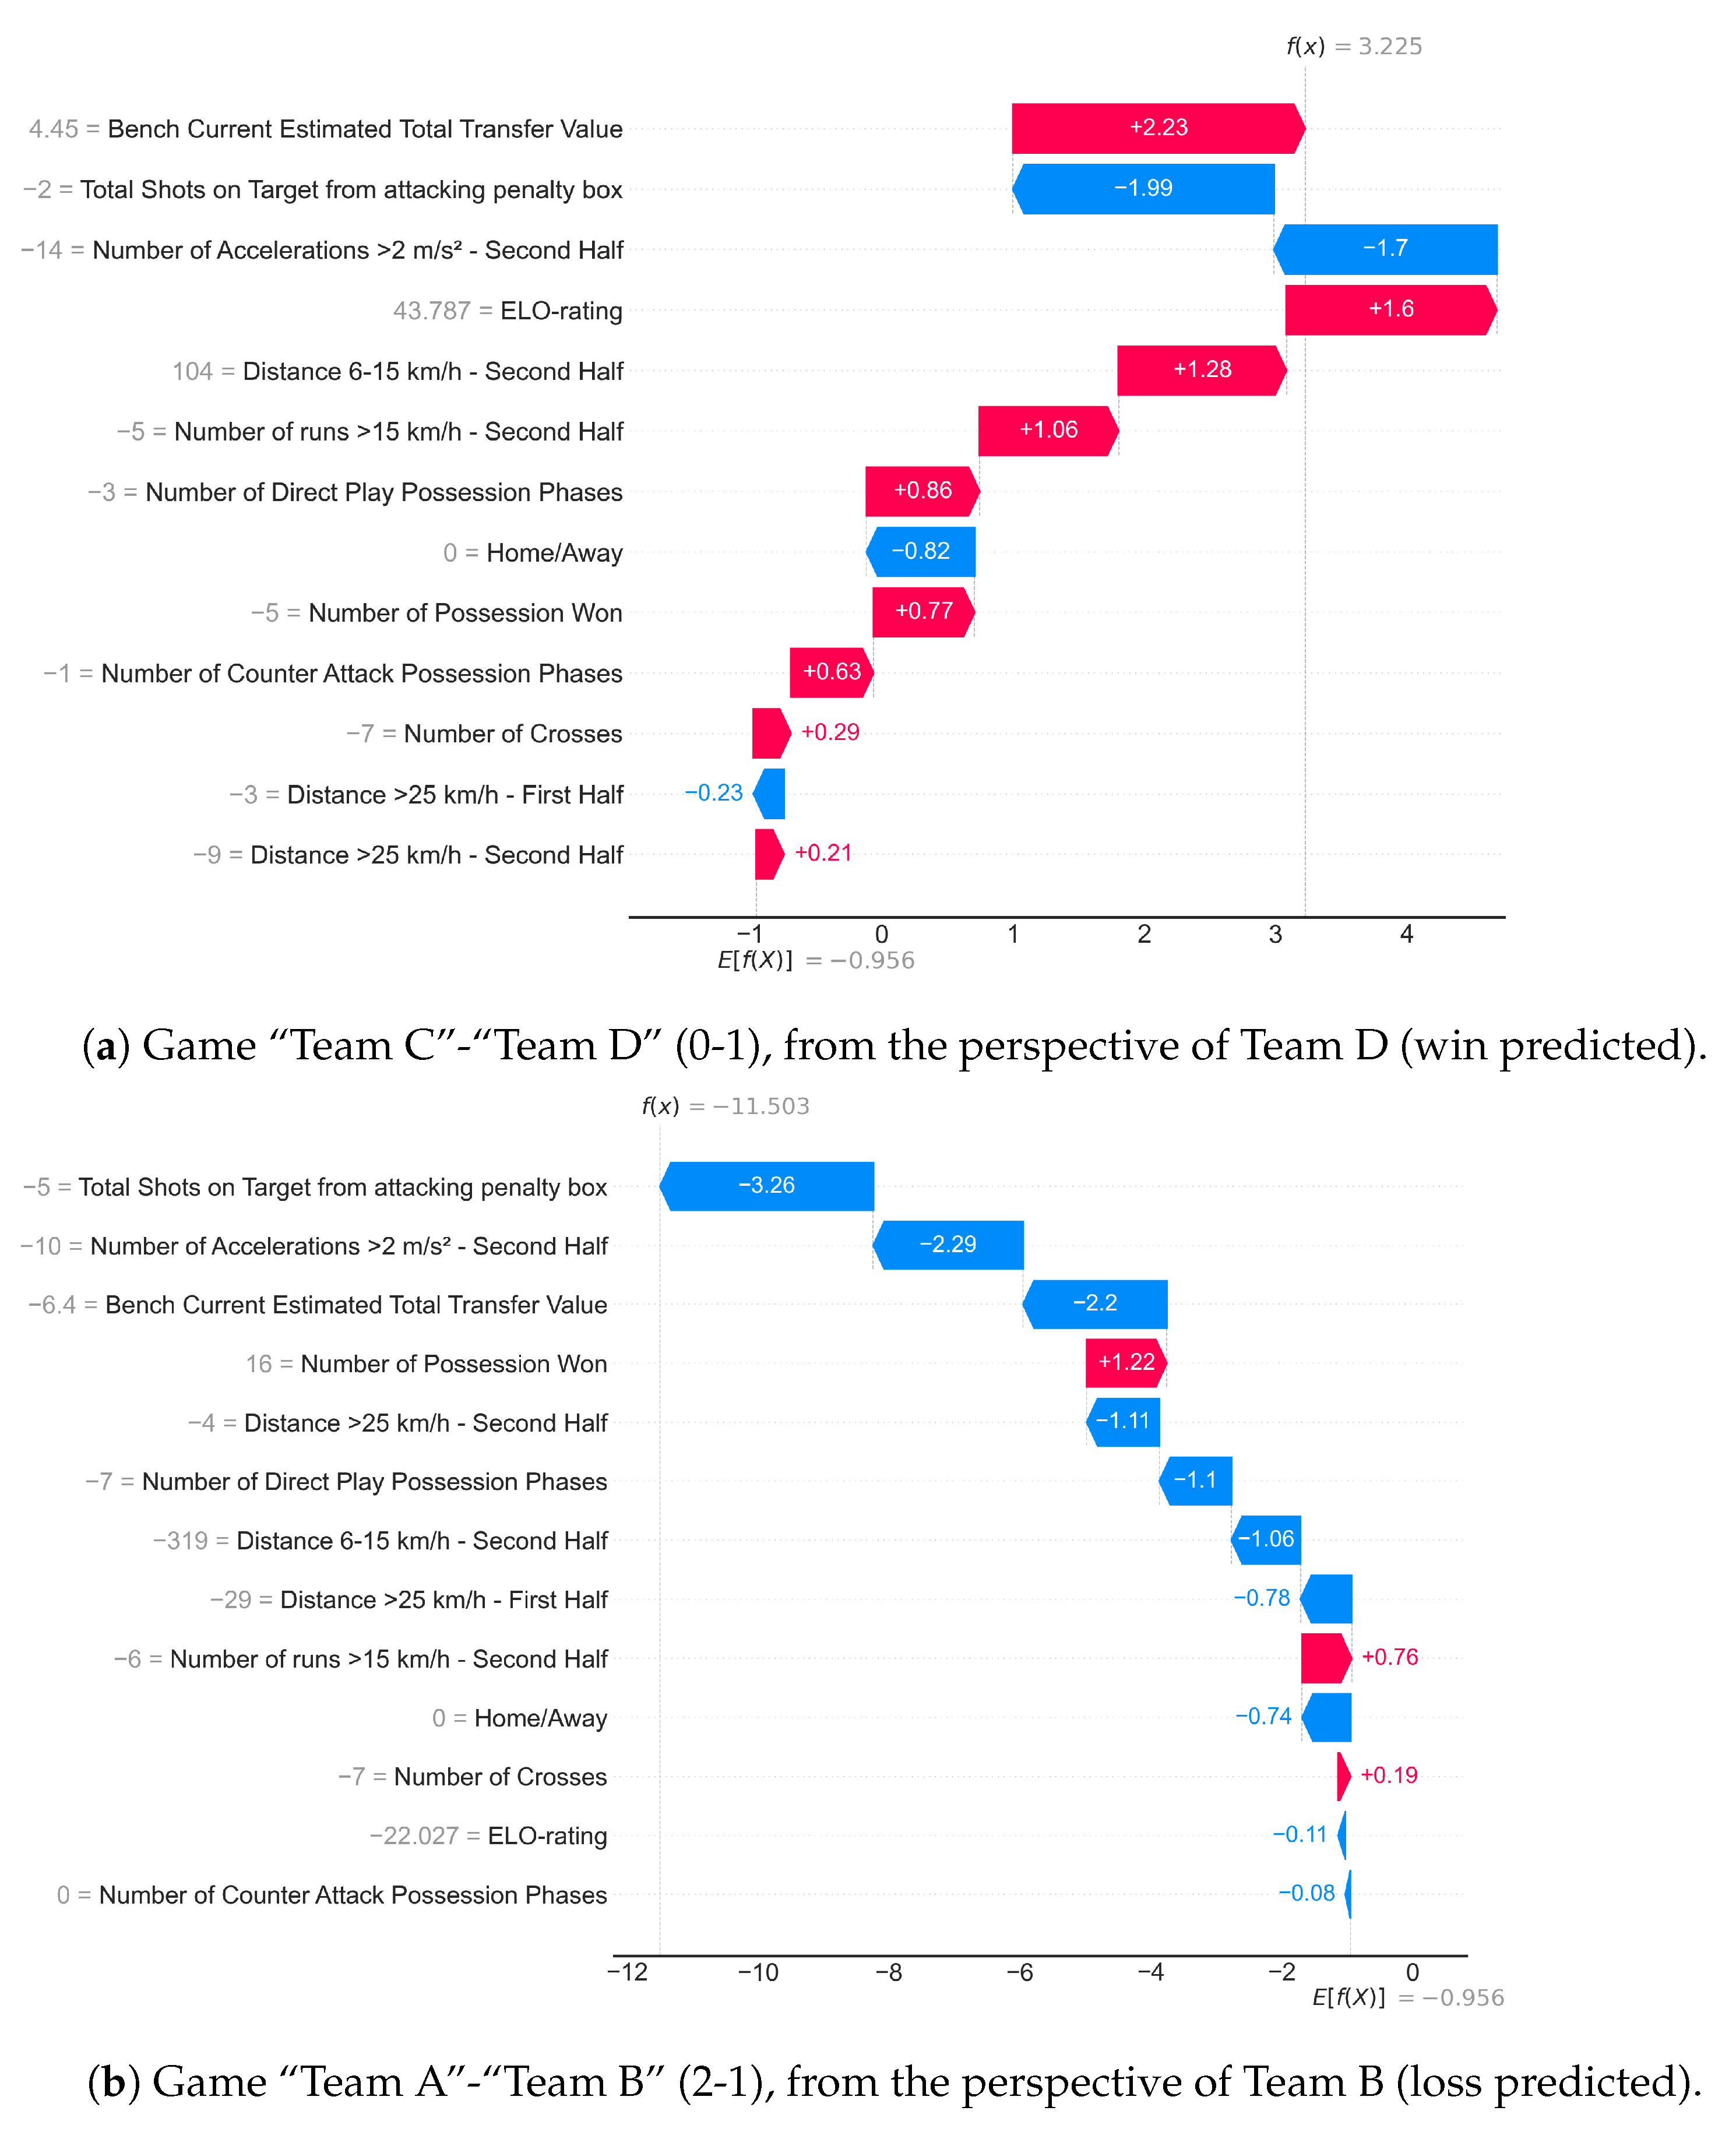
3. Results
4. Discussion
Author Contributions
Funding
Institutional Review Board Statement
Informed Consent Statement
Data Availability Statement
Acknowledgments
Conflicts of Interest
Abbreviations
| VIF | Variance Inflation Factor |
References
- Lames, M.; McGarry, T. On the search for reliable performance indicators in game sports. Int. J. Perform. Anal. Sport 2017, 7, 62–79. [Google Scholar] [CrossRef]
- Hughes, M.D.; Bartlett, R.M. The use of performance indicators in performance analysis. J. Sports Sci. 2002, 20, 739–754. [Google Scholar] [CrossRef]
- Plessner, H.; Haar, T. Sports performance judgments from a social cognitive perspective. Psychol. Sport Exerc. 2006, 7, 555–575. [Google Scholar] [CrossRef]
- Mark, M.M.; Mutrie, N.; Brooks, D.R.; Harris, D.V. Causal Attributions of Winners and Losers in Individual Competitive Sports: Toward a Reformulation of the Self-Serving Bias. J. Sport Psychol. 1984, 6, 184–196. [Google Scholar] [CrossRef]
- Brechot, M.; Flepp, R. Dealing With Randomness in Match Outcomes: How to Rethink Performance Evaluation in European Club Football Using Expected Goals. J. Sports Econ. 2020, 21, 335–362. [Google Scholar] [CrossRef]
- Castellano, J.; Casamichana, D.; Lago, C. The Use of Match Statistics that Discriminate Between Successful and Unsuccessful Soccer Teams. J. Hum. Kinet. 2012, 31, 139–147. [Google Scholar] [CrossRef] [PubMed]
- Collet, C. The possession game? A comparative analysis of ball retention and team success in European and international football, 2007–2010. J. Sports Sci. 2013, 31, 123–136. [Google Scholar] [CrossRef] [PubMed]
- Lago-ballesteros, J.; Lago-Peñas, C. Performance in Team Sports: Identifying the Keys to Success in Soccer. J. Hum. Kinet. 2010, 25, 85–91. [Google Scholar] [CrossRef]
- Yang, G.; Leicht, A.S.; Lago, C.; Gómez, M.-Á. Key team physical and technical performance indicators indicative of team quality in the soccer Chinese super league. Res. Sports Med. 2018, 26, 158–167. [Google Scholar] [CrossRef] [PubMed]
- Broich, H.; Mester, J.; Seifriz, F.; Yue, Z. Statistical Analysis for the First Bundesliga in the Current Soccer Season. Prog. Appl. Math. 2011, 7, 1–8. [Google Scholar]
- Harrop, K.; Nevill, A. Performance indicators that predict success in an English Professional League One Soccer Team. Int. J. Perform. Anal. Sport 2014, 14, 907–920. [Google Scholar] [CrossRef]
- Lepschy, H.; Wäsche, H.; Woll, A. Success factors in football: An analysis of the German Bundesliga. Int. J. Perform. Anal. Sport 2020, 20, 150–164. [Google Scholar] [CrossRef]
- Ruiz-Ruiz, C.; Fradua, L.; Fernández-García, Á.; Zubillaga, A. Analysis of entries into the penalty area as a performance indicator in soccer. Eur. J. Sport Sci. 2013, 13, 241–248. [Google Scholar] [CrossRef] [PubMed]
- Goes, F.R.; Kempe, M.; Lemmink, K. Predicting match outcome in professional Dutch football using tactical performance metrics computed from position tracking data. In Mathsport International Conference Proceeding; Propobos Publications: Athens, Greece, June 2019; pp. 105–115. [Google Scholar]
- Bialkowski, A.; Lucey, P.; Carr, P.; Yue, Y.; Sridharan, S.; Matthews, I. Large-scale analysis of soccer matches using spatiotemporal tracking data. In Proceedings of the IEEE International Conference on Data Mining (ICDM), Shenzhen, China, 14–17 December 2014; pp. 725–730. [Google Scholar]
- Goes, F.R.; Meerhoff, R.L.A.; Bueno, M.J.; Rodrigues, D.M.; Moura, F.A.; Brink, M.S.; Elferink-Gemser, M.T.; Knobbe, A.J.; Cunha, S.A.; Lemmink, K.A. Unlocking the potential of big data to support tactical performance analysis in professional soccer: A systematic review. Eur. J. Sport Sci. 2020, 1–16. [Google Scholar] [CrossRef] [PubMed]
- Perin, C.; Vuillemot, R.; Stolper, C.D.; Stasko, J.T.; Wood, J.; Carpendale, S. State of the Art of Sports Data Visualization. Comput. Graph. Forum 2018, 37, 663–686. [Google Scholar] [CrossRef]
- Bzdok, D.; Altman, N.; Krzywinski, M. Points of Significance: Statistics versus machine learning. Nat. Methods 2018, 15, 233–234. [Google Scholar] [CrossRef] [PubMed]
- Linke, D.; Link, D.; Lames, M. Validation of electronic performance and tracking systems EPTS under field conditions. PLoS ONE 2018, 13, e0199519. [Google Scholar] [CrossRef] [PubMed]
- Bradley, P.; Di Mascio, M.; Peart, D.; Olsen, P.; Sheldon, B. High-Intensity Activity Profiles of Elite Soccer Players at Different Performance Levels. J. Strength Cond. Res. 2010, 24, 2343–2351. [Google Scholar] [CrossRef]
- Bradley, P.; O’Donoghue, P.; Wooster, B.; Tordoff, P. The reliability of ProZone MatchViewer: A videobased technical performance analysis system. Int. J. Perform. Anal. Sport 2007, 7, 117–129. [Google Scholar] [CrossRef]
- Csató, L. The UEFA Champions League seeding is not strategy-proof since the 2015/16 season. Ann. Oper. Res. 2020, 292, 161–169. [Google Scholar] [CrossRef]
- Engist, O.; Merkus, E.; Schafmeister, F. The Effect of Seeding on Tournament Outcomes: Evidence From a Regression-Discontinuity Design. J. Sports Econ. 2021, 22, 115–136. [Google Scholar] [CrossRef]
- Hastie, T.; Tibshirani, R.; Friedman, J. The Elements of Statistical Learning: Data Mining, Inference, and Prediction; Number 2; Springer Science & Business Media: Berlin/Heidelberg, Germany, 2009. [Google Scholar]
- Lundberg, S.M.; Erion, G.; Chen, H.; DeGrave, A.; Prutkin, J.M.; Nair, B.; Katz, R.; Himmelfarb, J.; Bansal, N.; Lee, S.I. From local explanations to global understanding with explainable AI for trees. Nat. Mach. Intell. 2020, 2, 56–67. [Google Scholar] [CrossRef] [PubMed]
- Molnar, C. Interpretable Machine Learning: A Guide for Making Black Box Models Explainable. Available online: https://christophm.github.io/interpretable-ml-book/ (accessed on 15 November 2020).
- Dubitzky, W.; Lopes, P.; Davis, J.; Berrar, D. The Open International Soccer Database for machine learning. Mach. Learn. 2019, 108, 9–28. [Google Scholar] [CrossRef]
- Hassan, A.; Akl, A.R.; Hassan, I.; Sunderl, C. Predicting wins, losses and attributes’ sensitivities in the soccer world cup 2018 using neural network analysis. Sensors 2020, 20, 3213. [Google Scholar] [CrossRef] [PubMed]
- Lames, M. Chance involvement in goal scoring in football—An empirical approach. Ger. J. Exerc. Sport Res. 2018, 48, 278–286. [Google Scholar] [CrossRef]
- Simon, R. Deserving to be lucky: Reflections on the role of luck and desert in sports. J. Philos. Sport 2007, 34, 13–25. [Google Scholar] [CrossRef]
- Carling, C. Interpreting physical performance in professional soccer match-play: Should we be more pragmatic in our approach? Sports Med. 2013, 43, 655–663. [Google Scholar] [CrossRef]
- Russell, M.; Sparkes, W.; Northeast, J.; Cook, C.J.; Love, T.D.; Bracken, R.M.; Kilduff, L.P. Changes in Acceleration and Deceleration Capacity Throughout Professional Soccer Match-Play. J. Strength Cond. Res. 2016, 30, 2839–2844. [Google Scholar] [CrossRef] [PubMed]
- Faude, O.; Koch, T.; Meyer, T. Straight sprinting is the most frequent action in goal situations in professional football. J. Sports Sci. 2012, 30, 625–631. [Google Scholar] [CrossRef] [PubMed]
- Chmura, P.; Konefał, M.; Chmura, J.; Kowalczuk, E.; Zajac, T.; Rokita, A.; Andrzejewski, M. Match outcome and running performance in different intensity ranges among elite soccer players. Biol. Sport 2018, 35, 197–203. [Google Scholar] [CrossRef]
- Dellal, A.; Chamari, K.; Wong, D.P.; Ahmaidi, S.; Keller, D.; Barros, R.; Bisciotti, G.N.; Carling, C. Comparison of physical and technical performance in European soccer match-play: FA Premier League and La Liga. Eur. J. Sport Sci. 2011, 11, 51–59. [Google Scholar] [CrossRef]
- Paul, D.J.; Bradley, P.S.; Nassis, G.P. Factors affecting match running performance of elite soccer players: Shedding some light on the complexity. Int. J. Sports Physiol. Perform. 2015, 10, 516–519. [Google Scholar] [CrossRef] [PubMed]
- Lago, C.; Casais, L.; Dominguez, E.; Sampaio, J. The effects of situational variables on distance covered at various speeds in elite soccer. Eur. J. Sport Sci. 2010, 10, 103–109. [Google Scholar] [CrossRef]
- Bradley, P.; Ade, J.D. Are Current Physical Match Performance Metrics in Elite Soccer Fit for Purpose or is the Adoption of an Integrated Approach Needed? Int. J. Sports Physiol. Perform. 2018, 13, 656–664. [Google Scholar] [CrossRef] [PubMed]
- Fernandez-Navarro, J.; Fradua, L.; Zubillaga, A.; McRobert, A.P. Influence of contextual variables on styles of play in soccer. Int. J. Perform. Anal. Sport 2018, 18, 423–436. [Google Scholar] [CrossRef]
- Liu, H.; Gomez, M.Á.; Lago-Peñas, C.; Sampaio, J. Match statistics related to winning in the group stage of 2014 Brazil FIFA World Cup. J. Sports Sci. 2015, 33, 1205–1213. [Google Scholar] [CrossRef] [PubMed]
- Vecer, J. Crossing in Soccer has a Strong Negative Impact on Scoring: Evidence from the English Premier League the German Bundesliga and the World Cup 2014. Technical Report. 30 September 2014. Available online: https://ssrn.com/abstract=2225728 (accessed on 5 March 2021).
- Constantinou, A.C. Dolores: A model that predicts football match outcomes from all over the world. Mach. Learn. 2019, 108, 49–75. [Google Scholar] [CrossRef]
- Hucaljuk, J.; Rakipović, A. Predicting football scores using machine learning techniques. In Proceedings of the 2011-34th International Convention on Information and Communication Technology, Electronics and Microelectronics, Opatija, Croatia, 23–27 May 2011; Volume 48, pp. 1623–1627. [Google Scholar]
- Stübinger, J.; Mangold, B.; Knoll, J. Machine learning in football betting: Prediction of match results based on player characteristics. Appl. Sci. 2020, 10, 46. [Google Scholar] [CrossRef]
- Memmert, D.; Lemmink, K.A.; Sampaio, J. Current Approaches to Tactical Performance Analyses in Soccer Using Position Data. Sports Med. 2017, 47, 1–10. [Google Scholar] [CrossRef]
- Geurkink, Y.; Vandewiele, G.; Lievens, M.; De Turck, F.; Ongenae, F.; Matthys, S.P.; Boone, J.; Bourgois, J.G. Modeling the Prediction of the Session Rating of Perceived Exertion in Soccer: Unraveling the Puzzle of Predictive Indicators. Int. J. Sports Physiol. Perform. 2018, 14, 1–6. [Google Scholar] [CrossRef]
- Jaspers, A.; Brink, M.S.; Probst, S.G.; Frencken, W.G.; Helsen, W.F. Relationships Between Training Load Indicators and Training Outcomes in Professional Soccer. Sports Med. 2017, 47, 533–544. [Google Scholar] [CrossRef] [PubMed]
- Rommers, N.; Rössler, R.; Verhagen, E.; Vandecasteele, F.; Verstockt, S.; Vaeyens, R.; Lenoir, M.; D’Hondt, E.; Witvrouw, E. A Machine Learning Approach to Assess Injury Risk in Elite Youth Football Players. Med. Sci. Sports Exerc. 2020, 52, 1745–1751. [Google Scholar] [CrossRef] [PubMed]
- Stolen, T.; Chamari, K.; Castagna, C.; Wisloff, U. Physiology of Soccer. Sports Med. 2005, 35, 501–536. [Google Scholar] [CrossRef] [PubMed]
- Impellizzeri, F.M.; Rampinini, E.; Marcora, S.M. Physiological assessment of aerobic training in soccer. J. Sports Sci. 2005, 23, 583–592. [Google Scholar] [CrossRef] [PubMed]
- Bahr, R.; Krosshaug, T. Understanding injury mechanisms: A key component of preventing injuries in sport. Br. J. Sports Med. 2005, 39, 324–329. [Google Scholar] [CrossRef] [PubMed]
- Lago, C. The influence of match location, quality of opposition, and match status on possession strategies in professional association football. J. Sports Sci. 2009, 27, 1463–1469. [Google Scholar] [CrossRef]


| Category | Expression | Parameter | Part Game |
|---|---|---|---|
| Shot-related | Number (n) | - Shots, shots on target, shots not on target - Shots/shots on target/shots not on target inside attacking penalty box - Expected Goals - Shots resulting from 8 playing styles A | Full Game |
| Defense | Number (n) | - Duels won, possession won/loss | Full Game |
| Technical | Number (n) | - Total/forward/sideways/backward passes, successful passes - Total/forward/sideways/backward passes to attacking half/third - Dribbles, successful dribbles - Ball touches in attacking penalty box - Passes < 10 m, Passes < 25 m, Passes > 25 m - Possession in 8 playing styles A | Full Game |
| Percentage (%) | - Total ball possession - Ball possession on defensive half/attacking half/attacking third/attacking penalty box | ||
| Physical | Distance (m) | - Total distance - Distance between 0–6 km/h, 6–15 km/h, 15–20 km/h, 20–25 km/h, >25 km/h - Distance at accelerations/decelerations >2 ms2/>3 ms2 | First/Second Half |
| Number (n) | - Actions at speed >15 km/h/>25 km/h - Accelerations/decelerations >2 ms2/>3 ms2 | ||
| Disciplinal | Number (n) | - Fouls, fouls at attacking half, yellow cards, red cards, offside | Full Game |
| Set-Pieces | Number (n) | - Corners, penalties, free kick/throw-in on attacking third | Full Game |
| Contextual | Currency (€) | - Line-up/bench current estimated total transfer value - Line-up/bench estimated paid total transfer value | Full Game |
| Age (years) | - Line-up/bench average age | ||
| Arbitrary Units (AU) | - ELO-ratings, Form | ||
| Number (n) | - Days between games | ||
| Match location | - Home/Away |
| Goal Difference | Games (n = 576) | Misclassifications (n = 60) | ||
|---|---|---|---|---|
| Total | % | Total | % | |
| 1 | 302 | 52.4% | 43 | 71.7% |
| 2 | 160 | 27.8% | 16 | 26.7% |
| 3 | 69 | 12.0% | 1 | 1.7% |
| 4 | 33 | 5.7% | 0 | 0% |
| 5 | 8 | 1.4% | 0 | 0% |
| 6 | 3 | 0.5% | 0 | 0% |
| 7 | 1 | 0.2% | 0 | 0% |
Publisher’s Note: MDPI stays neutral with regard to jurisdictional claims in published maps and institutional affiliations. |
© 2021 by the authors. Licensee MDPI, Basel, Switzerland. This article is an open access article distributed under the terms and conditions of the Creative Commons Attribution (CC BY) license (http://creativecommons.org/licenses/by/4.0/).
Share and Cite
Geurkink, Y.; Boone, J.; Verstockt, S.; Bourgois, J.G. Machine Learning-Based Identification of the Strongest Predictive Variables of Winning and Losing in Belgian Professional Soccer. Appl. Sci. 2021, 11, 2378. https://doi.org/10.3390/app11052378
Geurkink Y, Boone J, Verstockt S, Bourgois JG. Machine Learning-Based Identification of the Strongest Predictive Variables of Winning and Losing in Belgian Professional Soccer. Applied Sciences. 2021; 11(5):2378. https://doi.org/10.3390/app11052378
Chicago/Turabian StyleGeurkink, Youri, Jan Boone, Steven Verstockt, and Jan G. Bourgois. 2021. "Machine Learning-Based Identification of the Strongest Predictive Variables of Winning and Losing in Belgian Professional Soccer" Applied Sciences 11, no. 5: 2378. https://doi.org/10.3390/app11052378
APA StyleGeurkink, Y., Boone, J., Verstockt, S., & Bourgois, J. G. (2021). Machine Learning-Based Identification of the Strongest Predictive Variables of Winning and Losing in Belgian Professional Soccer. Applied Sciences, 11(5), 2378. https://doi.org/10.3390/app11052378