Abstract
Conformational transitions of double-stranded DNA in different environments have long been studied as vital parts of both in vitro and in vivo processes. In this study, utilizing Fourier transform infrared spectroscopy (FTIR), we provide detailed analysis of dynamics of A- to B-form transitions in DNA thin films of different hydrated states based on a statistical analysis of a substantial number of spectra and band shape analysis (peak fitting) in both the phosphate (1150–1000 cm−1) and sugar–phosphate (900–750 cm−1) region. Hydration of DNA thin films is systematically controlled by the time spent in the desiccator chamber (from 3 min to 40 min) allowing conformation and hydration signatures, in addition to variations due to ambient conditions, to be resolved in the spectra. Conformation transition from A-form to more ordered B-form is observed if sufficient time in the desiccator chamber is allowed and is confirmed by changes on the bands at ≈890, 860, 837, and 805 cm−1. Phosphate vibrations at ≈1230 cm−1 and 1089 cm−1, and backbone vibrations at ≈1030 cm−1 and 765 cm−1 were found to be sensitive to changes in hydration rather than conformation. Additionally, we found that spectral variations caused by ambient conditions can be significantly reduced without inducing conformational changes, which serves as a good basis for quality assurance.
1. Introduction
The double-stranded helix of deoxyribonucleic acid (dsDNA) can exist in a great variety of different geometries (conformations), depending on the base stacking interactions, hydrogen bonding, and long-range intra- and inter-backbone forces renormalized by water-mediated interactions with the entities situated in the DNA hydration shells [1,2]. Particularly important and biologically relevant are A-form and B-form helices because they can be found in prokaryotic and eukaryotic cells. In both A- and B-form, the helix is right-handed and the sizes of the major and minor grooves are distinctly defined; A-form dsDNA is broader, shorter, and has a wider minor grove than B-form dsDNA [1,3]. In A-form, the sugar-based block adopts the C3’ endo/anti conformation, and in the B-form, the C2′ endo/anti conformation. A-form is usually associated with the decreased number of water molecules per phosphate (lower hydration), whereas, in a fully hydrated state, dsDNA adopts B-form [4]. All the subtleties in the structure between the two forms determine the accessibility of other molecules to DNA binding sites and reveal distinct surfaces of DNA susceptible to different environments. Both forms may be detected simultaneously because segments of DNA can adopt different forms; in this case, %A- and %B-form can be estimated [2,5]. Certain conditions may trigger structural A → B and B → A transitions in living cells and organisms and in vitro. These conformational transitions may be a vital step in some processes such as transcription and binding of specific proteins or drugs or can provide protection from desiccation in simple organisms such as bacteria [2]. Consequently, conformational transitions are often fundamental in the studies of drug- and anti-cancer drug-DNA interaction, resistance to DNA damage induced by radiation, heat, and desiccation, and are extremely important tools in the detection of cancer markers and other abnormalities.
Over the years, structural techniques such as X-ray crystallography and nuclear magnetic resonance spectroscopy (NMR) provided valuable information on conformational heterogeneity in the structures of dsDNA [6]. While X-ray improved understanding of different crystal structures of DNA, high-resolution NMR experiments provided detailed information on the dsDNA conformation in solution. Both techniques established phosphate–ester conformation as the most variable part of nucleic acid structure [7]. Thus, a great part of understanding the structure and dynamics of DNA, in addition to protein–DNA recognition and drug–DNA interactions, lies in untangling important roles of phosphate–sugar moieties in DNA. Even though powerful, X-ray crystallography requires the macromolecule to be ordered in a crystal lattice; thus, the conformation of DNA in the crystal structure may not be identical to the one observed in solution or DNA confined in reduced spatial dimensions, such as thin films [6]. Additionally, NMR studies are usually restricted to short DNA sequences as there is increased difficulty in interpretation of the spectra of biomolecules with large molecular weights [7,8]. Thus, different experimental methods such as infrared spectroscopy (IR), UV spectrophotometry, dielectric spectroscopy, etc. have been utilized in order to elucidate DNA structural features in diverse environments.
Infrared spectroscopy methods such as Fourier transform infrared spectroscopy (FTIR) and Raman spectroscopy have long been utilized as non-destructive and sensitive techniques for probing DNA structure and function in different concentrations, ionic strengths, and without limitations to DNA length. In particular, “textbook” A- and B-form geometries were associated with different spectral characteristics; markers of A- and B-form dsDNA were established that are now common in the literature [2]. Even though there is consensus as to what constitutes spectral profiles of the two forms, inconsistencies can be found because spectra can be obtained from different types of DNA samples, i.e., short oligonucleotides, polynucleotides, genomic or synthetic DNA, DNA isolated from various cells, and tissues. Moreover, spectra can be obtained from various physical states of DNA such as solutions, gels, thin films, and crystals; all of this contributes to the final spectral profile of the studied DNA sample with each state providing different advantages.
In DNA thin films, hydration conditions of the samples can be distinctly controlled by various simple techniques such as air-drying or drying under a stream of inert gasses such as nitrogen, or more advanced techniques that imply the use of home-built humidity chambers or cells where DNA thin films are prepared over the course of several hours (usually after 24 h) [9]. Thus, a great variety of hydration conditions from fully hydrated to fully dehydrated state can be obtained and dehydration and rehydration experiments can be performed. Additionally, impeding absorptions from the bulk water can be avoided, and with the right substrate, the spectral range can be greatly increased. Another important advantage of DNA thin film is the ability to use these samples in (imaging) techniques such as FTIR microspectroscopy [10,11] and atomic force microscopy (AFM) [12]. These fast-growing techniques require the deposition of DNA on a substrate (thus forming DNA thin films) and have great capabilities of resolving different structural properties of DNA.
Recently, there is a rise in research utilizing different spectroscopic techniques in the field of biomedicine with intention of expanding and improving diagnostic methods making them faster, less expensive, and less invasive [13]. Even though fluorescence spectroscopy has long been used in clinical settings, due to the development of techniques such as immunofluorescence and fluorescence-activated cell sorting (FACS), IR spectroscopy techniques are not yet common in clinical applications. (FT)IR-based diagnostics is a promising field due to the technique being inexpensive, non-destructive, fast, and easy to operate [14]. However, in order to establish FTIR spectroscopy techniques in clinical applications several setbacks, such as precise acquisition and unambiguous interpretation of the spectra, statistically acceptable number, and sample size, must be overcome.
FTIR spectroscopy has proven useful in detecting conformational transitions in DNA thin films and related biological samples with the intent of detecting cancer markers [2,15,16,17] and other abnormalities caused by various types of DNA damage in cells and tissues [3,18], before and after drug administration [19], and tracking anti-cancer drug efficiency [20,21]. These studies are dependent on the ability to identify and preserve DNA in certain conformation and rely on the correct interpretation of conformation-related markers [2]. Thus, in order to improve the ability of IR spectroscopy techniques to be more accurately used in cancer diagnostics, damage detection, and drug efficiency, there is a need to further improve the interpretation of the spectra of DNA in different hydration and conformation states and to distinguish between the two.
In this study, utilizing FTIR spectroscopy, we provide detailed analysis of dynamics of A- to B-form transitions in DNA thin films obtained from sodium salt lyophilized DNA in NaCl solution under different hydration conditions based on a statistical analysis of a substantial number of spectra and extensive band shape analysis (peak fitting) in both the phosphate (1150–1000 cm−1) and sugar–phosphate region (900–750 cm−1). Systematically controlled hydration of DNA thin films provides information on dynamics and reorganization of hydration shells; the conformational transition from A-form to more ordered B-form is observed when sufficient time for conformation transition to take place is allowed. Additionally, a comparison of the spectral signatures and information obtained by peak fitting reveals and distinguishes between hydration and conformation sensitive bands, providing valuable information for various diagnostics purposes.
2. Materials and Methods
Dry salmon testes lyophilized DNA threads obtained from Sigma-Aldrich Corp., St. Louis, MO, USA (DNA sodium salt) were dissolved for 48 h in 10 mM NaCl solution at 4 °C. Routinely performed sample characterization such as protein content, pH, and conductivity was performed and obtained as presented in our previous research [22]. The final DNA concentration of all solutions was 5 g/L (15 mM DNA phosphate and 7.5 mM DNA base pairs).
In order to obtain thin films, 30 μL of the respective DNA stock solutions were deposited on optical grade silicon transmission windows and placed inside a desiccator chamber under an active vacuum (rotary vacuum pump) from 3 min to 40 min after which thin films were recorded (a) immediately after their removal from the desiccator chamber and (b) 5 min after their removal from the desiccator chamber, thus allowing the samples to come to ambient conditions (atmospheric pressure, room temperature and humidity), i.e., to stabilize.
FTIR spectra of thin films were recorded on a PerkinElmer Waltham, MA, USA Spectrum GX spectrometer equipped with a nitrogen-cooled Mercury-Cadmium-Telluride (MCT) detector and a KBr beam splitter. Spectra were measured at 25 °C and recorded in transmission mode with 4 cm−1 resolution and 64 co-added scans and later processed in Kinetics add-on for Matlab 2010, MathWorks, Natick, MA, USA. Raw data were baseline-corrected and normalized using the band at 966 cm−1 (deoxyribose C–C stretching mode) as an internal reference because it showed negligible spectral changes in position or intensity. All spectra obtained under the same conditions were averaged using an eFTIR software, EssentialFTIR, Monona, WI, USA and standard deviations were calculated using OriginPro 2019, OriginLab Corp., Northampton, MA, USA. For easier identification, average spectra obtained under different active vacuum times are abbreviated as 3-min film, 5-min film, etc. and, if not stated otherwise, are assumed to be obtained (b) “after stabilization.” Additional information on thin film preparation and statistical analysis (number of spectra etc.) can be found in Appendix A.
Band shape analysis (peak fitting) of the phosphate (1150–1000 cm−1) and sugar–phosphate region (900–750 cm−1) was performed using OriginPro 2019 and eFTIR software (for details see Appendix B).
3. Results
3.1. DNA Thin Films Obtained after 10 min
We start the analysis with the average spectrum of DNA thin film obtained after 10 min in an active vacuum (Figure 1). After approximately 2.5 min, the majority of bulk water has evaporated and the constant pressure of about 10 mbar is established in the desiccator chamber, allowing the thin film to stabilize for the remaining time (Figure 1, Left inset). The main absorption bands in the range from 1350–750 cm−1, presented in Figure 1, are assigned according to the literature and listed in Table 1.
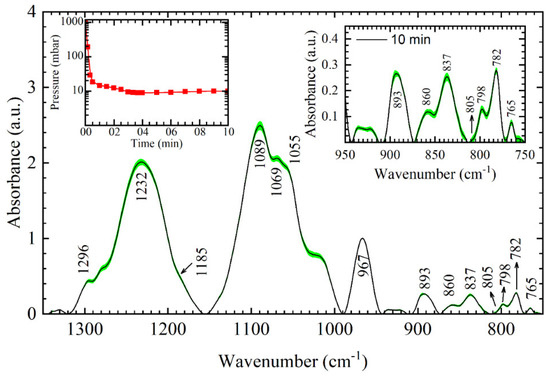
Figure 1.
Average Fourier transform infrared spectroscopy (FTIR) spectra (full line) and standard deviation (green filled pattern) of 10-min DNA thin film in the 1350–750 cm−1 range. Left inset: Pressure inside desiccator chamber. Right inset: Enlarged view of the respective DNA thin film in the sugar–phosphate region (950–750 cm−1). Numbers and arrows denote identified bands of the 10-min film.

Table 1.
Assignments of major bands found in FTIR spectrum of 10-min DNA thin film in the 1350–750 cm−1 region. Bands at 1232, 1185, 893, 860, 837, and 805 cm−1 are considered conformation-related bands. For reference, band positions of conformation-related bands of DNA thin films obtained by other authors are also presented.
The entire spectral range from 1350–750 cm−1 can be split into three parts, i.e., 1350–1150 cm−1 mostly dominated by asymmetric vibrations of PO2− groups, 1150–1000 cm−1 dominated by symmetric PO2− vibrations and vibrations of sugar and diester linkage, and 900–750 cm−1 region that contains important conformation-related markers whose vibrations can mainly be assigned to vibrations of deoxyribose. The average spectrum of 10-min films reflects several features that reveal the presence of both A- and B-form dsDNA structures presented in Figure 2. Main bands indicative of the presence of both forms are asymmetric PO2− vibration at 1232 cm−1, a shoulder at 1055 cm−1, and A- and B-form markers at 860 cm−1 and 837 cm−1, respectively. In a complete A-form, asymmetric PO2− vibration is found at ≈1240 cm−1, a strong absorption band at 1062–1072 cm−1 is present (instead of a shoulder at 1055 cm−1) and both A-form markers at 860 cm−1 and 805–810 cm−1 are present in the spectra [9,15]. Note that all of these features are not observed in the 10-min film; however, some extent of A-form exists in the thin film. An estimate of %B and %A form for 10-min film, calculated according to %B = (A837)/(A860 + A837) and %A = (A860)/(A860 + A837), gives ≈75% B-form and ≈25% A-form; A860 and A837 denotes integrated intensities of the respective bands [5]. The observed advantage in favor of B-form is corroborated further by two spectral features. First is the 1185 cm−1 band (A-form marker), which is missing in the spectra; the slope of the absorption line near 1185 cm−1 indicates the presence of the weak band; however, no shoulder or band is formed (Figure 1). The second is the absorption band at 893 cm−1. An A-form band splits into two bands; more intense absorption is evident at higher frequencies, 899 cm−1, while the 890 cm−1 band loses intensity [2,23]. Additionally, denaturation of the spectra may be safely excluded because several denaturation features aremissing in the spectra; frequency shift of asymmetric PO2− band to 1241 cm−1 and symmetric PO2− band to 1096 cm−1, complete loss of the 1055 cm−1 band and shift to 1069 cm−1 and broadening and shifting of the 966 cm−1 band to 957 cm−1 [2]. Thus, to conclude, DNA thin film obtained after 10 min in an active vacuum shows both A- and B-form markers, which altogether reflect B-like dsDNA conformation. To conclude, the 10-min film reflects mostly B-like conformation (≈75%), with the existence of A-form but to a lesser extent.
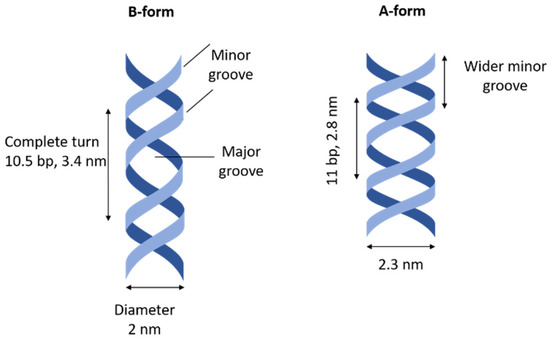
Figure 2.
Schematic representation of A- and B- forms of dsDNA structure. bp stands for base pair.
3.2. DNA Thin Films Obtained after 20 min and 40 min
Upon increasing the time spent in an active vacuum from 10 min to 20 min and 40 min, respectively, DNA thin films show only minor spectral changes, as evident from Figure 3.
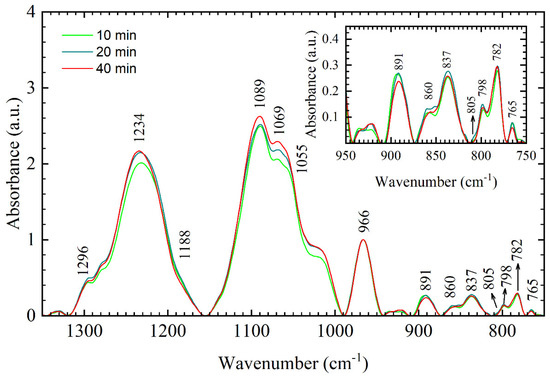
Figure 3.
Average FTIR spectra of different DNA thin films in the 1350–750 cm−1 range: 10-min film (light green), 20-min film (dark cyan), 40-min film (red). Inset: enlarged view of the respective DNA thin films in the sugar–phosphate region (950–750 cm−1). Numbers and arrows denote identified bands for the 40-min film.
These minor spectral changes include small frequency shift of the asymmetric PO2− vibration to 1233 cm−1 and 1234 cm−1 in 20 min and 40 min film, respectively, and intensity increase in symmetric PO2− vibration and intensity increase in a shoulder at ≈1030 cm−1. In the 900–750 cm−1 region, important A- and B-form markers (893, 860, 837, and 805 cm−1) stay silent; only small corrections in intensity can be found even though time spent in the chamber has increased four times (from 10 min to 40 min). Thus, observed spectral changes on PO2− vibrations indicate that small dehydration of the phosphate groups taking place in 20 min and 40 min film does not leave a significant impact on the conformation. Further structural transitions might have been prevented since constant pressure of about 10 mbar is established in the desiccator chamber after 2.5 min. This means that conformational changes are “locked” after equilibrium is established and only hydration of phosphate groups changes over time.
3.3. DNA Thin Films Obtained after 3 min and 5 min
Average FTIR spectra and standard deviations of the 3-min and 5-min films are presented in Figure 4. For comparison, standard deviations of 10-min and 40-min films are also presented.
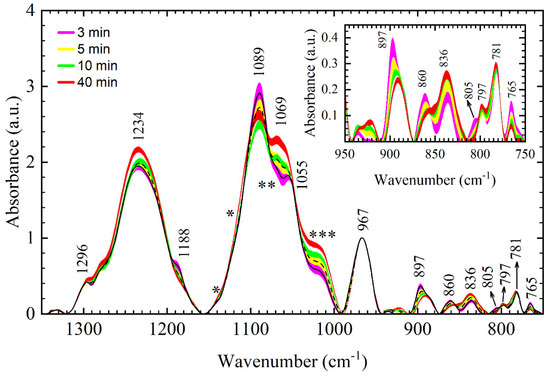
Figure 4.
Average FTIR spectra and standard deviations of different DNA thin films obtained by FTIR spectroscopy in the 1350–750 cm−1 range: 3-min film (black line denotes average spectrum, purple fill patter denotes standard deviation), 5-min film (black dashed line denotes average spectrum, and yellow fill pattern denotes standard deviation). For comparison, standard deviations of the 10-min film (green fill pattern) and 40-min film (red fill pattern) are presented. Inset: standard deviations of the respective DNA thin films in the sugar–phosphate region (950–750 cm−1). Numbers and arrows denote identified bands for the 3-min film. Labels *, ** and *** denote regions of spectral reshaping.
Two important observations can be made: the absorption spectrum of the 3-min film indicates changes in the conformation compared to 10-min and 40-min films, while a comparison of their respective standard deviations indicates that observed changes are statistically relevant. Important conformational markers that appear in the 3-min spectra are the appearance of a band at 1188 cm−1, shift and intensity increase in 893 cm−1 band to 897 cm−1 (inset of Figure 4), intensity increase in 860 cm−1 band, and the appearance of a band at 805 cm−1. All of the above are indicators of an increase in %A-form; indeed, calculation of the %A using extended equation %A = (A860 + A805)/(A860 + A805 + A837) estimates about 60% of A-form. In addition to conformation-related markers, intensity changes suggesting increased hydration include decreased intensity of the asymmetric PO2− vibration, increased intensity of the symmetric PO2− vibration, and reshaping of a 1055 cm−1 band [9].
Two more important changes that remained unaddressed so far can be identified in the 3-min and 5-min films; a strong decrease in intensity in the 1030 cm−1 region (Figure 4, ***) and a strong increase in 765 cm−1 band (inset of Figure 4). In order to better the interpretation of the spectra and this particular issue, we performed peak fitting of the absorption bands in the backbone region, i.e., the conformation-related region from 900–750 cm−1 (Figure 5) and region of symmetric PO2− vibration from 1150–1000 cm−1 (Figure 6). Important information obtained by peak fitting is summarized in Figure 7, in which relative integrated intensities of respective constituent Gaussians for 3-min, 5-min, 10-min, and 40-min films are presented.
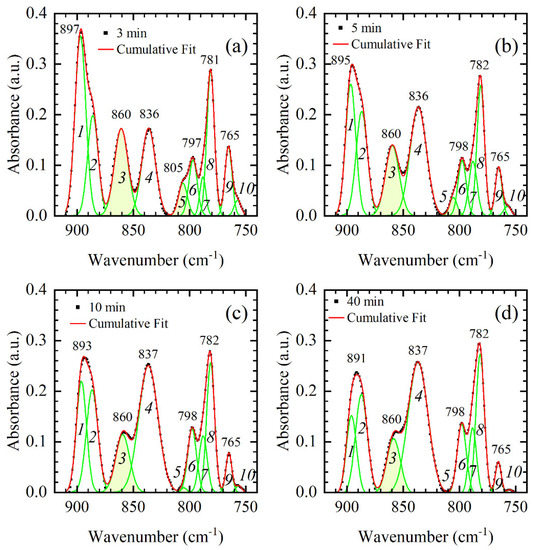
Figure 5.
Absorption bands in the backbone region from 900–750 cm−1 for representative DNA thin films: (a) 3-min, (b) 5-min, (c) 10-min, and (d) 40-min. Experimental data are presented by black squares and identified absorption bands are denoted by a number. The cumulative fit is presented by the red line, while ten constituent Gaussians are shown by the green lines and identified by numbers in italic from 1–10. Important A-form markers (860 cm−1 and 805 cm−1) are highlighted in yellow; complete loss of the 805 cm−1 band (Gaussian 5) is observed in 10-min and 40-min films.
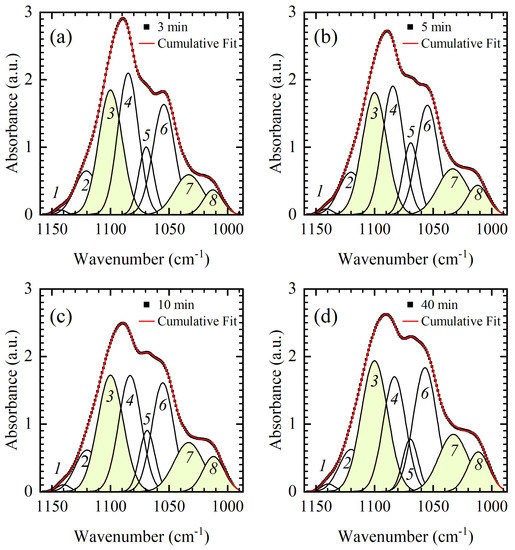
Figure 6.
Absorption bands in the backbone region of symmetric PO2− vibration from 1150–1000 cm−1 for representative DNA thin films: (a) 3-min, (b) 5-min, (c) 10-min, and (d) 40 min. Experimental data are presented by black squares. The cumulative fit is presented by the red line, while eight constituent Gaussians are shown by the black lines and identified by numbers from 1–8. Constituent Gaussians undergoing prominent integrated intensity increase are highlighted in yellow.
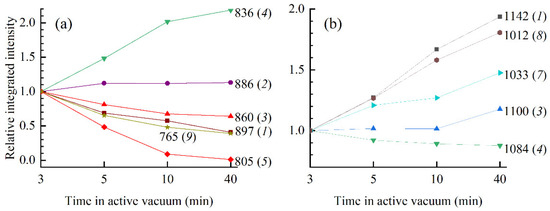
Figure 7.
Relative integrated intensity as a function of time in the active vacuum of respective constituent Gaussians for 3-min, 5-min, 10-min, and 40-min films in (a) 900–750 cm−1 region and (b) 1150–900 cm−1 region obtained by peak fitting. The relative integrated intensity was calculated according to Axmin/A3min. Frequencies of constituent Gaussians (in cm−1) and their respective labels (modes 1–10 and 1–8) are also presented.
The absorption spectrum in the backbone region from 900–750 cm−1 that contains important conformation-related bands can be successfully fitted by ten constituent Gaussians (modes); no frequency shift of the constituent Gaussians is observed, and only changes of the integrated intensities and bandwidths are observed (Figure 5). In Figure 5, absorbance maximum shows a red-shift from 897 to 891 in 3-min and 40-min film, respectively. However, this shift is a result of dissimilar intensity changes of modes 1 and 2 rather than frequency shift of the respective modes; the integrated intensity of mode 1 decreases by ≈60 % when 3-min and 40-min films are compared (from 4.3 to 1.75), while the integrated intensity of mode 2 shows a slight increase (from 2.3 to 2.65). Similar reshaping of the absorption spectra at about 890 cm−1 was found in [23]; intensity increase in higher frequency mode (in our spectra mode 1) denotes thin film with a higher fraction of A-form. This is confirmed further by the decrease in integrated intensities of modes 3 and 5 that correspond to A-form markers situated at 860 cm−1 and 805 cm−1, respectively. Note that the 805 cm−1 band completely vanishes from the absorption spectra of 10-min and 40-min film; consequently, so does mode 5 (Figure 7a). On the other hand, the signature of a B-form, i.e., 836 cm−1 band that corresponds to mode 4, experiences intensity increase. The integrated intensity of mode 4 increased by factor two when 3-min and 10-min films are compared (Figure 7a). However, when the 10-min film is compared to the 40-min film, no drastic changes of integrated intensity are observed on modes 3, 4, and 5 (Figure 7a). Conformational transition is thus complete in 10-min film, and additional time in the desiccator chamber has no significant impact on the conformation. Finally, a drastic decrease in intensity of the 765 cm−1 band, which is observed in the inset of Figure 4 and Figure 5, is accompanied by an almost threefold decrease in integrated absorption of mode 9. Since mode 9 (765 cm−1 band) experiences a continuous decrease in integrated intensity in 3-min, 5-min, 10-min, and 40-min spectra, it is more likely that the observed decrease reflects changes in hydration rather than conformation.
Details of the spectral reshaping of the backbone region of symmetric PO2− vibration from 1150–1000 cm−1 are disclosed by the fitting procedure presented in Figure 6. The entire region is successfully fitted by eight modes whose initial positions were extracted from the second derivative spectra (not shown). Upon close inspection of Figure 6a, modes 1–6 are easily detectable as they coincide with the inflections of the absorption curve, while the detection of modes 7 and 8 is less straightforward. Modes do not show any frequency shift with respect to the time spent in the vacuum chamber, nor does the absorption curve (obtained experimentally or by fit); only dissimilar intensity, integrated intensity, and bandwidth changes of the modes are observed. Thus, the spectral changes observed in the 1150–1000 cm−1 can be interpreted by an increase and a decrease in integrated intensities of constituent modes. Namely, the slight increase in absorption near 1135 cm−1 and 1120 cm−1 denoted by * in Figure 4, is a result of the strengthening of modes 1 and 3. Spectral reshaping denoted by ** in Figure 4 is more complex than suggested solely by inspection of the absorption band in that region. While the absorption spectra suggest symmetric PO2− vibration at 1089 cm−1 and phosphodiester bands at 1069 cm−1 and 1055 cm−1, a large peak placed in that region is influenced by modes 3–7. In the 3-min, 5-min, and 10-min films absorption intensity of maximum at 1089 cm−1 decreases mostly due to a decrease in integrated intensities of modes 4 and 5 (Figure 6a–c)). However, in 40-min film, an increase in integrated intensities of modes 3, 6, and 7 overpowers the decrease in modes 4 and 5 (Figure 7b and Figure 6d, respectively) and results in increased intensity of peak at 1089 cm−1 (Figure 6d). This final stage observed in the 40-min film can be attributed to changes in hydration near phosphate groups. Finally, a large intensity increase near 1030 cm−1 denoted by *** in Figure 4 is mostly due to the large continuous integrated intensity increase in modes 7 and 8 (Figure 6 and Figure 7b). Because intensity increase near 1030 cm−1 continues even after the changes observed on the conformation markers saturate, it is likely that the two modes are highly susceptible to hydration rather than conformation.
4. Discussion
In the previous section, the main differences between DNA thin films were detected and ascribed to either conformational changes or changes in hydration. All thin films studied, 3, 5, 10, 15, 20, 25, and 40 min, can be roughly classified into two groups with respect to their vibrational signature in the backbone region, i.e., 3-min and 5-min films in the first, and 10–40 min films in the second. In the first group, 3-min and 5-min film showed similar spectral features reflecting A-like dsDNA conformation (Figure 4). On the other hand, 10–40 min films showed no significant variations in B-like conformation and only a small variation in the phosphodiester bands with respect to the time spent in the vacuum chamber (Figure 3). Importantly, 10–40 min films have a different spectral signature in the 900–750 cm−1 region than 3-min and 5-min films (i.e., compare panels of Figure 5). Band shape analysis presented in Figure 4, Figure 5 and Figure 6 has proven very illuminating in resolving bands and constituent modes sensitive to changes in conformation and hydration. The band at 897 cm−1 (3 -min film) was found very sensitive to desiccation time; dynamics of modes 1 and 2 resulted in spectral reshaping that can easily be tracked in the spectra and thus might serve as a new spectral signature of conformational transitions. On the other hand, a shoulder near 1030 cm−1 and a band at 765 cm−1 showed great sensitivity to changes in hydration conditions without saturation, making them good candidates for tracking changes on the backbone that might have taken place as a result of changes in DNA hydration shells.
In this section, we focus our discussion on two important issues— why the 3-min film reflects more A-like conformation than the 10-min film, and why almost no conformational changes are observed in the spectra after 10 min. It was previously found that the conformational B → A and A → B transitions are related to the changes in hydration, but authors also highlight the importance of dynamics of conformational transitions [2,15,27]. Due to the slow kinetics of the transition, attainment of equilibrium between B- and A-forms caused by rapid changes in hydration may be prevented [27]. This is why most conformation studies that use specially designed chambers in which hydration is controlled by the use of special salts require slow and step-wise protocols in which samples are maintained from several up to 24 h [9]. In our study, the opposite is achieved in the desiccator chamber. DNA liquid samples are “shocked” within the first 2 min with the rapid changes in the atmosphere where pressure changes from 1000–10 mbar in the desiccator chamber (left inset of Figure 1). Approaching 3 min, the formation of the thin film is visible in the chamber and constant pressure of 10 mbar is established. The change of DNA aggregate state from solution to the thin film is thus stopped and 3-min film spectra are taken; DNA spectra reflect more disordered A-like conformation. The level of disorder in the DNA structure has previously been calculated with respect to integrated intensity ratios of the deoxyribose bands at 1069 cm−1 and 1055 cm−1 [20]. Because thin films are allowed more time in the desiccator chamber, the integrated intensity ratio 1069/1055 decreases from 0.42 in the 3-min film to 0.28 in the 40-min film, indicating transition into a more ordered state. If enough time is allowed, after approximately 10 min, structural organization of DNA is complete and 10–40 min thin films reflect similar, B-like conformation. Again, note that after 3–5 min, there are no more changes in the pressure in the desiccator chamber (left inset of Figure 1); thin films merely stay up to 30 additional minutes in the same atmosphere, which does not have as strong an influence on the spectra as the first few minutes of the process. Consequently, 10–40 min films show similar spectral features in the conformation-related 900–750 cm−1 region. Different stages of B-form formation in 3-min and 10-min films, as indicated by the FTIR spectra and calculated using integrated absorptions of 860 cm−1, 805 cm−1, and 836 cm−1 bands, are presented in Figure 8 and compared to DNA manganese salt thin films obtained in our previous work [31]. Due to increased screening of Mn2+ ions, in DNA manganese salt prepared by similar protocol (10 min desiccation time and same DNA type and concentration) complete formation of B-form is evident; 860 cm−1 and 805 cm−1 markers are missing in the spectra and ratio of integrated absorptions yield 94% B-form. However, in DNA sodium salt presented in this study, only 805 cm−1 marker completely vanishes, while 860 cm−1 marker experiences intensity and integrated intensity decrease, as evident in Figure 8. Thus, even though 10-min film reflects mostly B-like conformation, some traces of A-form are identified in the spectra. The coexistence of A- and B-forms in DNA in which sections of phosphate groups are in different conformations was also reported by different NMR [32] and FTIR studies [2].
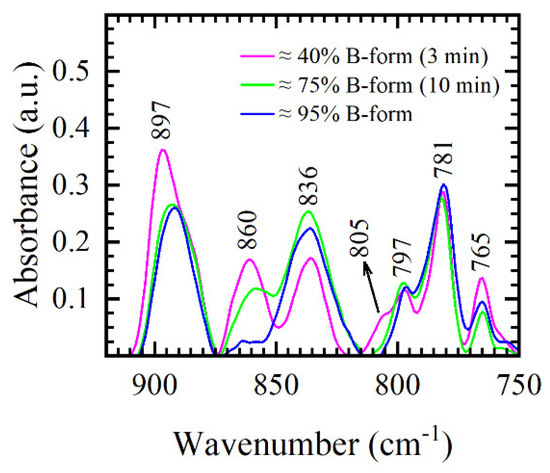
Figure 8.
FTIR spectra of DNA thin films and comparison of different levels of B-form. DNA sodium salt with the coexistence of both 3-min (purple) and 10-min (green) films. DNA manganese salt (blue), in which the full formation of B-form is evident, is shown for comparison (data taken from [31]).
Finally, we address the issue of resolving hydration-, conformation-, and ambient-related signatures in the spectra. In a fully hydrated state, DNA is surrounded by several hydration shells. The primary hydration shell of DNA is different from the bulk water and at 80% relative humidity it is considered complete with about 20 water molecules per nucleotide [1]. In this hydrated state, DNA assumes B-form and changes in hydration may trigger conformational transitions that occur stepwise and cooperatively [1]. One of the first studies that studied the structural organization of water molecules upon rehydration by Falk et al. concluded that water is first absorbed by the PO2− groups, then by C–O and C–C groups of the phosphodiester linkage, and finally by the DNA bases [33]. Pevsner and Diem found their study complementing and observed spectral changes of DNA phase transitions in terms of two concurrent effects—conformational change and hydration of the phosphate groups [9]. Their study suggested that when the radical conformational transition takes place (fully hydrated DNA sample in B-form opposed to dry DNA pellet in A-form) substantial shifts in the frequency of asymmetric stretching PO2− vibration from 1225 cm−1 to 1238 cm−1 and symmetric stretching PO2− vibration from 1088 cm−1 to 1093 cm−1 occur. On the other hand, hydration effects are recognized by infrared absorption intensity changes of the two phosphate vibrations due to an increase in the local dielectric of the surroundings of the phosphate groups [9]. A nice correlation with our data can be found for their two hydrated pallets, i.e., 1090 cm−1 and 1235 cm−1 and 1088 cm−1 and 1229 cm−1, respectively, compared to our thin films 1088 cm−1 and 1230–1234 cm−1. However, radical shifts of asymmetric and symmetric vibrations reported in [9] are not found in our research, supporting less drastic changes to the conformation and the coexistence of both forms in thin films. Unfortunately, the authors do not provide any information on the bands below 950 cm−1; therefore, the region that contains important A- and B-form markers [34] cannot be compared to their study.
Our results further support the interpretation of spectral changes with respect to two competing effects (hydration and conformation), although with several subtleties. Our study does not cover DNA transitions in extreme conditions but rather in-between and, more importantly, extends interpretation of the spectra below 950 cm−1 so that correlation with the sugar vibrations can be established. As substantial shifts of asymmetric and symmetric PO2− vibrations are missing in our spectra, phosphate bands alone cannot be used in monitoring conformational transitions; asymmetric PO2− vibration is found in the 1230–1234 cm−1 interval reflecting only “fine-tuning” of the conformation, while symmetric PO2− vibration remains at 1089 cm−1. On the other hand, conformation-related markers at 860 cm−1, 836 cm−1, and 805 cm−1 track conformational transition more effectively; a decrease in A-form from ≈60% to ≈25% in 3-min and 10-min films, respectively, is observed. Additionally, backbone vibration at 893 cm−1 is also found to be sensitive to conformational transitions because it experiences severe spectral reshaping due to dissimilar integrated intensity changes of constituent modes. The band at 893 cm−1 is thus a valuable conformation-related marker, especially if the information on the lower frequency modes is missing in the spectra. Finally, note that changes in 893, 860, 836, and 805 cm−1 eventually saturate, indicating the end of conformational transitions after approximately 10 min in the desiccation chamber. Hydration-related effects, on the other hand, do not seem to saturate. Asymmetric and symmetric PO2− vibration at ≈1234 cm−1 and 1089 cm−1, respectively, and backbone vibrations near 1030 cm−1 and 765 cm−1 exhibit continuous changes without saturation and consequently show great sensitivity to hydration conditions near PO2− groups rather than conformational transitions.
Vibrations of the phosphate groups were also found to be sensitive to ambient conditions, which is best evident from the analysis of 180 samples of 5-min DNA thin films. The 5-min films were obtained in two ways—(a) immediately after their removal from the desiccator chamber and (b) 5 min after their removal from the desiccator chamber, i.e., “before” and “after” stabilization (Figure 9 and Figure A1). Average spectra of 5-min films, obtained by either (a) or (b), are in the same conformation as evident by the lack of significant frequency shifts in the entire spectral region from 1350–750 cm−1 and lack of changes in the intensities of conformation related markers in the 900–750 cm−1 region (Figure 9). Only differences in absorption intensities of asymmetric and symmetric PO2− vibration and backbone vibrations near 1030 cm−1 are evident in the spectra and are most likely caused by the atmospheric changes that happen as films transition from a vacuum atmosphere to an ambient atmosphere. Furthermore, note that spectral differences between films obtained by (a) and (b) are greatly reduced in 40-min films (inset of Figure 9), i.e., the influence of ambient conditions can be reduced by increasing the desiccation time. This spectral behavior supports the standpoint in which hydration-, conformation- and ambient-related effects are distinguished during the structural organization of DNA and highlights the importance of conformation-related markers in the, often overlooked, 900–750 cm−1 region. More on ambient-related spectral features can be found in the second paragraph of Appendix A and Figure A1.
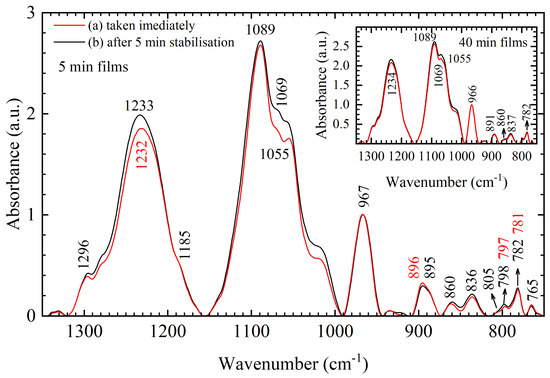
Figure 9.
Average FTIR spectra of 5-min DNA thin films in the 1350–750 cm−1 range taken (a) immediately after removal from desiccator chamber (red) and (b) after 5 min stabilization in ambient conditions (black). Inset: for comparison, an average of 40-min DNA thin films are also presented. Numbers and arrows denote identified bands of the 5-min films following their respective colors when the difference in band positions is observed.
Finally, we comment on the importance of reproducibility of the method, i.e., controlling structural transitions utilizing chambers under active vacuum with respect to the sensitivity of the phosphodiester bands. In the light of this study, and with the distinct intention of utilizing FTIR techniques in cancer diagnostics and diagnostics of DNA damage and other abnormalities, special care must be taken in the acquisition and interpretation of the spectra as both drying techniques and small ambient changes may induce a number of spectral changes. Some authors, such as Wood et al., also stressed and recognized the importance of sample-handling in the case of cells fixed by fixatives as ethanol/methanol and samples obtained by air-drying because great variations in the spectra might occur [2]. This is best evident in Figure 9 and Figure A1, in which an increase in the time of thin films in the desiccator chamber almost completely removed the artifacts arising due to ambient conditions (40-min film) versus a similar technique that produced more variability (5-min film). This might prove to be of great importance in situations when one deals with a large number of spectra in terms of differentiating experimental and control groups and in the case of different types of classification and modeling such as k nearest neighbors (KNN), support vector machine algorithms (SVMDA), principal component analysis (PCA), partial least squares (PLS), etc. that are extensively used in biomedical research. Because one of the main obstacles of establishing FTIR spectroscopy in routine applications in clinical environments lies in the unambiguous interpretation of the spectra, the appearance of spectral variations and scattering artifacts must be elucidated and minimized.
5. Conclusions
In this study, we utilized FTIR spectroscopy to monitor the structural organization of dsDNA in thin films obtained in carefully controlled and monitored hydration conditions. Analysis based on a large number of spectra obtained in the 1350–750 cm−1 range proved that by controlling the time of desiccation (from 3 min to 40 min) it is possible to (a) track transition of DNA in different hydrated states of thin films and (b) obtain DNA in thin films in different conformation with great reproducibility. Additionally, we were able to almost completely remove spectral variations caused by ambient conditions by increasing the time of desiccation without inducing significant conformational changes in thin films. Specifically, 3-min and 5-min films yielded in A-like dsDNA conformation, while 10–40 min films reflected B-like conformation. Utilizing band shape analysis (peak fitting) of two distinct regions, the conformation-related region from 900–750 cm−1 and the backbone region from 1150–1000 cm−1, we were able to resolve between the bands sensitive to conformation changes and the ones sensitive to hydration changes. Phosphate vibrations at ≈1230 cm−1 and 1089 cm−1 and backbone vibrations at ≈1030 cm−1 and 765 cm−1 were found to be sensitive to changes in hydration rather than conformation due to their continuous changes in intensity even after changes on the conformation markers saturate. Conformational changes were ascribed to bands at ≈890, 860, 837, and 805 cm−1. Our results consistently demonstrate the ability of asymmetric and symmetric phosphate vibrations in thin films to show significant band reshaping and intensity changes without conformational transition. Consequently, the importance of extending the spectral range to often overlooked backbone regions below 900 cm−1 is stressed, especially in the case of utilizing FTIR spectroscopy for clinical applications.
Author Contributions
Conceptualization, K.S. and S.D.B.; methodology, K.S. and S.D.B.; formal analysis, K.S.; investigation, K.S., N.Š., and M.K.; data curation, K.S., N.Š., M.K.; writing—original draft preparation, K.S.; writing—review and editing, K.S. and S.D.B.; supervision, S.D.B.; funding acquisition, S.D.B. All authors have read and agreed to the published version of the manuscript.
Funding
This research and publication was co-financed by the European Union through the Europe Regional Development Fund, Operational Program Competitiveness, and Cohesion, under grant agreement No. KK.01.1.1.01.0008, Reproductive and Regenerative Medicine—Exploring New Platforms and Potentials.
Institutional Review Board Statement
Not applicable.
Informed Consent Statement
Not applicable.
Conflicts of Interest
The authors declare no conflict of interest. The funders had no role in the design of the study; in the collection, analyses, or interpretation of data; in the writing of the manuscript, or in the decision to publish the results.
Appendix A
In this section, we provide details of DNA thin film preparation and present average spectra of all thin films obtained in this study. DNA thin films were obtained by placing 30 μL of the respective DNA stock solutions on optical grade silicon transmission windows and placed inside a desiccator chamber where the vacuum effect was achieved and maintained (active vacuum) by Leybold S1 rotary vacuum pump equipped with Leybold Thermovac TTR91N vacuum gauge (Leybold GmbH, Kein, Germany). The time spent in the desiccator chamber varied from 3 min to 40 min after which thin films were recorded (a) immediately after their removal from the desiccator chamber and (b) 5 min after their removal from the desiccator chamber, thus allowing the samples to come to ambient conditions (atmospheric pressure, room temperature and humidity), i.e., to stabilize. We would like to stress the importance of this sample preparation. First, by placing samples inside a chamber with an active vacuum, one has more control over thin film formation than in standard air-dried procedures usually associated with attenuated total reflectance (ATR) and other IR techniques; thin films are prepared in equal conditions such as pressure, temperature, and time, resulting in less variation in the spectra. Second, by recording spectra (a) “before stabilization” and (b) “after stabilization,” it is possible to distinguish between hydration conditions that induce conformational transitions and those that do not. According to the stated protocols, 369 DNA thin films were prepared in total and one spectrum per thin film was obtained. Thus, spectra of DNA thin films with respect to time in active vacuum were collected as follows: 3 min (54 spectra), 5 min (180 spectra), 10 min (54 spectra), 15 min (18 spectra), 20 min (9 spectra), 25 min (9 spectra), and 40 min (45 spectra). All spectra obtained under the same conditions were averaged using eFTIR software and standard deviations were calculated using OriginPro 2019. For easier identification, average spectra of DNA thin films obtained under different active vacuum times are abbreviated as 3-min film, 5-min film, etc.
In Figure A1, average spectra of 3-min, 5-min, 10-min, 15-min, 20-min, 25-min, and 40-min films obtained (a) immediately after their removal from the desiccator chamber and (b) five minutes after their removal from the desiccator chamber are presented. In Figure A1, it is evident that there is no difference in conformation between the spectra obtained by (a) and (b) in any of the panels (a)–(g), as evident by the lack of changes in conformation related bands in the 900–750 cm−1 region. In other words, after the thin film is obtained and removed from the desiccator chamber, regardless of the desiccation time, conformational changes are locked and cannot be significantly changed by ambient conditions. The only differences observed between the spectra obtained by (a) and (b) in each panel are variations in absorption intensities of asymmetric and symmetric PO2− vibration and backbone vibration near 1030 cm−1. These small variations in absorption intensities, along with changes in the spectral shape in the 1070–1050 cm−1 region are more expressed in 3-min and 5-min films (e.g., see Figure A1b). By increasing the time spent in the desiccation chamber, observed differences in absorption intensities between the spectra obtained by (a) and (b) are reduced and differences in spectral shape vanish; the 40-min film shows only negligible differences in the entire spectral range studied, 1350–750 cm−1. Spectral behavior of 3-min and 5-min films highlights the sensitivity of asymmetric and symmetric PO2− vibration and backbone vibrations at ≈1030 cm−1 to ambient conditions; even though no frequency shifts and no conformational changes are observed, variations in intensity might occur. Note that the extents of the spectral variations are rather small; however, they might be crucial in computational analysis and interpretation of the spectra. Multivariate statistical methods and classification techniques such as principal component analysis (PCA), partial least squares (PLS), k-nearest neighbors algorithms (KNN), and support vector machine (SVMDA), just to name the few, are often used tools in infrared spectroscopy as a diagnostic technique [14,35]. Even though powerful, these tools are also sensitive to artifacts that might be caused by sampling techniques and acquisition of the spectra. Thus, the diagnostic capabilities of infrared spectroscopy depend on quality assurance of the sample preparation protocols and minimization of spectral variations due to these artifacts.

Figure A1.
Average FTIR spectra in the 1350–750 cm−1 range taken (a) immediately after removal from desiccator chamber (red) and (b) after 5 min stabilization in ambient conditions (black) for different DNA thin films; (a) 3-min, (b) 5-min, (c) 10-min, (d) 15-min, (e) 20-min, (f) 25-min and (g) 40-min. Numbers and arrows denote identified bands following their respective colors.
Appendix B
The average absorption spectra of the respective films were fitted utilizing OriginPro 2019 software; the range of 900–750 cm−1 and 1150–1000 cm−1 was successfully fitted by a sum of 10 and eight Gaussians, respectively,
where fit parameters are the wavenumber (), the bandwidth () and the integrated intensity (). Note that gives the measure of intensity (I), while = FWHM/sqrt(ln(4)), where FWHM is the full width at half maximum. The number of constituent Gaussians for 900–750 cm−1 was determined visually as maximums of the most bands are spaced apart, while for 1150–1000 cm−1 region, in addition to inflection points suggested from the absorption spectra, second derivative spectra were calculated by the Savitzky–Golay method (11-point window smoothing, three polynomial order) utilizing eFTIR software.
References
- Egli, M.; Saenger, W. Principles of Nucleic Acid Structure; Springer: New York, NY, USA, 2013. [Google Scholar]
- Wood, B.R. The importance of hydration and DNA conformation in interpreting infrared spectra of cells and tissues. Chem. Soc. Rev. 2016, 45, 1980–1998. [Google Scholar] [CrossRef]
- Sofińska, K.; Wilkosz, N.; Szymoński, M.; Lipiec, E. Molecular Spectroscopic Markers of DNA Damage. Molecules 2020, 25, 561. [Google Scholar] [CrossRef]
- Sinden, R.R. DNA Structure and Function; Elsevier Science: Amsterdam, The Netherlands, 2012. [Google Scholar]
- Liquiers, J.; Taillandier, E.; Peticolas, W.L.; Thomas, G.A. The Infrared and Raman Spectra of the Duplex of d(GGTATACC) in theCrystal Show Bands Due to Both the A-form and the B-form of DNA. J. Biomol. Struct. Dyn. 1990, 8, 295–302. [Google Scholar] [CrossRef]
- Bloomfield, V.A.; Crothers, D.M.; Tinocco, I. Nucleic Acids: Structures, Properties and Functions; University Science Books: Sausalito, CA, USA, 2000. [Google Scholar]
- Gorenstein, D.G. Conformation and Dynamics of DNA and Protein-DNA Complexes by 31P NMR. Chem. Rev. 1994, 94, 1315–1338. [Google Scholar] [CrossRef]
- Campagne, S.; Gervais, V.; Milon, A. Nuclear magnetic resonance analysis of protein-DNA interactions. J. R. Soc. Interface 2011, 8, 1065–1078. [Google Scholar] [CrossRef]
- Pevsner, A.; Diem, M. Infrared Spectroscopic Studies of Major Cellular Components. Part II: The Effect of Hydration on the Spectra of Nucleic Acids. Appl. Spectrosc. 2001, 55, 1502–1505. [Google Scholar] [CrossRef]
- Hassan, A.; Macedo, L.J.; de Souza, J.C.; Lima, F.C.; Crespilho, F.N. A combined Far-FTIR, FTIR Spectromicroscopy, and DFT Study of the Effect of DNA Binding on the [4Fe4S] Cluster Site in EndoIII. Sci. Rep. 2020, 10, 1931. [Google Scholar] [CrossRef] [PubMed]
- Mello, M.L.; Vidal, B.C. Changes in the infrared microspectroscopic characteristics of DNA caused by cationic elements, different base richness and single-stranded form. PLoS ONE 2012, 7, e43169. [Google Scholar] [CrossRef] [PubMed]
- Kulkarni, A.; Kim, B.; Dugasani, S.R.; Joshirao, P.; Kim, J.A.; Vyas, C.; Manchanda, V.; Kim, T.; Park, S.H. A novel nanometric DNA thin film as a sensor for alpha radiation. Sci. Rep. 2013, 3, 2062. [Google Scholar] [CrossRef] [PubMed]
- Sahu, R.K.; Mordechai, S. Spectroscopic techniques in medicine: The future of diagnostics. Appl. Spectrosc. Rev. 2016, 51, 484–499. [Google Scholar] [CrossRef]
- Whelan, D.R.; Bambery, K.R.; Puskar, L.; McNaughton, D.; Wood, B.R. Quantification of DNA in simple eukaryotic cells using Fourier transform infrared spectroscopy. J. Biophotonics 2013, 6, 775–784. [Google Scholar] [CrossRef]
- Whelan, D.R.; Bambery, K.R.; Heraud, P.; Tobin, M.J.; Diem, M.; McNaughton, D.; Wood, B.R. Monitoring the reversible B to A-like transition of DNA in eukaryotic cells using Fourier transform infrared spectroscopy. Nucleic Acids Res. 2011, 39, 5439–5448. [Google Scholar] [CrossRef] [PubMed]
- Kalmodia, S.; Parameswaran, S.; Yang, W.; Barrow, C.J.; Krishnakumar, S. Attenuated Total Reflectance Fourier Transform Infrared Spectroscopy: An analytical technique to understand therapeutic responses at the molecular level. Sci. Rep. 2015, 5, 16649. [Google Scholar] [CrossRef] [PubMed]
- Zelig, U.; Barlev, E.; Bar, O.; Gross, I.; Flomen, F.; Mordechai, S.; Kapelushnik, J.; Nathan, I.; Kashtan, H.; Wasserberg, N.; et al. Early detection of breast cancer using total biochemical analysis of peripheral blood components: A preliminary study. BMC Cancer 2015, 15, 408. [Google Scholar] [CrossRef] [PubMed]
- Dovbeshko, G.I.; Gridina, N.Y.; Kruglova, E.B.; Pashchuk, O.P. FTIR spectroscopy studies of nucleic acid damage. Talanta 2000, 53, 233–246. [Google Scholar] [CrossRef]
- Alhazmi, H.A. FT-IR Spectroscopy for the Identification of Binding Sites and Measurements of the Binding Interactions of Important Metal Ions with Bovine Serum Albumin. Sci. Pharm. 2019, 87, 5. [Google Scholar] [CrossRef]
- Dovbeshko, G.I.; Chegel, V.I.; Gridina, N.Y.; Repnytska, O.P.; Shirshov, Y.M.; Tryndiak, V.P.; Todor, I.M.; Solyanik, G.I. Surface enhanced IR absorption of nucleic acids from tumor cells: FTIR reflectance study. Biopolymers 2002, 67, 470–486. [Google Scholar] [CrossRef] [PubMed]
- Repnytska, O.P.; Dovbeshko, G.I.; Tryndiak, V.P.; Todor, I.M.; Kosenkov, D.V. Structural organisation of nucleic acids from tumour cells. Faraday Discuss. 2004, 126, 61–76. [Google Scholar] [CrossRef] [PubMed]
- Serec, K.; Babic, S.D.; Podgornik, R.; Tomic, S. Effect of magnesium ions on the structure of DNA thin films: An infrared spectroscopy study. Nucleic Acids Res. 2016, 44, 8456–8464. [Google Scholar] [CrossRef] [PubMed]
- Taillandier, E.; Liquier, J. Infrared-Spectroscopy of DNA. Methods Enzym. 1992, 211, 307–335. [Google Scholar]
- Bhattacharyya, R.G.; Nayak, K.K.; Chakrabarty, A.N. Interaction of MgATP2- with DNA: Assessment of Metal-Binding Sites and DNA Conformations by Spectroscopic and Thermal Denaturation Studies. Inorg. Chim. Acta 1988, 153, 79–86. [Google Scholar] [CrossRef]
- Dirico, D.E.; Keller, P.B.; Hartman, K.A. The Infrared-Spectrum and Structure of the Type-I Complex of Silver and DNA. Nucleic Acids Res. 1985, 13, 251–260. [Google Scholar] [CrossRef]
- Champeil, P.; Tran, T.P.L.; Brahms, J. New Approach to Characterization of B-Forms and A-Forms of DNA by IR Spectroscopy. Biochem. Biophys. Res. Commun. 1973, 55, 881–887. [Google Scholar] [CrossRef]
- Keller, P.B.; Hartman, K.A. The Effect of Ionic Environment and Mercury(II) Binding on the Alternative Structures of DNA. An Infrared Spectroscopic Study. Spectrochim. Acta Part A Mol. Spectrosc. 1986, 42, 299–306. [Google Scholar] [CrossRef]
- Andrushchenko, V.V.; Kornilova, S.V.; Kapinos, L.E.; Hackl, E.V.; Galkin, V.L.; Grigoriev, D.N.; Blagoi, Y.P. IR-spectroscopic studies of divalent metal ion effects on DNA hydration. J. Mol. Struct. 1997, 408, 225–228. [Google Scholar] [CrossRef]
- Matsui, H.; Toyota, N.; Nagatori, M.; Sakamoto, H.; Mizoguchi, K. Infrared spectroscopic studies on incorporating the effect of metallic ions into a M-DNA double helix. Phys. Rev. B 2009, 79, 235201. [Google Scholar] [CrossRef]
- Letellier, R.; Ghomi, M.; Taillandier, E. Interpretation of DNA Vibration Modes: IV—A Single-Helical Approach to Assign the Phosphate-Backbone Contribution to the Vibrational Spectra in A and B Conformations. J. Biomol. Struct. Dyn. 1989, 6, 755–768. [Google Scholar] [CrossRef]
- Babić, S.D.; Serec, K. Sodium and manganese salt DNA thin films: An infrared spectroscopy study. Spectrochim. Acta Part A Mol. Biomol. Spectrosc. 2020, 241, 118646. [Google Scholar] [CrossRef] [PubMed]
- Song, Z.; Antzutkin, O.N.; Lee, Y.K.; Shekar, S.C.; Rupprecht, A.; Levitt, M.H. Conformational transitions of the phosphodiester backbone in native DNA: Two-dimensional magic-angle-spinning 31P-NMR of DNA fibers. Biophys. J. 1997, 73, 1539–1552. [Google Scholar] [CrossRef][Green Version]
- Falk, M.; Hartman, K.A.; Lord, R.C. Hydration of Deoxyribonucleic Acid. III. A Spectroscopic Study of the Effect of Hydration on the Structure of Deoxyribonucleic Acid. J. Am. Chem. Soc. 1963, 85, 391–394. [Google Scholar] [CrossRef]
- Diem, M. Modern Vibrational Spectroscopy and Micro-Spectroscopy: Theory, Instrumentation and Biomedical Applications; Wiley: Hoboken, NJ, USA, 2015. [Google Scholar]
- Wood, B.R.; Quinn, M.A.; Burden, F.R.; McNaughton, D. An investigation into FTIR spectroscopy as a biodiagnostic tool for cervical cancer. Biospectroscopy 1996, 2, 143–153. [Google Scholar] [CrossRef]
Publisher’s Note: MDPI stays neutral with regard to jurisdictional claims in published maps and institutional affiliations. |
© 2021 by the authors. Licensee MDPI, Basel, Switzerland. This article is an open access article distributed under the terms and conditions of the Creative Commons Attribution (CC BY) license (http://creativecommons.org/licenses/by/4.0/).