Article

Towards the Development of an Automatic UAV-Based Indoor Environmental Monitoring System: Distributed Off-Board Control System for a Micro Aerial Vehicle

by
Jorge Solis
1,*,
Christoffer Karlsson
1,
Simon Johansson
1 and
Kristoffer Richardsson
2
1
Department for Engineering and Physics, Karlstad University, 651 88 Karlstad, Sweden
2
Bitcraze AB, 212 22 Malmö, Sweden
*
Author to whom correspondence should be addressed.
Appl. Sci. 2021, 11(5), 2347; https://doi.org/10.3390/app11052347
Submission received: 6 November 2020 / Revised: 25 February 2021 / Accepted: 2 March 2021 / Published: 6 March 2021
(This article belongs to the Special Issue Modelling and Control of Mechatronic and Robotic Systems)

Abstract

:
This research aims to develop an automatic unmanned aerial vehicle (UAV)-based indoor environmental monitoring system for the acquisition of data at a very fine scale to detect rapid changes in environmental features of plants growing in greenhouses. Due to the complexity of the proposed research, in this paper we proposed an off-board distributed control system based on visual input for a micro aerial vehicle (MAV) able to hover, navigate, and fly to a desired target location without considerably affecting the effective flight time. Based on the experimental results, the MAV was able to land on the desired location within a radius of about 10 cm from the center point of the landing pad, with a reduction in the effective flight time of about 28%.

1. Introduction

During the last few decades, the forest industry has progressed from manual to machine monitoring and harvesting to reduce hazards to the worker and increase productivity. Thanks to the recent advances in robot technology, remote control, vision, etc., autonomous machines now are being employed in agriculture, construction, medicine, and manufacturing. As a consequence, harvesters nowadays are controlled with a control area network (CAN)-based distributed control system and information system, with GPS localization to log data [1]. However, forestry is still a demanding area for robot technology, where reliability, precision, and adaptability to the dynamic changes are required to develop more enhanced autonomous or tele-operated operations. So far, mobile robots have been introduced as fundamental data-gathering tools for taking and processing high-resolution samples [1]. However, it is still hard to penetrate the forest autonomously due to the rough terrain and wheel slip. More recently, the introduction of unmanned aerial vehicles (UAVs) has provided a more efficient means of gathering environmental data where the operator can choose the spatial and time resolution of the data to be acquired while covering large areas [2]. Even though different kinds of UAVs have been proposed for automatic environmental monitoring, there are still technical challenges in terms of perception, control, and locomotion capabilities [3].
In particular, the automatic environmental monitoring in indoor farming (e.g., in greenhouse agriculture) is still limited [4]. By means of micro-aerial vehicles (MAV), it may be possible to measure climate features, monitor the plant growth, etc. However, there is still a range of limitations (e.g., power computation, autonomy, payload capacity, battery, etc.). Therefore, in this paper we proposed a vision-based control system to achieve autonomous navigation and landing in indoor environments without requiring advanced calibration procedures or additional external sensors.
Our main contribution is to propose a distributed off-board method capable of detecting a predefined fiducial marker and inferring information from a single defined marker in order to allow the MAV to localize itself relative to the target location even in the existence of disturbances in indoor environments (e.g., occlusion). The main reason why we have selected a distributed off-board method was due to the computation power and battery constrains of the MAV. Moreover, we have analyzed and compared different experimental methods for tuning the control parameters in order to select the most proper method that not only reduce the time required for tuning when the payload is changed (by simulating different payloads). Finally, the selected control parameters were also analyzed in order to verify the effect on the effective flight time, which has scarcely been investigated in the literature.

Related Work

Falanga et al. [5] introduced an on-board sensing approach for a quadcopter system capable of achieving autonomous navigation and landing on a movable target location. Lange et al. [6] proposed a similar approach with an on-board computation based on optical flow and image-based detection where the target landing location was denoted by means of placing several concentric white rings on a black background to enhance the landing marker contrast. Moreover, Foster et al. [7] introduced a simultaneous localization and mapping (SLAM) method based on a monocular camera to build a map of an environment for achieving autonomous hovering for a micro aerial vehicle. Based on the monocular SLAM method, the micro aerial vehicle was capable of stabilizing while navigating by using only the on-board embedded sensors. However, the proposed method required an external sensor (in this case, a RGB-D sensor was used) for the pose estimation computation, and therefore a calibration procedure is required to achieve the autonomous navigation.
On the other hand, several researchers have proposed different methods for the navigation control of a quadcopter other than the conventional proportional-integral and derivative (PID) controller (which it is one of the most widely used controller in industry). For example, Reizenstein proposed in [8] a method where a linear-quadratic (LQ)-controller is used together with a PID controller for the autonomous navigation of a quadcopter. However, if different kinds of environmental sensors have to be embedded onboard a micro aerial vehicle, the model-based control has to be re-designed as the model needs to be coherent with the changes in the system specifications. Therefore, the control design process may be even more complex in order to compensate for the model discrepancies, and therefore it may require more time to find a suitable control strategy. On the other hand, the tuning of the PID controllers may be a tedious time-consuming process. However, there are several tuning methods that have been introduced in industry to obtain a fast and acceptable performance.
As indicated above, most of the proposed approaches depend on still external sensors, advanced calibration procedures, as well as complex control strategies without analyzing the effect on the effective flight time due to the use of additional on-board sensors (e.g., camera, environmental sensors, etc.). Moreover, the most suitable PID tuning method for a micro aerial vehicle while changing the specifications of the system (due to the possibility of exchanging different on-board environmental sensors) is an issue that has been scarcely analyzed.

2. Materials and Methods

2.1. Hardware

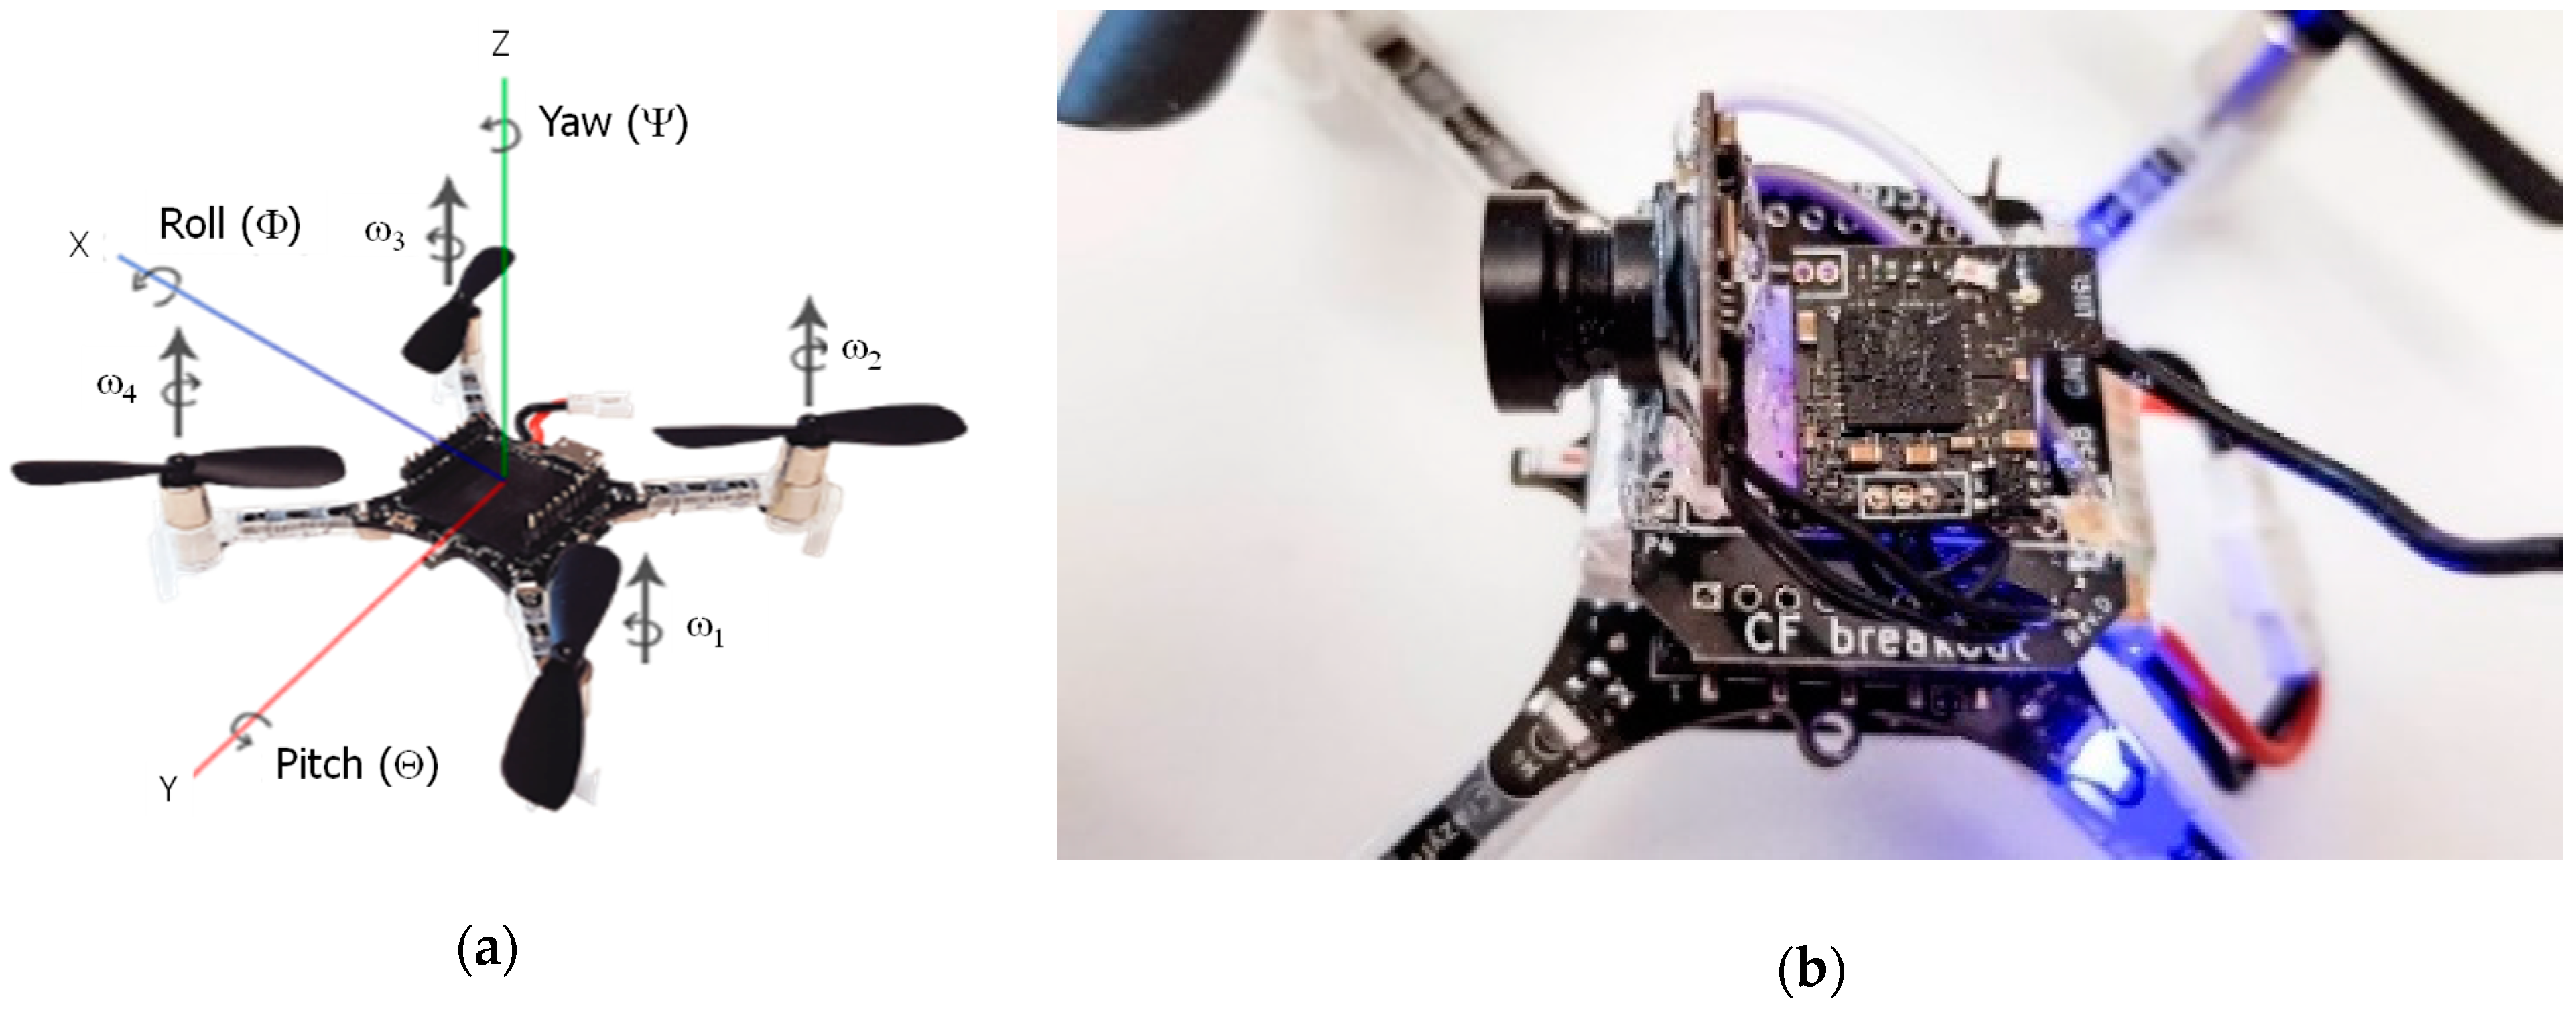
In this research, as a first approach the micro aerial vehicle Crazyflie 2.0 was selected as a development platform, as it is an open-source and open-hardware system [9]. The Crazyflie 2.0 (Figure 1a) features an expansion port where one can connect expansion boards. In particular, the Flow deck V2 adds a micro aerial vehicle the ability to discern when it is moving in any direction above the ground by means of an optical flow sensor which compensates for the inertial measurement unit (IMU) data errors [9].
In order to be able to localize the marker and determine the relative pose of the quadcopter, a vision sensor was needed. Therefore, the Eachine module was selected, which it is sold as a spare part for their M80S RC Drone [10]. The camera and transmitter module were soldered onto a Breakout deck for easy connection and disconnection (Figure 1b). The broadcasted video signal was picked up by an Eachine 5.8 GHz OTG USB video class (UVC) receiver [10].

2.2. Camera Pose Estimation and Target Detection

In this research, in order perform the camera pose estimation and target detection, we selected the ArUco library proposed Muñoz and Garrido [11]. The library contains a set of ArUco markers which are represented by binary square fiducial markers with its own unique identifier that can be used for camera estimation (see Section 3.2).
When the four corners of the ArUco marker are detected from the camera’s point of view, the camera pose can be estimated. As the marker is planar, the transformation can be carried out by means of a homography function. The function returns the transformation as two vectors: one for the translation and the other one for the relative rotation. After the calculation of those vectors, the rotation matrix, R(Ψ, Θ, Φ), can be computed as shown in Equation (1), which indicates the rotation between the two reference frames. Rotations may also occur about an arbitrary axis—i.e., an axis other than the unit vectors representing the reference frame. In such cases, we need a way of determining the final orientation and the unique axis about which the point vector is rotated (often referred to as orientation kinematics). A rotation of a generic vector p about an arbitrary axis u through an angle ϕ can be written as Equation (2), where u ^ is the skew-symmetric matrix representation of the vector u and is defined as Equation (3). Equation (2) is called Rodrigues’ rotation formula and has proved to be especially useful for our purpose, with the main reason being that by knowing the numerical values of the elements contained within the rotation matrix, it is possible to compute u ^ and ϕ using Equations (4) and (5).
R ( Ψ , Θ , Φ ) = [ c o s Θ c o s Ψ s i n Φ s i n Θ c o s Ψ c o s Φ s i n Ψ c o s Φ s i n Θ c o s Ψ + s i n Φ s i n Ψ c o s Θ s i n Ψ s i n Φ s i n Θ s i n Ψ + c o s Φ c o s Ψ c o s Φ s i n Θ s i n Ψ s i n Φ c o s Ψ s i n Θ s i n Φ c o s Θ c o s Φ c o s Θ ]
R o t ( u , ϕ ) = I c o s ϕ + u u T ( 1 c o s ϕ ) + u ^ s i n ϕ ,
u ^ = [ 0 u 3 u 2 u 3 0 u 1 u 2 u 1 0 ]
u ^ = 1 2 s i n ϕ ( R R T )
c o s ϕ = τ 1 2 ,
where τ is the sum of the scalar values in the main diagonal of the rotation matrix, R: τ = r 11 + r 22 + r 33 .
In order to detect the ArUco markers, at first, in order to find the candidate corners of the markers, a local adaptive thresholding and extraction of contours is carried out. The adaptive thresholding is conducted by applying a window sliding (3 × 3, 5 × 5, 11 × 11, etc.) and finding optimum greyscale window. Values that are below the calculated value will be black and those above are white. After obtaining the thresholded image, if the result is not similar to a square, then the candidate corner is not selected. After selecting the corners, the white and black elements in the inner binary matrix are extracted in order to validate them. This process is conducted using the homography matrix and Otsu’s method [11]. The resultant binary bits are then compared against all the available ArUco markers, so the respective marker is detected.
Through the ArUco library, camera pose estimation and marker detection can be achieved. However, due to the possibility of camera occlusion, data losses, etc., the relative pose of the Crazyflie 2.0 cannot be conducted. In order to overcome such issues, we have proposed to implement a Kalman filter [12]. The Kalman filter is an optimal estimator based on a recursive algorithm for estimating the track of an object by means of the given measurements to keep the accuracy of the state estimation aiming to predict future states. In our case, we have proposed to use the linear Kalman filter, which minimizes the mean-square error of the state. If we assume a current state x k (including both the position and velocity), as shown in Equation (6), the filtering algorithm will then assume a correlation between the elements contained in x k , captured by a covariance matrix, P k .
Based on this, the state estimation of x ^ k will be computed by means of the previously estimated state, x ^ k 1 , the covariance matrix, and the current measurement from time step k (by assuming that the error between the measured and estimated state are Gaussian distributed). The state is then updated based on the given measurements and the previously estimated state.
x k = ( p ,   v ) .
Equation (7) indicates the state transition matrix, F k . If we assume an acceleration, α , and the estimation shown in Equation (8), we can compute the state estimation as shown in Equation (9), where B k is the control matrix and u k is the control vector used as an input to the system. By defining the covariance Q , it is possible to take into account the noise in every prediction step, as shown in Equation (10).
F k = [ 1 Δ t 0 1 ] ,
x ^ k = { p k = p k 1 + Δ t v k 1 + 1 2 α Δ t 2 v k =   v k 1 + α Δ t ,
x ^ k = F k x ^ k 1 + B k u k ,
P k = F k P k 1 F k T + Q k .
The given new measurement data are then stored in the vector, z. As the data may include noise, denoted as R , the vector of the logged data can be defined as Equation (11), where H is a general matrix that represents the measurement matrix. By defining the state estimation as Equation (12), where K is known as the Kalman gain, the final equation to update state can be defined as Equations (13) and (14), where K is determined as Equation (15).
z k = H x k + R k ,
x ^ k + 1 = F x k + K y ,
x ^ k = x ^ k + K ( z k H k x ^ k ) ,
P k = P k K H k P k ,
K = P k H k T ( H k P k H k T + R k ) 1 .
In cases where the desired marker is not identified after some time, the velocity for each state will be exponentially decreased such that for each time step, k n n m a x , where k n denotes a time step with an undetected marker, the updated estimation has been computed as Equation (16), where α is the diminishing factor.
x ^ k n ( v k ) = x ^ k n ( v k 1 ) α .

2.3. Control Architecture

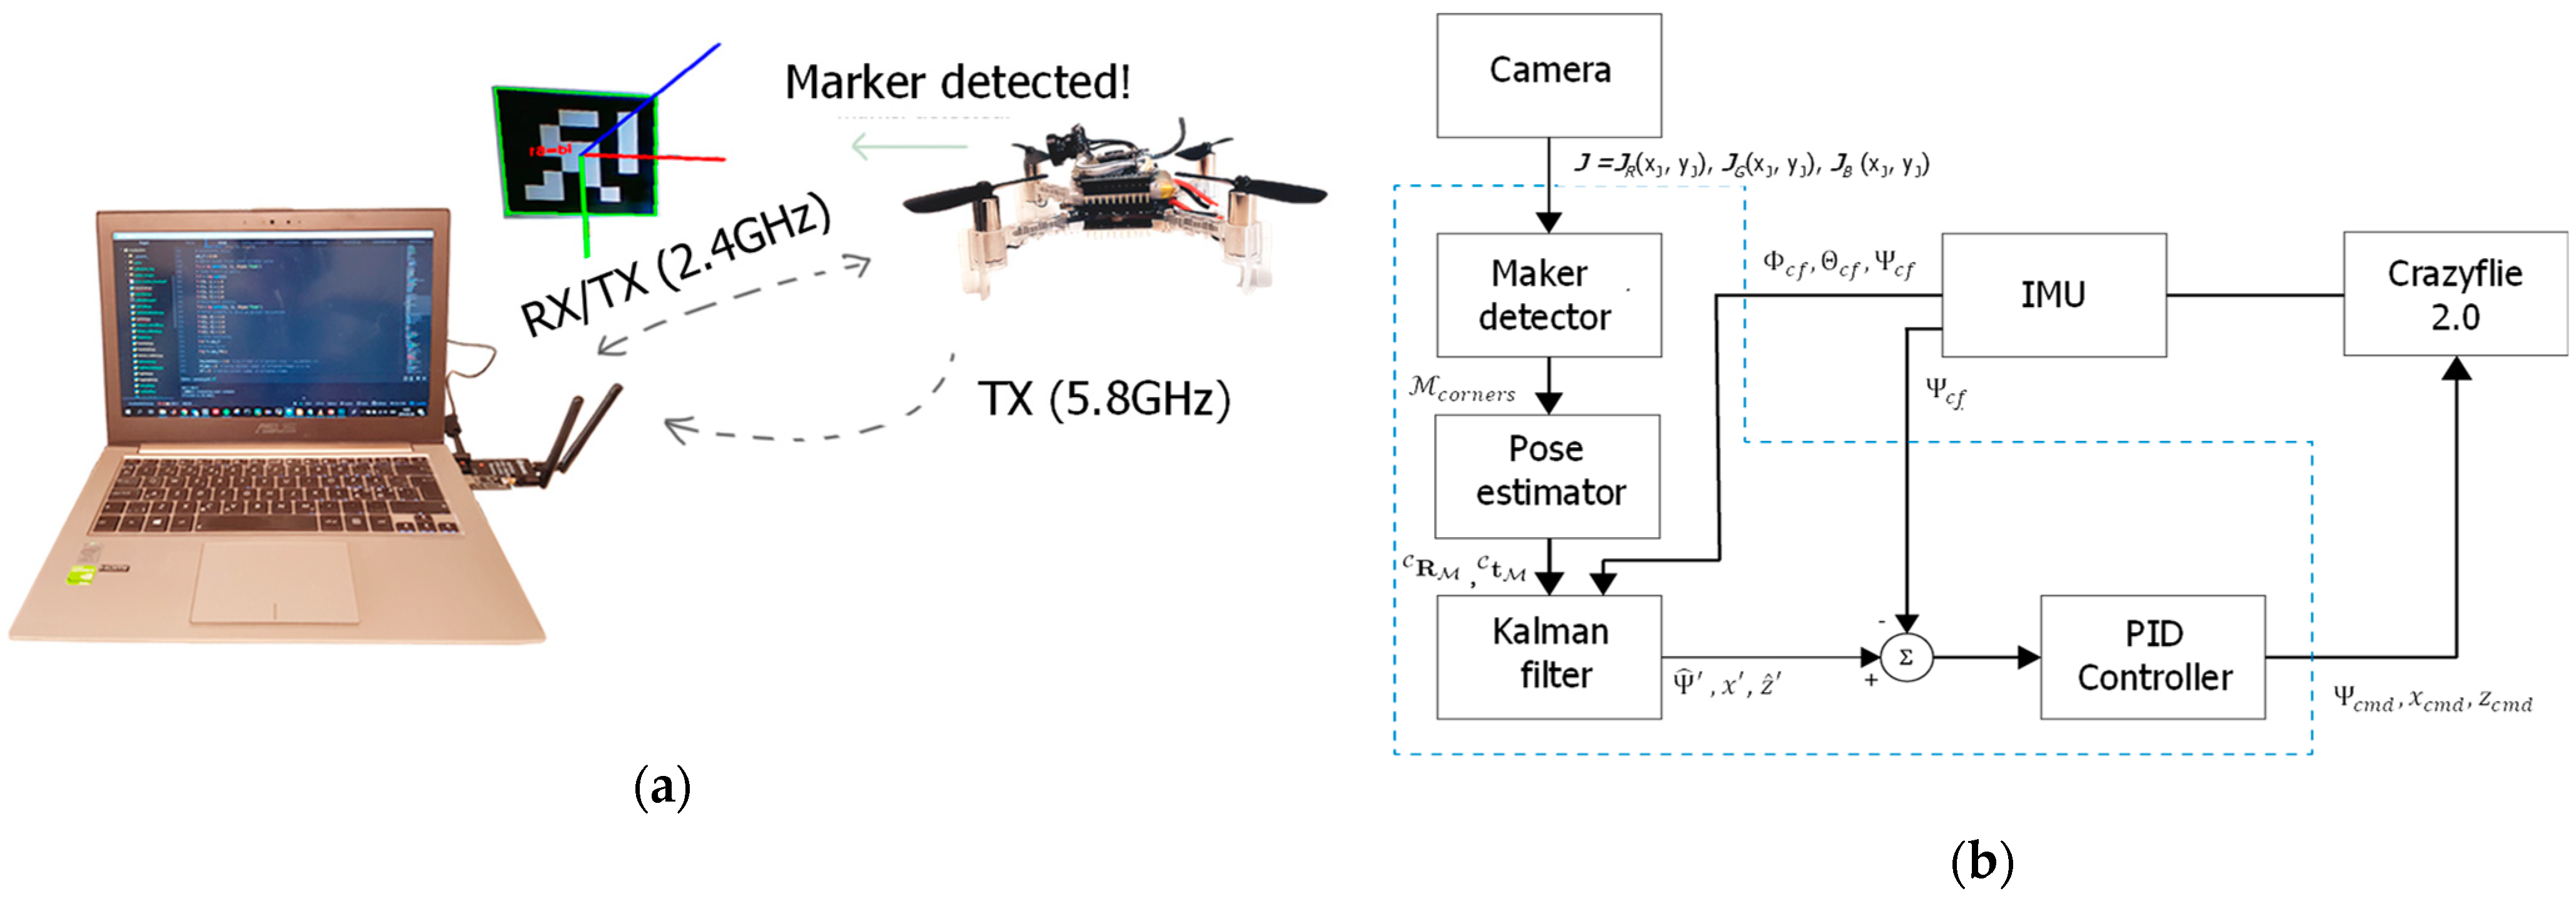
The physical representation of the proposed system is shown in Figure 2a. As can be observed, a PC is used to process the grabbed images from the camera mounted on-board of the MAV though the video transmitter (Eachine TX801 5.8 GHz) and the command signals to the MAV through a bi-directional USB radio communication (Crazyradio PA 2.4 GHz).
After computing in the PC the camera posture estimation and identifying the ArUco marker, the relative MAV posture is then given as new measurement data to the linear Kalman filter algorithm. As shown in Figure 2, the estimated pose of the MAV is then used as a reference signal to the compute the error signal. In order to reduce the error, the PID controllers the compute the commanded control signal in order to align the MAV pose towards the target location. As a first approach, we only considered the yaw rotation ( Ψ -angle) and the x and z translations.
The on-board controller consists of two PID controllers in a cascade. A rule of thumb for cascaded PID controllers is that in order to have a stable and robust control scheme, the inner loop should operate at a higher frequency than the outer loop [13]. If the outer loop runs at a lower frequency than the inner loop, synchronization problems may occur, which entails in that the steady state value of the outer loop is reached before the inner loop has computed its output response, causing instability [13]. In this case, the on-board attitude and attitude rate controllers operate at 250 and 500 Hz, respectively, and the off-board controllers operate at about 10 Hz.
The set of off-board PID controllers has three different command variables: the relative yaw angle and translation in x- and z direction. In order to determine the best suitable experimental tuning method for the PID controllers, three different methods were tested: Ziegler–Nichols, Lambda, and Approximate M-constrained Integral Gain Optimisation (AMIGO).
The Ziegler–Nichols method was published in 1942 [14] and was developed by performing a large number of simulations on pneumatic analogue machines [15]. The parameters are determined from a step response analysis according to the Table 1. The AMIGO method was introduced in 2004. It has similarities to the Ziegler–Nichols method, but is instead based on simulations performed with computers [16]. The parameters are determined from a step response experiment according to Table 2. The lambda method differs from the methods above by a parameter that the user can adjust themselves. The method is widely used in the paper industry and was developed in the 1960s. The original method only dealt with the PI controller, but it is possible to derive formulas for PID controllers as well. The lambda method does not provide parameters for integrating processes [15]. For the PID controller in parallel, the parameters are taken from a step response according to Table 3.
As is shown in Table 1, Table 2 and Table 3, the times calculated are T63%, T100%, and L. L is the dead time of the system and this is calculated by determining the point of intersection of the previously calculated maximum derivative and the time axis. T100% is obtained by calculating the intersection point of the maximum derivative with the line Ys, then obtained a time that is T100% + L. To get T100%, L is then subtracted. T63% is obtained by examining when the first measurement data point exceeds the value of 0.63Ys. The time for that measurement data point is then time T63% + L and, the same as for T100%, the dead time L must be subtracted away. In the lambda method, the factor Tcl = T63% will be used to obtain an aggressive regulation similar to the results of Ziegler–Nichols and AMIGO.
To test the step response of the Crazyflie 2.0 in indoor conditions, different additional weights (0, 4.7, 6.1, and 10.8 g) were considered. To calculate which parameters would be used for PID according to the Ziegler–Nichols, lambda, and AMIGO methods, the same program was used in Matlab. Four tests for each case were performed and they resulted in the mean values of the PID parameters according to Table 4, Table 5, Table 6 and Table 7.
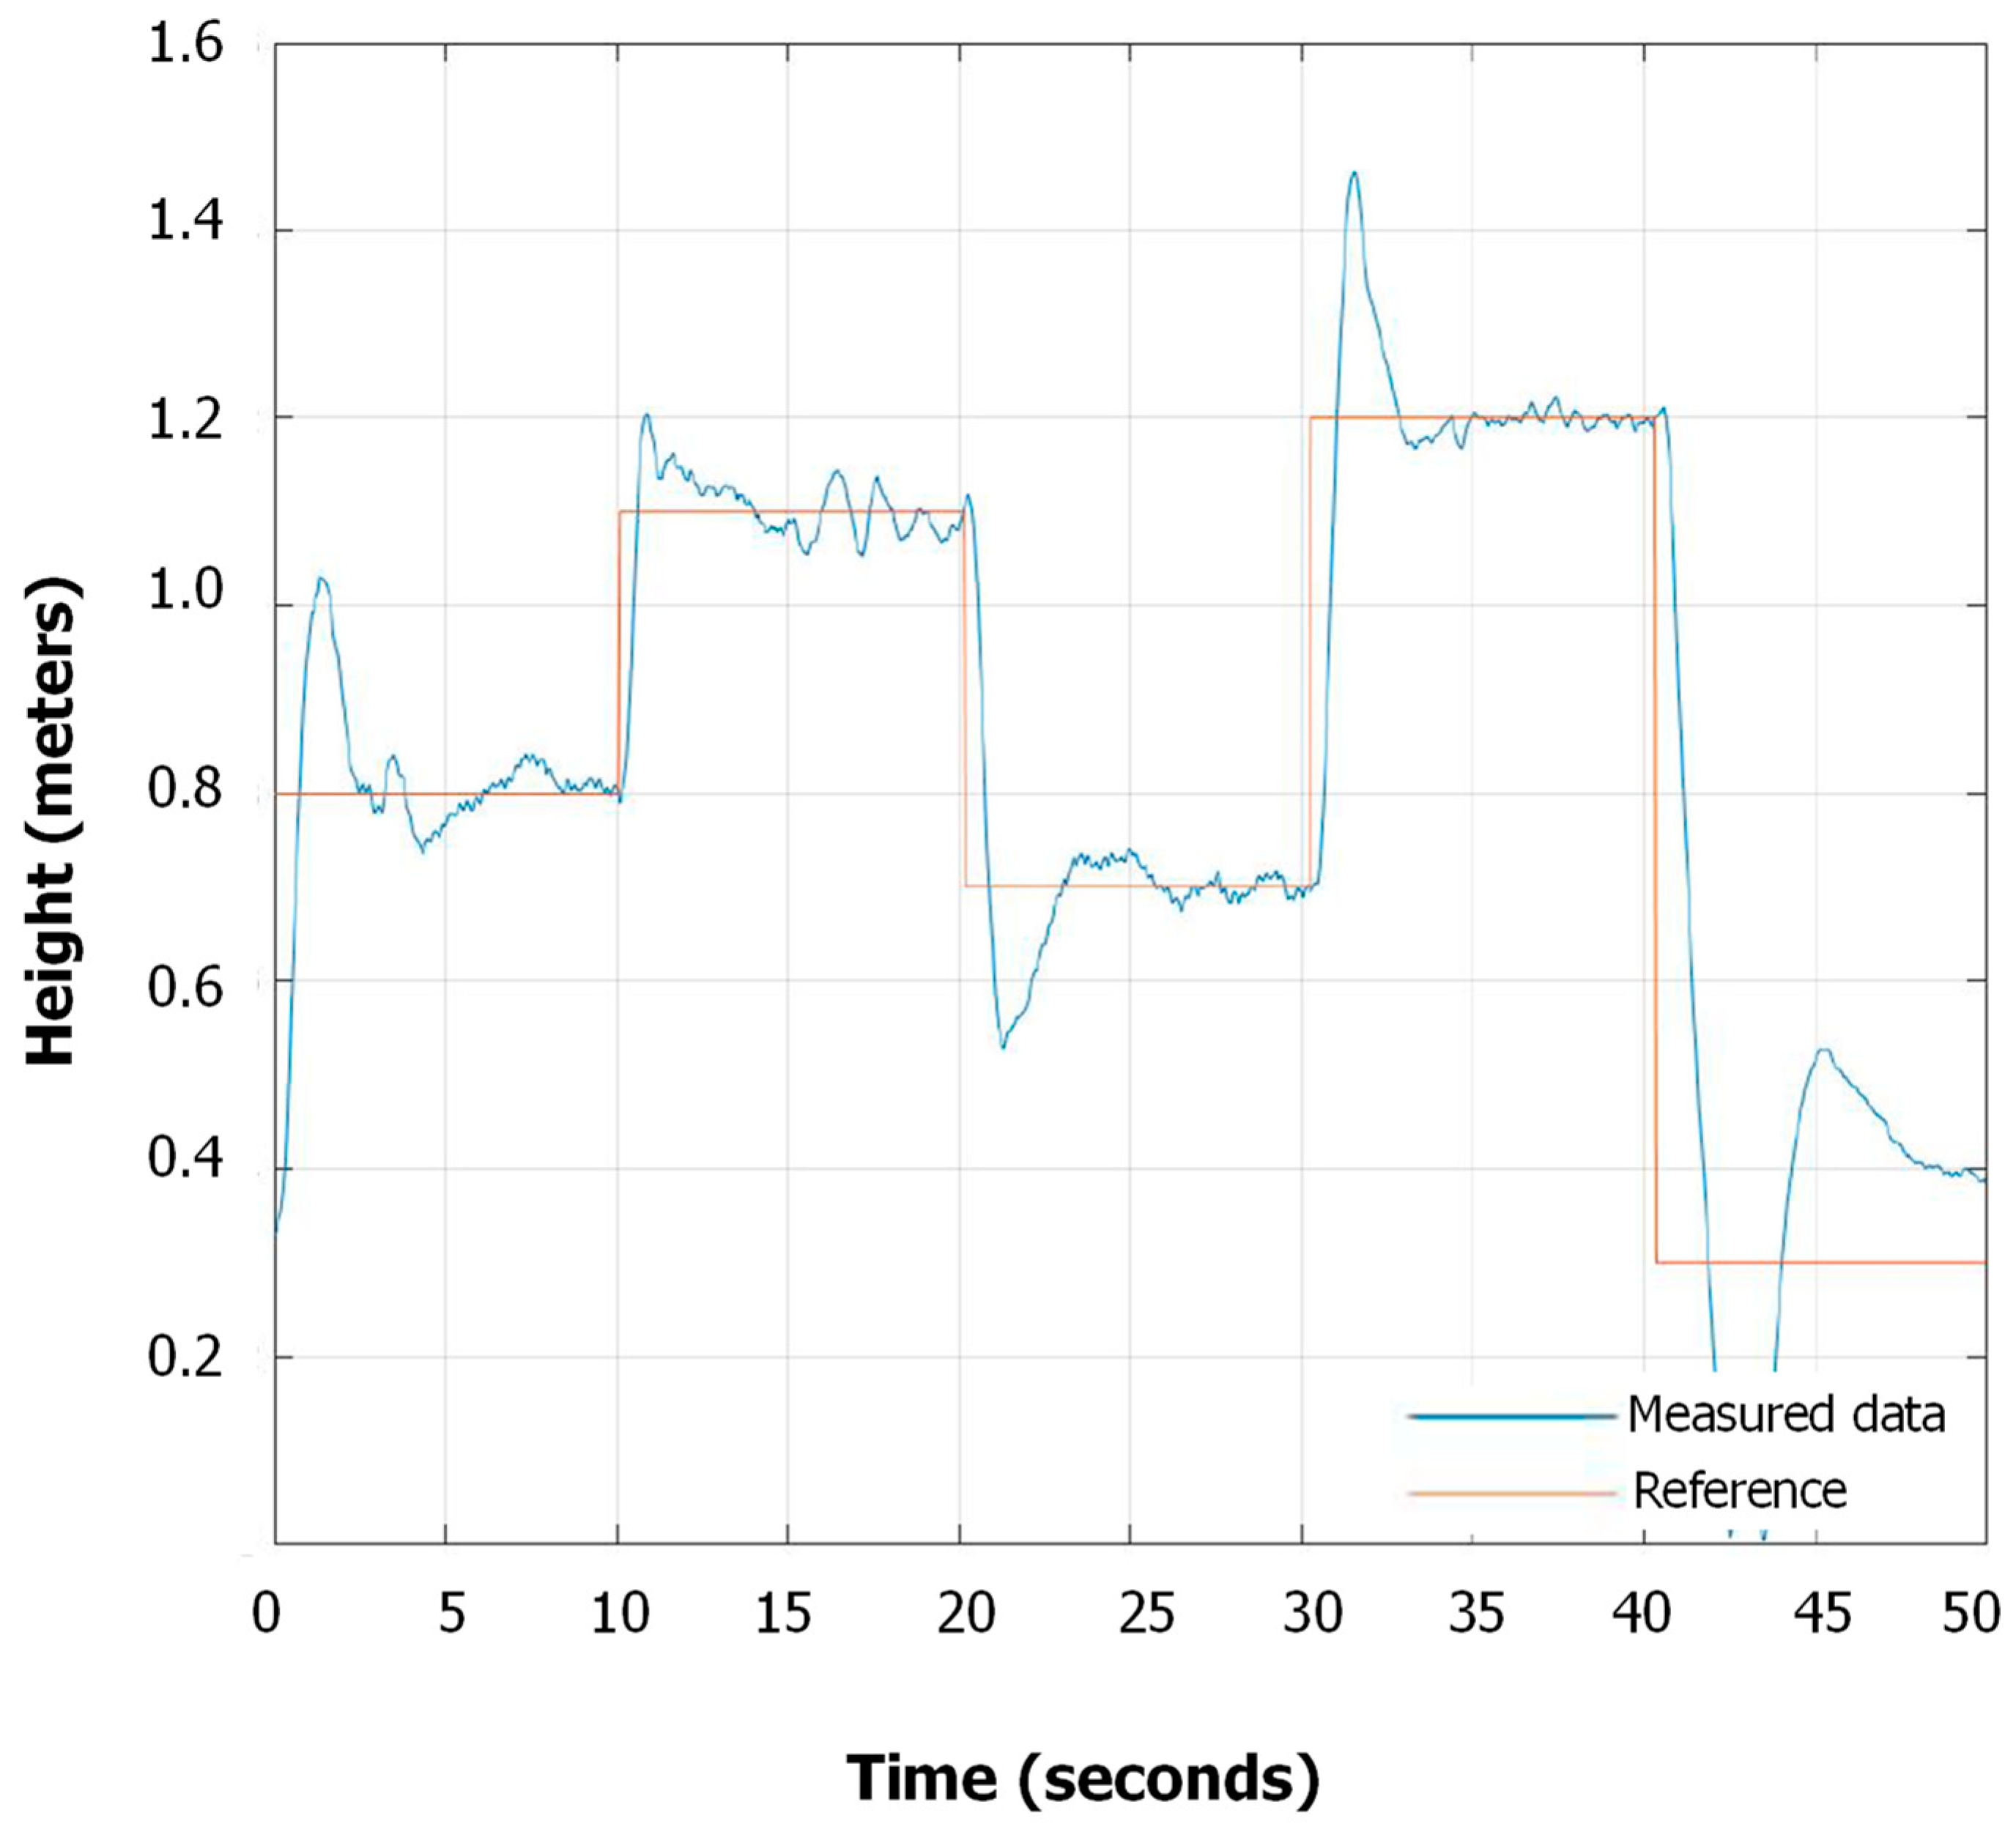
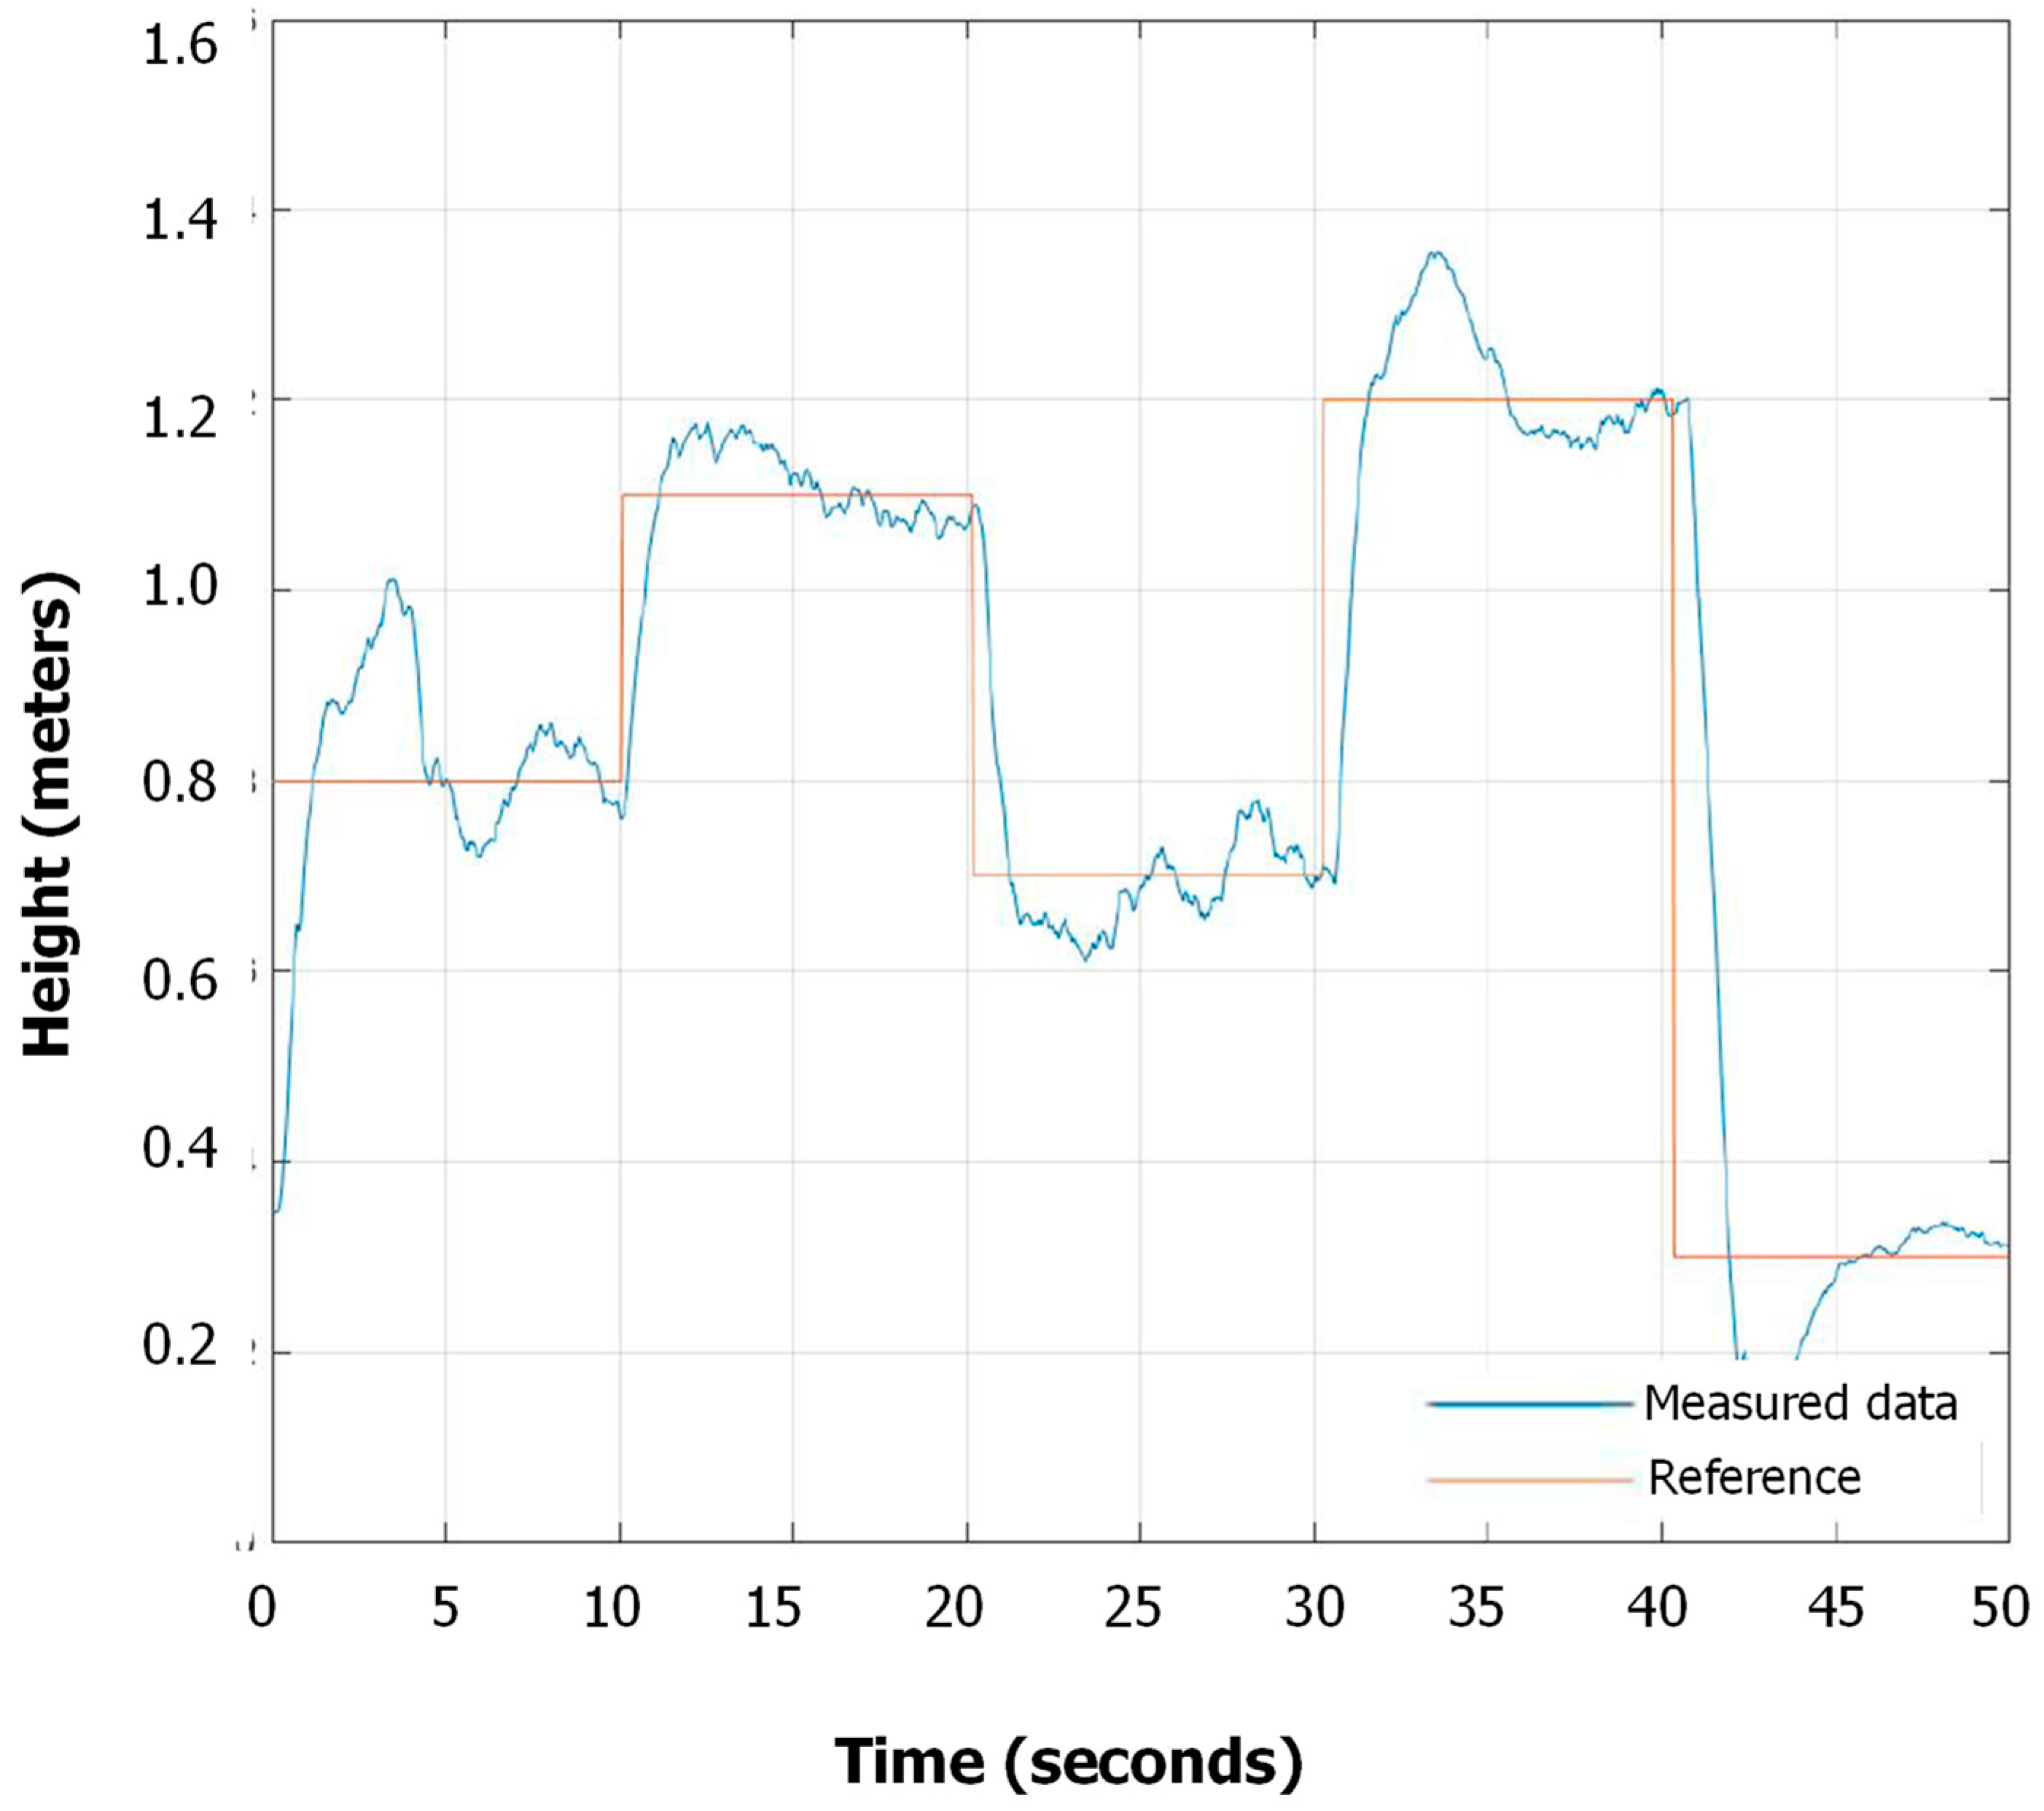
As is shown in the experimental results, with an additional load of 0, 4.7, and 6.1 g in Table 8, Table 9 and Table 10, respectively, the AMIGO method in each case has a noticeably shorter settling time than the Ziegler–Nichols method (as is shown in Table 8, the lambda method is much slower than the others and is therefore excluded when placing an additional load of 4.7 and 6.1 g). The AMIGO method is considered the better of them even though in some cases it has a slower rise time and higher overshoot than the Ziegler–Nichols method, but these two parameters do not differ much from the different methods. As an example, we can observe the experimental results in Figure 3 and Figure 4 for both a case without any additional weight and a case with a load of 4.7 g, respectively.
Therefore, based on the preliminary experimental results presented above, the AMIGO method was chosen as the primary tuning method as it has been proven to be a reliable method for tuning the PID controllers of the Crazyflie 2.0.
3. Experimental Results

3.1. Pose Estimation and Fiducial Marker Detection

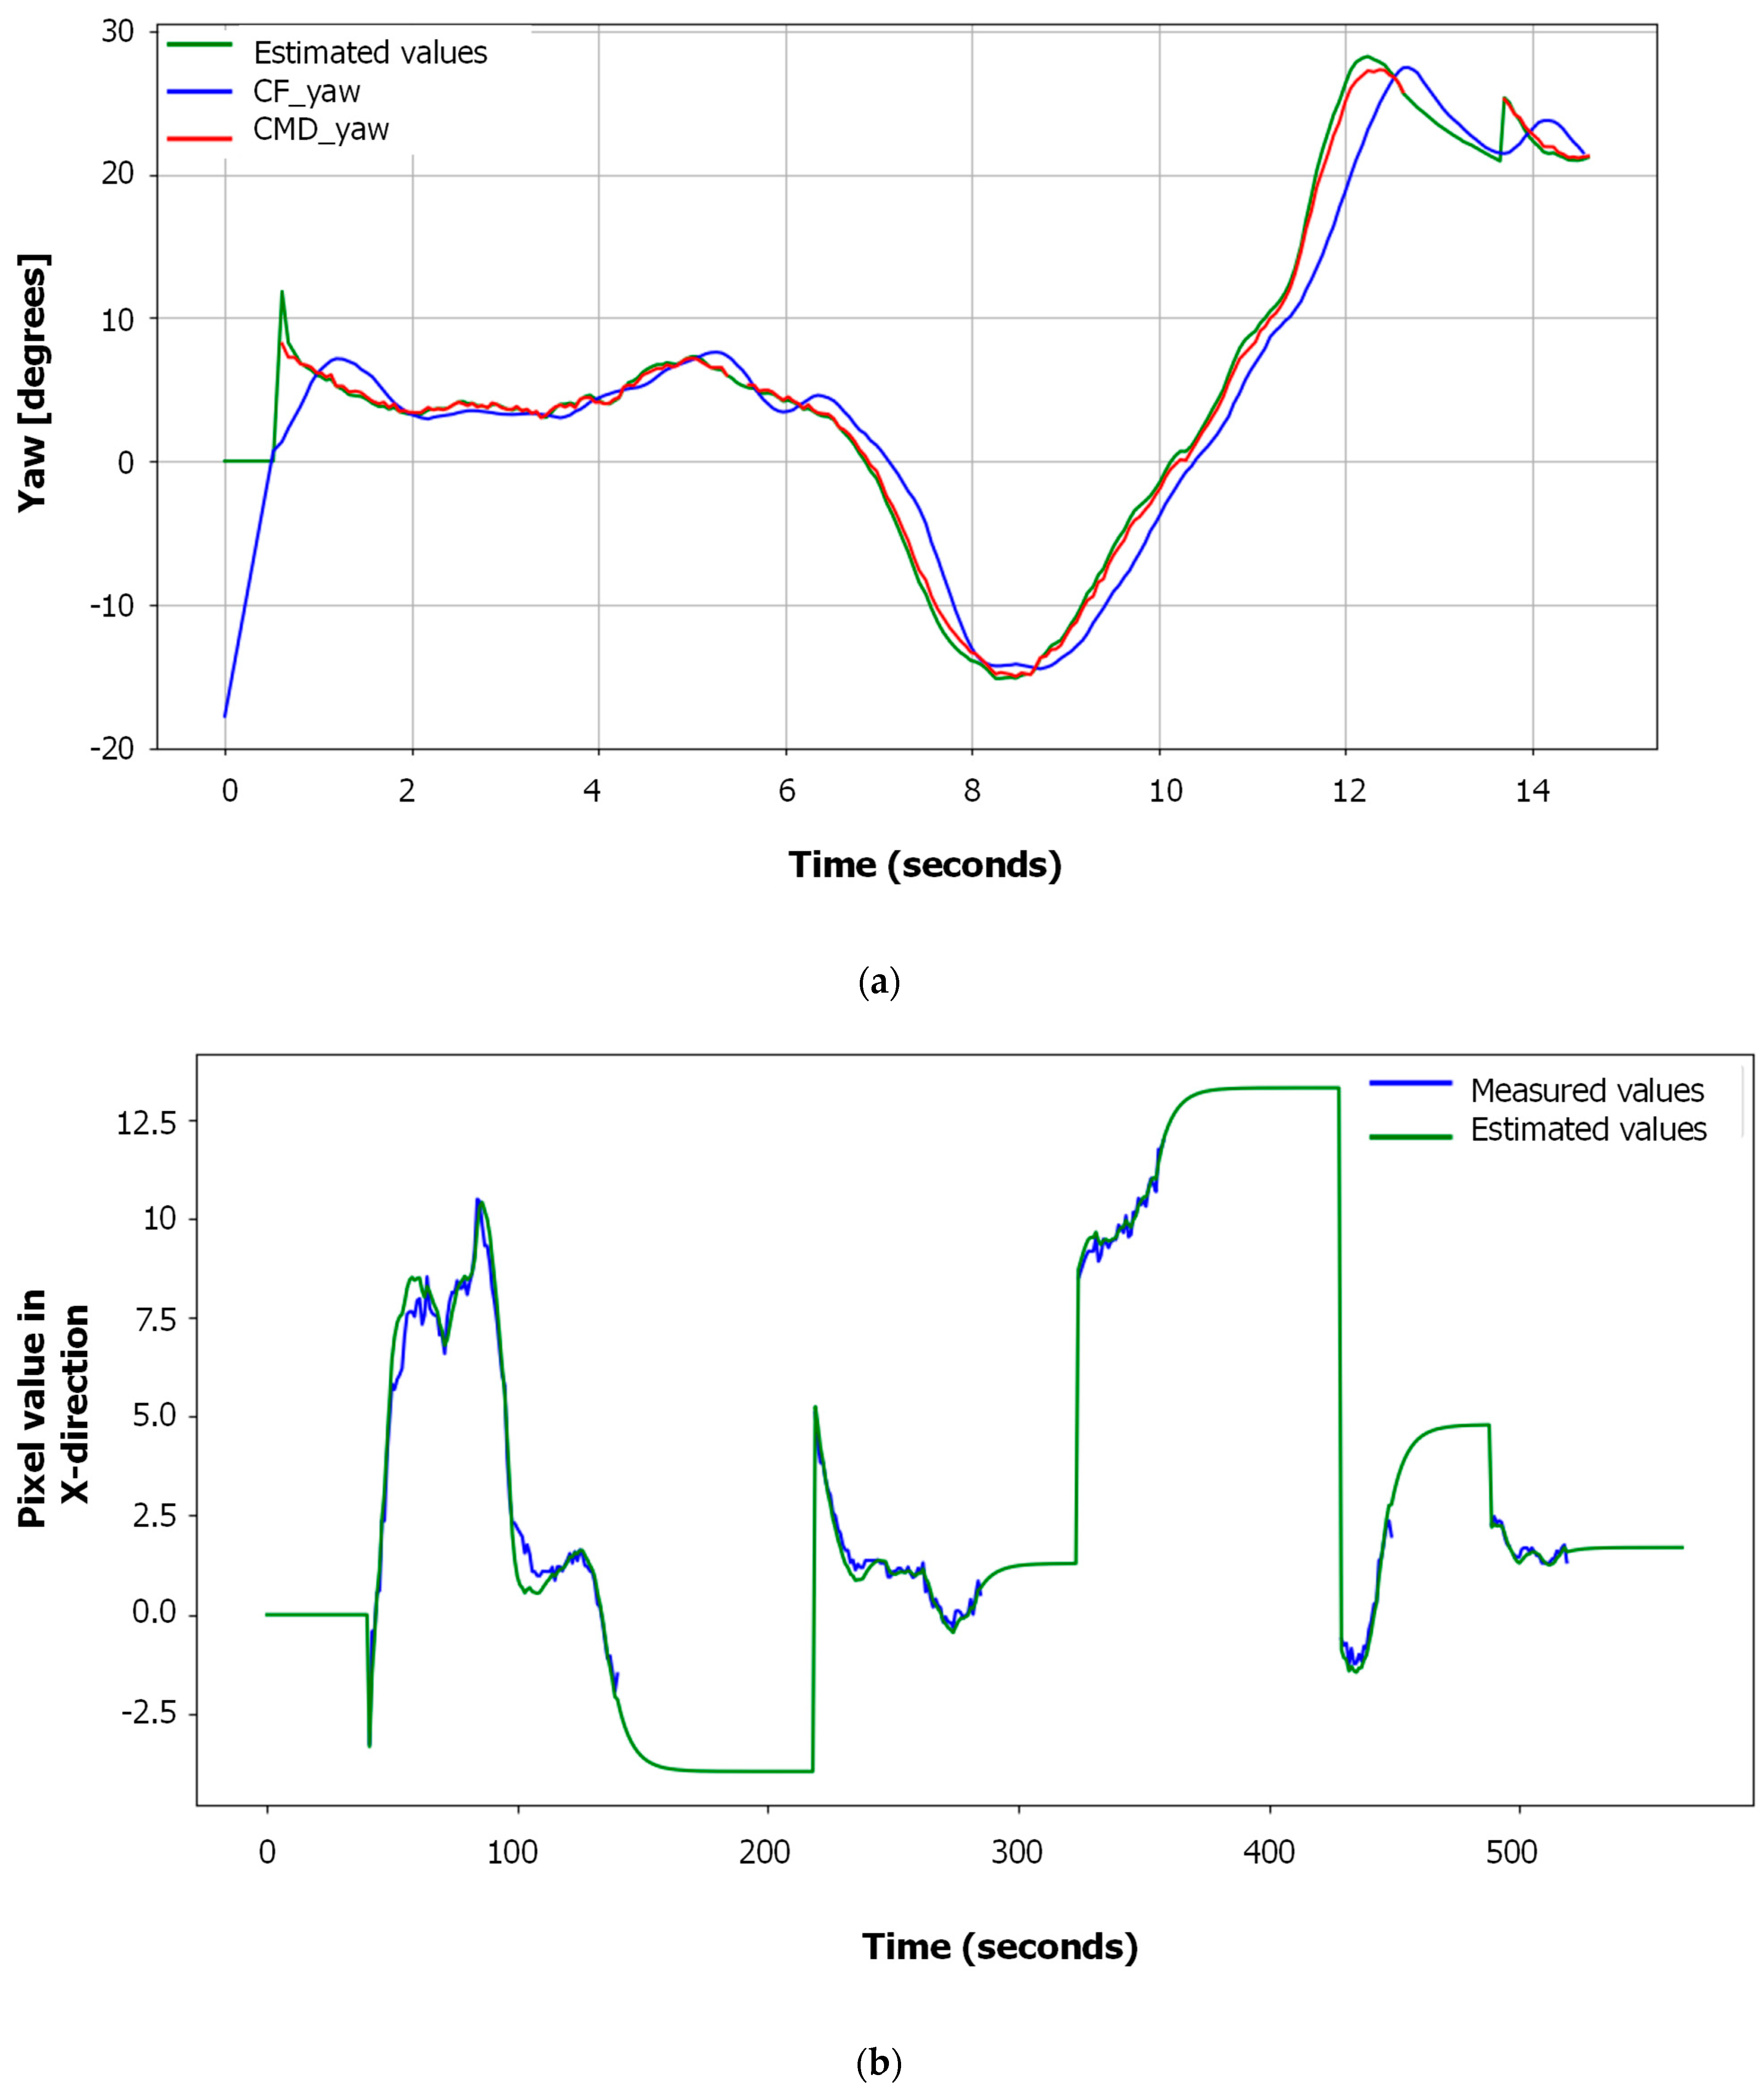
In order to verify the effectiveness of the optimized pose estimation, we pre-defined a motion sequence of the ArUco marker in indoor conditions. In particular, the ArUco marker was rotated at different angles in front of the Crazyflie 2.0 whilst the MAV was programmed to always have its y-axis pointing collinear with the z-axis of the reference frame of the marker, radiating out from its center. As it is shown in Figure 5a, at time t 5.5 s, the proposed method achieved a good estimation of the movement of the marker even though the loss of measurement data. Additionally, at the time t 12.5 s, the detection of the marker is lost for approximately one second and the proposed method still predicted the movement of the marker.
Similarly, in Figure 5b the Kalman filter was used in an experiment for tracking the center point of the ArUco marker. In this experiment, the camera view was obstructed at different points in time and moved to a new location. The filter was limited to output only an estimate for a maximum of 25 frames in a row when the marker was not detected and data were sampled only when the marker was detected or estimated by the Kalman filter; hence, the peaks in a green line. Similar to the plot in Figure 5a, the factor α = 0:85 was set for diminishing the velocity v ^ k = α v ^ k 1 for each iteration where an estimation was made in the previous time step for a maximum n m a x number of frames.
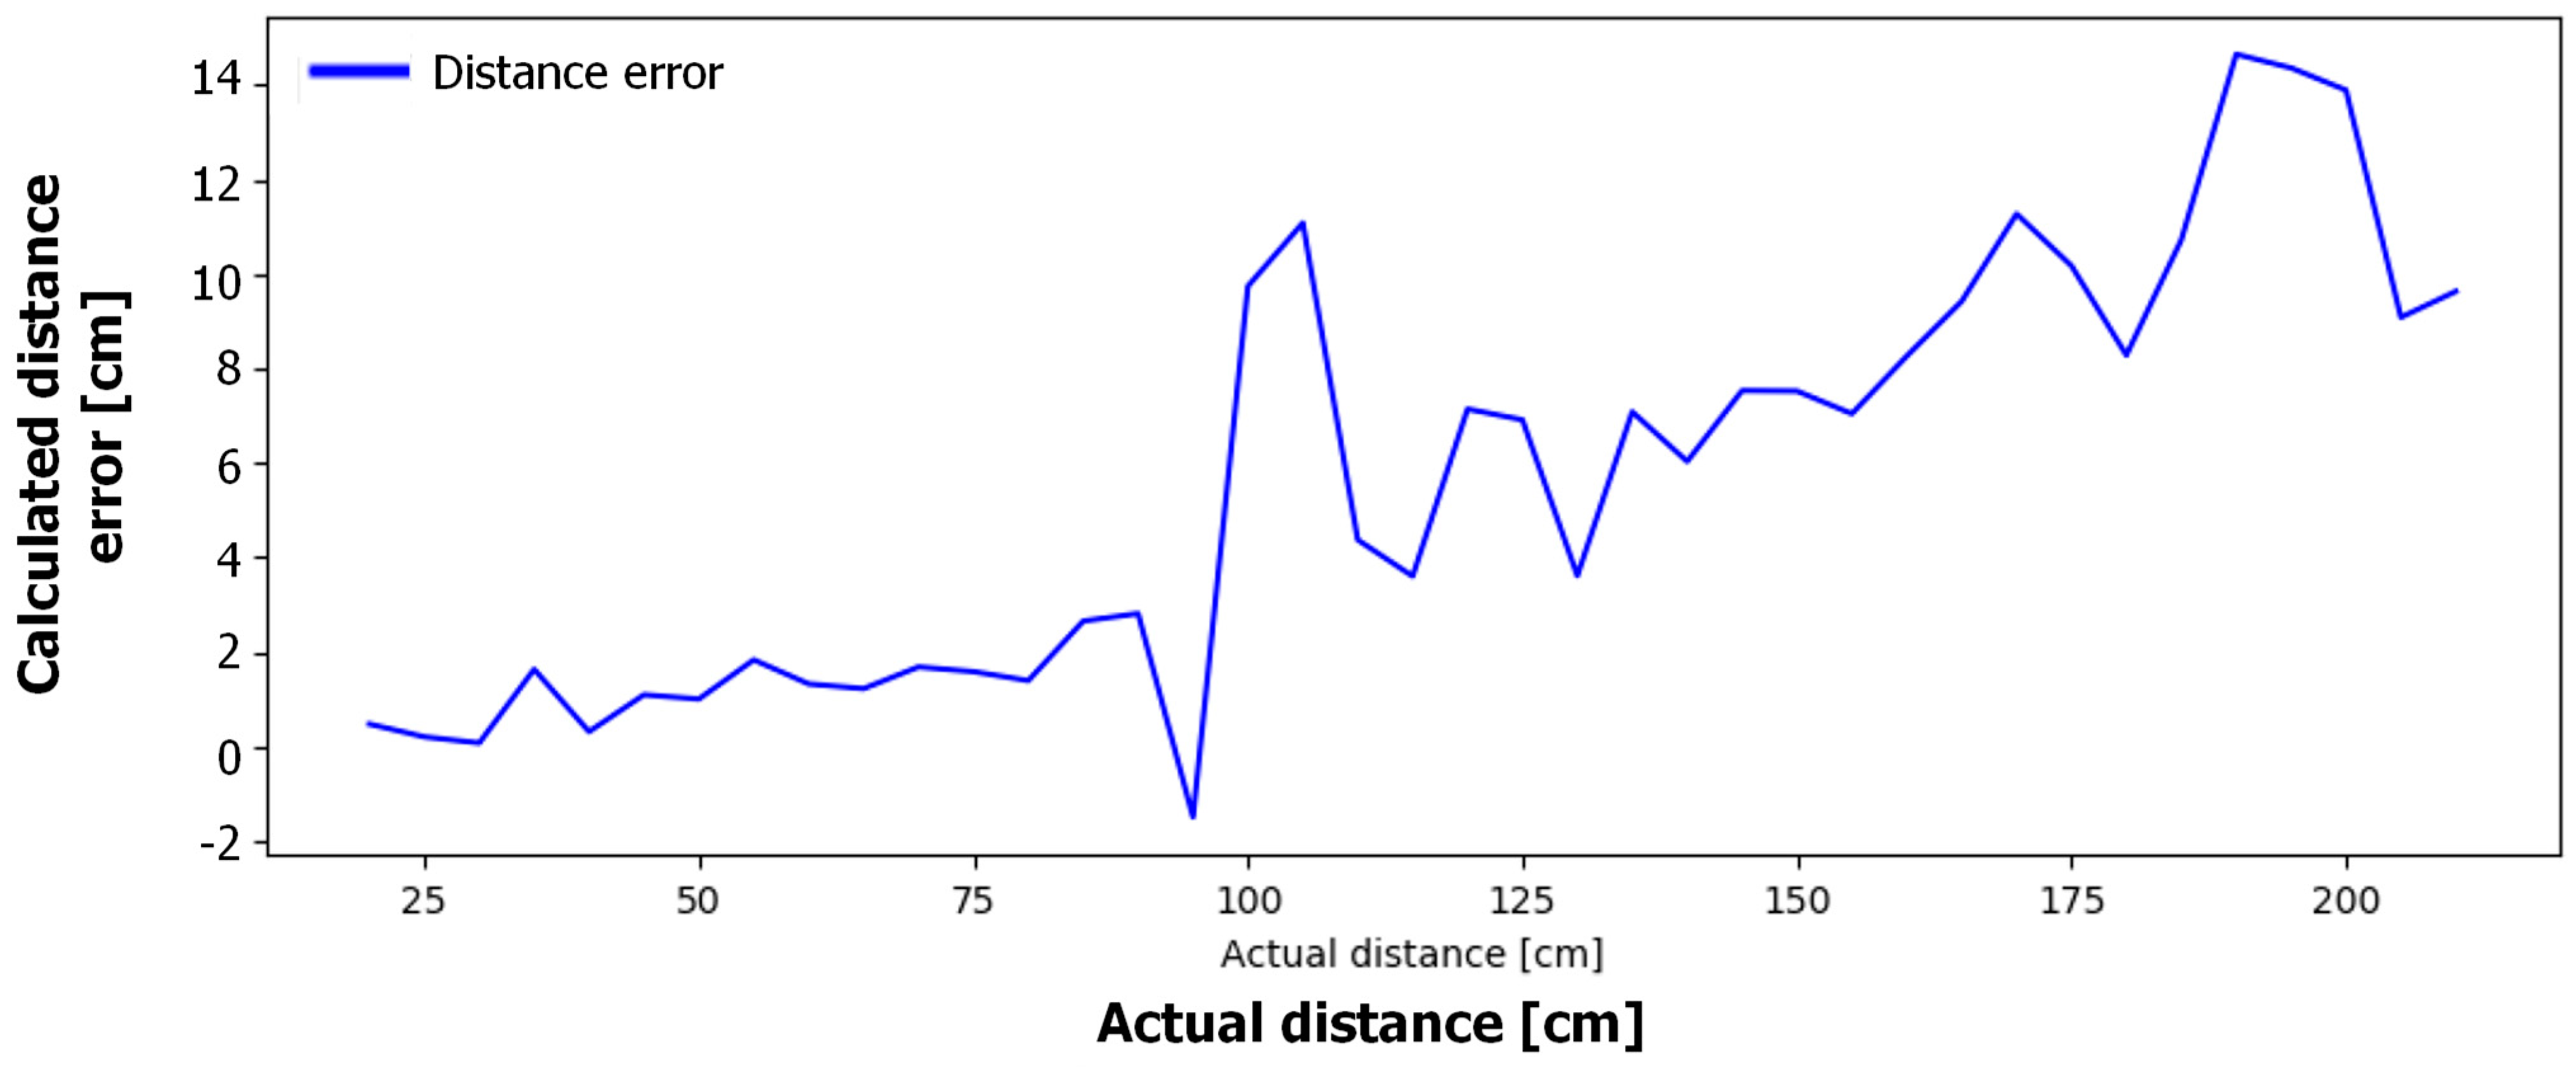
In order to verify the effectiveness of the ArUco marker detection, we examined at which distance, x, the marker can be recognized when placed directly in front of the camera. The experiment was conducted by placing the marker at various distances, x [ 10 , 220 ] centimeters away from the camera. In order to keep the results of the experiments consistent, the marker used is characterized by a 200 x 200 mm square with a 6 × 6 internal matrix and has the identifier ID = 24. As can be observed in Figure 6, the pose estimation algorithm is able to estimate the distance between the camera and the marker with only about 2 cm of deviation from the actual value (in this case, the distance from the MAV is about 1 m). The error in the estimated distance increases with the distance with a maximum deviation of about 14 cm (in this case, the distance from the MAV is around 2 m). From the experimental results, we could confirm a detection success ratio for the ArUco marker of 92.8% (39 out of 42).

3.2. PID Controller: Yaw and x-Direction

After tuning the two PID controllers for the yaw angle and translation in x-direction by means of the AMIGO method (with some further fine-tuning), we determined the gains as Kp = 1.0, Ki = 0.10, Kd = 0.045 and Kp = 5.10, Ki = 5.40, Kd = 0.62. respectively. Based on that, an experiment was conducted where the quadcopter was placed in a position approximately 30 cm away from the marker in x-direction ( x c m d ) with a 35° relative angle ( Ψ c m d ). The experimental results are shown in Figure 7. Based on the experimental results, the performance is considered to be quite accurate with a deviation around the set point of only about ± 5 degrees. The x-direction controller shows significant improvement over using a simple P-controller but still displays a minor oscillation around the set point. However, the results are very much sufficient for the scope of this project as it shows that the MAV is able to orient and position itself relative to the target marker with only a small amount of oscillations and overshoot in indoor conditions.

3.3. Target Landing

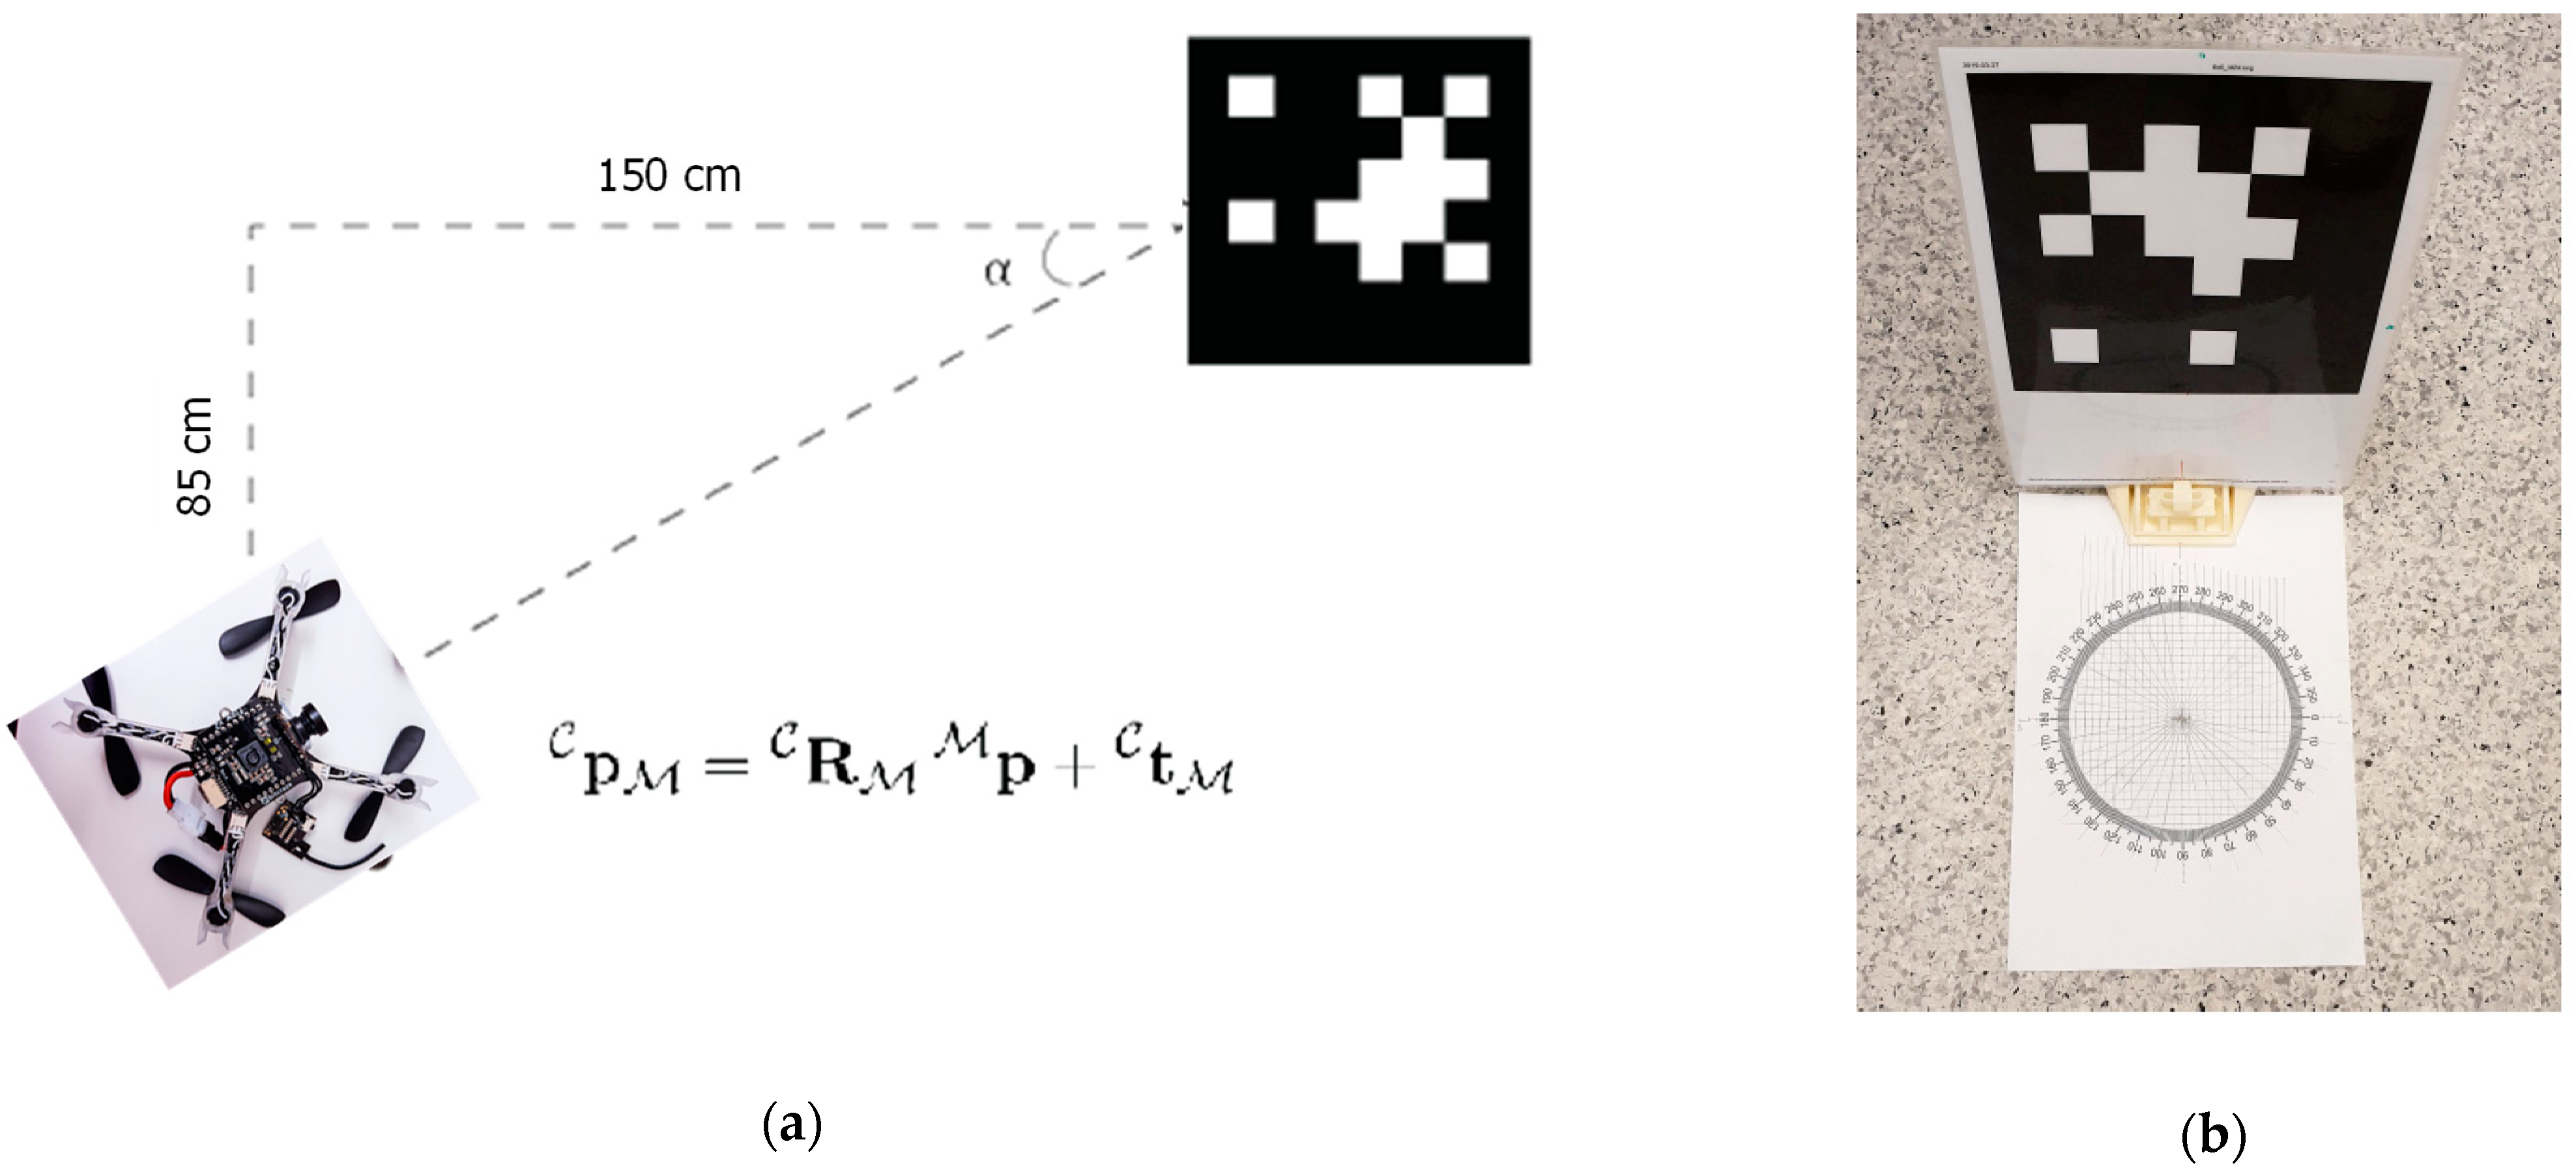
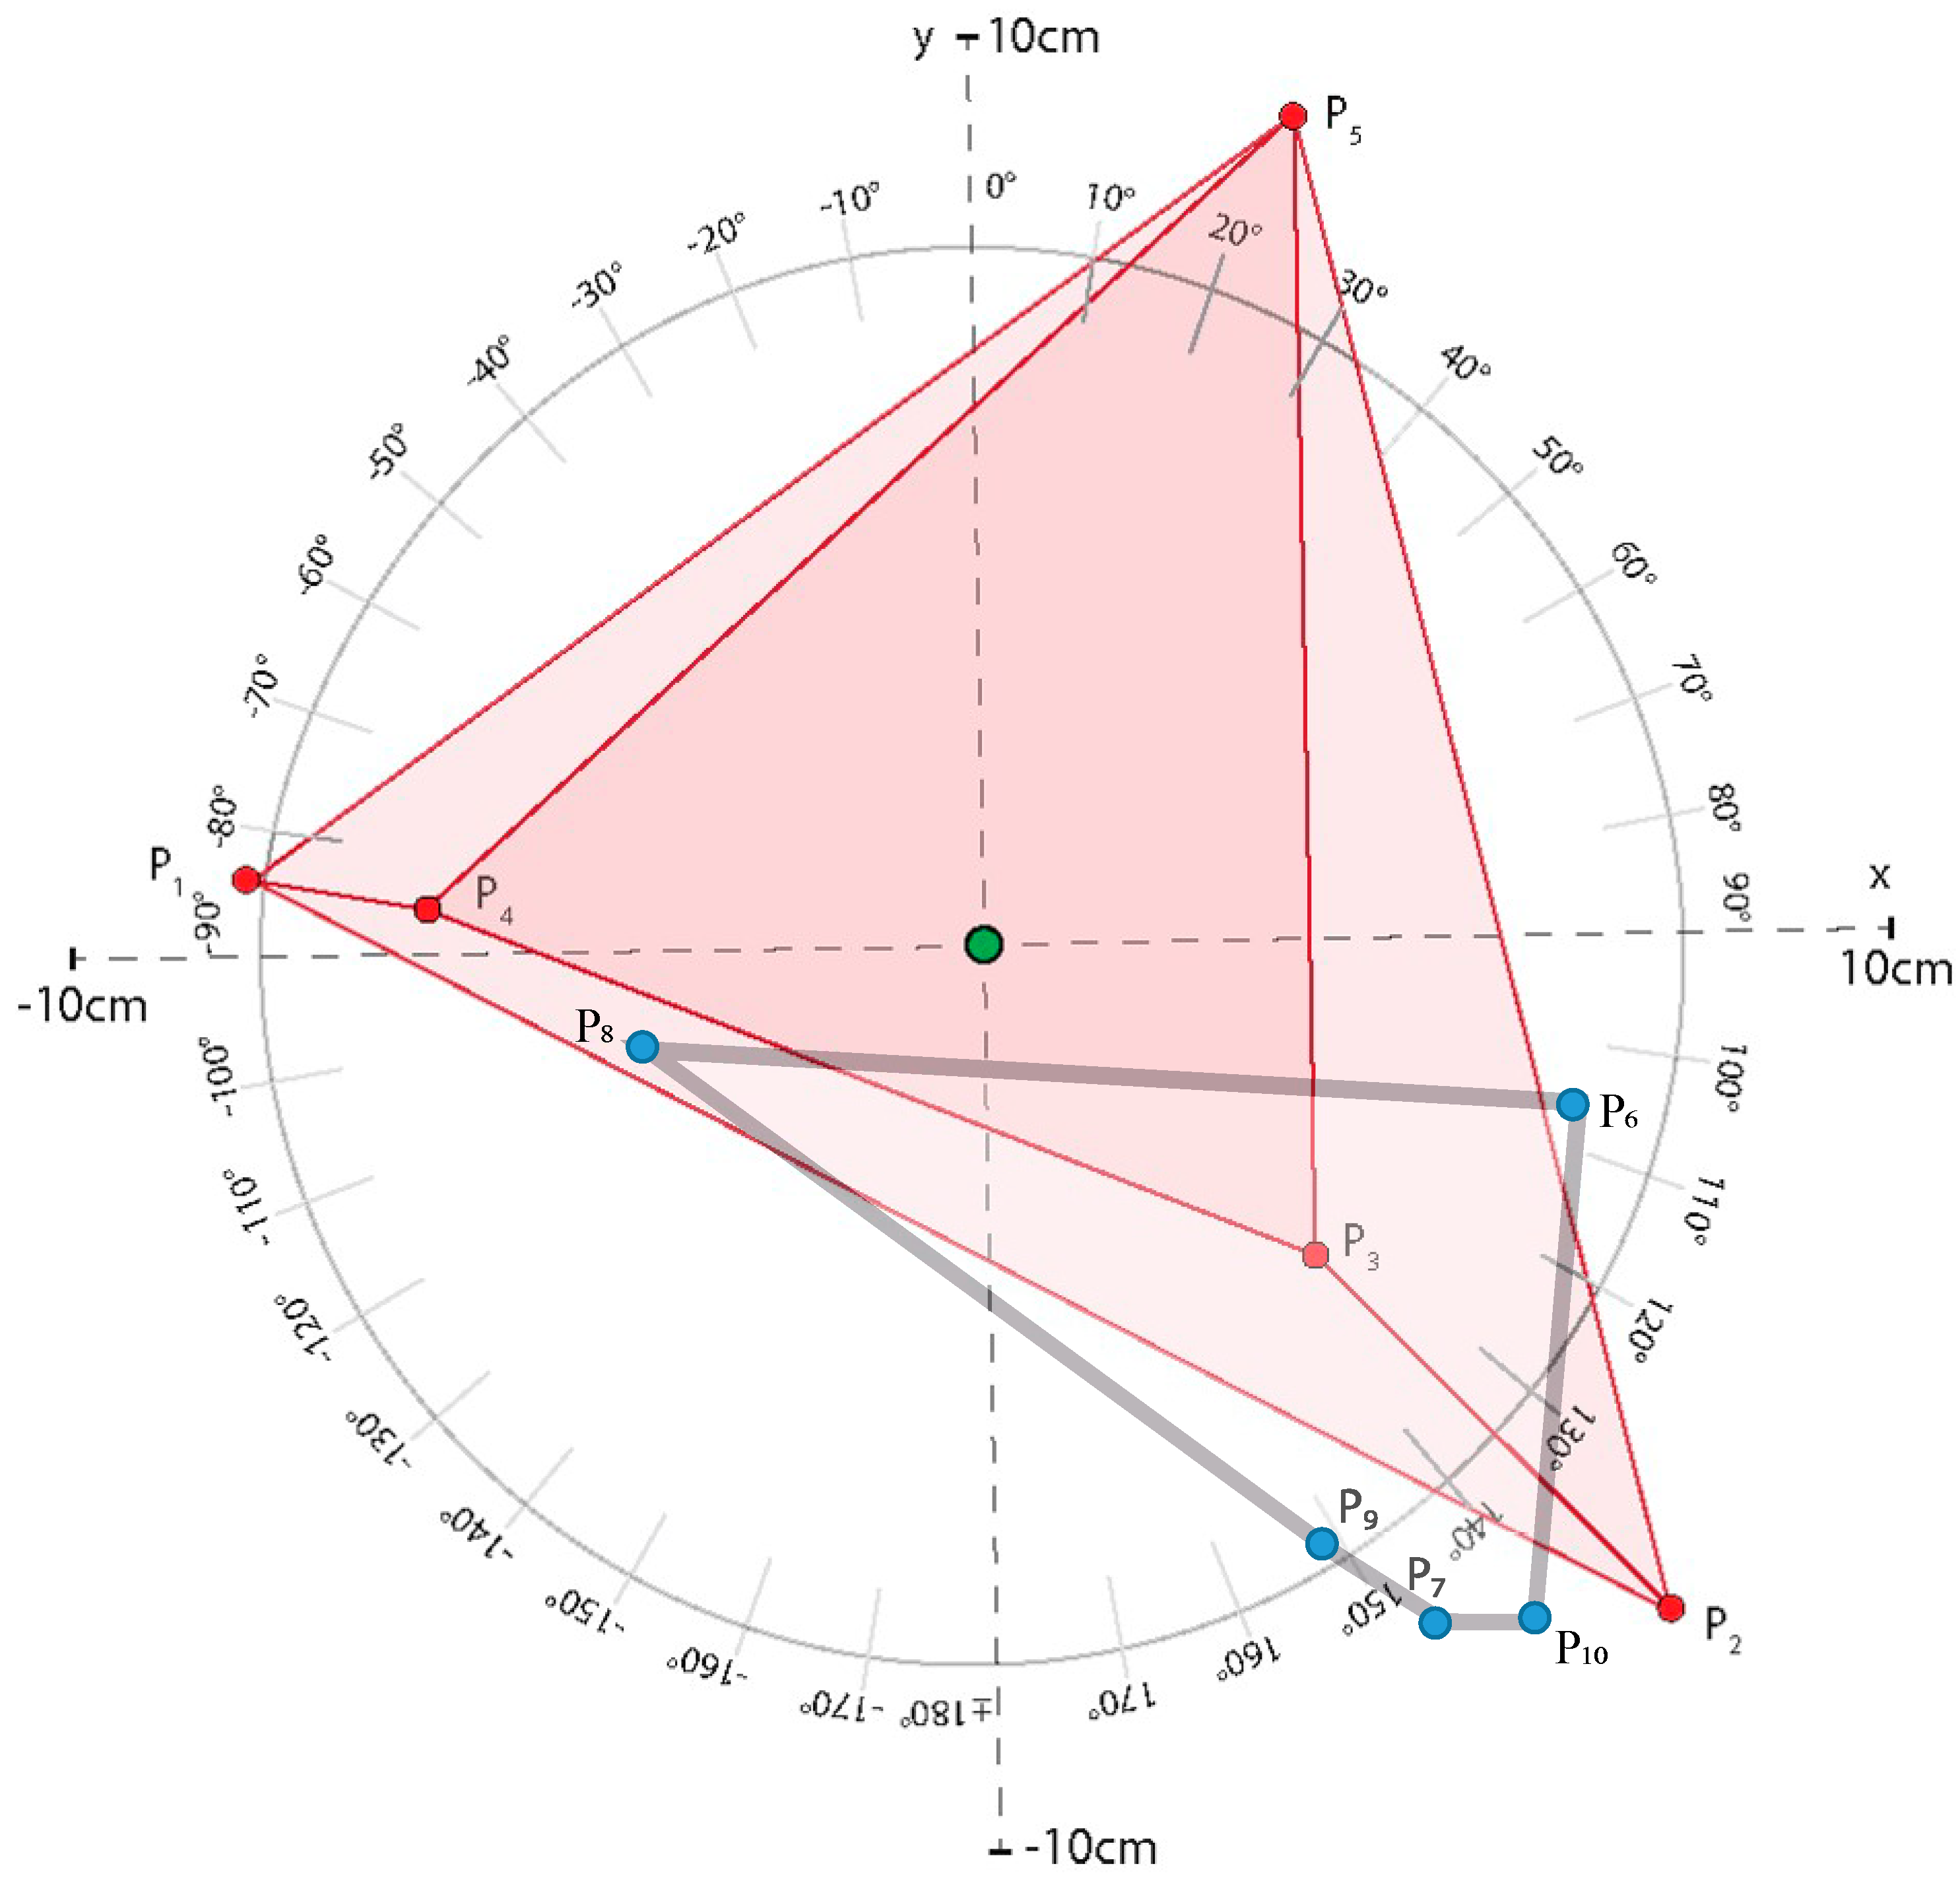
In order to determine the performance for targeted landing, an experiment was conducted indoors where the marker was placed along a certain distance away from the MAV and with a constant angle, α , as shown in Figure 8a. Both the target location and the MAV were placed on the same initial height and a signal was transmitted to the MAV to take off and hover above ground at a height of 30 cm. By using the measurement pad (Figure 8b), we could compute the exact landing place of the MAV and compare it with the desired one. For this purpose, we performed 10 trials while keeping the same posture in each trial. The experimental results are shown in Table 11 and Figure 9. From the results, we can conclude that there are some inconsistencies in terms of both precision and accuracy. The MAV is able to land in relatively close proximity to the center of the measurement pad with a standard deviation of about σ 5.32 cm in both x- and y-direction.

3.4. Battery Characterization

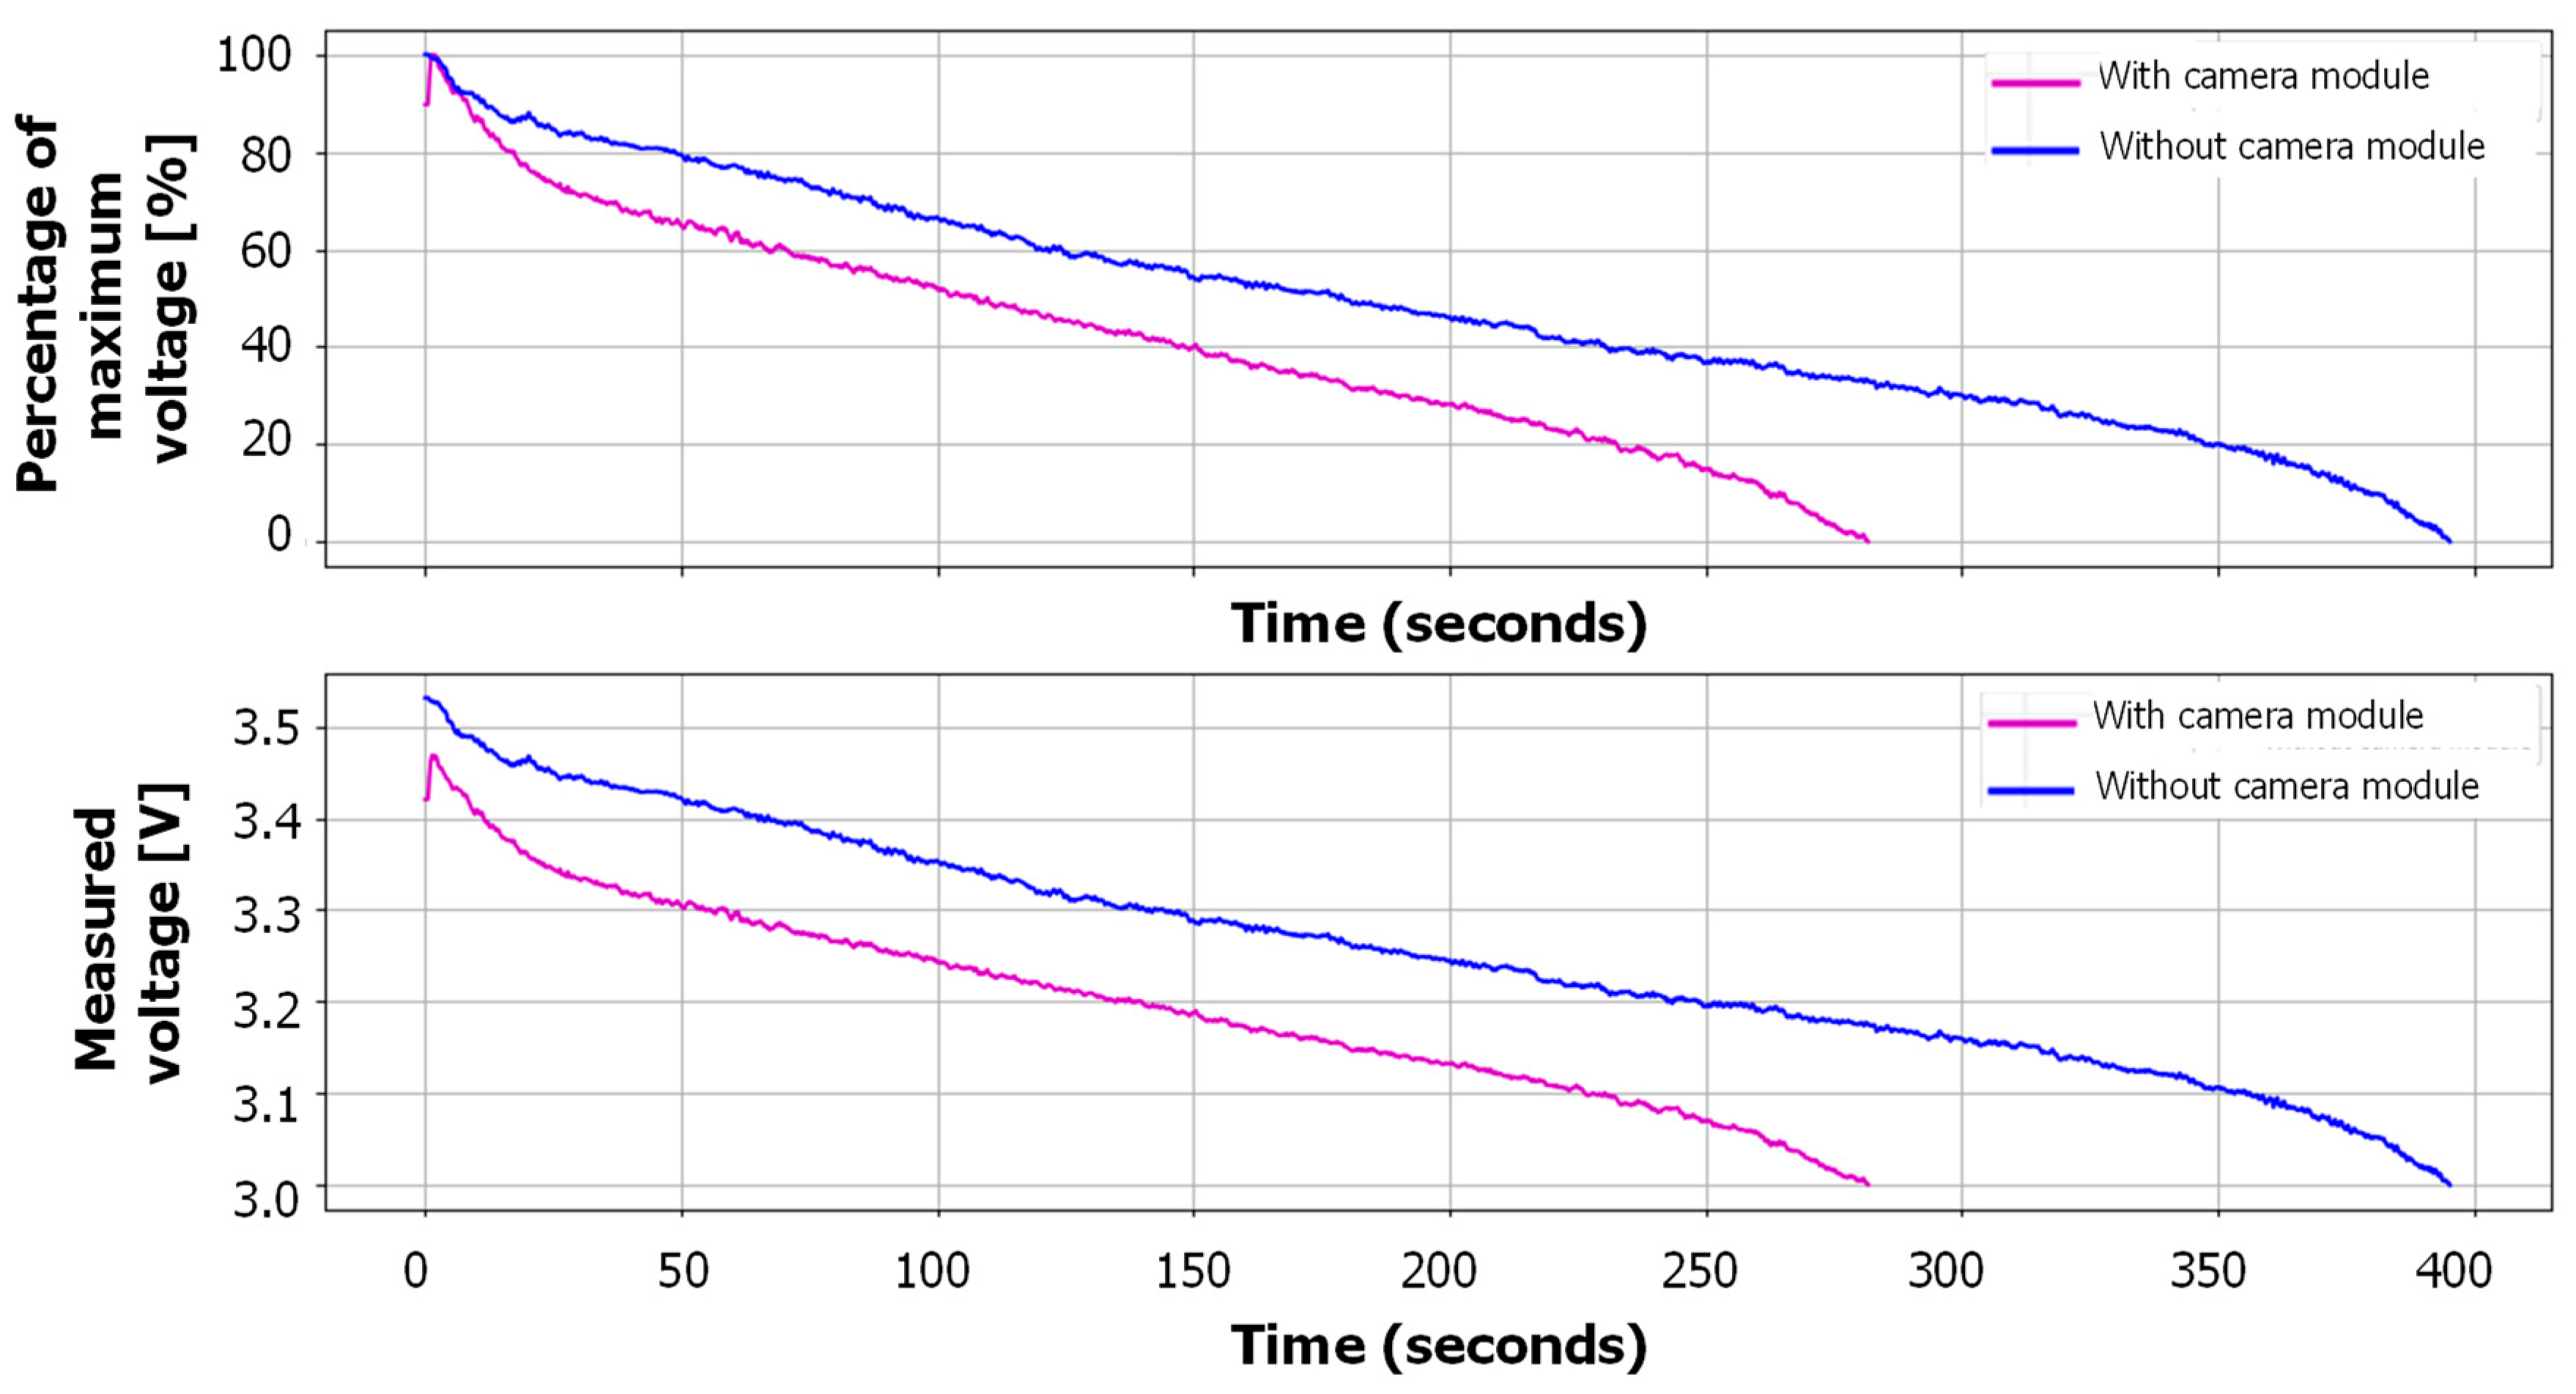
The Crazyflie 2.0 has a flight time of around 7 min [9] without any additional equipment. At first, the flight time was measured first without the camera and video transmission module mounted on the vehicle and then the flight time was measured with the module mounted and turned on, thus contributing to the effective flight time both by its net weight and by the power required for indoor operation. The results from measuring the battery level with and without the camera module activated can be seen in Figure 10. Based on these results, it can hover in place for roughly 6.7 min until the battery voltage level drops below 3.0 Volts.
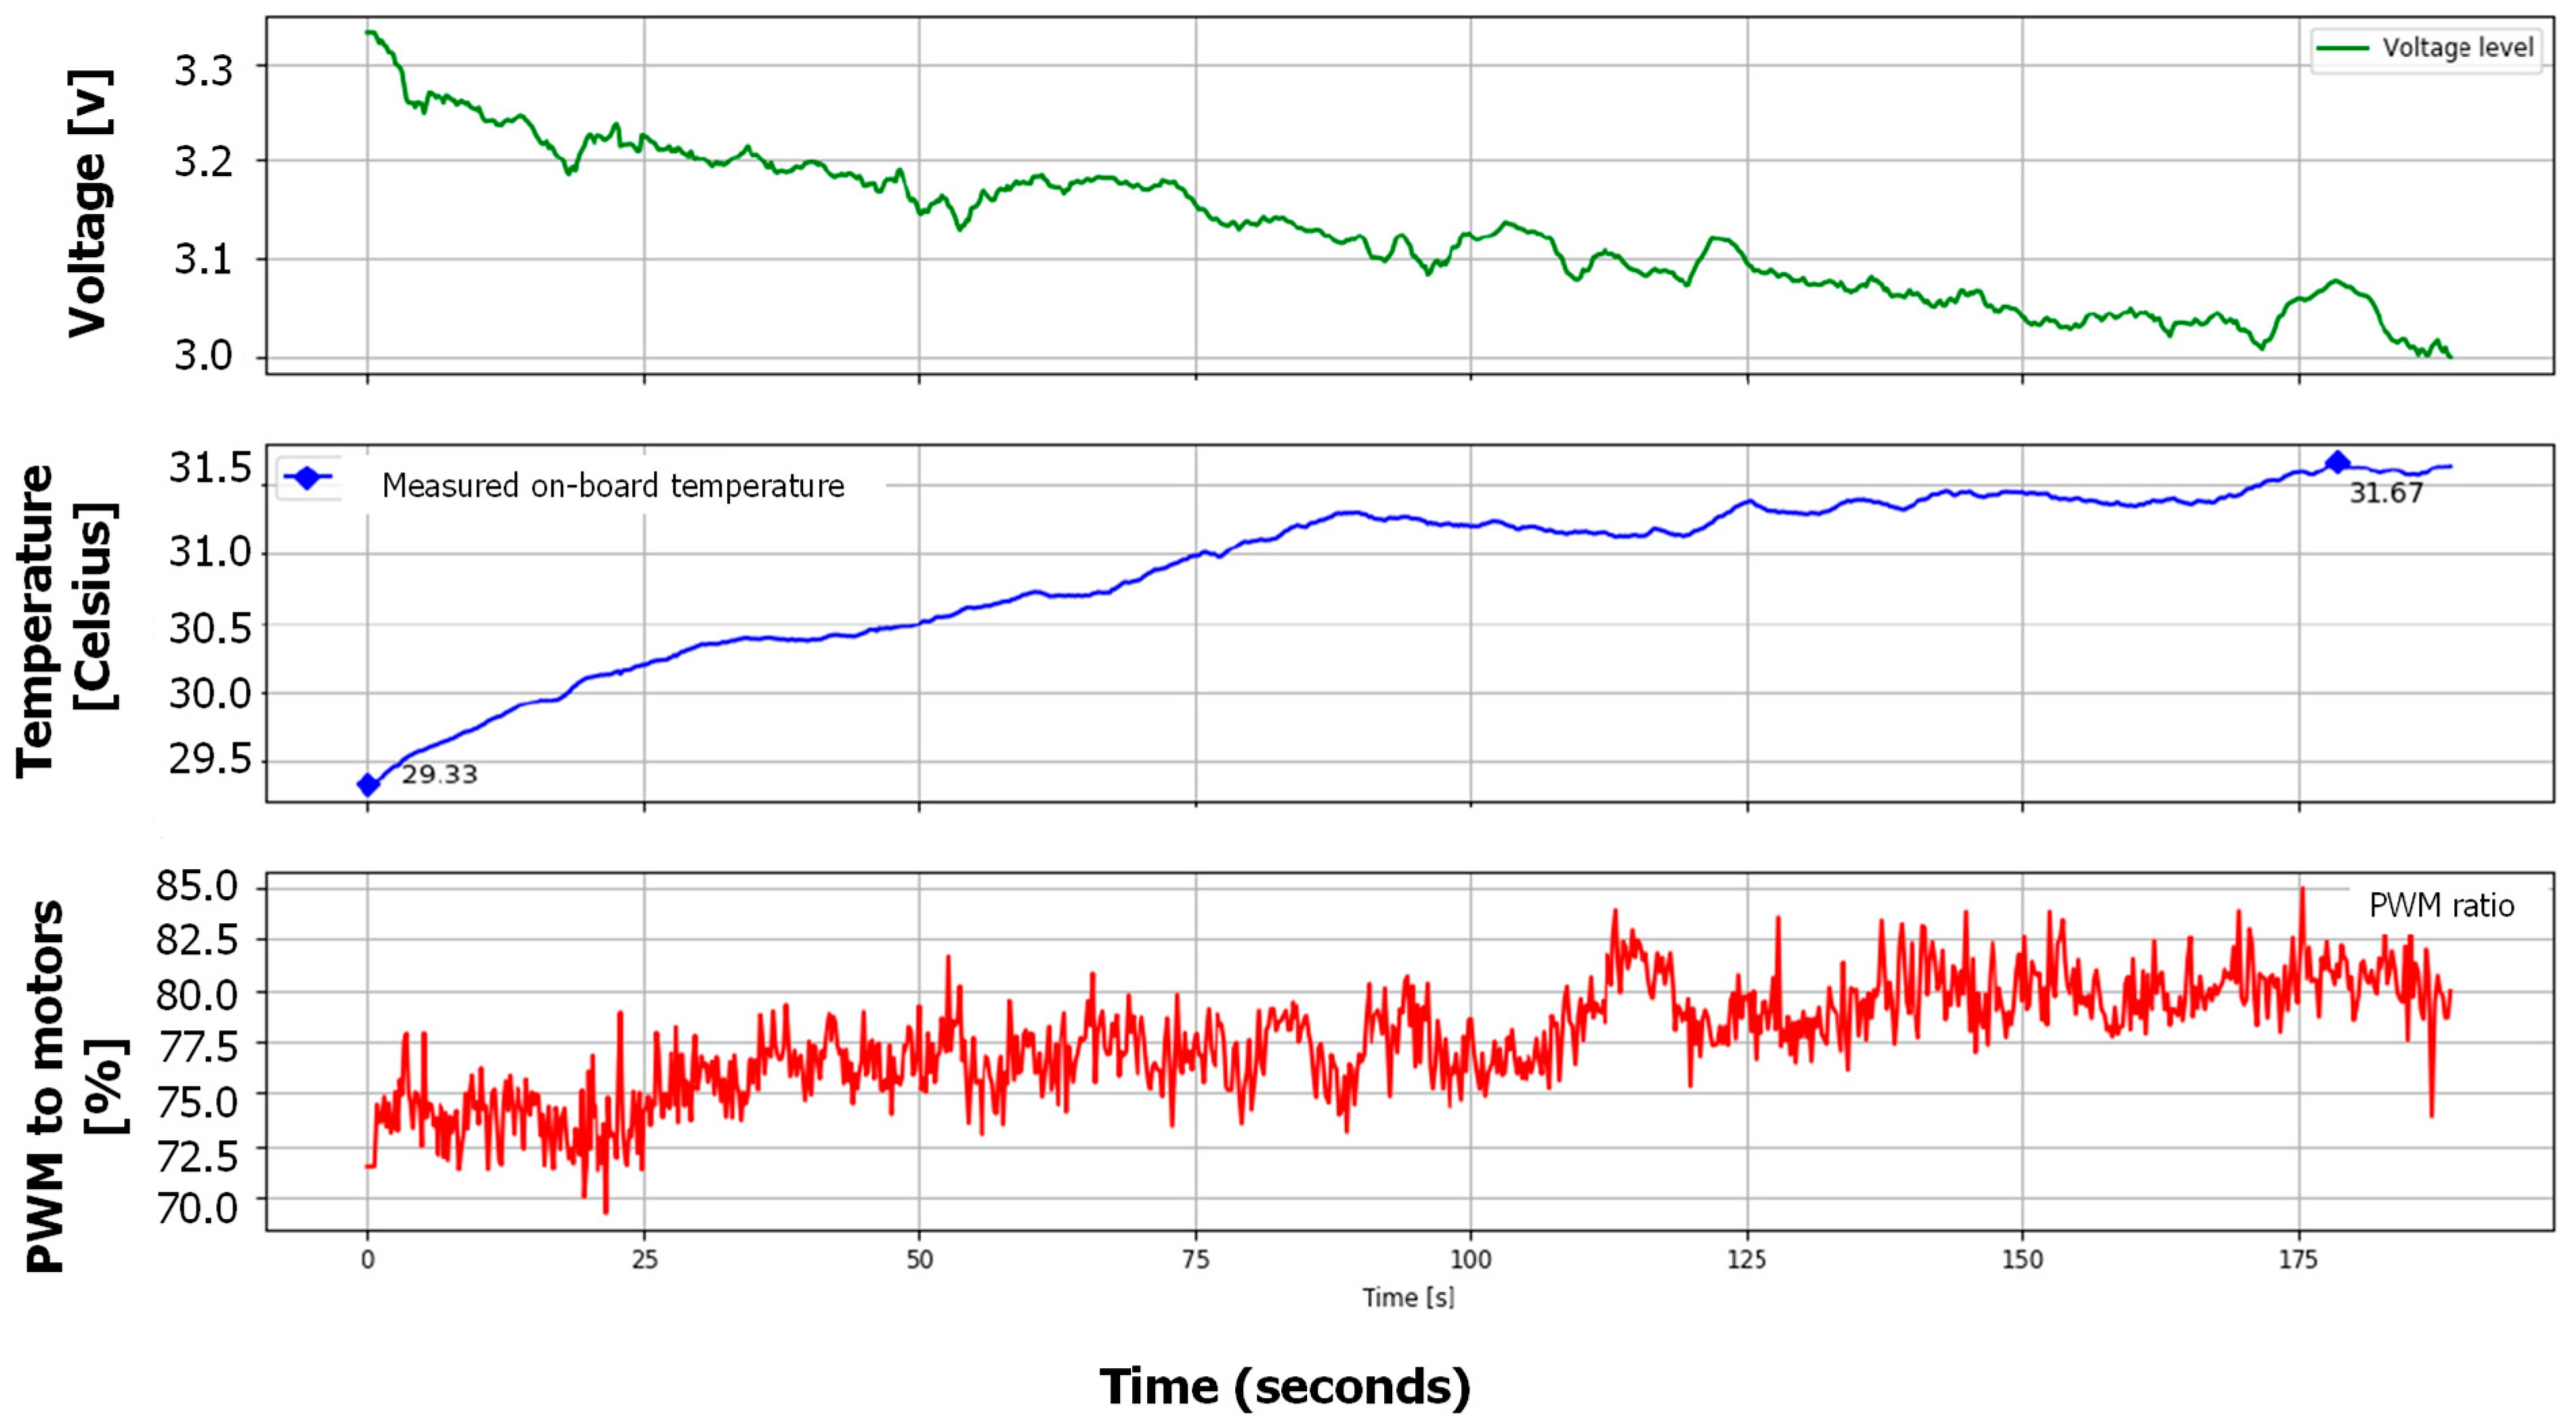
In Figure 11, a similar experiment was conducted but this time with the camera and transmission module mounted on-board the Crazyflie 2.0 and with the power to the module turned on. The intention of this experiment was to assess how the battery life is influenced by only its contribution by weight, excluding the power consumption for the operation of the module. However, at this point the battery had reached too many charge cycles to be able to maintain a similar operational time as for the previous experiments, making the battery discharge more rapidly and thus decreasing the effective flight time substantially.
Therefore, we cannot compare the results between the different measurements directly, but we can observe how other parameters influence the flight time. As the battery level decrease, the duty cycle of the PWM signal given as input to the metal–oxide–semiconductor field-effect (MOSFET) transistors which drive the motors must increase in order to keep the vehicle in equilibrium at the specified height, because the thrust generated by each motor must add up to support the total weight of the platform.
The plot in Figure 11 shows how the duty cycle of the PWM signal increases as the battery voltage decreases in order to keep the quadcopter stable and at a constant height. This means that since the thrust output from each motor will determine the position (in this case, the height) of the quadcopter, by increasing the cycle frequency the quadcopter is able to remain in its original pose, but this will also entail in an increased power consumption. We can also see from the graph that the readings from the on-board temperature sensor increase with the time of operation. This is interesting because it allows us to reason about the losses in the system that appear as heat losses. The internal resistance in the battery will cause the temperature in the battery to increase over time during operation and will cause the voltage to drop; however, since the sensor measures the ambient temperature, we cannot conclude that the increase in temperature is subject to only the heat generated by the battery, as it may also originate from, e.g., friction or other losses from the brushless motors which generate heat.

4. Conclusions

In this paper, in order to design and implement an off-board distributed control system based on visual input for a micro aerial vehicle (MAV) able to hover, navigate. and fly to a desired target location while taking into account the effective fly time due to the battery constrains, the authors have proposed camera pose estimation and marker detection for a MAV based on the ArUco library and the optimization of the relative MAV pose estimation based on the linear Kalman filter. From the experimental results, the MAV was able to land on the desired location within a radius of about 10 cm from the center point of the landing pad, with a reduction in the effective flight time of about 28%
As future work, a feed-forward term based on deep learning algorithms (e.g., LSTM) will be integrated to further improve the accuracy of the pose estimation and landing. In addition, sensors will be placed onboard the MAV to measure the indoor environmental conditions.

Author Contributions

Conceptualization, J.S.; supervision, J.S. and K.R.; writing—review and editing, J.S.; writing—original draft preparation, C.K., S.J. All authors have read and agreed to the published version of the manuscript.

Funding

This research received no external funding.

Conflicts of Interest

The authors declare no conflict of interest.

References

  1. Viljamaa, P.; Koivo, H.N. Adaptive feed control of a forest harvester. In International Conference in Mechatronics; Wiley: Hoboken, NJ, USA, 2003; pp. 235–240. [Google Scholar]
  2. Dunbabin, M.; Roberts, J.; Usher, K.; Corke, P. A new robot for environmental monitoring on the great barrier reef. In Proceedings of the Australian Conference on Robotics and Automation, Canberra, Australia, 6– 8 December 2004. [Google Scholar]
  3. Hodgkinson, B. Environmental Monitoring with K-means Error Reduction Using UAVs Controlled by a Fluid Based Scheme. In Proceedings of the IROS 2012 Workshop on Robotics for Environmental Monitoring, Algarve, Portugal, 7 October 2012. [Google Scholar]
  4. Roldán, J.J.; Joossen, G.; Sanz, D.; Del Cerro, J.; Barrientos, A. Mini-UAV Based Sensory System for Measuring Environmental Variables in Greenhouses. Sensors 2015, 15, 3334–3350. [Google Scholar] [CrossRef] [PubMed] [Green Version]
  5. Falanga, D.; Zanchettin, A.; Simovic, A.; Delmerico, J.; Scaramuzza, D. Vision-based autonomous quadrotor landing on a moving platform. In Proceedings of the 15th International Symposium on Safety, Security, and Rescue Robotics, Shanghai, China, 11–13 October 2017; pp. 200–207. [Google Scholar]
  6. Lange, S.; Sunderhauf, N.; Protzel, P. A vision based onboard approach for landing and position control of an autonomous multirotor UAV in GPS-denied environments. In Proceedings of the International Conference on Advanced Robotics, Munich, Germany, 22–26 June 2009; pp. 1–6. [Google Scholar]
  7. Forster, C.; Pizzoli, M.; Scaramuzza, D. SVO: Fast semi-direct monocular visual odometry. In Proceedings of the IEEE International Conference on Robotics and Automation, Hong Kong, China, 31 May–7 June 2014; pp. 15–22. [Google Scholar]
  8. Reizenstein, A. Position and Trajectory Control of a Quadcopter Using PID and LQ Controllers. Master’s Thesis, Linköping University, Linköping, Sweden, 2017. [Google Scholar]
  9. Bitcraze. Available online: https://store.bitcraze.io/products (accessed on 6 February 2020).
  10. Eachine—FPV VTX Camera. Available online: https://www.eachine.com/FPV-SYSTEMS-c-153.html (accessed on 9 February 2020).
  11. Ramirez, F.R.; Salinas, R.M.; Carnicer, R.M. Speeded Up Detection of Squared Fiducial Markers. Image Vision Comput. 2018, 76, 38–47. [Google Scholar] [CrossRef]
  12. Welch, G.; Bishop, G. TR 95-041: An Introduction to the Kalman Filter; University of North Carolina: Chapel Hill, NC, USA, 2006; pp. 1–16. [Google Scholar]
  13. Karagiannis, I. Design of Gyro Based Roll Stabilization Controller for a Concept Amphibious Commuter Vehicle. Master Thesis, Royal Institute of Technology, Stockholm, Sweden, 2015. [Google Scholar]
  14. Ziegler, J.G.; Nichols, N.B. Optimum settings for automatic controllers. Trans. ASME 1942, 64, 759–768. [Google Scholar] [CrossRef]
  15. Garpinger, O.; Hägglund, T. A Software Tool for Robust PID Design. IFAC Proc. Vol. 2008, 41, 6416–6421. [Google Scholar] [CrossRef] [Green Version]
  16. Åström, K.J.; Hägglund, T. Advanced PID Control. eng; ISA—The Instrumentation, Systems, and Automation Society: Durham, NC, USA, 2006. [Google Scholar]
Figure 1. (a) Crazyflie 2.0 commercialized by Bitcraze AB; (b) the camera and transmitter module was mounted on top of the Crazyflie 2.0.
Applsci 11 02347 g001
Figure 2. (a) Overview of the proposed off-board vision-based control system; (b) schematic diagram for the vision-based control of the MAV.
Applsci 11 02347 g002
Figure 3. Experimental results when following the predefined trajectory without any additional load according to the AMIGO method.
Applsci 11 02347 g003
Figure 4. Experimental results when following the predefined trajectory with an additional load of 4.7 g according to the AMIGO method.
Applsci 11 02347 g004
Figure 5. Experimental results: (a) estimation along the yaw; (b) estimation of marker center along the x-direction.
Applsci 11 02347 g005
Figure 6. Actual distance between the camera and the marker versus the distance calculated by the marker detection and pose estimation function.
Applsci 11 02347 g006
Figure 7. Experimental results: (a) x-direction controller; (b) yaw angle controller.
Applsci 11 02347 g007
Figure 8. (a) The micro aerial vehicle (MAV) is located 1.5 m away from the target location and a rotation of 30 degrees; (b) image of the selected ArUco marker and measurement pad for target landing.
Applsci 11 02347 g008
Figure 9. Each point, Pi, on the diagram corresponds to the landing point for each attempt.
Applsci 11 02347 g009
Figure 10. Changes in the effective flight time of the MAV with and without the camera module.
Applsci 11 02347 g010
Figure 11. Sensor readings during hover with camera and video transmission module on-board (camera and transmitter (TX) module turned off).
Applsci 11 02347 g011
Table 1. Summary of values for k, ki, and kd according to the Ziegler–Nichols method.
Kkikd
1.2 · T 100 % K p · L 1.2 · T 100 % 2 · K p · L 2 1.2 · T 100 % 2 · K p
Table 2. Summary of values for k, ki, and kd according to the approximated M-constrained integral gain optimization (AMIGO) method.
kkikd
1 K p ( 0.2 + 0.45 · T 63 % L ) 1 K p ( 0.2 + 0.45 · T 63 % L ) 0.4 · L + 0.8 · T 63 % L + 0.1 · T 63 % · L ( 0.2 + 0.45 · T 63 % L ) K p · 0.5 · L · T 63 % 0.3 · L + T 63 %
Table 3. Summary of values for k, ki, and kd according to the lambda method.
kkikd
1 K p · L 2 + T 63 % L 2 + T c l 1 K p · ( L 2 + T c l ) 1 K p · L 2 + T 63 % L 2 + T c l · T 63 % · L L + 2 · T 63 %
Table 4. Proportional-Integral and derivative (PID) parameters according to the average values from the step responses without any additional load.
kkikd
Lambda1.10641.57960.0961
AMIGO3.51277.68820.2779
Ziegler-Nichols6.796821.55340.5548
Table 5. PID parameters according to the average values from the step responses with an additional load of 4.7 g.
kkikd
Lambda0.72080.44400.1597
AMIGO1.91261.57050.3935
Ziegler-Nichols2.62933.18750.5573
Table 6. PID parameters according to the average values from the step responses with an additional load of 6.1 g.
kkikd
Lambda0.34480.49020.3690
AMIGO0.71610.25400.6309
Ziegler-Nichols0.58120.13720.6230
Table 7. PID parameters according to the average values from the step responses with an additional load of 10.8 g.
kkikd
Lambda0.40160.47480.8708
AMIGO1.05850.20121.8373
Ziegler-Nichols0.25000.02900.5398
Table 8. The rising time, maximum overshoot and settling time for the step response without any additional load.
Rising Time (s)Maximum Overshoot (cm)Settling Time (s)
AMIGO0.2581.5
Ziegler-Nichols0.25242.5
Lambda1.0129
Table 9. The rising time, maximum overshoot, and settling time for the step response with an additional load of 4.7 g.
Rising Time (s)Maximum Overshoot (cm)Settling Time (s)
AMIGO0.90194
Ziegler-Nichols0.55148
Table 10. The rising time, maximum overshoot, and settling time for the step response with an additional load of 6.1 g.
Rising Time (s)Maximum Overshoot (cm)Settling Time (s)
AMIGO0.9012.14.5
Ziegler-Nichols0.511.97.5
Table 11. Results of the targeted landing experiment. The mean value μ and the standard deviation σ are indicated for each respective parameter.
x [cm]
( μ = 1.88 ,   σ = 5.65 )
y [cm]
( μ = 2.27 ,   σ = 4.99 )
Ψ   [ degrees ]
( μ = 0.085 ,   σ = 4.06 )
−7.71.00.12
7.3−7.1−10.67
3.5−3.45.19
−6.10.50.38
3.69.21.44
7.0−2.51.75
5.1−6.20.34
−4.3−1.71.1
4.9−5.20.14
5.5−7.31.06
Publisher’s Note: MDPI stays neutral with regard to jurisdictional claims in published maps and institutional affiliations.