Abstract
The composition of volatile organic compounds (VOCs) in large-scale livestock farms is complex, which seriously affects the health of livestock and is difficult to evaluate. In order to quickly analyze the pollution degree of VOCs in livestock farms, electronic nose technology was used in this study to detect and analyze the gases in pig and chicken houses, respectively. Firstly, the gas chromatography–mass spectrometry (GC–MS) and electronic nose were used to analyze the VOCs in the pig and chicken houses at different time and locations. The types and relative contents of VOCs were obtained from different livestock farms by GC–MS analysis. The sensor array response of the electronic nose showed similar results. In addition, linear discriminant analysis (LDA), K nearest neighbor (KNN) and support vector machine (SVM) analyses were performed on the electrical signal that was generated by the sensors of electronic nose, respectively. Finally, the classification rate of different odor sources in livestock farms was the highest (>85%), which indicates that SVM is a more effective method suitable for volatile gases recognition in livestock farms. The results have shown that the developed electronic nose sensor is a promising and feasible instrument for characterizing volatile odors in livestock farms.
1. Introduction
In recent years, humans’ need for meat, eggs, and milk has shown an increasing trend. The livestock breeding industry has expanded at a large scale and the degree of intensification and standardization has become higher and higher. In the meantime, the development of livestock breeding has promoted the agriculture progression and has become an important part of China’s agricultural economy [1,2]. However, large-scale livestock farms produce a series of environmental problems. For instance, the generated gases such as ammonia, greenhouse gases, foul odors, particulate matter (PM), and volatile organic compounds (VOCs) are released into the atmosphere, which seriously affects air quality and harms the health of livestock and surrounding residents [3]. Volatile substances in livestock farms mainly come from the livestock themselves, livestock manure, bedding, and feed, etc. [4], and the composition is complex. Under low-concentration environmental conditions, the odor presents a high degree of variability, and its evaluation faces major challenges.
Gas chromatography–mass spectrometry (GC–MS) can obtain the qualitative and quantitative information of VOCs in complex chemical mixtures [5]. GC–MS has the advantages of strong robustness, low detection limit, and high accuracy, and can identify single substances in the mixture. Some researchers have successfully measured the odor of livestock houses using GC–MS [6]. However, it lacks portability, has a long analysis period, and is costly. Currently, it can only be used in the laboratory and cannot realize real-time online monitoring [7,8]. An electronic nose is an instrument that mimics the mammalian olfactory system in sensory response and information processing, and it can be used for mixed gas evaluation [9]. The electronic nose system mainly includes a sensor array, a signal conditioning circuit, and a pattern recognition system that can recognize odors. It obtains multiple features from the dynamic response of each sensor and extracts the main characteristics of the odor under study. Finally, obtained information can be identified and judged through the pattern recognition system, and then a unique response will be generated for a specific odor sample [10].
In recent decades, electronic nose technology has developed rapidly and has been applied in many fields. According to the investigations, the research has been focused on food [11], medicine [12], and environmental detection [13,14]. The electronic nose exhibits an excellent performance in distinguishing volatile organic compounds (VOCs) and volatile organic compound (VOC) mixtures [15]. Sohn established an electronic nose model based on 24 metal oxide semiconductor sensors (MOSs), which can be used to predict the odor concentration in broiler sheds [16]. Abdullah created an odor distribution map of a chicken farm using electronic nose technology and distinguished the odor concentration in different sampling points in the chicken house and the farm [17]. Romain used an electronic nose to continuously monitor the odor of a fattening pig house [18]. The electronic nose is a low-cost, safe and fast detection technique, which does not damage the integrity of the sample. It is one of the most promising technologies for gas detection in livestock farms. However, the current research on volatile substances in livestock farms is mostly focused on the detection of single or several gas concentrations [19], the source of volatile substances [20], the law of odor pollution diffusion [21], protection distance and pollution control [22], etc. There are few rapid detections and comprehensive evaluations of volatile substances in different times and spaces of different livestock farms. Our previous studies have found that the e-nose can effectively identify gases from inside and outside a pigsty at different times, but we have not studied the odor from different locations in the piggery and the chicken house [23].
This paper takes pig and chicken houses as representatives. To analyze the characteristics of VOCs in livestock farms comprehensively and quickly, first, GC–MS was used to obtain the types and relative contents of VOCs in nursery piggeries and chicken houses at different time and locations. At the same time, the developed electronic nose system detected the target gas. The determination of relative content will provide support and verification for the electronic nose test. Then, according to the response of the sensor array of the electronic nose system, three pattern recognition methods—linear discriminant analysis (LDA), K nearest neighbor (KNN), and support vector machine (SVM)—were used to identify and classify the gas samples. Finally, the distribution and content of volatile substances were further analyzed combined with the results of GC–MS analysis, which provided theoretical and technical support for the characterization of livestock farm odor.
2. Materials and Methods
2.1. Experimental Samples
Two farms (one pig farm and one chicken farm) were selected as the test site, which located at the City of Panshi, Jilin Province, China. To study the distribution and change law of the gas in the house in time and space, the sampling locations selected were the exhaust outlet and the middle position in the pregnant pig house and the middle position and window in the nursery pig house. The sampling point was 1 m away from the ground, which was close to the breathing area of the pig; in this way, it could protect the sampling device from damage. Manure was cleaned at 6:00, feeding was being performed at 13:00, and the house was quiet at 18:00. So, gas collections were performed at 6:00, 13:00, and 18:00, which were recorded as morning, afternoon, and evening, respectively. The chicken house was selected as the sampling location in the middle and window of the house. The sample collection times were 8:00 and 16:00, which were recorded as morning and afternoon, respectively. The manure removal was completed during the gas collection in the morning, and the food was provided during the afternoon gas collection.
The QC-1S air sampler (Beijing Institute of Labor Protection Science) was used for gas collection, and the sampling flow rate was set to 1.5 L/min. Four sampling points in the two pig houses were sampled for three consecutive days, and a total 36 gas samples of 30 L were collected. At the same time, 2 L gas samples were collected at 6:00 and 13:00 in the middle position of the nursery pig house and in the window position of the nursery pig house, respectively. Two sampling points in the chicken house were sampled for two consecutive days, and a total 8 gas samples of 30L were collected. At the same time, 2 L gas samples were collected at 6:00 and 14:00 in the middle position of the chicken house and 14:00 in the window position of the chicken house, respectively. The gases that were collected from different sampling positions and times were named nursery-middle-morning, nursery-middle-afternoon, nursery-middle-evening, nursery-window-morning, nursery-window-afternoon, nursery-window-evening, pregnancy-middle-morning, pregnancy-middle-afternoon, pregnancy-middle-evening, pregnancy-exhaust-morning, pregnancy-exhaust-afternoon, pregnancy-exhaust-evening, chicken-middle-morning, chicken-middle-afternoon, chicken-window-morning and chicken-window-afternoon, respectively. The 30 L sample was used for the electronic nose test, and the 2 L sample was used for gas chromatography. After the gas was collected, the samples were taken back immediately to the laboratory in the dark for testing.
2.2. Gas Chromatographic Mass Spectrometry
For the gas chromatography–mass spectrometry test, an Agilent 7890A/5975 (Agilent Corporation, Palo Alto, CA, USA) and a HP-INNO Wax capillary column (Agilent Corporation, Palo Alto, CA, USA) were used. The gas sample was pretreated with a PDMS100 μm extraction head (Supelco, Bellefonte, PA, USA) before use. The extraction head needed to be activated in the forward sample port at 260 °C for one hour before use in order to ensure a good working condition.
Chromatographic working parameters: the inlet temperature was 250 °C, the desorption time was 15 s, and the gas to be measured was separated on the chromatographic column. Oven heating program: the initial temperature was 60 °C, which was maintained for 4 min, increased to 80 °C at 5 °C/min, and then increased to 240 °C at 5 °C/min, which was maintained for 15 min; the total time of heating program is 34 min. The carrier gas was high-purity helium (99.999%), with a flow rate of 1ml/min, and a splitless mode.
MS working parameters: GC–MS interface temperature was 260 °C, electron bombardment ion source, ion source temperature was 230 °C, quadrupole temperature was 150 °C, and mass range was 20–500 mass units.
The GC–MS volatile components were qualitatively determined by NIST and Wiley libraries. After the gas was detected, the retention time and peak area were obtained. The retention time was used for qualitative analysis of substances. The peak height was related to the perceived intensity of these gases. The peak area normalization method was used to calculate the relative content of each volatile compound.
2.3. Electronic Nose System
This research uses the self-developed electronic nose system, including air pump, gas mass flow controller, electronic nose chamber and gas sensor array, signal conditioning circuit, data acquisition instrument, computer, etc. Additionally, TGS metal oxide gas sensors which were produced by Figaro, Japan were selected in our electronic nose system as gas detection components. The model and characteristics are shown in Table 1. The resistance signal generated by the sensor was converted into a voltage signal by a signal conditioning circuit, which was a voltage divider circuit recommended by sensor producer. A WS-U60116-c data collector (Beijing Bopu Century Technology Development Co., Ltd, Beijing, China) was used for analog to digital conversion (A/D). The cleaning function of the data collector should be applied when A/D conversion is performed. The developed electronic nose system is shown in Figure 1.

Table 1.
Sensor models and characteristics of electronic nose.
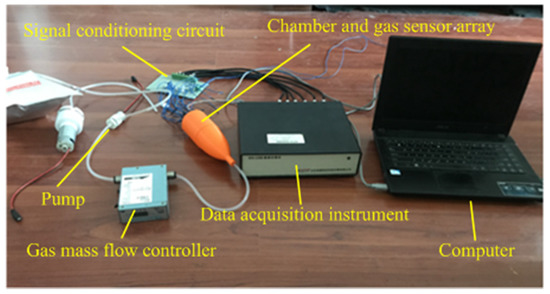
Figure 1.
The developed electronic nose system.
2.4. Data Processing
The change trend of sensor response is related to the composition and concentration of odor. The response curve of electronic nose sensors are shown in Figure 2 (pig farm gas as an example). The collection time of the sensor was 80 s. Except for sensor TGS2602, other sensors tend to be stable after exposing to the sample gas for a period of time. The maximum and average values are important information of sensor response, which are the most used as feature in electronic nose analysis [24,25]. So, the maximum and average values were used as the feature of the sensor response in this paper. First, the original data and mark the serial number were classified. MATLAB software was used to acquire two feature value sets, which are the maximum feature value set and the average feature value set. The features in each feature set are features composed of 7 sensors.
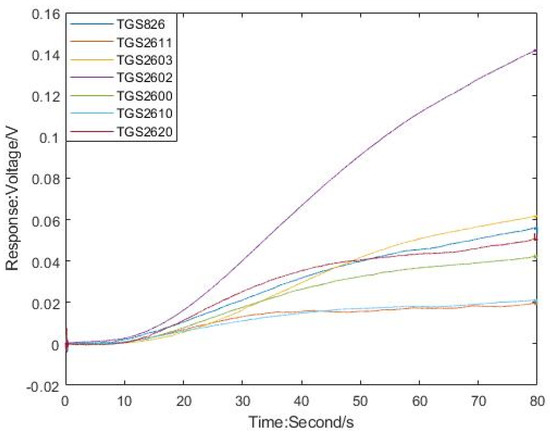
Figure 2.
The response curve of electronic nose sensors.
Pattern recognition was based on the characteristics of the research object, using statistical methods to process and analyze the information that characterizes things or phenomena, to describe, classify and explain the things or phenomena under study [26]. The pattern recognition method has a great impact on the performance of the electronic nose and is a very important part of the electronic nose. In this paper, LDA, KNN and SVM are used to classify the gas in the livestock farms, and the most suitable pattern recognition method for the VOC gas in the livestock farms was obtained by comparing the recognition rates.
3. Results and Discuss
3.1. Quantitative Analysis of Volatile Organic Compounds in Livestock House
In order to quantitatively characterize the volatile components in different times and spaces of the livestock house, the gas samples from the four sampling points (nursery-middle-morning, nursery-middle-afternoon, nursery-window-afternoon, chicken-middle-morning, chicken-middle-afternoon, and chicken-window-afternoon) were detected by GC–MS. The relative contents of volatile compounds were calculated by the peak area normalization method.
More than 70 kinds of VOCs were detected in the nursery piggery, including alkanes, aldehydes, ketones, alcohols, esters, amides, naphthalene, alkynes, indene, benzene, alkenes, etc. More than 30 kinds of VOCs were detected in the chicken house, including alkanes, aldehydes, amides, indene, esters, alcohols, mercaptans, naphthalene, alkenes, benzene, alkynes, etc. Figure 2 shows the classification and relative content of VOCs in six samples.
It can be seen from Figure 3 that the VOC contents in different times and spaces of livestock house are quite different. The VOCs of the nursery piggery house are more complex than that of the chicken house. From Figure 3a–c, it can be seen that the percentages of alkanes and aldehydes were the highest, which indicates that alkanes and aldehydes were the most important types of VOC pollution in nursery pigs and should be paid attention to because those were of great significance for understanding emission characteristics of the VOCs in the nursery piggeries. The content of alkanes in the chicken house was the highest, and alkanes were the main type of VOC pollution in the chicken house. It can be noted from Figure 3e that chickens ate, indicated by more kinds of VOCs, which indicated that eating had a significant impact on the content of VOCs in the chicken house.
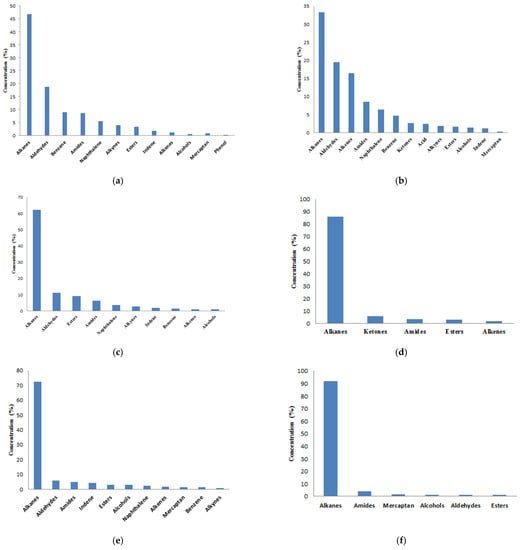
Figure 3.
Types and relative percentage of volatile organic compounds determined by gas chromatography–mass spectrometry (GC–MS): (a) nursery-middle-morning; (b) nursery-middle-afternoon; (c) nursery-window-afternoon; (d) chicken-middle-morning; (e) chicken-middle-afternoon; (f) chicken-window-afternoon.
3.2. Response Analysis of Electronic Nose Sensor Array
The electronic nose can obtain the overall information of the sample smells, and the subtle differences in volatile compounds affect the response of the sensor array. From the collected gas samples, we conducted a total of 244 electronic nose tests for the pig houses and 110 electronic nose tests for the chicken houses, as shown in Table 2 and Table 3. Figure 4 shows the sensor’s response to six odor sources. The bar graph amplitude is the average and standard deviation of the maximum voltage (Vmax) calculated from the electronic nose test for all odor samples test at each sampling location. The TGS2602 sensor was used to detect ammonia, hydrogen sulfide, and volatile organic compounds. It can be seen from Figure 4 that TGS2602 had a high average in response to samples; this is because there is more hydrogen sulfide and ammonia in the pig house and chicken house. The response of TGS2602 in the chicken house was larger than that in the pig house, which indicated that the ammonia and hydrogen sulfide content in the chicken house was larger than that in the pig house. The results of this study were consistent with that of Gui-Hwan [27]. The TGS2603 sensor was the second most sensitive sensor in the pregnant pig house, while the TGS2620 sensor was the second most sensitive sensor in the nursery pig house. Among them, TGS2603 was highly sensitive to amine series and sulfur-containing odors, while TGS2620 was more sensitive to organic solvents, which indicated that there were differences in odor components between the two houses, and the main VOCs were different, which is related to the pig age and feeding methods.
Table 2.
Gas sample information and number of electronic nose tests for pig house.
Table 3.
Gas sample information and number of electronic nose tests for chicken house.
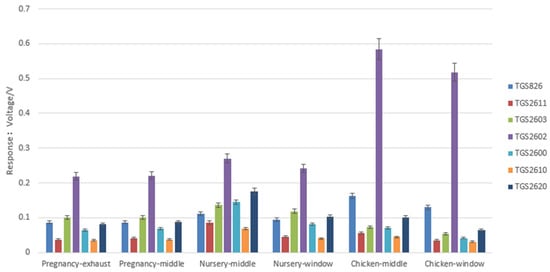
Figure 4.
The average of the maximum voltage calculated from the electronic nose sensor responses.
3.3. Odor Identification of Livestock Farms
In order to further explore the response of the sensor array, odor identification of livestock farm was carried out. The average value and maximum value of the sensor response were selected as features, and the linear classification method (LDA) and nonlinear classification method (KNN, SVM) were used, respectively, to identify the gas in different times and spaces of livestock farms. The classification results were compared to find the most suitable pattern recognition method for VOCs in livestock farms.
(1) LDA
Figure 5 and Figure 6 show the LDA of gas at different times in the piggery when the features were at the average value and the maximum value. The cumulative contribution rate of the horizontal and vertical coordinates was 100%, which can fully represent the characteristics of sample information. When the features were at an average value, only the nursery-window-morning overlapped. When the features were the maximum value, they more or less overlapped in the three periods of gas. In summary, LDA is more suitable for piggery gas identification when the features are at average values.
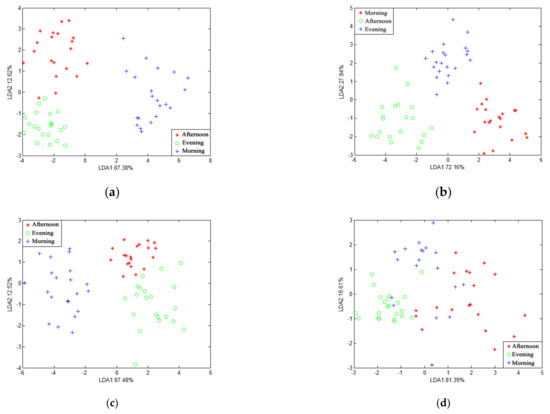
Figure 5.
LDA chart of different time at the same position in pig house with features of average values: (a) pregnancy-exhaust; (b) pregnancy-middle; (c) nursery-middle; (d) nursery-window.
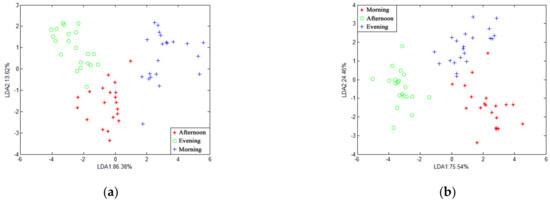
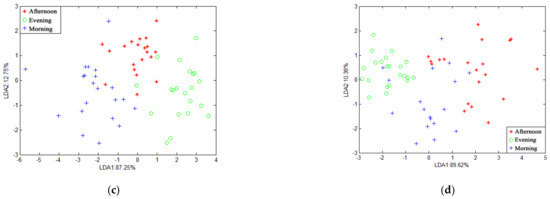
Figure 6.
LDA chart of different times at the same position in the pig house with features of maximum values: (a) pregnancy-exhaust; (b) pregnancy-middle; (c) nursery-middle; (d) nursery-window.
Figure 7 shows the recognition of gases in different spaces of the piggery by LDA when the average value and the maximum value of the features were selected, respectively. The cumulative contribution rates of the first and second discriminant factors in Figure 7a–c are 98.93%, 98.46%, and 98%, respectively. In Figure 7d–f, the cumulative contribution rates of the first and second discriminant factors are 99.74%, 98.36%, and 98.89%, respectively, which can represent most of the characteristics of the sample information. It can be seen from the figure that the samples at different locations overlap, and the distinguishing effect is not good. This is caused by the insignificant gas difference between different locations.
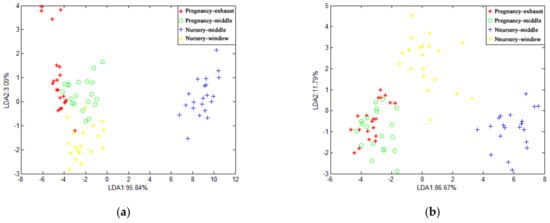
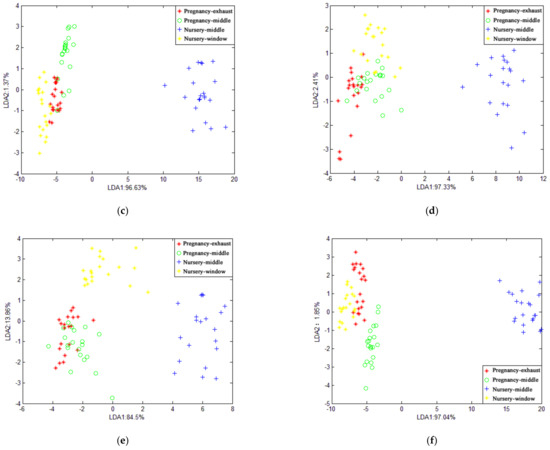
Figure 7.
LDA chart of different positions at the same time in pig house: (a) morning when features are at average value; (b) afternoon when features are at average value; (c) evening when features are at average value; (d) morning when features are at maximum value; (e) afternoon when features are at maximum value; (f) evening when features are at maximum value.
Figure 8 shows the results of LDA’s recognition of the four samples of the chicken house when the average value and the maximum value were selected, respectively. It can be seen from the figure that LDA fails to distinguish the chicken house samples. In general, LDA can only identify the odor characteristics of the piggery at different times, and it is not effective in identifying samples from different locations in the pig house and chicken house.
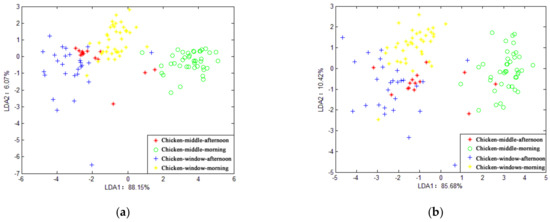
Figure 8.
LDA chart of chicken house gas.
(2) KNN and SVM analyses
In order to verify the recognition of gas emission in different times and places from the livestock house by the electronic nose, different recognition models and features were compared. The 10-fold cross-validation was applied to deal with all sample data in the tests. In this method, the data were divided into ten groups and nine groups were separately used as training sets, and the rest were for validation. All electronic nose data obtained from airbags were randomly divided into training sets and test sets for each fold of cross-validation and this process of randomization was carried out 10 times, and the data for each training set and test set are different. Finally, the average recognition rate was used to judge the model; to some extent, this avoids the sample correlation caused by deliberate division. We carried out parameter optimization and established the KNN and SVM models with the better parameter.
Table 4 shows the gas classification accuracy of KNN and SVM for the same sampling location and different sampling times when the features were at the average value and maximum value. The accuracy of KNN’s classification of odor in the same location in the piggery for four periods is above 80%, and the correct rate of SVM classification is above 85%. This shows that SVM has a better correct rate of odor classification at different times in the piggery, but the feature selection has no significant effect on the classification results. Therefore, from comparing the three classification methods for the gas recognition results at different times in the piggery, it can be concluded that SVM has the highest classification accuracy, but the feature selection has little effect on the classification results, except for nursery-window, KNN, and LDA, the latter of which had the worst effect.
Table 4.
The accuracy for odor classification in the same sampling location of piggery at different sampling times.
Table 5 shows the gas classification accuracy of KNN and SVM with the same sampling time and different sampling locations. KNN has a classification accuracy rate of more than 69% for gas in different locations of the piggery, and the SVM classification accuracy rate is more than 86%. Obviously, the classification accuracy rate of SVM is higher than KNN, but the feature selection has no significant impact on the classification accuracy rate. SVM is more suitable for the identification of piggery gas.
Table 5.
The accuracy for odor classification in different sampling locations of piggery for the same sampling time.
To summarize, the accuracy of KNN for the odor classification of the chicken houses at different sampling times is shown in Table 6. Obviously, the correct rate of KNN for odor classification of the chicken houses at different time is above 78%, and the correct rate of SVM classification is above 92%. The accuracy of SVM classification is higher than that of KNN, and the feature selection has no significant impact on the classification accuracy rate. And SVM is more suitable for chicken house odor identification.
Table 6.
The accuracy for odor classification in the same sampling location of chicken house at different sampling times.
To summarize the correct rate of KNN’s classification of odor in different sampling locations of the chicken house in Table 7. Obviously, the correct rate of KNN’s classification of odor in different locations of the chicken coop is above 85%, and the correct rate of SVM classification is above 95%. Similarly, the feature selection has no significant impact on the classification accuracy rate, and SVM is more suitable for chicken house odor recognition.
Table 7.
The accuracy for odor classification in different sampling locations of chicken house at the same sampling time.
In summary, SVM has the highest classification accuracy rate for VOCs in the pig and chicken houses, followed by KNN, while LDA have the worst classification results. This may be because SVM could call nonlinear kernel functions to solve nonlinear classification problems, while LDA has relatively weak nonlinear classification capabilities. Therefore, SVM was more suitable for the recognition of gas in the chicken houses and piggeries, but the features was the average value or the maximum value, the classification results were not significantly different, and the selection of the feature value has no significant impact on the recognition rate.
Based on the recognition of different locations at a given sampling time and different sampling times at a given location in the livestock house, gas recognition of different locations at different times was carried out. The results are shown in Table 8. It can be seen from the table that the results are consistent with the trend in Table 4, Table 5, Table 6 and Table 7—that is, the recognition effect of SVM is better than that of KNN, but the impact of feature on the recognition result is small.
Table 8.
The accuracy for odor classification in different sampling locations and different sampling times of pig and chicken houses.
Through the comparison of different classification models and features, the electronic nose recognition model for identifying the emission information of livestock and poultry houses at different times and places was obtained. Rapid identification of VOCs in different times and spaces will provide help for the treatment of livestock houses.
4. Conclusions
In this paper, GC–MS and electronic nose were used to explore odor identity in livestock farms of Northeastern China. The types and distribution of VOCs in different livestock houses have been analyzed. A total of more than 70 substances and 30 substances have been detected by GC–MS in the nursery piggery and chicken house, respectively. Moreover, the highest level of VOCs was obtained during the morning at the two localities. Alkanes and aldehydes play the most important role of VOC pollution in nursery pigs according to the measured results, and the release of alkanes makes up main VOC pollution in the chicken houses. What is more, more types of gas will be produced when chickens eat. Furthermore, the response of the electronic nose sensor array shows that the main VOC components except ammonia and hydrogen sulfide in pregnancy houses and nursery houses are also different. There are more amine series and sulfur-containing odors in pregnancy houses, whereas nursery houses have more combustible gases. On the other hand, the smell characteristics in the piggery are obviously more complicated than that of the chicken house, but the proportion of ammonia and hydrogen sulfide in the chicken house is greater than that of the piggery. The electronic nose can clearly distinguish the fingerprints of pigs and chickens, as well as subtle differences between them. In addition, the electronic nose combines with SVM can evaluate the VOC odor attributes of livestock farms more comprehensively. The research results mentioned above can not only provide a reference for the treatment of VOC pollution in livestock farms, but also can prove that the electronic nose sensor we developed is a feasible instrument for characterizing the odor of livestock farms, and it is very promising for applications in husbandry, chemical analysis and the food industry.
Author Contributions
Conceptualization, Z.C.; methodology, X.W. and Y.L.; software, C.K.; validation, C.L. and Y.X.; formal analysis, C.K.; investigation, X.W.; resources, Z.C.; data curation, H.J.; writing—original draft preparation, X.W. and D.C.; writing—review and editing, C.L. and L.R.; visualization, Y.L.; supervision, Z.C.; project administration, C.L.; funding acquisition, Z.C. All authors have read and agreed to the published version of the manuscript.
Funding
This research was funded by the National Natural Science Found of China (51875245, 61805099), the Fundamental Research Funds for the Central Universities, the Science-Technology Development Plan Project of Jilin Province (20190303012SF, 20200201228JC, 20190201019JC, 20200403038SF), the “13th Five-Year Plan” Scientific Research Foundation of the Education Department of Jilin Province (JJKH20211119KJ, JJKH20201006KJ).
Institutional Review Board Statement
Not applicable.
Informed Consent Statement
Not applicable.
Data Availability Statement
The data presented in this study are available on request from the corresponding author. The data are not publicly available due to not have suitable server for publicly store data.
Conflicts of Interest
The authors declare no conflict of interest.
References
- Gan, L.; Hu, X.S. The pollutants from livestock and poultry farming in China—geographic distribution and drivers. Environ. Sci. Pollut. Res. 2016, 23, 8470–8483. [Google Scholar] [CrossRef] [PubMed]
- Wang, H.X.; Xu, J.L.; Liu, X.J.; Sheng, L.X.; Zhang, D.; Li, L.W.; Wang, A.X. Study on the pollution status and control measures for the livestock and poultry breeding industry in northeastern China. Environ. Sci. Pollut. Res. 2018, 25, 4435–4445. [Google Scholar] [CrossRef] [PubMed]
- Bibbiani, C.; Russo, C. Odour emission from intensive livestock production system: Approaches for emission abatement and evaluation of their effectiveness. Large Anim. Rev. 2012, 18, 135–138. [Google Scholar]
- Lacey, R.E.; Mukhtar, S.; Carey, J.B.; Ullman, J.L. A review of literature concerning odors, ammonia, and dust from broiler production facilities: 1. Odor concentrations and emissions. J. Appl. Poult. Res. 2004, 13, 500–508. [Google Scholar] [CrossRef]
- Hwang, Y.-S.; Park, H.-J.; Kim, J.; Son, Y.-S. The Comparison of VOC Characteristics Emitted from Wood-based Panels Using GC/FID and GC/MS. J. Korean Soc. Atmos. Environ. 2011, 27, 436–442. [Google Scholar] [CrossRef][Green Version]
- Huffel, K.V.; Heynderickx, P.M.; Dewulf, J.; Langenhove, H.V. Measurement of Odorants in Livestock Buildings: SIFT-MS and TD-GC-MS. In Proceedings of the Nose: International Conference on Environmental Odour Monitoring & Control, Palermo, Italy, 23–26 September 2012. [Google Scholar]
- Pacot, G.M.M.; Lee, L.M.; Chin, S.T.; Marriott, P.J. Introducing Students to Gas Chromatography-Mass Spectrometry Analysis and Determination of Kerosene Components in a Complex Mixture. J. Chem. Educ. 2016, 93, 742–746. [Google Scholar] [CrossRef]
- Fujiyoshi, T.; Ikami, T.; Sato, T.; Kikukawa, K.; Kobayashi, M.; Ito, H.; Yamamoto, A. Evaluation of the matrix effect on gas chromatography—mass spectrometry with carrier gas containing ethylene glycol as an analyte protectant. J. Chromatogr. A 2016, 1434, 136–141. [Google Scholar] [CrossRef]
- Szulczynski, B.; Gebicki, J.; Namiesnik, J. Monitoring and efficiency assessment of biofilter air deodorization using electronic nose prototype. Chem. Pap. 2018, 72, 527–532. [Google Scholar] [CrossRef]
- Karakaya, D.; Ulucan, O.; Turkan, M. Electronic Nose and Its Applications: A Survey. Int. J. Autom. Comput. 2020, 17, 179–209. [Google Scholar] [CrossRef]
- Shi, H.; Zhang, M.; Adhikari, B. Advances of electronic nose and its application in fresh foods: A review. Crit. Rev. Food Sci. Nutr. 2018, 58, 2700–2710. [Google Scholar] [CrossRef]
- Zhang, W.; Liu, T.; Zhang, M.; Zhang, Y.; Li, H.; Ueland, M.; Forbes, S.L.; Rosalind, W.X.; Su, S.W. NOS.E: A New Fast Response Electronic Nose Health Monitoring System. In Proceedings of the Annual International Conference of the IEEE Engineering in Medicine and Biology Society, Honolulu, HI, USA, 18–21 July 2018; pp. 4977–4980. [Google Scholar] [CrossRef]
- Capelli, L.; Sironi, S.; Del Rosso, R. Electronic Noses for Environmental Monitoring Applications. Sensors 2014, 14, 19979–20007. [Google Scholar] [CrossRef]
- Gadre, S.; Joshi, S. E-nose system using artificial neural networks (ANN) to detect pollutant gases. In Proceedings of the IEEE International Conference on Recent Trends in Electronics, Information and Communication Technology, Bangalore, India, 19–20 May 2017. [Google Scholar]
- Liu, B.; Wu, X.; Kam, K.W.L.; Cheung, W.F.; Zheng, B. Cuprous Oxide Based Chemiresistive Electronic Nose for Discrimination of Volatile Organic Compounds. ACS Sens. 2019, 4, 3051–3055. [Google Scholar] [CrossRef] [PubMed]
- Sohn, J.H.; Hudson, N.; Gallagher, E.; Dunlop, M.; Zeller, L.; Atzeni, M. Implementation of an electronic nose for continuous odour monitoring in a poultry shed. Sens. Actuators B Chem. 2008, 133, 60–69. [Google Scholar] [CrossRef]
- Blanco-Rodriguez, A.; Camara, V.F.; Campo, F.; Becheran, L.; Duran, A.; Vieira, V.D.; de Melo, H.; Garcia-Ramirez, A.R. Development of an electronic nose to characterize odours emitted from different stages in a wastewater treatment plant. Water Res. 2018, 134, 92–100. [Google Scholar] [CrossRef] [PubMed]
- Romain, A.C.; Nicolas, J.; Cobut, P.; Delva, J.; Nicks, B.; Philippe, F. Continuous odour measurement from fattening pig units. Atmos. Environ. 2013, 77, 935–942. [Google Scholar] [CrossRef]
- Lee, M.; Wi, J.; Koziel, J.A.; Ahn, H.; Li, P.Y.; Chen, B.T.; Meiirkhanuly, Z.; Banik, C.; Jenks, W. Effects of UV-A Light Treatment on Ammonia, Hydrogen Sulfide, Greenhouse Gases, and Ozone in Simulated Poultry Barn Conditions. Atmosphere 2020, 11, 283. [Google Scholar] [CrossRef]
- Suresh, A.; Choi, H.L. In situ rapid estimation of nutrients and organic matter in swine slurry by a hydrometer. Appl. Eng. Agric. 2012, 28, 935–942. [Google Scholar] [CrossRef]
- Saha, C.K.; Zhang, G.Q.; Kai, P.; Bjerg, B. Effects of a partial pit ventilation system on indoor air quality and ammonia emission from a fattening pig room. Biosyst. Eng. 2010, 105, 279–287. [Google Scholar] [CrossRef]
- Sarr, J.H.; Goita, K.; Desmarais, C. Analysis of Air Pollution from Swine Production by Using Air Dispersion Model and GIS in Quebec. J. Environ. Qual. 2010, 39, 1975–1983. [Google Scholar] [CrossRef]
- Kong, C.; Zhao, S.; Weng, X.; Liu, C.; Guan, R.; Chang, Z. Weighted Summation: Feature Extraction of Farm Pigsty Data for Electronic Nose. IEEE Access 2019, 7, 96732–96742. [Google Scholar] [CrossRef]
- Stuetz, R.M.; Nicolas, J. Sensor arrays: An inspired idea or an objective measurement of environmental odours? Water Sci. Technol. 2001, 44, 53–58. [Google Scholar] [CrossRef] [PubMed]
- Hong, M. Key Technology of Electronic Nose Gas Recognizer Based on Wireless Sensor Networks. Int. J. Nonlinear Modell. Sci. Eng. 2018, 14, 68–79. [Google Scholar] [CrossRef]
- Alam, M.S.; Karim, M.A. Advances in pattern recognition techniques, devices, and algorithms. Opt. Eng. 2002, 41, 10–12. [Google Scholar] [CrossRef][Green Version]
- Park, G.H.; Oh, G.Y.; Jung, K.H.; Jung, S.Y.; Cha, G.S. The Odor Characteristics of Livestock Raising Facility. J. Odor Indoor Environ. 2005, 4, 207–215. [Google Scholar]
Publisher’s Note: MDPI stays neutral with regard to jurisdictional claims in published maps and institutional affiliations. |
© 2021 by the authors. Licensee MDPI, Basel, Switzerland. This article is an open access article distributed under the terms and conditions of the Creative Commons Attribution (CC BY) license (http://creativecommons.org/licenses/by/4.0/).