Article

Failure in Confined Brazilian Tests on Sandstone

1
Department of Civil, Construction & Environmental Engineering, University of New Mexico, Albuquerque, NM 87131, USA
2
Los Alamos National Laboratory, Los Alamos, NM 87545, USA
*
Author to whom correspondence should be addressed.
Appl. Sci. 2021, 11(5), 2285; https://doi.org/10.3390/app11052285
Submission received: 17 February 2021 / Revised: 27 February 2021 / Accepted: 1 March 2021 / Published: 4 March 2021
(This article belongs to the Special Issue Fracture Mechanics – Theory, Modeling and Applications)

Abstract

:
Strength of rocks in the confined tension region, where the minimum principal stress is tensile, has only infrequently been measured and is not well understood. Quasi-static confined Brazilian tests under a range of confining stresses (2.76 to 27.58 MPa) where used to determine the strength of sandstone in the confined tension region. The test results indicate that the strength in the confined tension region was a strong function of the intermediate principal stress: increasing the intermediate principal stress significantly increased the strength of the sandstone. The strength data were well fit by the Mogi–Coulomb criterion, which accounts for the intermediate principal stress. Unconfined Brazilian strength data were not well fit to the Mogi–Coulomb criterion derived from the confined Brazilian test data, consistent with a transition from tensile to shear processes dominating failure with increasing confining pressure. Observations of post-failure fracture surfaces reveal more indication of shear processes with increasing confining pressure. Numerical simulations from combined finite-discrete element method are compared to the experimental results and reflect similar conditions for failure compared to the experimental tests in the confined tension region.

1. Introduction

In the confined tension region, also referred to as the confined extension region, the minimum principal stress (σ3) is tensile (taken as negative here) and the maximum principal stress (σ1) is compressive (positive) (Figure 1). Strength of rocks in the confined tension region has only infrequently been measured and is not well understood [1,2,3,4,5]. In this region, as σ3 becomes increasingly tensile (negative), the failure mechanism transitions from frictional to purely tensile in the direct or uniaxial tension test. There are many important applications where the rock behavior in the confined tension region is of interest. Failures such as borehole breakouts and spalling and rockbursts can occur under confined tension stress states [6]. Interpretation of some natural fractures suggests they may form from confined tension stress conditions [1]. The extent of damage zones surrounding excavations is significantly affected by the tensile strength derived from tests conducted under confined tension conditions [7]. In addition, fluid pressure induced fracture, e.g., hydrofracturing, can occur under confined tension stress conditions.
Strength criteria that include the confined tension region are required for the design and evaluation of structures of rock. The most common strength criteria used for rock, such as Mohr–Coulomb and Hoek–Brown, are developed from tests under compressive stress states. These criteria reflect the frictional processes from which the rock derives its strength under compressive stresses and are characterized by a positive correlation between the maximum (σ1) and minimum principal stresses (σ3); that is, σ1 increases with increasing σ3 [3]. When these criteria are extrapolated into the confined tension region, they generally do not successfully represent the strength under these stress conditions [2,3,4,6]. A common approach is to extend the criterion into the confined tension region until a threshold stress condition is reached beyond which the strength is set equal to the tensile strength of the rock. This is the tension cut-off approach [3,8,9].
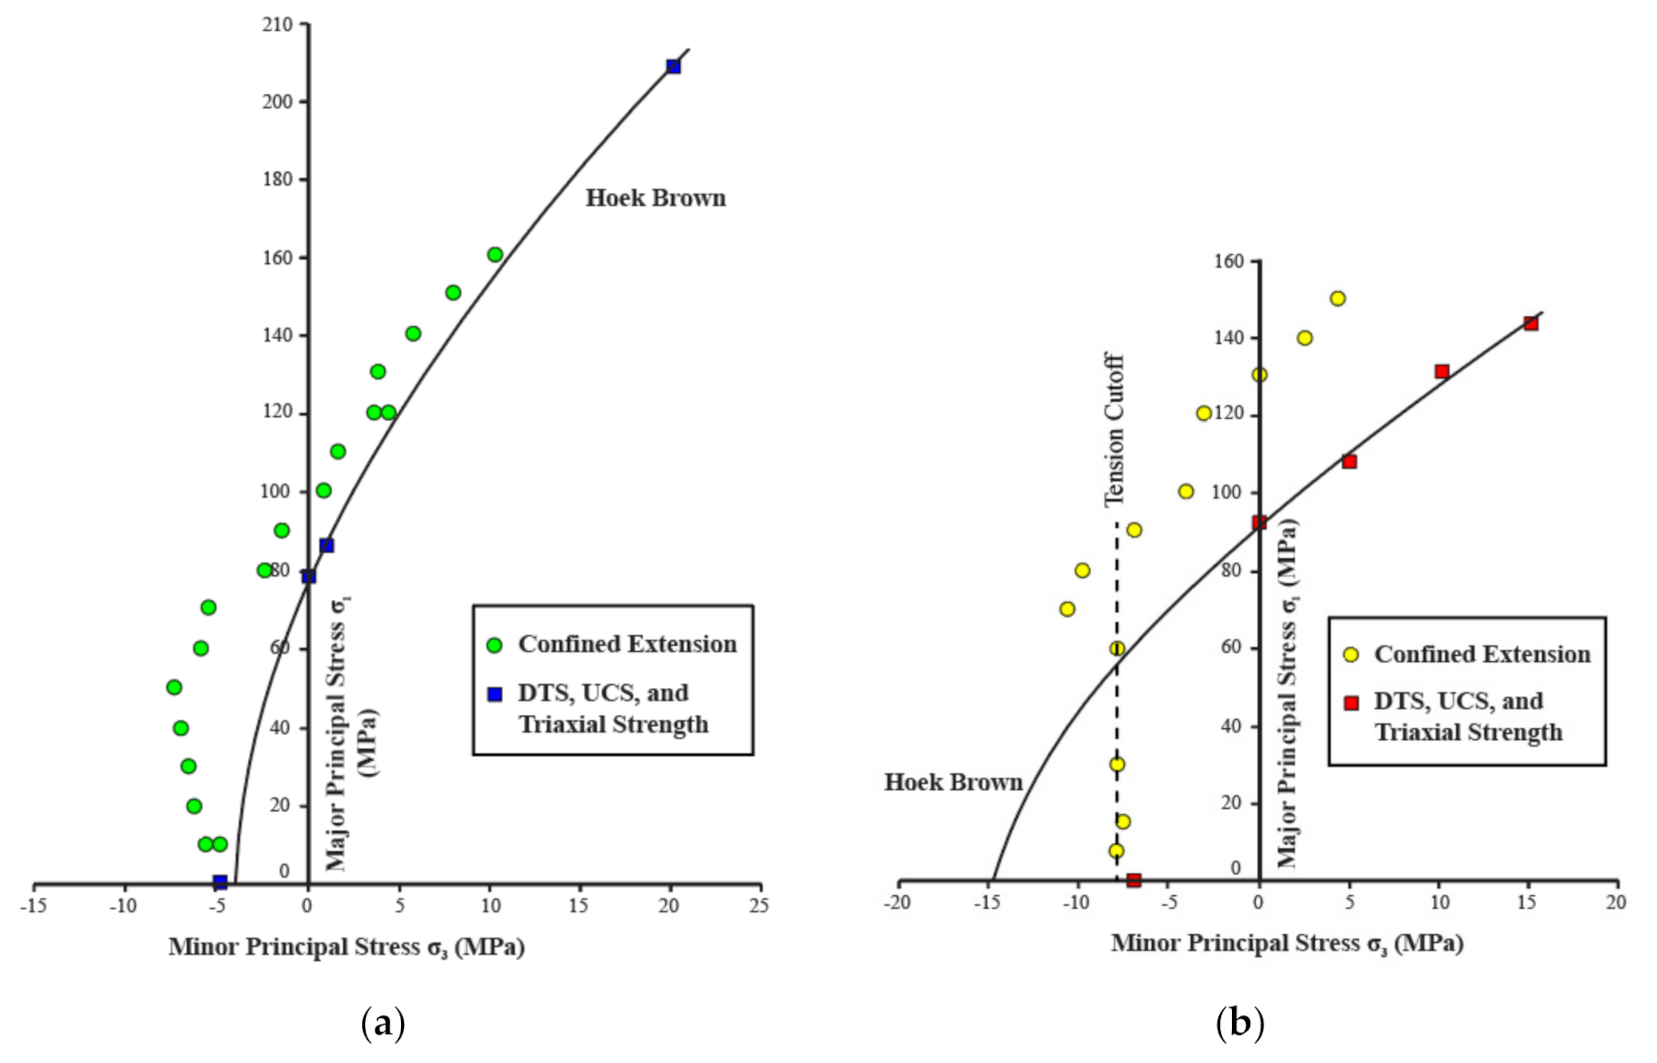
In Figure 2, strength data from two sets of confined extension tests are presented. The figure also includes the strength data from other tests (unconfined compression, triaxial compression and direct tension), and the fitting of the Hoek–Brown criterion to these data. The figure illustrates that strength criteria developed from tests under compressive stresses do not successfully represent the strength in the confined tension region [2,3,4,6]. Further, as illustrated in Figure 2b, the tension cut-off does not describe the strength data that have a σ3 less than the cut-off value as observed in some data obtained in the confined tension region. Finally, the data in the figures also reveal that the strength in biaxial compression obtained from confined extension tests and the strength from uniaxial compression can be substantially different [4]. It is obvious that the strength developed in the confined tension region is an important and unresolved issue.
Strength data in the confined tension region are limited. The Brazilian tensile strength (BTS) test is the most common test in the confined tension region [4,7]. However, BTS tests only follow one stress path (σ3 = −1/3σ1, σ2 = 0 at the sample center) and therefore cannot be used solely to characterize the confined tension region. Strength data in the confined tension region under a range of stress conditions can be generated from triaxial extension tests on dog bone samples at different confining pressures [1,3,10,11,12]. The samples are subjected to a compressive hydrostatic stress state from a confining pressure and axial force. The confining pressure is kept constant while gradually reducing the axial force, which eventually induces a tensile axial stress in the sample. Using this method, Ramsey and Chester [1] interpreted results obtained with different confining pressures along with post-failure examination of the fracture angle and surface as clearly demonstrating a hybrid fracture between a tensile and shear fracture. A challenge with this method is the very detailed sample preparation necessary to produce the dog bone geometry, e.g., [3]. Further, numerical evaluation of the test suggests that the specimen geometry can produce a non-uniform state of stress that deviates from the analytical solution used to interpret the tensile strength [4].
Another method to test rock strength under confined tension conditions is the confined Brazilian test originally described by Jaeger and Hoskins [13], and subsequently used to find strength of rocks [14] and cementitious materials [15] in the confined tension region. This test produces a triaxial state of stress, with the intermediate principal stress equal to the confining pressure. The stress state induced by the confined Brazilian test at failure is a function of the confining pressure; by testing at different confining pressures, the failure surface in the confined tension region can be defined as shown in Figure 1. The stress paths of confined Brazilian tests are more similar to that of typical compression tests compared to extension tests on dog bone samples. Similar to the BTS test, the state of stress in the confined Brazilian test is not homogeneous and must be calculated from the applied load and confining pressure. Specimen preparation is more straightforward than that for dog bone specimens, but similar to BTS tests, there are concerns with crushing-type failure near the location where the specimens are loaded [4].
Strength measured in the confined tension region by different test methods indicate that the intermediate principal stress affects the strength [4,5,13,15]. This suggests strength data obtained from testing in the confined tension region should be evaluated with a criterion that includes the intermediate principal stress. We report on quasi-static confined Brazilian tests under a range of confining stresses to determine the strength of sandstone in the confined tension region. We seek to determine if the strength in the confined tension region is a function of the intermediate principal stress, and whether the strength can be described by a failure criterion that accounts for the intermediate principal stress. Numerical simulations from combined finite-discrete element method are compared to the experimental results to gain further insight into the behavior of brittle geomaterials in the confined tension region.

2. Materials and Methods

2.1. Experimental Methods

Slabs of Royal Red sandstone quarried southeast of Kanab, Utah were provided by New Mexico Travertine, Inc. The sandstone was selected because it is a widely available and common rock type, and is homogenous, consisting of a small grain size ranging from 20 to 100 microns with no large aggregate particles. The slabs were cored, and the ends were cut with a masonry saw to produce samples for subsequent testing. Uniaxial compression tests [16] were performed on cylindrical specimens with a diameter of 50.8 mm and a height of 101.6 mm using an applied axial force at a rate of 30,000 N/min. A compressive strength of 62.24 MPa was derived from averaging the maximum applied principal stress for five tests. Young’s modulus was estimated as 2.74 GPa from the stress and strain data interpreted from the measured force and deformation. A density of 2480 kg/m3 was calculated by measuring the weight and volume of each sample used in the uniaxial compression tests.
Samples for Brazilian tests were produced with a 50.8 mm diameter and a 25.4 mm thickness, consistent with recommended sample dimensions for Brazilian tests [17]. The samples were flattened to address the problem of localized cracking produced near the region of the applied force [4,18]. To produce flattened loading surfaces, the cylindrical samples were flattened 1 mm on the top and bottom of the disk using a sanding belt. Unconfined flattened Brazilian tests were performed at a rate of 0.2 mm/min [19]. Thin wood strips were placed between the loading frame and the sample to evenly distribute the load along the flattened end. An average tensile stress at failure of 6.05 MPa was obtained from four repeated unconfined Brazilian tests.
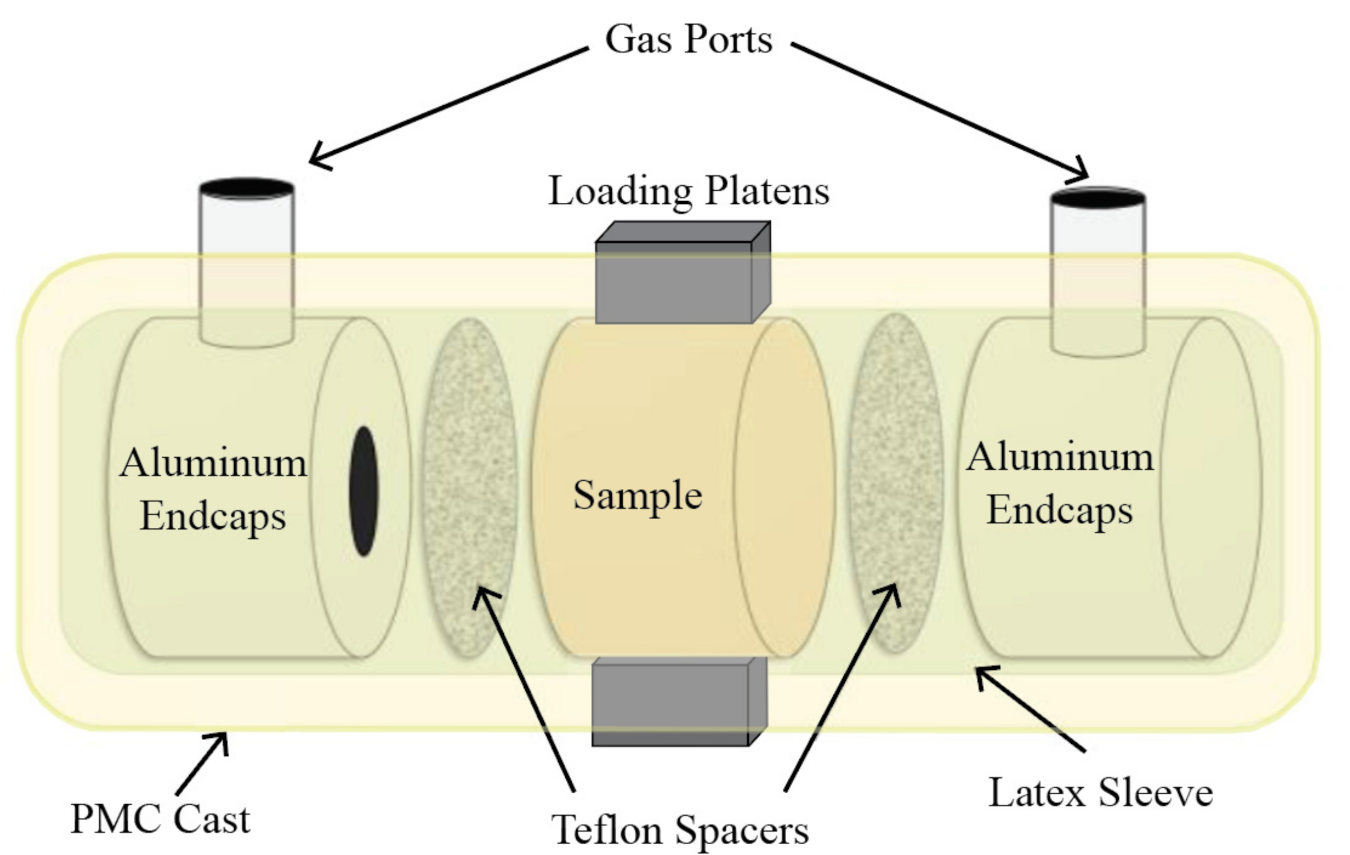
For confined Brazilian testing, sandstone disks were jacketed to allow loading while under confinement providing by a confining fluid (Figure 3). The disks were first placed between two aluminum endcaps which are ported for fluid access to the ends of the sample if desired. Perforated Teflon spacers with a thickness of 1.6 mm were placed between the sandstone and the endcaps to limit friction between the samples and the end caps. The perforated Teflon spacers also allowed an even distribution of gas across the surface of the sandstone. A latex membrane was then placed around the sample, Teflon, and endcaps. This assembly was cast in a low stiffness polyurethane rubber compound, PMC-121/Dry from Smooth-On Inc. Two loading platens were embedded in the polyurethane rubber cast to allow direct contact with the sample when loading.
The jacketed samples were tested in a pressure vessel rated to 34 MPa internal pressure. The pressure vessel was placed in a 433 kN Instron load frame which was used to apply the diametric load through a loading ram. A hydraulic oil pump was used to apply a confining pressure on the sample. Quasi-static confined Brazilian strength tests were carried out with this system by applying a diametric load at a prescribed deformation rate and observing permeability changes. After an initial seating period, the samples were loaded at a rate of 0.04 mm/min. Tests were performed at five confining pressures: 2.76, 8.27, 13.79, 20.68, and 27.58 MPa.
The principal stresses at the center of the sample are calculated from the loading conditions based on the elastic solution developed by Hondros [20] for the unconfined Brazilian test. Jaeger and Hoskins [13] extended Hondros’s solution to account for a confining pressure, PC, used in the confined Brazilian test. To incorporate the use of a flattened Brazilian disk and the configuration of the sample loading, the Jaeger and Hoskins solution has been adapted to the test configuration used by Boyce [15] and is given by:
σ 1 = 0.9 6 F P C A f π Dt + P C
σ 2 = P C
σ 3 = 0.9 2 F P C A f π Dt + P C
where, σ1 is the maximum principal stress, σ2 is the intermediate principal stress, σ3 is the minimum principal stress, F is the applied axial force, Af is the flattened surface area, D is the diameter, and t is the thickness of the Brazilian disk.

2.2. Numerical Methods

Numerical simulations replicating experimental testing were performed with the Hybrid Optimization Software Suite (HOSS) [21], developed at Los Alamos National Laboratory, to evaluate and improve the prediction of damage and failure. HOSS uses the combined finite-discrete element method (FDEM) to simulate fracture and damage processes in brittle materials including the separation of mesh elements to accurately model fracture networks [22,23,24]. Previous studies have proven the ability of HOSS to accurately model simulations of rock mechanic problems and fracture development processes [25,26,27,28].
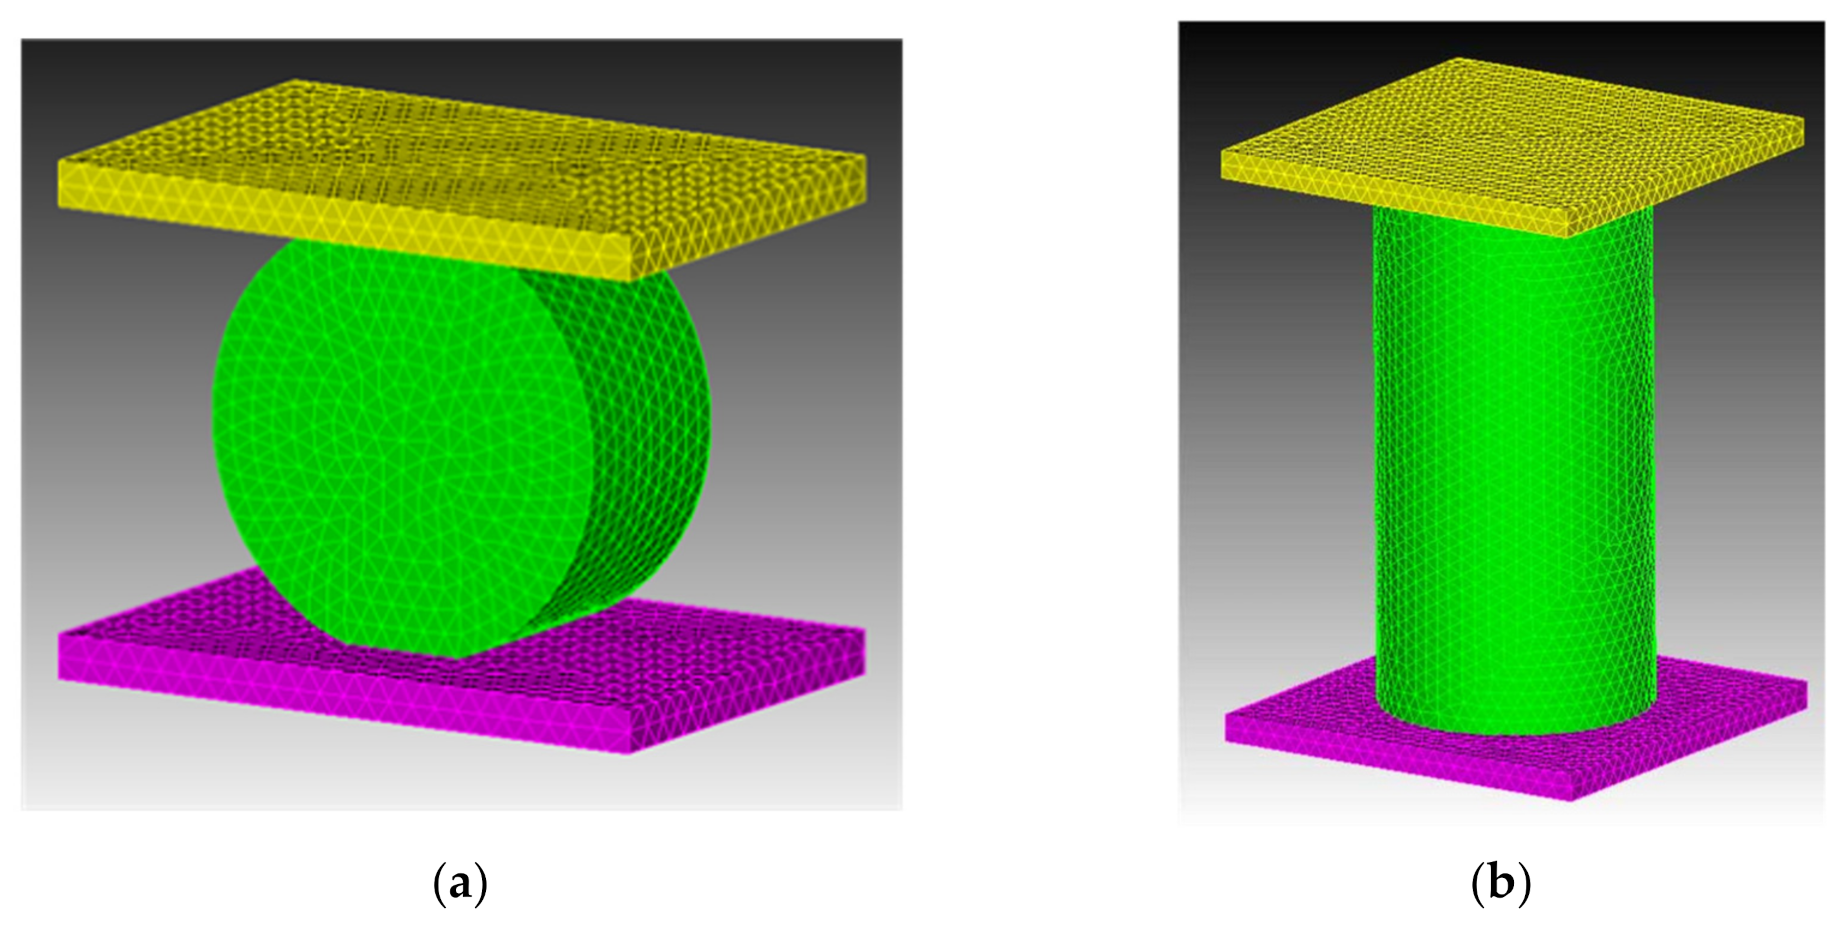
A three dimensional, tetrahedron mesh (Figure 4a) was modeled to replicate the geometry of the experimental Brazilian disk and two loading plates by using Cubit, a modeling software developed at Sandia National Laboratories. The steel plate material blocks were treated as finite element (FEM) domains, and the sandstone disk material block was treated as an FDEM domain. FDEM modeling is more computationally intensive than the continuum-based FEM approach, so only the material block expected to fracture used the FDEM approach. By defining the steel plates as FEM domains, the computational processing power needed for each simulation is reduced. The mesh dimension of 3 mm was chosen by using a mesh convergence study performed during similar simulation testing by Boyce [15]. An additional simulation was performed to replicate a uniaxial compression test, shown in Figure 4b.
Material properties used in the simulations are given in Table 1 and Table 2. The steel material properties were obtained from Boyce [15]. For the sandstone, Young’s modulus and density were obtained from experimental testing. Poisson’s ratio, and the friction coefficients were estimated based on existing literature on similar sandstones [10,29,30]. Shear strength was calibrated to the model based on preliminary iterative numerical trials. Similarly, the tensile strength measured in the lab was also calibrated to the model. After iterative numerical tests, the tensile strength value used in the simulations was 4.69 MPa, which is 78% of the tensile stress at failure in the unconfined Brazilian tests. The true tensile strength is typically between about 70 to 80% of the BTS value for a wide range of rocks [7].
To simulate the displacement-controlled loading that was performed in the laboratory experiments, a constant velocity was applied to the bottom loading plate, while fixing the top loading plate. The velocity of the bottom plate was 0.3 mm/min and was chosen using a convergence study carried out for a similar simulation by Boyce [15]. A pressure boundary condition was placed on the exterior side sets of the sandstone disk, simulating the confining pressures of 2.76, 8.27, 13.79, 20.68, and 27.58 MPa for different tests.

3. Results

3.1. Experimental Results

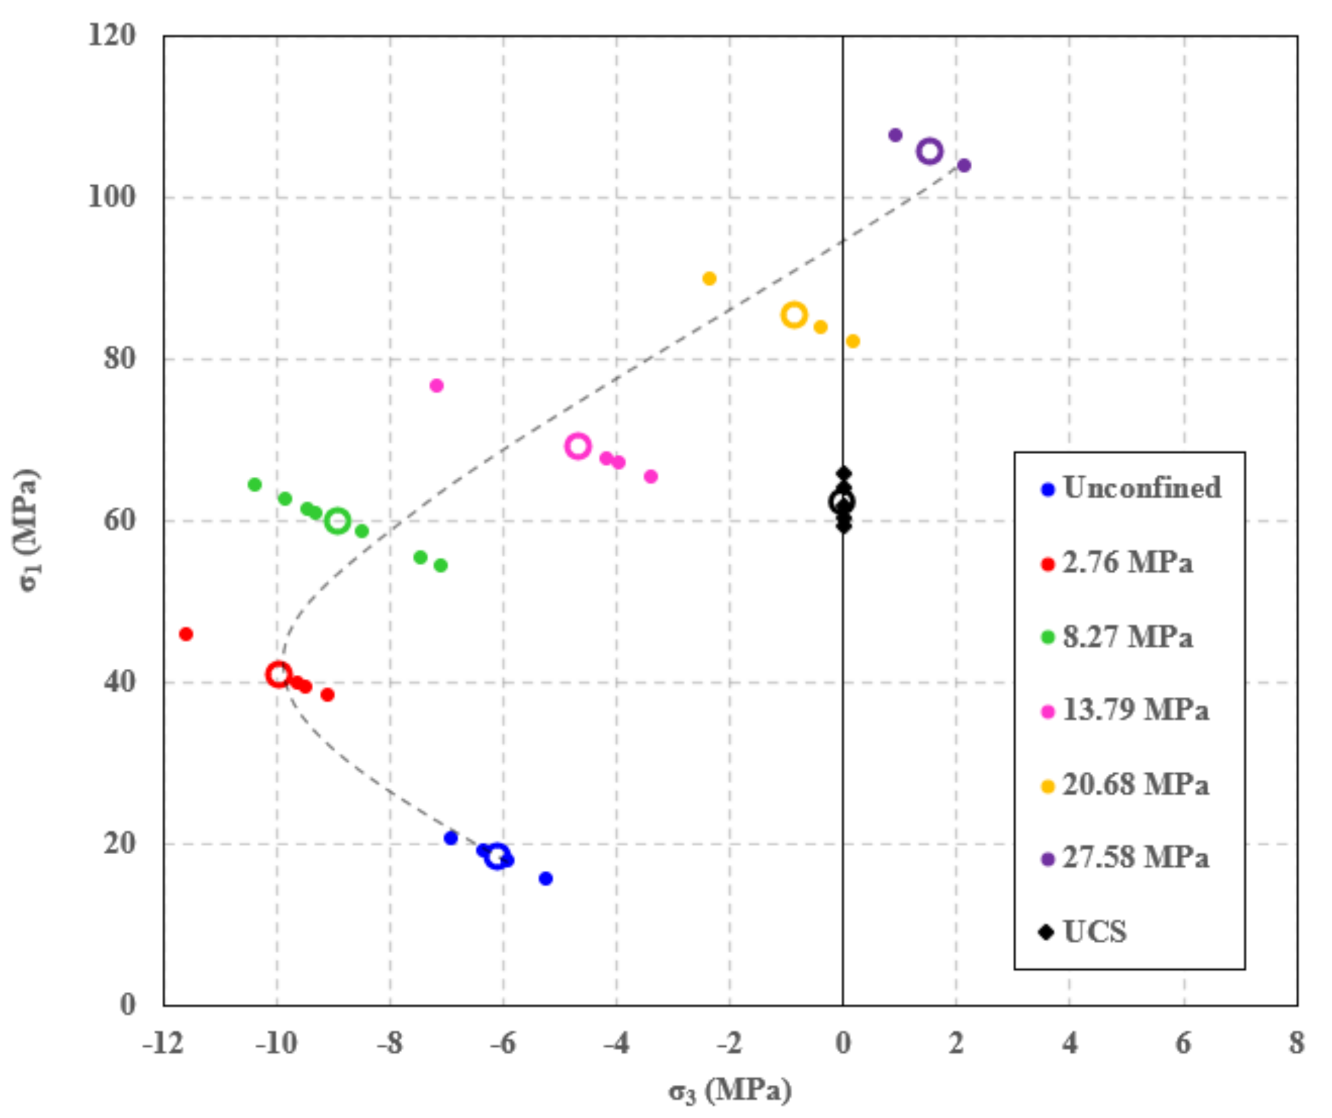
The maximum and minimum principal stresses at the peak load at the sample center for the confined Brazilian tests are calculated from Equations (1) and (3) and are shown in Figure 5. In addition, results from unconfined Brazilian tests and unconfined compression tests are shown in this figure. A curve has been fit through the mean values at each confining pressure. Most of the tests failed in the confined tension region, that is, where σ1 is compressive and σ3 is tensile. At the greatest confining pressure, failure occurred under all compressive stresses. The variability in the confined Brazilian strength data at the same confining pressure may be due to a number of different factors. Samples were produced from a number of different slabs, and thus may account for some variability. In addition, the samples were tested without regard to its bedding orientation which can affect Brazilian test results on sedimentary rocks [7]. The complex sample jacketing configuration may also contribute to some variability, although it is not likely to be responsible for all of the variability as the unjacketed unconfined Brazilian test data has some variability as well. There were not enough tests performed at each confining pressure to determine a meaningful standard deviation in the strength data.
The results from the confined Brazilian tests follow an approximately positive linear relationship between σ1 and σ3. However, the unconfined Brazilian test results deviate from this line, and in fact, indicate that σ3 increases (becomes less negative) at the lower σ1 in this test. The result that σ3 increases (becomes less negative) as σ1 decreases has been observed over portions of other tests in the confined tension region using confined tension tests of dogbone samples [1,3,10] and confined Brazilian tests [15]. The shape of the strength curve in this region is not consistent with a tension cut-off or a strength criterion in the tensile region developed from Griffith fracture criteria [2,6]. A possible explanation for the apparently lower than expected strength during the unconfined Brazilian test reported here is that without confinement, cracks initiate from “open” micro-flaws or microcracks. Confinement would tend to close the open microcracks, and thereby increase their strength.
The uniaxial compressive strength is on the order of 30% lower than the biaxial compressive strength of the confined Brazilian tests (where the curve crosses the σ3 = 0 axis). Jaeger and Hoskins [13] saw a similar behavior in some of their confined Brazilian tests. Results from Bobich [10] and Ramsey and Chester [1] on dog bone samples also indicate that the biaxial compressive strength is greater than the unconfined compressive strength (refer to Figure 2). Patel and Martin [4] conclude that tests with an intermediate principal stress increases the peak strength in the confined tension region.
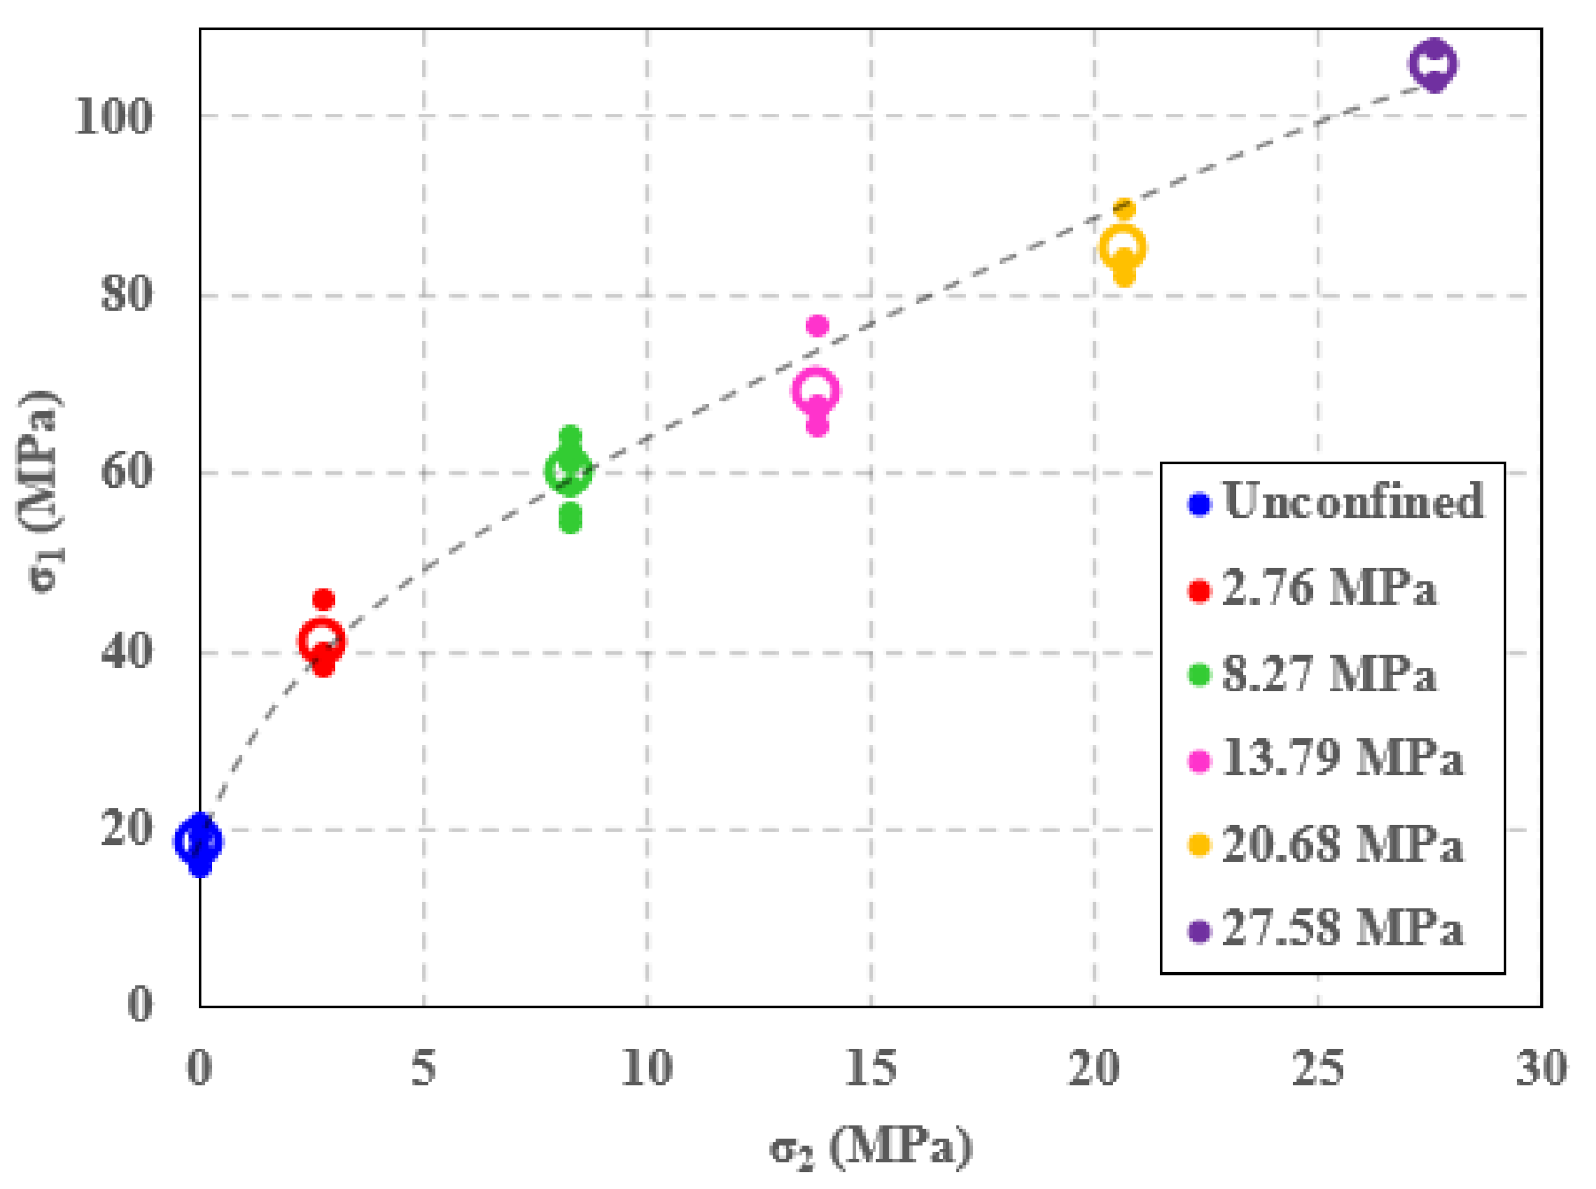
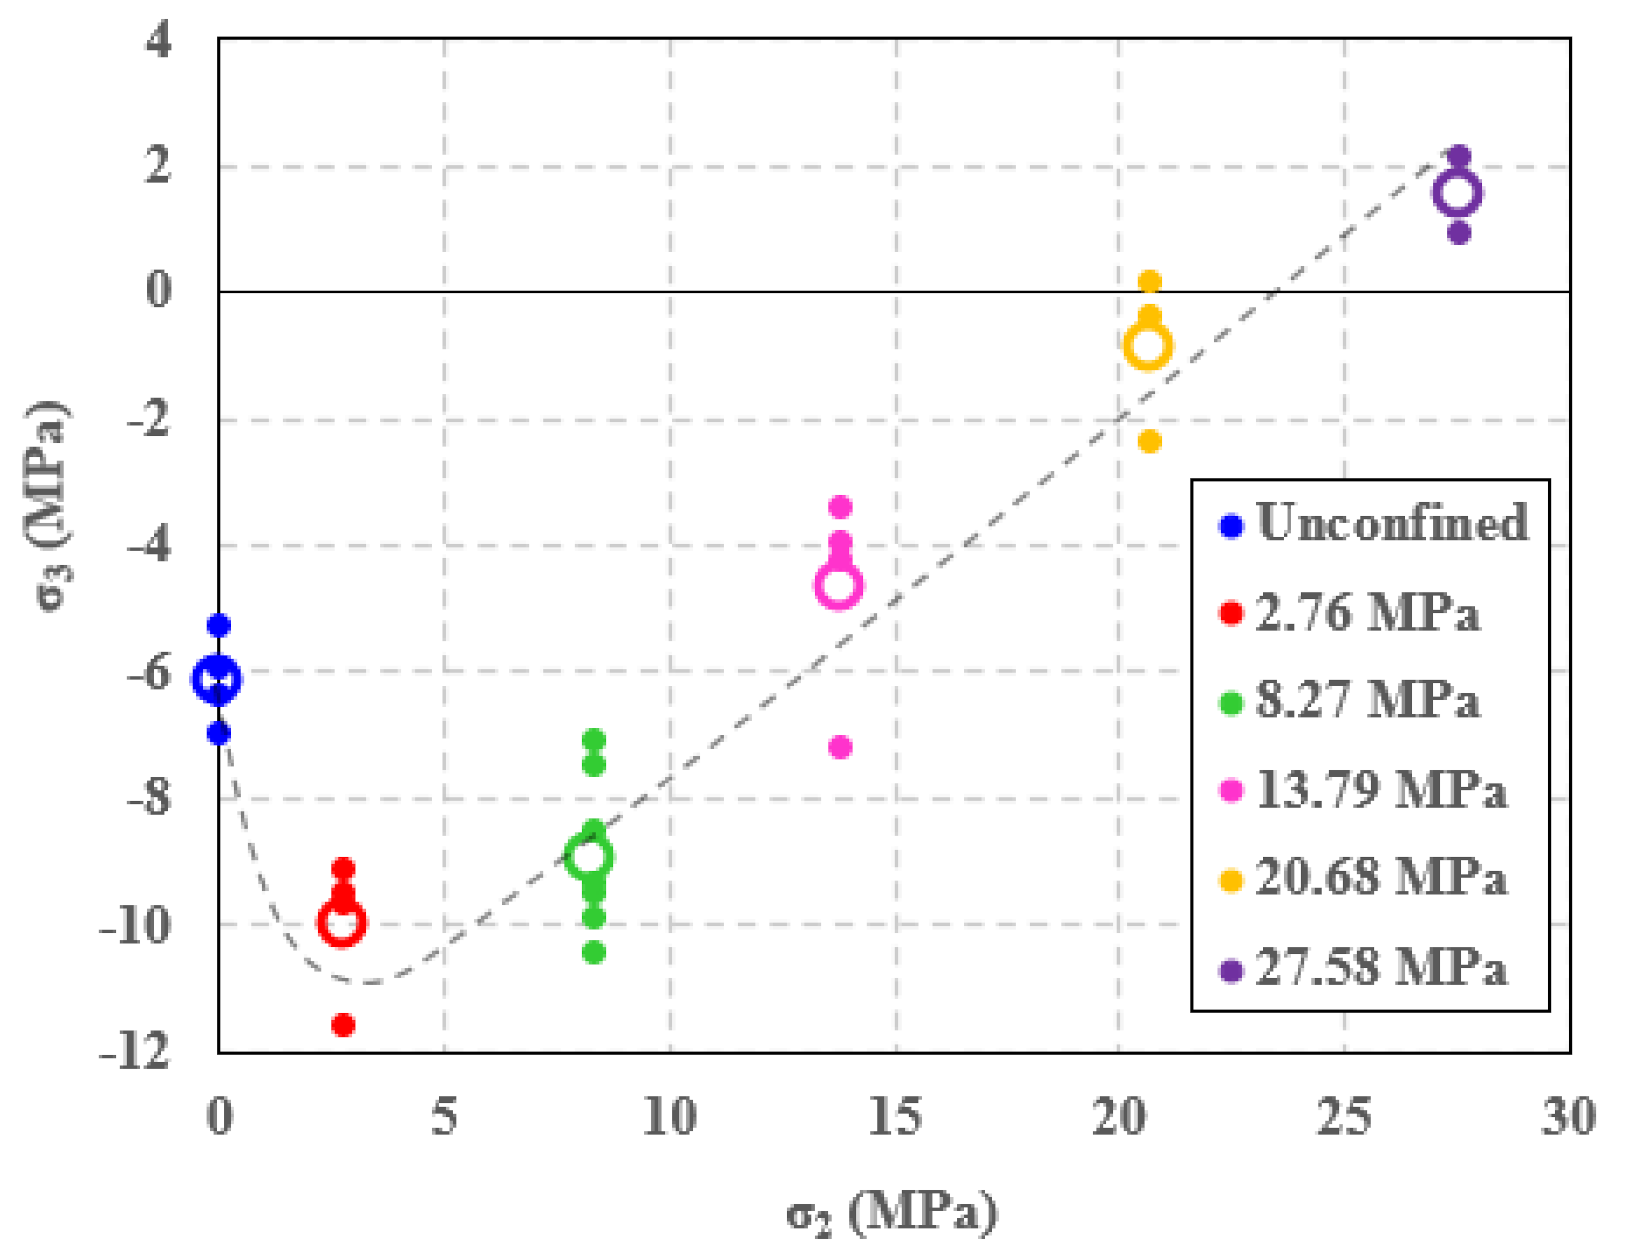
The strength data from the confined and unconfined Brazilian tests are presented as a function of the intermediate stress, that is, σ1 vs. σ2 and σ3 vs. σ2. in Figure 6 and Figure 7, respectively. Both figures confirm the role of the intermediate stress on the rock strength.
The Mogi–Coulomb failure criterion has been used to describe strength of materials where the intermediate principal stress has been shown to be important [31]. The Mogi–Coulomb criterion is a more general case of the Mohr–Coulomb criterion which ignores the intermediate principal stress. The Mogi–Coulomb criterion is defined in terms of the octahedral shear stress and the mean normal stress:
τ oct = 1 3 σ 1 σ 2 2 + σ 2 σ 3 2 + σ 1 σ 3 2
σ m , 2 =   1 2 σ 1 + σ 3
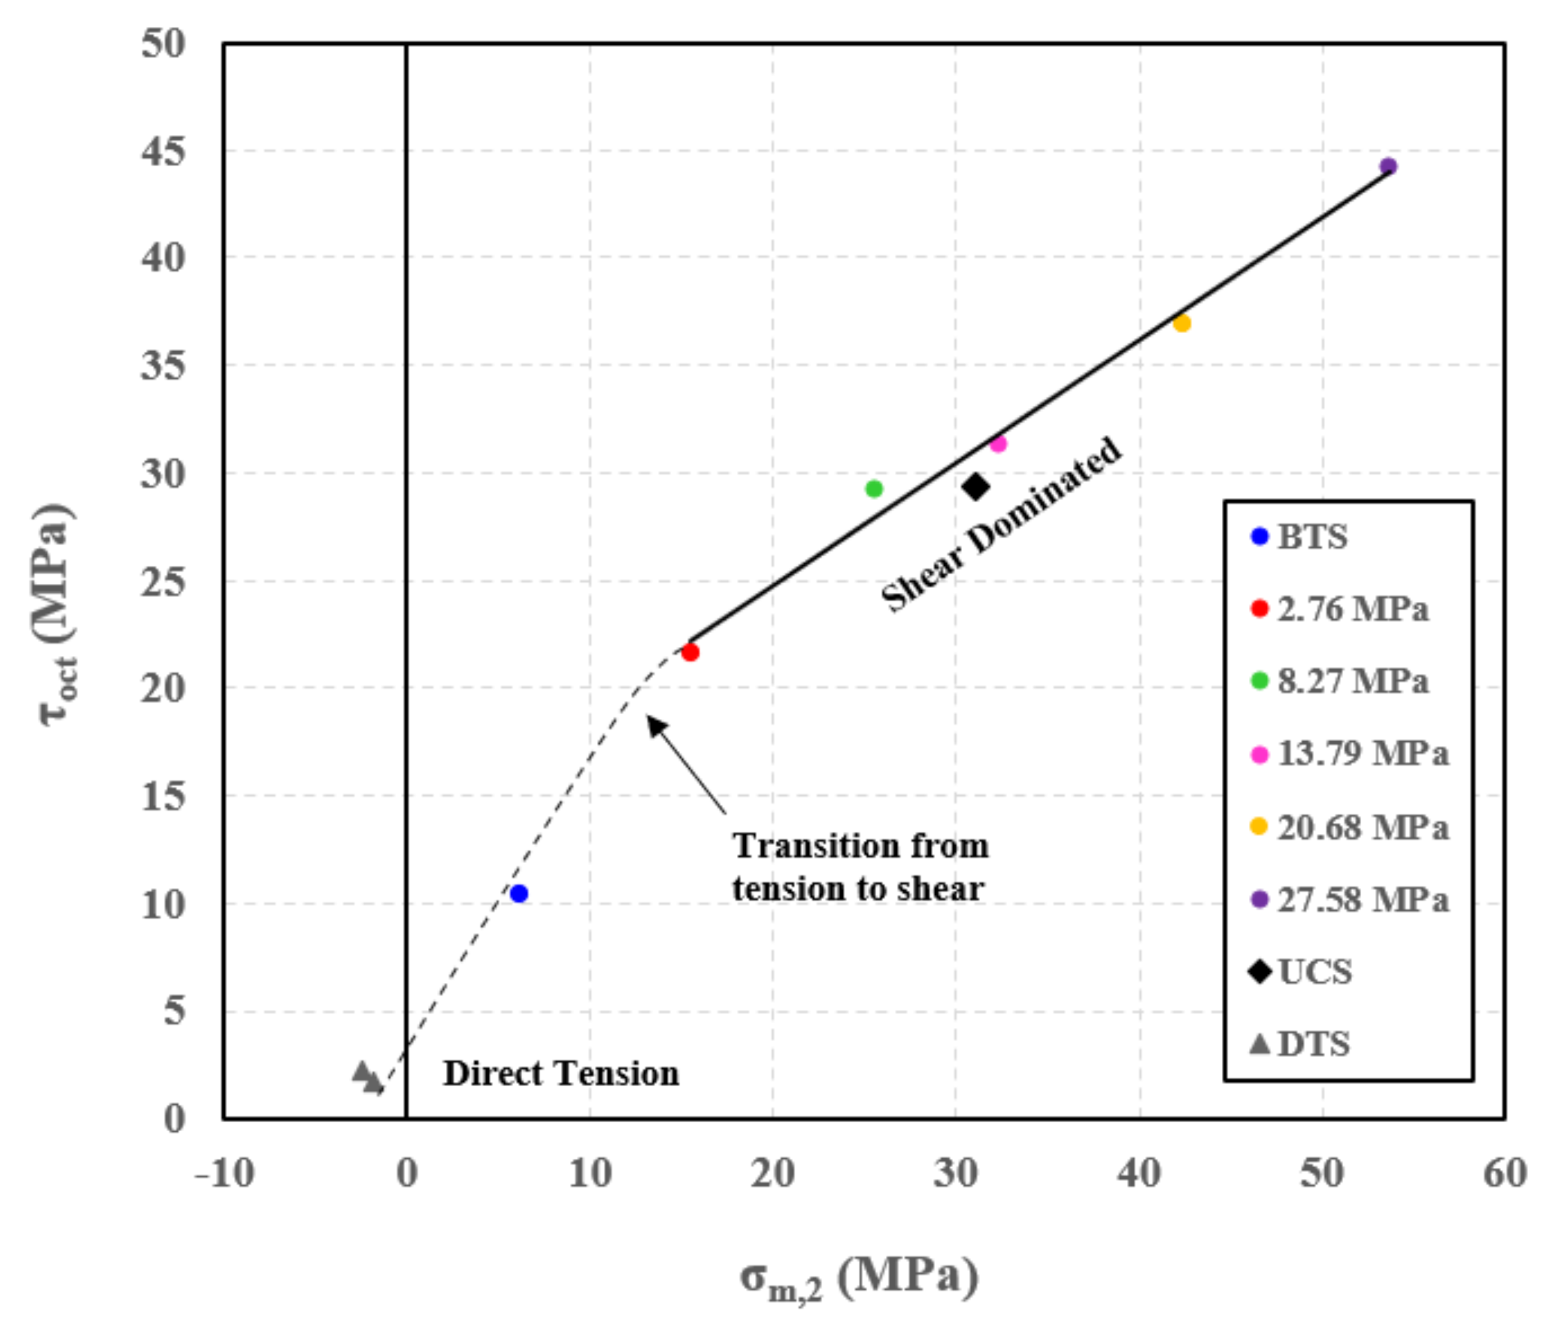
The Mogi–Coulomb criterion is typically represented as a straight line in terms of the octahedral shear stress and mean normal stress. The Mogi–Coulomb criterion is typically applied to failure under compressive stresses, and represents strength derived from frictional (shear) processes. The strength data from the confined Brazilian tests are given in terms of these stresses in Figure 8, and are found to fit to the straight line:
τ oct = 13.354 + 0.571 σ m , 2
where R2 is 0.9902. This good fit to the Mogi–Coulomb criterion suggests frictional processes are largely controlling strength in much of the confined tension region as suggested by Lan [3]. In addition, the unconfined compressive strength data are fit well by this straight line, suggesting that accounting for the intermediate principal stress reconciles strengths determined under different stress paths and stress conditions. The unconfined Brazilian strength data fall below the extrapolation of the straight line, consistent with the strength in this configuration having a greater dependence on tensile strength and less on frictional processes during crack initiation due to more open micro-flaws in the absence of confinement.
Additionally, included in the figure is the range of strengths expected from a direct tensile test. The direct tensile strength (DTS) is expected to be related to the unconfined Brazilian tensile strength (BTS) by:
DTS = A × BTS
where A is a constant ranging from 0.6 to 0.8. From the analysis of many datasets, Perras and Diederichs [7], found A for sedimentary rocks as 0.69. Nicksiar and Martin [32] reported an average value of A to be 0.77 for all rock types. A line has been drawn that connects the DTS, BTS and straight-line portion of the failure surface defined by the Mogi–Coulomb criterion. Along this line, the failure mode transitions from pure tensile to progressively more frictional (shear).

3.2. Post-Failure Observations of Samples

Post-peak fracture surfaces were observed at the conclusion of every test. 18 of the 24 samples had a single fracture oriented in the direction of the diametric load. 6 of the 24 observed samples had wedges form near the flattened surface of the Brazilian disks. This behavior was observed for samples with a range of confining stresses. Jaeger and Hoskins [13] observed wedging in some confined Brazilian tests; they argued that extensional fracture near the center of the sample was the principal failure mechanism and that wedging was a secondary effect.
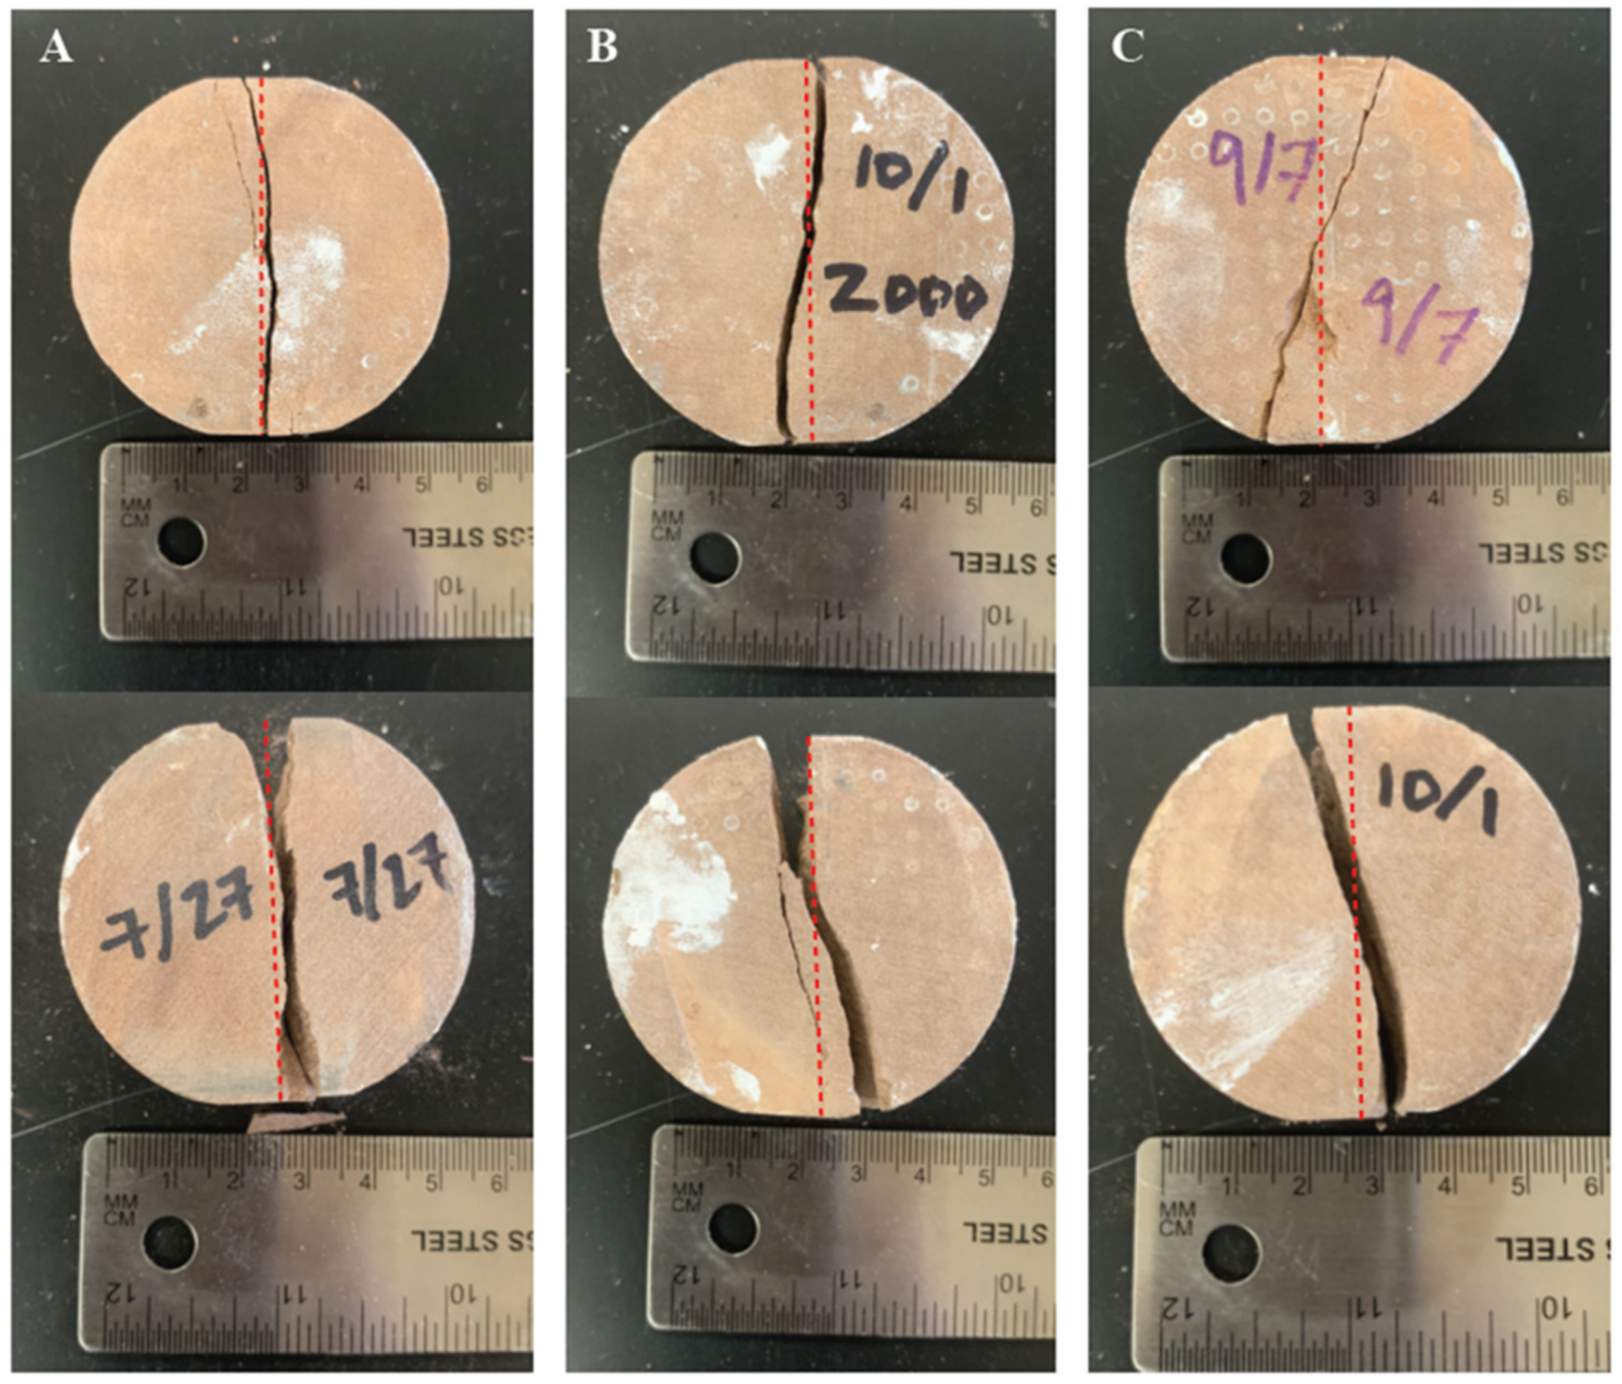
The typical fracture appeared as a single extension fracture oriented parallel to the direction of loading (Figure 9). However, at the highest confining pressures, the fractures were more likely to be oriented away from the direction of loading (Figure 9) as would be expected for shear dominated behavior. En echelon (stepped) patterns were observed in some samples tested at the greatest confining pressures, consistent with shear processes [33]. These fractures displayed surface textures with dulled features, indicating grinding of the fracture surfaces. This evidence indicates that failure is increasingly dominated by shear under higher confining pressures.

3.3. Numerical Results

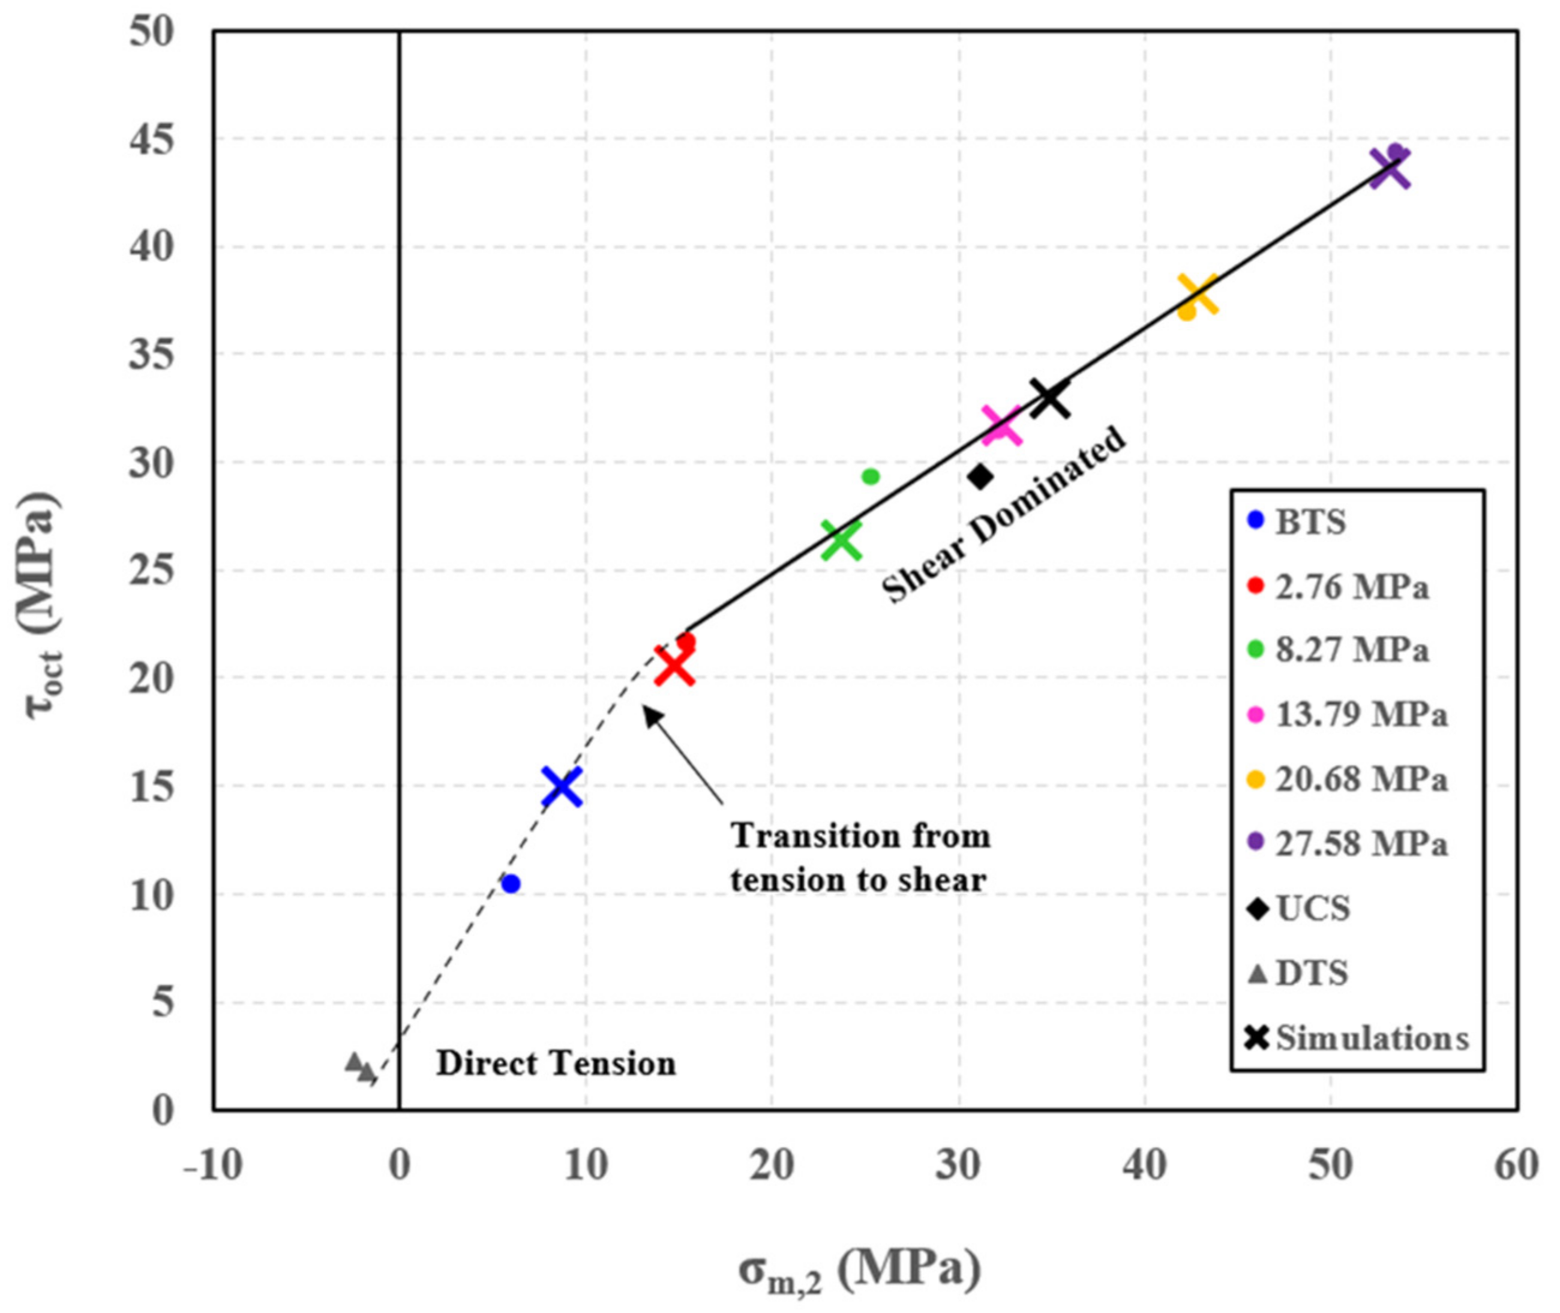
Six numerical simulations were performed to compare to the strength behavior seen in the experimental tests on the flattened Brazilian disks. Figure 10 compares the minimum and maximum principal stresses at failure for the experimental tests and numerical modeling. The simulation and experimental results are relatively similar in all instances except the unconfined Brazilian tests. The variation seen in the confined tests is consistent with the spread of data observed between different tests at the same confining pressures. However, the larger difference between the unconfined tests can perhaps be explained by Zhu [2], who found when comparing theoretical prediction and experimental data in the confined tension region that the predicted tensile strength was 30% greater than the experimental observations. This same behavior is observed in Figure 10, where the tensile strength from the simulation is approximately 31% greater than the average of the experimental results. This behavior may occur because microcracking in the unconfined tests initiates due to open microcracks, which is not described by the models. The modeling does not consider pre-existing micro-cracks within the rock; therefore, it does not account for different behavior due to open versus closed microcracks.
Notably, a similar curve to that seen in the experimental results is observed in the numerical results in which the confined Brazilian simulations show a linear curve but σ3 becomes less tensile in an unconfined Brazilian test. Additionally, the stresses at failure are depicted in Figure 11, compared to the Mogi–Coulomb failure criterion observed experimentally. The simulation results align closely with this failure criterion.

4. Conclusions

Confined Brazilian tests conducted on sandstone indicate that the strength measured with confined Brazilian tests was a strong function of the intermediate principal stress. Increasing the intermediate principal stress significantly increased the strength of the sandstone.
In σ1–σ3 stress space, the strength data from the confined Brazilian tests follow a straight line. This result suggests that the strength of the sandstone under the stress conditions of the confined Brazilian tests involve frictional processes. The strength data from the unconfined Brazilian tests do not fit the trend of the confined Brazilian test data in σ1–σ3 stress space, nor are they consistent with a simple tension cut-off. The uniaxial compressive strength is on the order of 30% lower than the biaxial compressive strength of the confined Brazilian tests.
All of the strength data were evaluated with respect to the Mogi–Coulomb strength criterion which, in contrast to most strength criteria for rocks, explicitly accounts for the role of the intermediate principal stress. The Mogi–Coulomb criterion represents strength derived from largely frictional processes. In this stress space, the confined Brazilian data and the uniaxial compressive strength were well represented by a straight line, suggesting that accounting for the intermediate principal stress reconciles strengths determined under different stress paths and stress conditions. The unconfined Brazilian strength data falls below the straight line, suggesting that tensile processes are increasingly controlling the strength in this test. Observation of post-failure fracture surfaces reveal that samples tend to show more indication of shear processes with increasing confining stress, namely, fracture surfaces tend to be ground down. For the sandstone tested here, additional confined Brazilian tests under confining pressures between 0 (unconfined) and 2.76 MPa would be helpful to better describe the transition from tension to shear dominated strength. For other rock types, the confined Brazilian test can be used to determine the failure behavior in the confined tension region and provide insight into the transition between tensile and shear failure processes.
The numerical models consistently replicated the strength and failure behavior of the confined Brazilian tests, demonstrating the ability of HOSS to reasonably capture trends and behaviors in the confined tension stress space. The Mogi–Coulomb criterion also is well fit to the unconfined Brazilian and UCS simulations, suggesting that numerical calculations reflect the transition from tensile to frictional processes driving failure in the confined tension region.
For applications where rock may be subjected to confined tension conditions, the results herein suggest that the failure criterion used should account for the intermediate principal stress. Numerical methods should be evaluated to ensure the predicted strength in the confined tension region reflects the role of the intermediate principal stress.

Author Contributions

Conceptualization, J.C.S. and M.R.T.; methodology, J.C.S.; software, T.H., E.R., E.E.K.; validation, T.H., E.R., E.E.K.; formal analysis, T.H.; investigation, T.H.; resources, M.R.T., J.C.S.; data curation, T.H.; writing—original draft preparation, T.H.; writing—review and editing, T.H., M.R.T., E.R., E.E.K., J.C.S.; visualization, T.H.; supervision, J.C.S.; project administration, J.C.S.; funding acquisition, J.C.S., M.R.T., E.R., E.E.K. All authors have read and agreed to the published version of the manuscript.

Funding

This research was funded by New Mexico Consortium and Los Alamos National Laboratory, LA-UR-20-30383.

Institutional Review Board Statement

Not applicable.

Informed Consent Statement

Not applicable.

Data Availability Statement

Data are available upon request from the corresponding author.

Conflicts of Interest

The authors declare no conflict of interest. The funders had no role in the design of the study; in the collection, analyses, or interpretation of data; in the writing of the manuscript, or in the decision to publish the results.

References

  1. Ramsey, J.M.; Chester, F.M. Hybrid Fracture and the Transition from Extension Fracture to Shear Fracture. Nature 2004, 428, 63–66. [Google Scholar] [CrossRef]
  2. Zhu, Q.Z. A New Rock Strength Criterion from Microcracking Mechanisms Which Provides Theoretical Evidence of Hybrid Failure. Rock Mech. Rock Eng. 2017, 50, 341–352. [Google Scholar] [CrossRef] [Green Version]
  3. Lan, H. Universal Confined Tensile Strength of Intact Rock. Sci. Rep. 2019, 9, 1–9. [Google Scholar] [CrossRef] [PubMed]
  4. Patel, S.; Martin, C.D. Application of Flattened Brazilian Test to Investigate Rocks Under Confined Extension. Rock Mech. Rock Eng. 2018, 51, 3719–3736. [Google Scholar] [CrossRef]
  5. Phueakphum, D.; Fuenkajorn, K.; Walsri, C. Effects of intermediate principal stress on tensile strength of rocks. Int. J. Fract. 2013, 181, 163–175. [Google Scholar] [CrossRef]
  6. Hoek, E.; Martin, C.D. Fracture Initiation and Propagation in Intact Rock—A Review. J. Rock Mech. Geotech. Eng. 2014, 6, 287–300. [Google Scholar] [CrossRef] [Green Version]
  7. Perras, M.A.; Diederichs, M.S. A Review of the Tensile Strength of Rock: Concepts and Testing. Geotech. Geol. Eng. 2014, 32, 525–546. [Google Scholar] [CrossRef]
  8. Hoek, E.; Brown, E. Empirical Strength Criterion for Rock Masses. J. Geotech. Eng. Div. 1980, 106, 1013–1035. [Google Scholar] [CrossRef]
  9. Labuz, J.F.; Zeng, F.; Makhnenko, R.; Li, Y. Brittle Failure of Rock: A Review and General Linear Criterion. J. Struct. Geol. 2018, 112, 7–28. [Google Scholar] [CrossRef]
  10. Bobich, J. Experimental Analysis of the Extension to Shear Fracture Transition in Berea Sandstone. Master’s Thesis, Texas A&M University, College Station, TX, USA, 2005. [Google Scholar]
  11. Brace, W.F. Brittle Failure of Rock. In State of Stress in the Earth’s Crust, 1st ed.; Judd, W.R., Ed.; Elsevier: New York, NY, USA, 1964; pp. 111–180. [Google Scholar]
  12. Mogi, K. Effect of the Intermediate Principal Stress on Rock Failure. J. Geophys. Res. 1967, 72, 5117–5131. [Google Scholar] [CrossRef]
  13. Jaeger, J.C.; Hoskins, E.R. Rock Failure under the Confined Brazilian Test. J. Geophys. Res. 1966, 71, 2651–2659. [Google Scholar] [CrossRef]
  14. Yawei, L.; Ghassemi, A. Rock Failure Behavior and Brittleness under the Confined Brazilian Test. In 52nd U.S. Rock Mechanics/Geomechanics Symposium; American Rock Mechanics Association: Seattle, WA, USA, 2018. [Google Scholar]
  15. Boyce, S.H.; Rougier, E.; Knight, E.E.; Reda Taha, M.M.; Stormont, J.C. Experimental Study correlating damage and permeability in concrete using confined, flattened Brazilian disks. Int. J. Damage Mech. 2021. [Google Scholar] [CrossRef]
  16. ASTM D2938. Standard Test Method for Unconfined Compressive Strength of Intact Rock Core Specimens; ASTM International: West Conshohocken, PA, USA, 2010; Available online: www.astm.org (accessed on 7 October 2020).
  17. ASTM D3967. Standard Test Method for Splitting Tensile Strength of Intact Rock Core Specimens; ASTM International: West Conshohocken, PA, USA, 2010; Available online: www.astm.org (accessed on 6 July 2020).
  18. Wang, Q.Z.; Jia, X.M.; Kou, S.Q.; Zhang, Z.X.; Lindqvist, P.A. The Flattened Brazilian Disc Specimen Used for Testing Elastic Modulus, Tensile Strength and Fracture Toughness of Brittle Rocks: Analytical and Numerical Results. Int. J. Rock Mech. Min. Sci. 2004, 41, 245–253. [Google Scholar] [CrossRef]
  19. ASTM C496. Standard Test Method for Splitting Tensile Strength of Cylindrical Concrete Specimens; ASTM International: West Conshohocken, PA, USA, 2010; Available online: www.astm.org (accessed on 6 July 2020).
  20. Hondros, G. The Evaluation of Poisson’s Ratio and the Modulus of Materials of a Low Tensile Resistance by the Brazilian (Indirect Tensile) Test with Particular Reference to Concrete. Aust. J. Appl. Sci. 1959, 10, 243–268. [Google Scholar]
  21. Knight, E.E.; Rougier, E.; Lei, Z.; Euser, B.; Chau, S.H.; Boyce, S.H.; Gao, K.; Okubo, K.; Froment, M. HOSS: An Implementation of the Combined Finite-Discrete Element Method. Comput. Part. Mech. 2020, 7, 765–787. [Google Scholar] [CrossRef]
  22. Munjiza, A. The Combined Finite-Discrete Element Method; John Wiley and Sons: Chichester, UK, 2004. [Google Scholar]
  23. Munjiza, A.; Knight, E.E.; Rougier, E. Computational Mechanics of Discontinua, 1st ed.; John Wiley and Sons: Chichester, UK, 2012. [Google Scholar]
  24. Munjiza, A.; Rougier, E.; Knight, E.E. Large Strain Finite Element Method: A Practical Course, 1st ed.; John Wiley and Sons: Chichester, UK, 2015. [Google Scholar]
  25. Rougier, E.; Knight, E.E.; Broome, S.T.; Sussman, A.J.; Munjiza, A. Validation of a Three-Dimensional Finite-Discrete Element Method Using Experimental Results of the Split Hopkinson Pressure Bar Test. Int. J. Rock Mech. Min. Sci. 2014, 70, 101–108. [Google Scholar] [CrossRef]
  26. Euser, B.; Rougier, E.; Lei, Z.; Knight, E.E.; Frash, L.; Carey, J.W.; Viswanathan, H.; Munjiza, A. Simulation of Fracture Coalescence in Granite via the Combined Finite-Discrete Element Method. Rock Mech. Rock Eng. 2019, 52, 3213–3227. [Google Scholar] [CrossRef] [Green Version]
  27. Chau, V.; Rougier, E.; Lei, Z.; Knight, E.E.; Gao, K.; Hunter, A.; Srinivasan, G.; Viswanathan, H. Numerical Analysis of Flyer Plate Experiments in Granite via the Combined Finite-Discrete Element Method. Comput. Part. Mech. 2020, 7, 1005–1016. [Google Scholar] [CrossRef]
  28. Boyce, S.H.; Lei, Z.; Euser, B.; Knight, E.E.; Rougier, E.; Stormont, J.C.; Reda Taha, M.M. Simulation of Mixed-Mode Fracture Using the Combined Finite-Discrete Element Method. Comput. Part. Mech. 2020, 7, 1047–1055. [Google Scholar] [CrossRef]
  29. Erarslan, N.; Williams, D.J. Experimental, Numerical and Analytical Studies on Tensile Strength of Rocks. Int. J. Rock Mech. Min. Sci. 2012, 49, 21–30. [Google Scholar] [CrossRef]
  30. Song, Z.; Li, M.; Yin, G.; Ranjith, P.; Zhang, D.; Liu, C. Effect of Intermediate Principal Stress on the Strength, Deformation, and Permeability of Sandstone. Energies 2018, 11, 2694. [Google Scholar] [CrossRef] [Green Version]
  31. Singh, A.; Rao, K.S.; Ayothiraman, R. An Analytical Solution to Wellbore Stability Using Mogi-Coulomb Failure Criterion. J. Rock Mech. Geotech. Eng. 2019, 11, 1211–1230. [Google Scholar] [CrossRef]
  32. Nicksiar, M. Crack Initiation Stress in Low Porosity Crystalline and Sedimentary Rocks. Eng. Geol. 2013, 154, 64–76. [Google Scholar] [CrossRef]
  33. Kranz, R.L. Crack growth and development during creep of Barre granite. Int. J. Rock Mech. Min. Sci. 1979, 16, 23–35. [Google Scholar] [CrossRef]
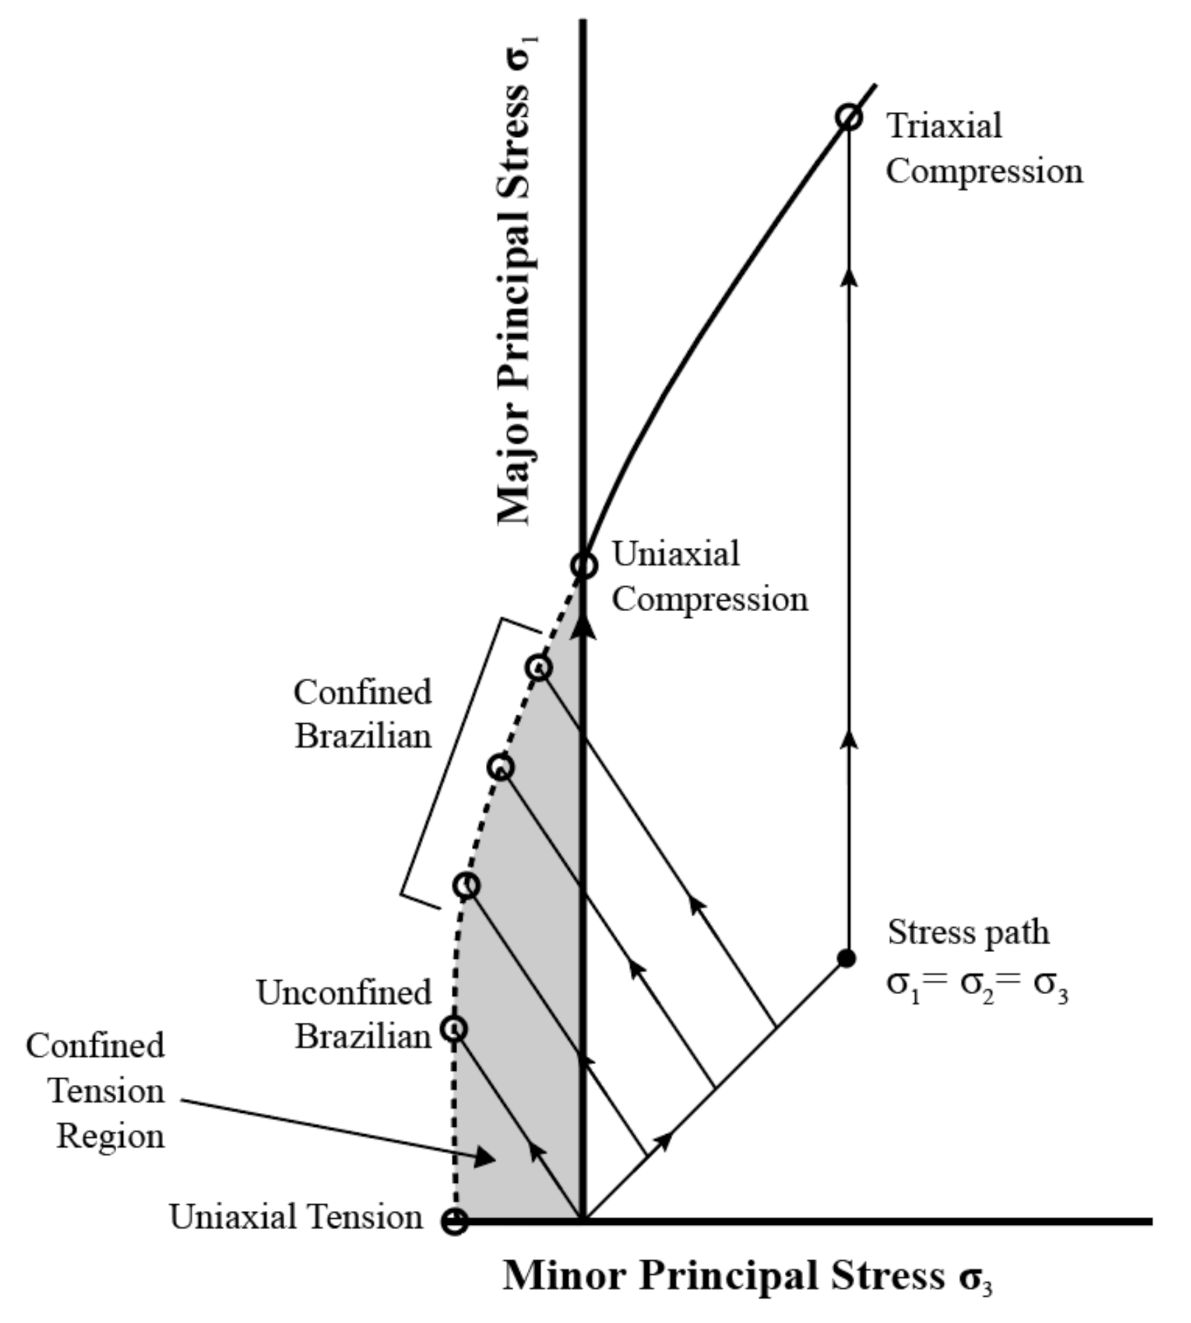
Figure 1. Failure curve in principal stress (σ1–σ3) space. The confined tension region is shown as a shaded area. The stress paths of different strength tests are shown, including the stress path followed by 3 confined Brazilian tests conducted under 3 different confining stresses. Figure modified from Patel and Martin [4].
Applsci 11 02285 g001
Figure 2. Strength data for (a) Berea Sandstone [10] and (b) Carrara Marble [1]. Results include confined extension tests, as well as direct tension (DTS), uniaxial compression (UCS) and triaxial tests. The Hoek Brown failure criteria is shown for the confined extension tests, as well as the tension cut off. Modified from Hoek and Martin [6] and Patel and Martin [4].
Applsci 11 02285 g002
Figure 3. Schematic of the sample jacketing construction modified from Boyce [15].
Applsci 11 02285 g003
Figure 4. Geometric representation of (a) a confined Brazilian test and (b) a uniaxial compression test to be used in numerical computations.
Applsci 11 02285 g004
Figure 5. Minimum and maximum principal stresses at failure for a series of confined, flattened Brazilian disks on sandstone. Average values at each confining stress, including unconfined, are represented by an open point. Uniaxial compression strength (UCS) on the same sandstone is also shown. The dashed line represents the best fit failure curve.
Applsci 11 02285 g005
Figure 6. Intermediate and maximum principal stresses at failure for a series of confined, flattened Brazilian disks on sandstone. Average values at each confining stress, including unconfined, are represented by an open point. The dashed line represents the best fit failure curve.
Applsci 11 02285 g006
Figure 7. Intermediate and minimum principal stresses at failure for a series of confined, flattened Brazilian disks on sandstone. Average values at each confining stress, including unconfined, are represented by an open point. The dashed line represents the best fit failure curve.
Applsci 11 02285 g007
Figure 8. Failure curve represented in σm,2 vs. τoct stress space plotted with the average failure stresses at each confining pressure. Note the uniaxial compression failure is consistent with confined Brazilian failure data. The estimated direct tension strength (DTS) range is represented between triangle markers.
Applsci 11 02285 g008
Figure 9. The fracture pattern differences due to confining pressure. Column (A) failed under a confining pressure of 2.76 MPa (sample A-8 and A-7), Column (B) at 13.79 MPa (sample A-19 and A-17), and Column (C) failed at 27.58 MPa (sample A-23 and A-24).
Applsci 11 02285 g009
Figure 10. Minimum and maximum principal stresses at failure for the experimental tests and numerical models. Each of the six simulations are represented with X symbols.
Applsci 11 02285 g010
Figure 11. Failure curve represented in σm,2 vs. τoct stress space plotted with the average failure stresses at each confining pressure. Each of the six simulations are represented with X symbols.
Applsci 11 02285 g011
Table 1. Sandstone Material Properties used in HOSS Simulations.
Young’s ModulusE (GPa)2.74
Poisson’s Ratioν0.20
Densityρ (kg/m3)2483
Tensile Strengthσ (MPa)4.69
Shear Strengthτ (MPa)30.0
Friction Coefficient: Sandstone/SandstoneµI0.57
Friction Coefficient: Sandstone/SteelµII0.60
Maximum Normal and Shear DisplacementsδI, δII (mm)0.036, 0.028
Table 2. Steel Material Properties used in HOSS Simulations.
Young’s ModulusE (GPa)200
Poisson’s Ratioν0.30
Densityρ (kg/m3)8050
Publisher’s Note: MDPI stays neutral with regard to jurisdictional claims in published maps and institutional affiliations.