2. Materials and Methods
2.1. Brief Description of the Gamma-Ray Geophysical Prospecting Method
Gamma-ray prospecting—is a radiometric survey, based on measurement of natural radioactive background of rocks and ores, or radioactive contamination. Natural earth material radioactivity is caused by the presence of radioactive elements of uranium, thorium, and potassium–40 unstable isotopes. Mineral radioactivity is characterized by the activity—the number of decays per unit of time. The greater the mass fraction of radioactive elements, the greater the activity per unit mass. Thus, the total gamma radiation intensity, which is proportional to the activity, can determine the presence and estimate the content of radioactive elements in rocks. Analyzing the radiation spectral characteristics (energy spectrum), it is possible to determine the content of each of the radionuclides separately. The radioactive elements content in the composition of subsurface rocks varies very widely. Pyrogenetic minerals are characterized by the highest radioactivity, the lowest radioactivity is in sedimentary rocks, and metamorphics are intermediate. However, this is only a general rule, for example, sedimentary terrigenous sand-clay rocks well sorb thorium and uranium, and therefore can be very radioactive.
A gamma-ray survey is an effective and fairly versatile geophysical method. In geological tasks, it is used to prospect for deposits of radioactive ores; precious and basic metals, paragenetically associated with radioactive elements; hydrocarbons; and, most importantly, in geological mapping. In the radioecological version, it is used to create maps of area radiation pollution.
According to the registration methods, there is a distinction between a gamma-ray survey for general radiation using radiometers and a spectrometric survey with spectrometers, when the radiation is recorded in the optimal parts of the spectrum of the determined elements. Unlike other methods of geophysical survey, gamma-ray measurements are probabilistic, since this is the nature of radioactive decay. It is possible to increase the efficiency of gamma radiation detection when using scintillation detectors (which are the subject of this article) by increasing their size so that a larger detector receives a larger number of gamma quanta per unit of time.
Traditionally, gamma-surveys were carried out in pedestrian, aero, and auto variants. At the same time, various radiometric equipment corresponding to the measurement method was used. In the pedestrian version, the survey is usually carried out on a regular grid of profiles and pickets, and both radiometric and spectrometric measurements are performed with the operator stopping at the points. This makes it possible to perform spectrometric measurements for several minutes or even tens of minutes, which allows the use of small-sized scintillation detectors since increasing the exposure time allows to accumulate a representative gamma spectrum. Aerogamma with the representation of the data obtained are considered the most perfect because when you remove the detector from the Earth the fixed gamma radiation is not in a single point (in fact a few kilograms of the soil or rock), but the average radiation with a certain square. At the same time, gamma radiation is absorbed by matter, including air, and its intensity quickly decreases with altitude, so due to the need for a set of statistically correct data volumes and high flight speeds of conventional aircraft, traditional aerogamma spectrometers often have several detection units with a volume of tens or even hundreds of liters. A new variant, UAV surveys, makes it impossible to effectively carry out according to classical methods, and therefore it is necessary to develop new survey methods and equipment that fully implements the advantages of UAVs. A variant of such a solution, all its main technical and methodological positions, is described in this article.
2.2. Unmanned Aerial Vehicle (UAV) and Scintillation Detectors
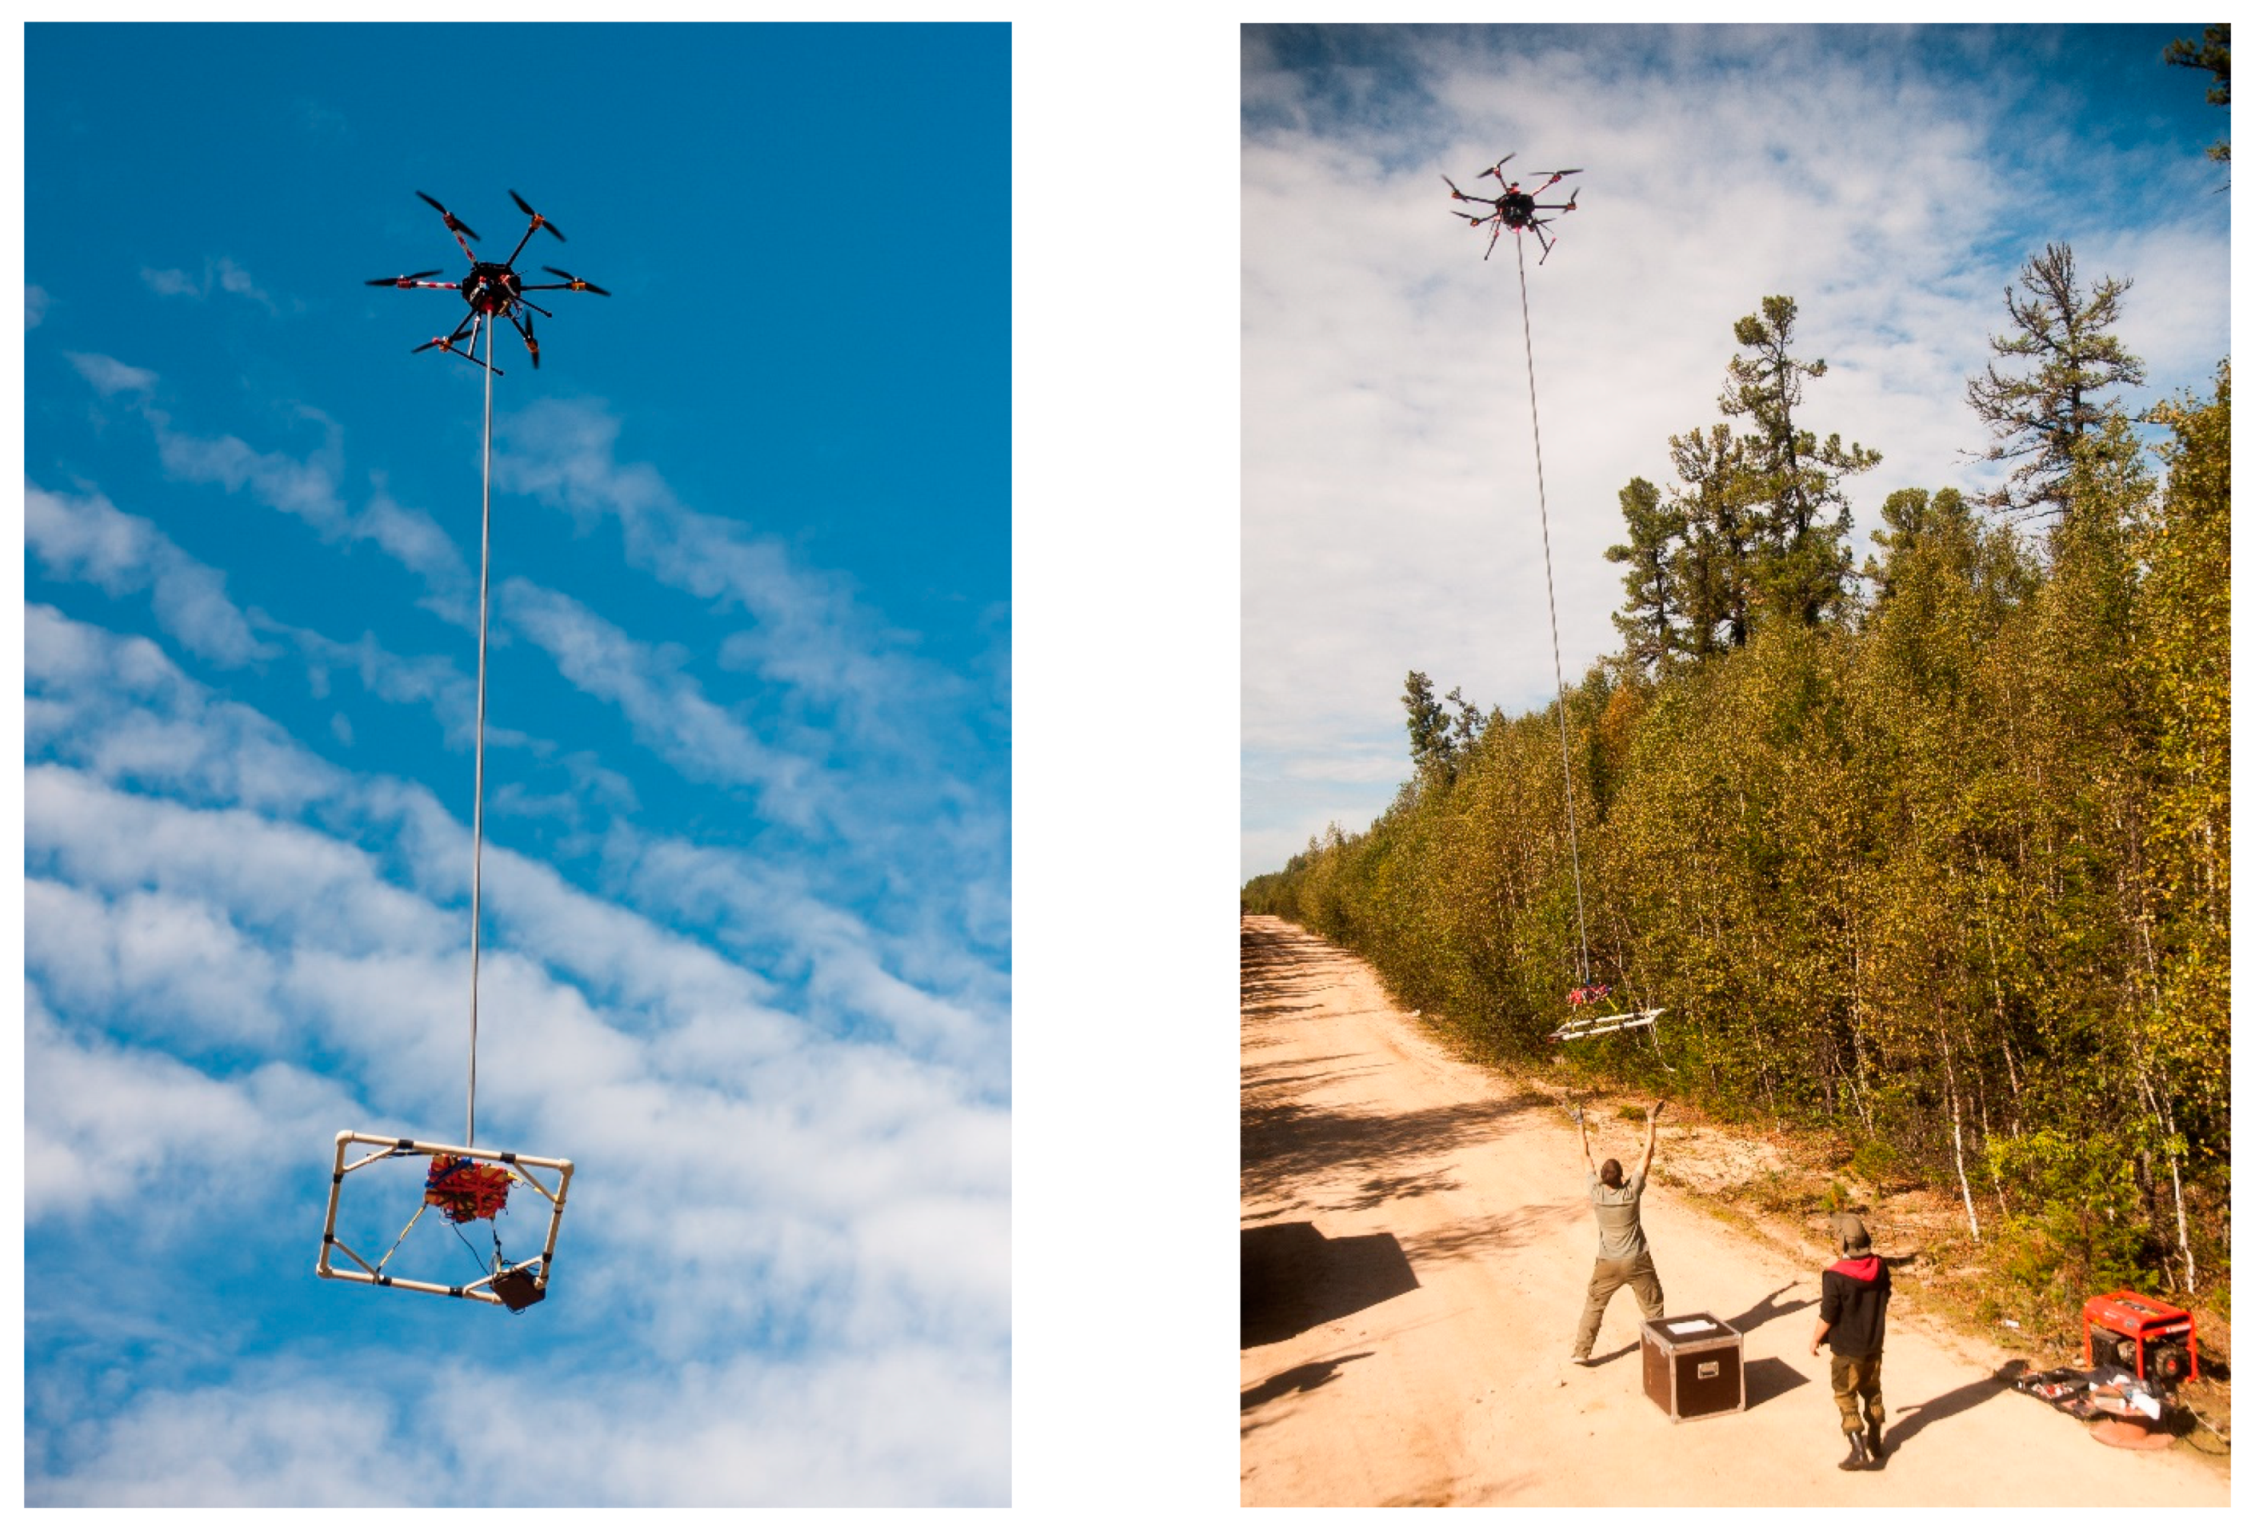
The experimental surveys conducted include a comparative analysis of the results of UAV gamma surveys with small scintillation detectors on the ground and at several altitudes. Studies were carried out with serial and self-developed prototype equipment in radiometric and spectrometric modes. The SibGIS UAS unmanned system with a multi-rotor carrier (
Figure 1) was used for the UAV gamma survey. This option provides geophysical surveys with an accurate terrain trapping. The UAV is a hexacopter with a 1-metre frame diagonal, and is equipped with a real time kinematics (RTK) system and a laser altimeter that supports a series of reflections. With a 28 Ah battery and an optimal 2–2.5 kg payload, this UAV can carry out a geophysical survey in medium-mountain terrain conditions, during not less than 40 min. This carrier is designed specifically for geophysical surveys in severe conditions of geological expeditions; its maximum payload is significantly higher than that of conventional serial UAVs such as DJI S1000 or Matrice 600; it is more durable and optimized to reduce electromagnetic interference to geophysical sensors. Maximum load capacity reaches 7 kg (the weight of the sensor for time-domain airborne electromagnetic survey (TDEM) figure in
Section 4 of this article).
The radiometric equipment used in this work included:
The following equipment was used as payloads for the unmanned system:
- 2.
A radiometer with a CsI(Tl) 8 × 8 × 100 mm (volume 6.5 cm3) crystal with a silicon photoelectron multiplier (SiPM). The measurement frequency was 0.5 Hz. The device’s weight was less than 70 g (hereunder this sensor will be referred to as a ‘lightweight’ or ‘small radiometer’).
- 3.
A spectrometer with a CsI(Na) 30 × 150mm crystal and a Hamamatsu 6095 photomultiplier, the detector’s volume was about 100 cm3. The measurement frequency in the integral channel was 0.5 Hz. The gamma spectrum was recorded over 1024 channels with a configurable frequency range of 0.1–1 Hz. The weight of the device is 1 kg.
- 4.
A spectrometer with a CsI(Tl) crystal of 40 × 80 mm and SiPM, with a detector volume also of about 100 cm3. The measurement frequency in the integral channel was 0.5 Hz. The gamma spectrum was recorded over 1024 channels with a configurable frequency range of 0.1–1 Hz. The device’s weight was 0.75 kg.
Thus, the detectors used for spectrometric measurements have a volume of about 100 cm
3 (compared to those used in [
2,
5,
7,
12] that are 400 and 1000 cm
3 in volume). The detector used for radiometric measurements in the air has a volume 2 times smaller than a serial radiometer for pedestrian survey. However, it important to note that evaluating the measuring system’s efficiency and other characteristics only on the basis of the detector’s volume is not correct. The material from which the detector is made also needs to be considered. Our detectors’ scintillation material is CsI (thallium/sodium), while traditional devices for ground and aerogeophysical research, are usually equipped with detectors from NaI(Tl). Different scintillation materials have significantly different properties (
Table 1): compared to NaI, CsI scintillators are less brittle, denser (which allows for greater efficiency), less hygroscopic, and have more temperature stability. CsI(Tl)’s main disadvantage for geophysical field measurements equipment is the different wavelength at maximum emission from NaI, which makes it difficult to select suitable PMTs.
Figure 2 shows the resolution of the detectors used. They are noticeably higher.
The ideal scintillation material has not yet been found, so researchers use different detectors, depending on the tasks carried out and the survey and data processing methods. In the previously mentioned UAV systems, BGO detectors were used [
8], which had a high density but low energy resolution. Therefore this material is convenient for making compact and efficient detectors, but the spectra analysis possibilities in the low-energy range are quite limited; NaI [
2,
5,
9,
13]; CsI [
6,
12,
13]. In the case [
6,
13], only a 33 cm
3 detector was used, but the spectrometric survey was performed only at individual points due to long-term measurements. Thus, the radiometric system can have significantly different characteristics, but it should allow implementing a specific survey and data processing method. When choosing materials for the production of detection units for UAV systems, the following factors are priorities: availability (price and physical), durability, an energy resolution of at least 8%, temperature stability, non-hygroscopicity, density higher than NaI(Tl).
Even though, in theory, the energy resolution of CsI is several percent worse than that of NaI, resolution of the scintillation crystals used in these experiments was relatively high for low-cost equipment: 6.7% for Cs-137 for CsI(Na) 30 × 150 mm detector and 7.5% for CsI(Tl) 40 × 80 mm detector (
Figure 2). These values are not unique—CsI crystals are easy to produce, so we can usually choose a good crystal with high resolution.
It is important to note that the detectors used in this work have a mass inferior to 1 kg and are, thus, excessively light. Commercially available medium-sized production UAVs, such as the DJI S1000, can carry significantly larger detection units (thus more efficient). In fact, for real radiometric surveys, not one but two CsI(Tl) blocks of 8 × 8 × 100 mm [
15] are used, and for spectrometric measurements—spectrometers with CsI(Tl) crystals with a 63 × 63 mm [
16] and 80 × 80 mm [
12] crystal volume. In such cases, the payload weight will be 2.2 kg and 3.5 kg, twice and four times the mass, respectively. This is acceptable for the SibGIS UAS unmanned system. However, in order to write this article, the experimental conditions were specifically complicated compared to real practice—in doing so, the results will, arguably, be even more interesting. Also, as shown below, even with small detectors, a geologically significant result can be achieved.
2.3. Survey and Data Processing Methods
The main stages and features of the low-altitude radiometric and spectrometric survey technique used are described below.
To perform low-altitude geophysical surveys, it is necessary to have a sufficiently accurate digital model of the work site’s terrain. UAV flights will be operated at a constant altitude above terrain respecting the digital elevation model (DEM). The DEM can be obtained immediately before starting the UAV surveys by light detection and ranging (lidar) scanning or photogrammetry from the UAV or created in advance based on available satellite or topographic data. In this work, case 2 used a DEM with a pixel resolution of 1 m, obtained by photogrammetry, and in other cases used a DEM with a pixel resolution of 10 m, created with Intermap NEXTMap data. The digital terrain model must be accurate enough to avoid accidents and ensure accurate flow around the terrain. In the Russian Federation, there are requirements for the quality of DEMs used in UAV-magnetic surveys: the maximum vertical accuracy of DEMs should be no less than 10% of the relative height of the UAV above the terrain. For example, when surveying at the height of 50 m under the measuring system’s sensor, the permissible error of the DEM is +/−5 m according to the LE90 criterion. Other types of UAV-geophysical surveys do not yet have a regulatory framework, nonetheless, the same requirements for UAV gamma-ray studies were adhered to.
Before starting fieldwork, the energy scale of the spectrometers was calibrated. Calibration is performed traditionally through two energy channels, and several additional lines check its quality. For a properly functioning spectrometer, the calibration graph looks like a straight line (
Figure 3).
After the operators arrive at the take-off point, its altitude was determined, and flight missions were created for the UAV autopilot. It is an array of points “longitude-latitude-relative altitude.” Flight missions were created using the module for QGIS’ SibGIS Flight Planner’ (Parshin and Morozov 2017) based on the DEM. The height of the survey was selected, taking into account vegetation on the worksite.
The UAV and the spectrometer were brought into operation.
The flight mission was loaded into the UAV flight controller. The measuring system was started. Take-off and landing of the UAV were carried out in manual mode; the flight took place on autopilot. The geophysical measurements were made automatically, and the results were recorded in the recorder’s memory with the exact satellite time and coordinates. The radiometer measurement frequency was fixed at 0.5 Hz; the spectrometers had a configurable frequency from 1 Hz to 0.1 Hz; usually, the recording was conducted with a frequency of 0.5 or 0.33 Hz.
After the mission was completed, the UAV battery was replaced, and the actions of the previous paragraph were repeated.
At the end of a routine survey, one control route was usually made, which was necessary to assess the data’s quality. However, in this work, a control survey in the same volume as the ordinary survey was conducted, but in the opposite direction, to show no profile in the data caused by the detectors’ data inaccurate spatial reference or detectors’ shortcomings.
After the measurements were completed, the data were exported, processed, and mapped. The data processing technique applied had three key features.
Feature 1. Increasing the Statistical Representativeness of the Data by Processing Multiple Energy Lines. First, in geological practice, usually only one energy line for each isotope is used to study and map the distribution of U, Th, and K-40 radionuclides. For the uranium–radium series, the 1.76 MeV line is used, for thorium—2.62 MeV, for potassium—1.46 MeV. These lines are located in relatively high energies range and are easily distinguishable from the lines of other isotopes. It is easy to isolate them even for equipment with low energy resolution, such as old analogue spectrometers or modern BGO detectors. However, with an increase in gamma rays’ energy, the penetrating power of radiation also increases. Therefore, the registration of these lines by small detectors is difficult. Simultaneously, the uranium–radium and thorium series also include a relatively large set of energy lines of various radionuclides, some of which have even greater quantum yield than traditionally used isotopes (
Table 2). Some of them are located in lower energies range, i.e., they are effectively detected by scintillation detectors with a thickness of several centimetres. The additional counting of gamma rays along these lines, as shown in the next section, significantly increases the data’s statistical representativeness. However, low-energy lines decay faster with height, since air is also an absorbing layer. For example, for 0.609 MeV energy lines, the free path of a gamma-ray quantum (half attenuation) is 66 m, and for 1.76 MeV energy, it is already about 100 m. Also, at a low detectors’ resolution, their energy windows may overlap since the lines are quite close. In this regard, to process energy lines as 0.609 MeV, 1.12 MeV (uranium series), 0.91 (thorium series), detectors with an energy resolution of at least 8% are required, and the flight altitude must be minimized.
Thus, to partially compensate for the detector’s small sensitive volume, rather than three classical energy windows to process the gamma-ray survey data, six were used—one for potassium-40, two for thorium, and three for uranium.
Feature 2. Spectrometer Calibration Method. The second important position of this UAV aerogammaspectrometry technique is the spectrometers calibration method. To create cartographic materials that reflect the relative radionuclide concentrations distribution in the study area, to identify anomalies of low and high values at a constant relative flight altitude, it is enough to sum the number of gamma quanta along all energy lines related to each radionuclide.
However, to obtain maps of radionuclide concentrations for comparison with results of other works or a more accurate geological interpretation, it is necessary to find a matrix of coefficients linking the spectrometer’s specific count rate in each channel with the concentrations of radionuclides and taking into account the unequal height attenuation of each energy line.
Spectrometers used in ground-based surveys calibration are performed on standard samples, and the in-height field attenuation can be calculated analytically. Nevertheless, it is necessary to take into account the different geometry of the measurements additionally. A more straightforward method can be used: near the geological base of the Irkutsk National Research Technical University, a site of distribution of formation granites with a size of 150 × 150 m with relatively uniform chemical composition and good exposure was selected, and the site was studied to determine the real concentrations of the main radionuclides. It is known that an in air located spectrometer registers uranium, thorium and potassium gamma-rays from the underlying surface corresponding to the base of the cone, which has a vertex in the detector and an included angle of 120° (the radius of the base of the cone is referred to as the “effective radius”). Thus, the selected area allows the count’s relationship in the spectrometer channels with the radionuclides concentrations to be correctly established at altitudes up to 40–45 m since the effective radius reaches 70–80 m.
Feature 3. Large-Scale Survey and Anti-Aliasing Interpolation. When surveying with small detectors, the variance of the recorded values, especially at a low level of gamma background, is relatively high, even though more than one energy line is involved in the data processing. In this regard, there is a third, necessary factor that allows formation of robust cartographic representations that reflect the distribution of individual radionuclides in the studied area. It consists of overlapping the effective radii between adjacent survey profiles in combination with interpolation methods with a high smoothing coefficient and an interpolation radius similar to the effective radius. When surveying at a 45 m altitude, the effective radius reaches 80 m. In this case, when the distance between the surveying profiles is 25–50 m, data from 7–4 neighbouring routes enter the interpolation window. Using local polynomial interpolation (LPI) to construct geostatistical surfaces, which selects a smoothed surface for the data, high data noise is coped with. Simultaneously, as shown in the next section, all the main geological structures and the epicentres of the main anomalies remain in their places, and the results are reproducible.
When surveying is finished, the separate energy line counts in the channels of uranium, thorium, and potassium in the given time intervals are summed up. A layer with spatially linked measurement points is formed, including three attributes (the number of quanta in each radionuclide channel or their conversion to concentration, taking into account the coefficient matrix). Carrying out an LPI interpolation and forming a cartographic representation, allows the study of the integral radioactivity and the distribution of its components on the area. The integral channel can be represented in pulses per time unit or in gamma radiation dose rate units, taking into account gamma quanta with energies from 0.4 to 2.81 MeV.
3. Results of Experimental and Reeal Unmanned Aerial Vehicle (UAV)-Gamma Surveys with Small Detectors
This section presents the results of experimental work, proving the consistency of the hypothesis that it is possible to obtain high-quality radiometric and spectrometric data with very small scintillation detectors. The surveys (cases 1 and 2,
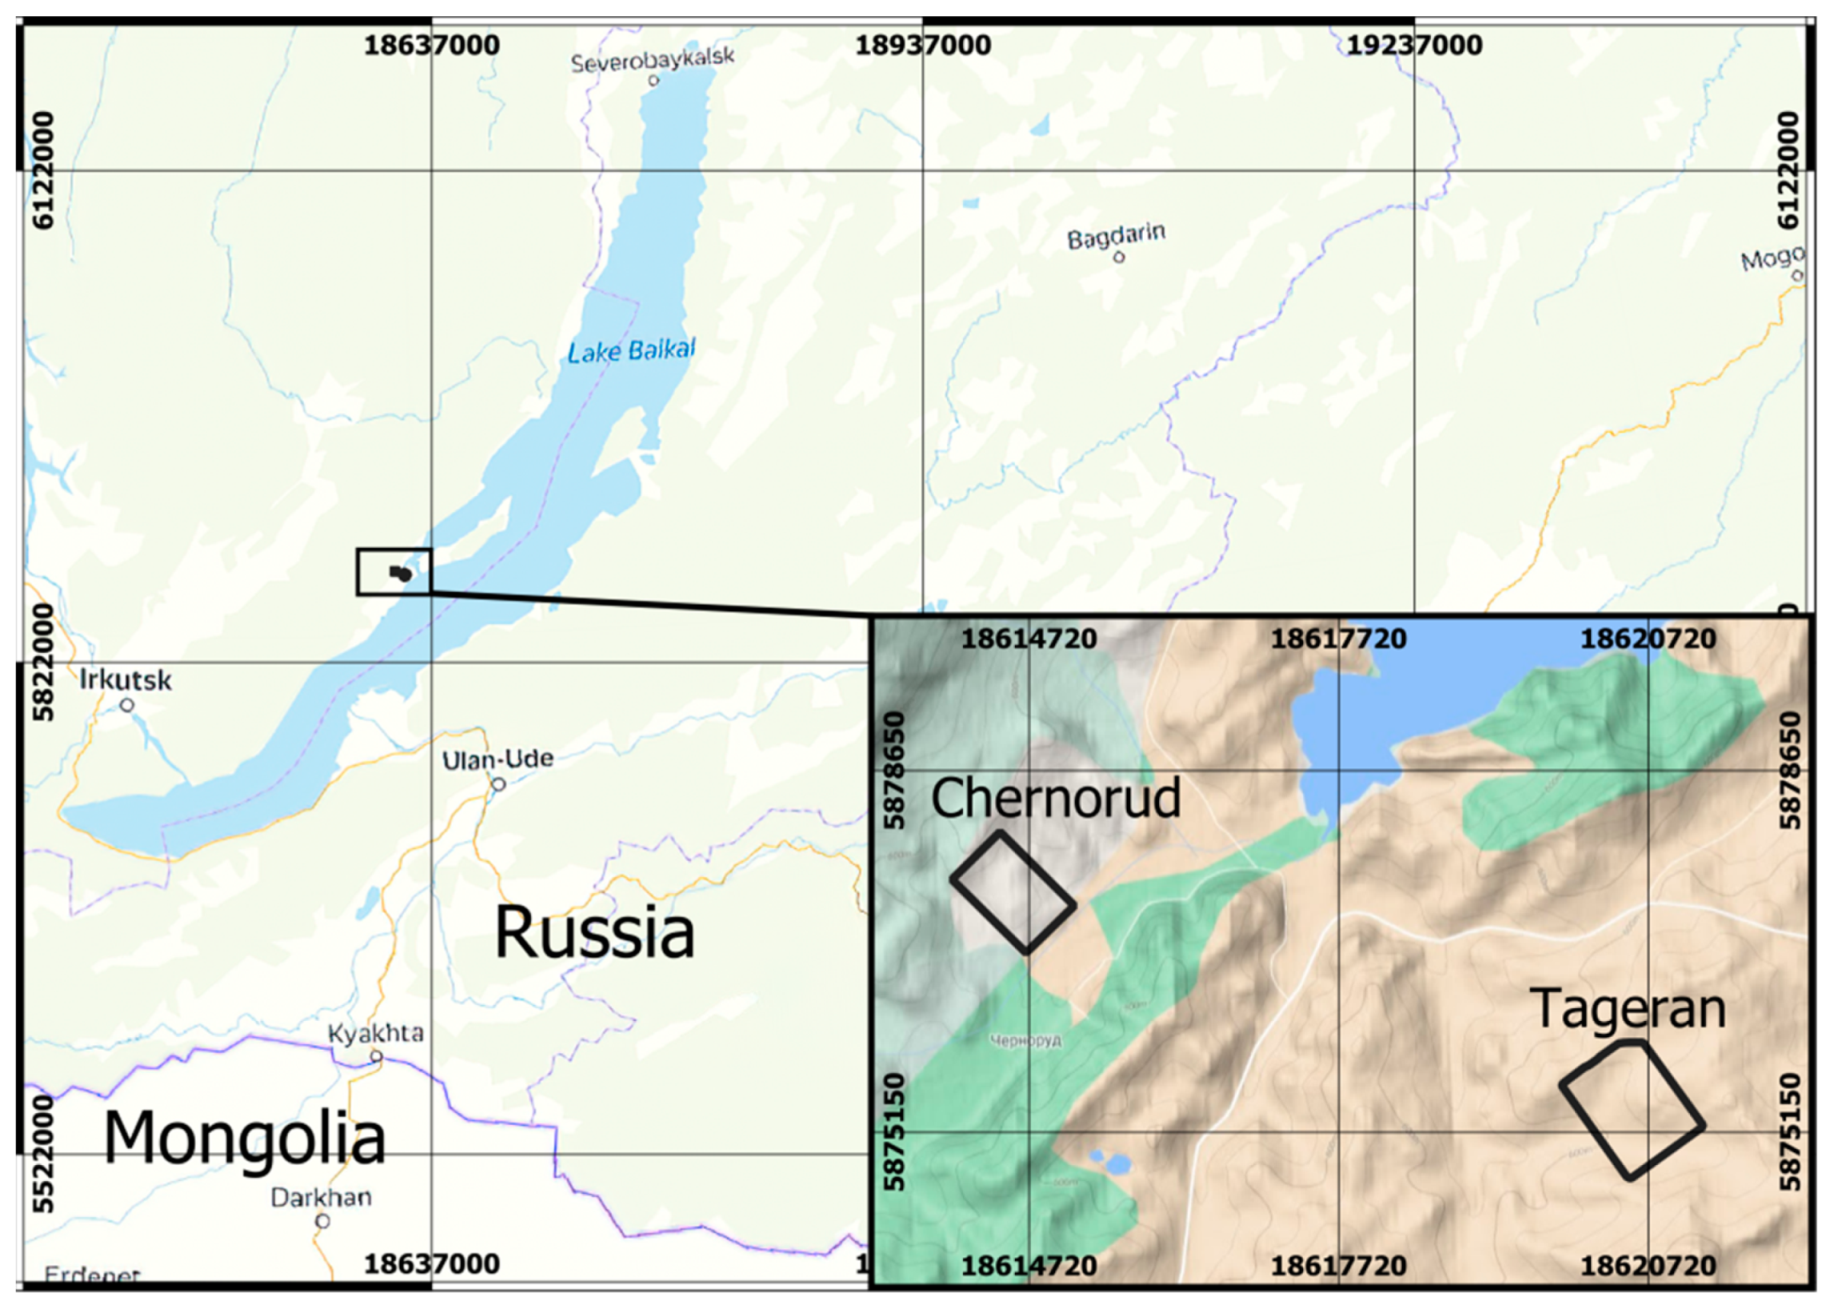
Figure 4) were carried out in the Baikal region (Siberia, Russian Federation) at two sites with different geological situations.
Case 1. Spectrometric Surveys with Small Scintillation Detectors
The Tageran site is located near the shore of Lake Baikal. The purpose of the experimental work on it was to study the quality of the data obtained from the results of low-altitude UAV spectrometry with small detectors. In order to confirm the sufficient quality of the survey, its results must be, first, structural, i.e., anomalous geological objects on the field maps can be distinguished and, secondly, they are reproducible, i.e., the main anomalies of low and high gamma background during ordinary and control surveys should not change their position, and maps created based on the results of ordinary and control surveys should have a high correlation. The attenuation of the gamma field with height was also studied.
The following types of research were carried out:
Terrestrial survey using the SRP-68 radiometer.
UAV gamma survey in radiometric mode with detector CsI 6.5 cm3. The survey was carried out twice along the same profiles, in the forward and opposite directions—in order to assess the convergence and reproducibility of the results. The quality of UAV and ground data was also compared.
UAV gamma survey in radiometric and spectrometric modes using a CsI 100 cm3 detector. The survey was carried out twice along the same profiles, in the forward and opposite directions, in order to assess the convergence and reproducibility of the results. The radiometric data with the data obtained by a smaller detector (previous item) was compared.
The survey was carried out at an altitude of 25 m, the distance between the survey profiles was also 25 m, the flight speed was 20 km/h (
Figure 5). The area of the site is about 1 km
2.
A geological map for this site (apart from the Russian state small-scale maps M1:200,000 and 1:000,000) was not available, however, its geological structure is quite simple and can be easily interpreted from the gamma survey data. The intensity of the gamma field of the site is low (in comparison with the regional background), the maximum values do not exceed 10 μR/h. The site is most likely formed by two complexes of rocks, the rocks in the central part of the site (visually metamorphised carbonates) are characterised by low radioactivity. Along the edges there are presumably highly metamorphosed granite-gneisses, their radioactivity is higher, but the contrast ratio of the anomalies is low—about 2–2.5. As can be seen from
Figure 6, granite gneisses are characterised by increased concentrations of all radionuclides (U, Th, K-40) in comparison with carbonate rocks. Such a situation, when various stratigraphic complexes are characterised by synchronously different contents of all radionuclides, is, unfortunately, typical of the promising areas for gold in Eastern Siberia, where UAV-geophysical methods were used. A more interesting case would be to study the gamma field in a situation where different anomalies are caused by different radionuclides, but accessible areas with a priori suitable geological conditions in the Irkutsk region are not known to us. In this situation, the maps of individual radionuclides should approximately coincide with the integral channel.
Figure 6a,b,d shows that despite the fact that the anomalies attenuate with height, when classifying the survey results by the quantile method, geological information is not lost. Even minor anomalies are geometrised and mapped correctly.
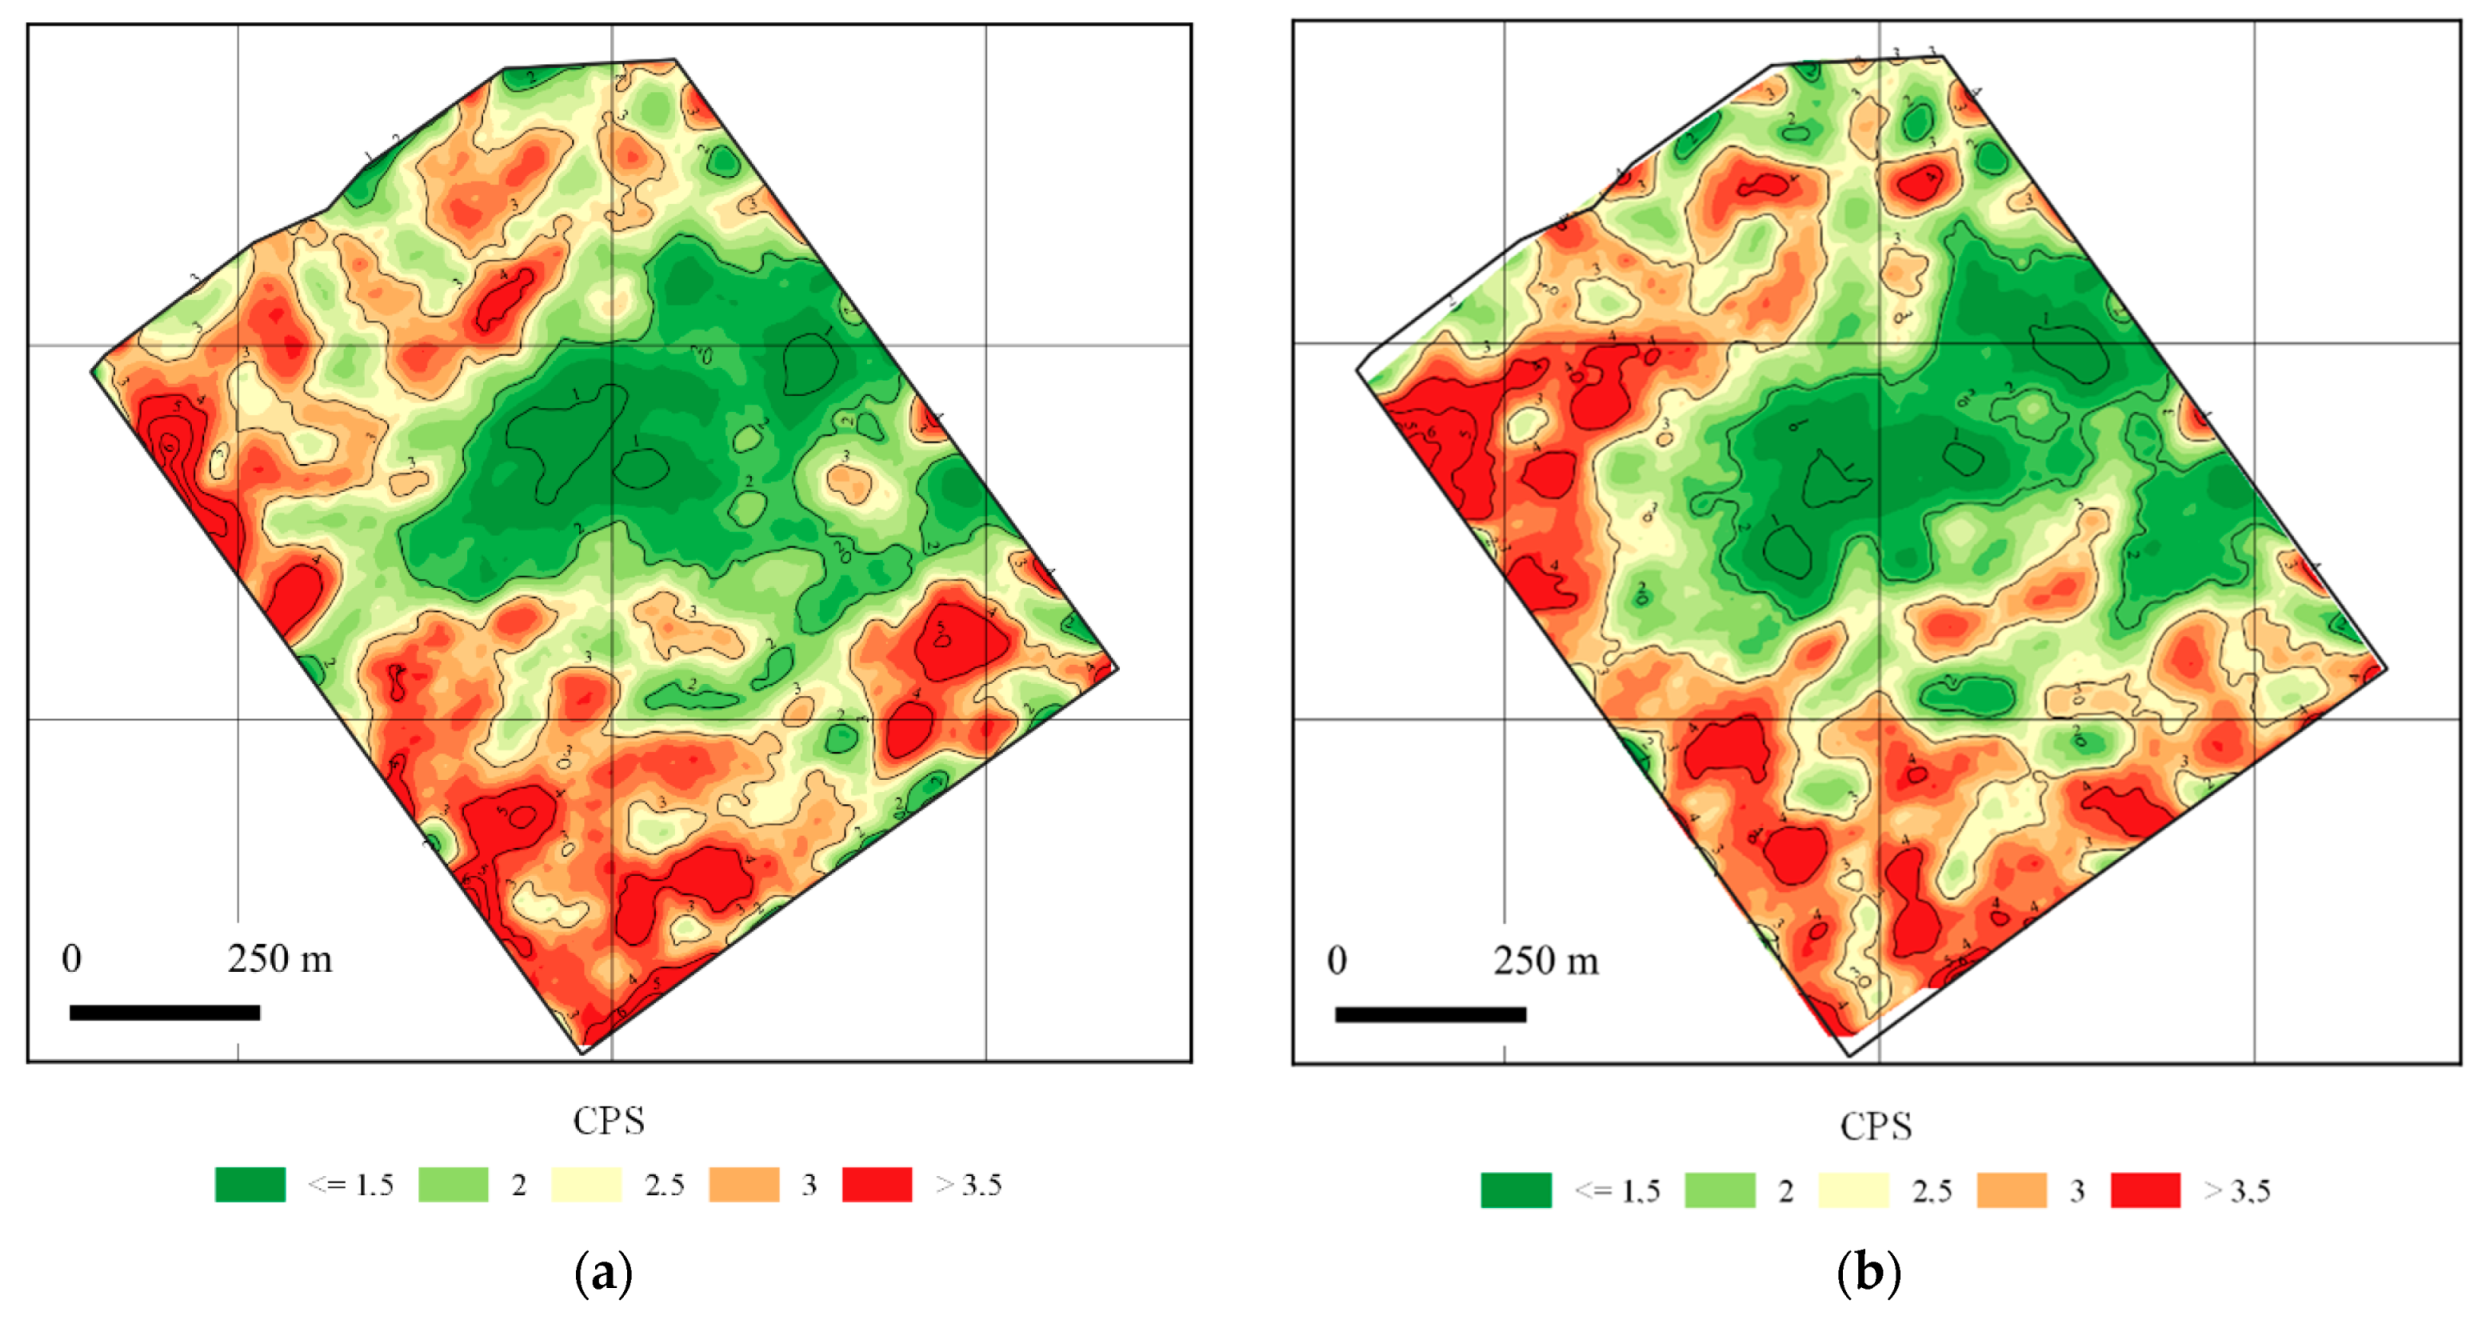
Figure 7 shows a comparison of radiometric data obtained with small (6.5) and large (100) detectors during flights in the forward and opposite directions.
As can be noted, the information content of radiometric surveys practically does not depend on the volume of the detector or on the direction of flight of the profiles. Geospatial resolution of maps made from the results of surveying with a large crystal is slightly higher, however, all the main anomalies are distinguishable. The same conclusion can be drawn from a comparison of
Figure 1a,b. As a result, it can be stated that in the radiometric mode a low-altitude survey with a 6.5 cm
3 CsI (Tl) detector is quite comparable with the terrestrial survey data performed by the NaI (Tl) 15 cc detector with stops. At best, approximately 40 linear km of gamma-radiometric surveys located on the site can be performed in pedestrian mode in 4 days, while the UAV survey, the area of which is larger, took only three hours, including time to replace batteries.
Are the maps of individual radionuclides of the same quality and stability? Looking at the maps of measurements in the potassium channel, only one energy line can be used (1.46 MeV) (
Figure 8). It can be seen that, despite the small number of gamma quanta registered by the detector, the main anomalies corresponding to the boundaries of geological structures are coincided. The area of decreased field values in the south-eastern part, and a small ‘bridge’ separating it from the main anomaly, as well as a very small anomaly of decreased values in the southern corner of the site, continue to be mapped. Between each other, the maps constructed from the results of direct and return flights have a fairly good convergence (
Table 3).
Regarding the measurement results corresponding to uranium radionuclides (
Figure 9), as mentioned in the Methods section, the classical version of field gamma spectrometry uses one energy line (1.76 MeV). In this case, the efficiency of a small scintillation detector is insufficient to register a statistically representative amount of data, two quants per second are recorded at best, and the geostatistical surface is absolutely unstructured (
Figure 9a). However, unlike potassium-40, the gamma spectrum of the uranium-radium series has more than one energy line (
Figure 9b), and lines with energies of 0.609 MeV and 1.12 MeV are additionally used for processing (
Section 2). The probability of effective detection of radiation along these lines with the use of a small-volume scintillation detector is much higher and, due to the low survey altitude, even the 0.609 MeV line has not yet decayed significantly. Using several energy windows, high-quality maps of uranium are obtained (the root mean square error (RMSE) according to the results of ordinary and control surveys does not exceed 12.5%,
Table 3), on which the previously noted local structural features of the site are clearly visible (
Figure 9c,d). Moreover, the resulting map is more detailed than the potassium-40 map, which is built along just one energy line.
Similarly to uranium, but using two lines 0.91 and 2.62 MeV, Thorium maps were created (
Figure 10). The statistical representativeness of the data and, accordingly, the quality of the surface are worse (RMSE ~24%). However, the main anomalies and geological boundaries are still mapped reliably, and the local ones are acceptable.
It is estimated that the root mean square errors of radiometric and spectrometric surveys as the difference between the values of the cells of the digital field models obtained from the results of ordinary and control (opposite direction) measurements, divided by the values of one of the field’s digital model (
Table 3).
Undoubtedly, the metrological characteristics in spectrometric modes achieved are inferior to large airborne gamma spectrometers for manned aircraft. However, this does not mean that the data obtained are not informative from a geological point of view. On the contrary, this case provides convincing evidence in favour of the practical applicability of low-altitude UAV aerial gamma surveys with small detectors using the described method. Unlike other geophysical fields, for example magnetic or gravity fields, radioactive decay and, accordingly, intensity of gamma field, have a probabilistic nature. For example, the margin of error for serial radiometric equipment is usually 15% (according to Ra-226). Therefore, in real geological prospecting tasks, there is no need to fight for ideal metrology, but it is necessary to analyse the resulting maps from the point of view of their correctness, stability and information content, which in this case is provided. Moreover, the data obtained are quantitative, and the radiometric data and the uranium channel are highly accurate. It should also be borne in mind that the experimental work was carried out in conditions of non-high radioactivity of rocks, the Bruker S1 Titan XRF analyser, which has detection limits for uranium and thorium from several grams per ton, could not determine the concentration of these radionuclides in the samples which were selected for spectrometry (
Figure 6c). For example, in geological situations of uranium ore regions, where the typical contrast of gamma background anomalies, even at a significantly higher altitude, exceeds 7 times [
9], compared to 2–2.5 as in this model area, the stability and information content of geostatistical surfaces will be much better. Unfortunately, in 2020, it was not possible to conduct experiments on reference deposits of this type, due to quarantine measures, or visiting the deposits was completely prohibited.
Case 2. Comparison of Terrestrial and Different-Altitude UAV-Radiometric Surveys with Scintillation Detectors of Various Volumes
On the second model site “Chernorud” (
Figure 4), located in the area of the educational geological site of the Irkutsk Technical University, a slightly different set of experiments was carried out, aimed at:
- -
comparing results of terrestrial radiometric surveys with UAV surveys at different altitudes;
- -
an empirical study of the gamma-field attenuation from small and not very contrasting objects with height;
- -
comparative assessment of the efficiency of scintillation detectors of various sizes in UAVs and ground-based versions.
This area has a more complex geological structure, it is composed of alternating rock packs of various composition, with a thickness from the first metres to the first hundreds of metres. Part of the area has an aerospace map [
14]
Figure 11, which cannot be trusted to the same extent as a ground map, but gives some indication of the stratigraphic subdivisions presented here. The rocks in the Olkhon region are generally highly metamorphosed and it is difficult to visually determine their genesis and composition. A priori, the granites of the Shebarta complex are the most radioactive rocks in this area, but their radioactivity is not too high, and the background reaches 10–12 μR/h on the outcrop surface. The model area contains thin layers of rocks of this stratigraphic unit. According to general concepts, anomalies from objects a few meters in size at an altitude of several tens of meters should have already smoothed out so much that detectors of small volume, such as 6.5 cm
3, cannot be used to map them, and this is of interest for research.
The map of the survey profiles on the site is shown in
Figure 11a. The distance between the profiles is 50 m, the flight speed is 20 km/h.
The composition and sequence of the studies performed were as follows:
First, a pedestrian gamma survey was carried out using an SRP-68 radiometer.
Then the same profiles were surveyed with a lightweight (6.5 cm3) radiometer, which allowed evaluating the effectiveness of a much smaller detector in terrestrial mode.
After that, a UAV radiometric survey was carried out with the same lightweight radiometer at two heights of 30 m and 60 m with terrain draping.
Finally, to remove uncertainty over the sufficiency of the efficiency of the lightweight radiometer for surveys at altitude and at a relatively high speed, a UAV survey was carried out with a CsI(Tl) spectrometer with a volume of 100 cm3, and an integrated (radiometric) channel map was made. This survey was carried out at altitude of 35 m.
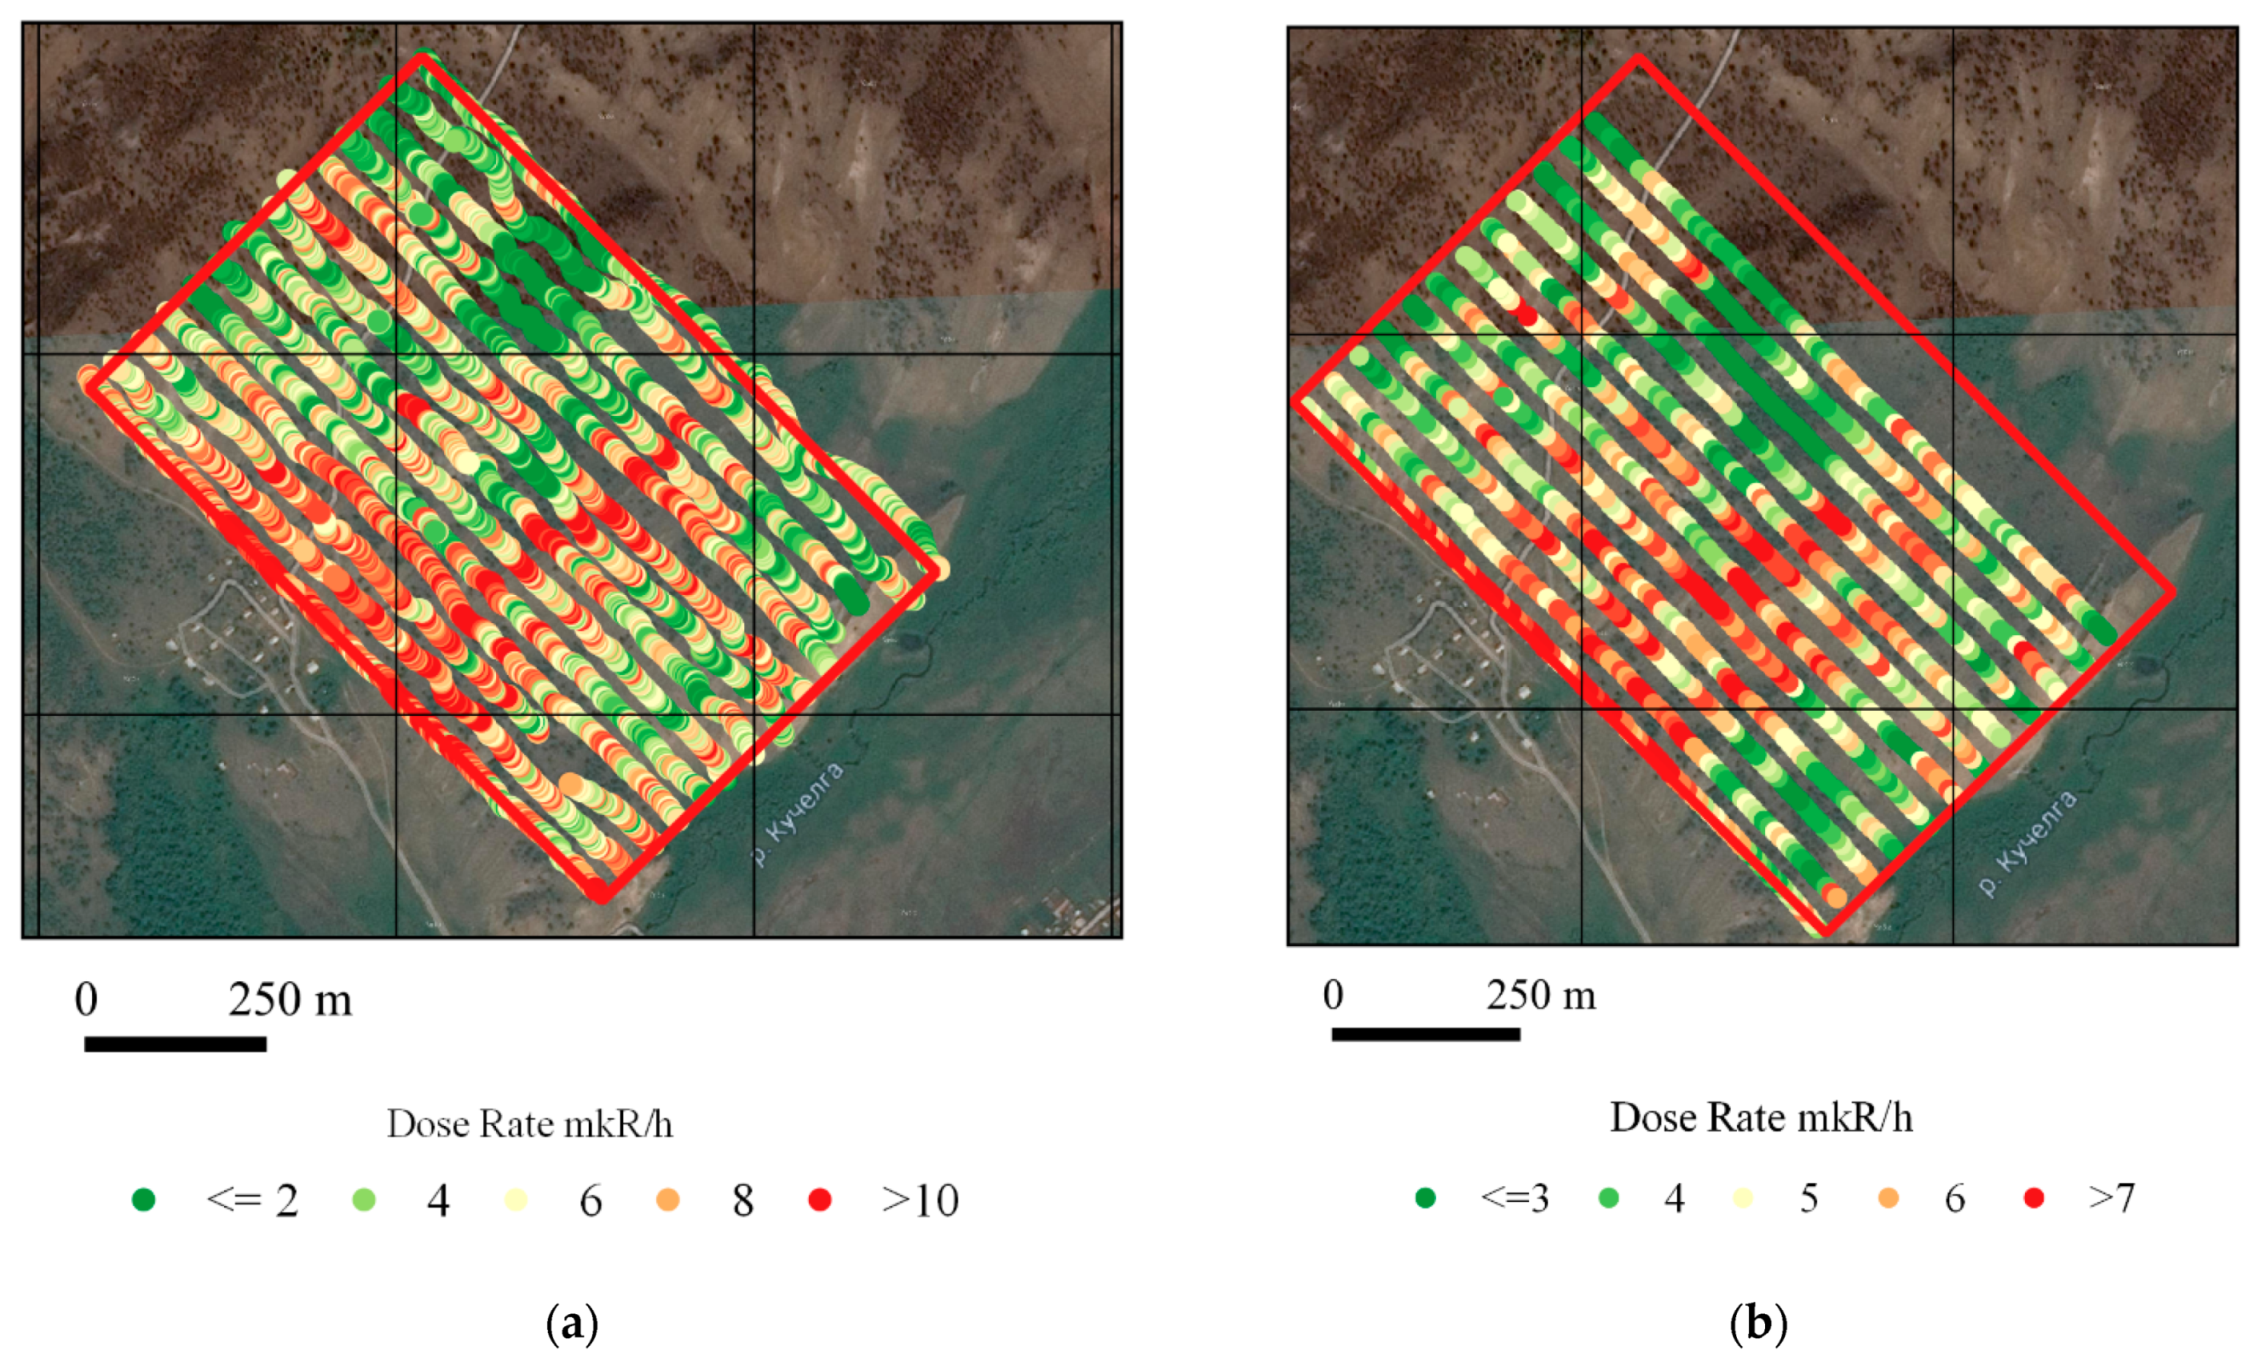
The contours of the areas of the different kinds of survey did not coincide completely. Therefore, in all the figures, the maximum size of the area corresponding to the terrestrial survey is shown for orientation. Surveys with the SRP-68 radiometer played the role of reference data. They were carried out by two teams of 2 people. The accurate topogeodesic network has not been created, the coordinates of the pickets were determined using Garmin navigators. The lightweight radiometer operates in the automatic recording mode with a frequency of 0.5 Hz; there is, thus, no need for operators to stop. Navigation was also carried out using a Global Positioning System (GPS) navigator. Taking into account that the operators of ground survey with various radiometers reached the points using GPS, the ground data has a non-systematic error associated with the measurements of the gamma field at spatially different points. At the same time, the SRP-68 data were linked in the Geographic Information System (GIS) project to the model location of the pickets, and the data of the lightweight radiometer to the real one.
With the data obtained, maps and graphs of the gamma field were constructed by profiles (
Figure 12,
Figure 13 and
Figure 14). Interpolation was performed using the local polynomial method.
Figure 12 shows examples of raw data, which makes it possible to assess the correctness of interpolation.
Firstly, it is noticeable that the aerospace map does not quite accurately reflect the real geological situation. The most contrasting gamma-field anomaly corresponds to a thin pack of presumably granite-gneisses of the Shebarta complex in the central part of the area. The structure mapped as similar in composition but larger in size in the eastern part of the site has significantly lower radioactivity and, therefore, belongs to a different stratigraphic subdivision.
The results obtained, as in the previous case, show that the map of the gamma field in the integral channel does not have significant differences depending on the survey method. The main anomalies, primarily a linear anomaly from a thin pack of granite-gneisses, cutting the area in half, is visible in all cases and at all altitudes and mapped quite accurately. There are similarities not only between terrestrial surveys, but also between UAV and terrestrial. Due to the natural attenuation of the gamma field with the altitude, the anomalies can be significantly smoothed out, although in other cases, apparently with a slightly larger source area, the smoothing anomalies are practically not observed (
Figure 14d). The smallest anomalies of increased gamma field values in the north-western part of the site, the source of which seems to be granite micro-outcrops with an area of no more than a few square metres, are mapped somewhat differently, apparently due to inaccuracy in the spatial referencing of the ground survey results. However, even these micro-objects are found in any case, even at an altitude of 60 m, while in real tasks of radioecological observations or geological searches, objects of this size would hardly be of interest.
To demonstrate the attenuation of the gamma field with height, graphs of the distribution of the gamma field values over the profiles were built.
Figure 14d shows two graphs—for the profile with the best match between terrestrial and UAV data, (profile 4) and the worst (profile 12). Depending on the geological situation, the gamma-field level above the local anomalies decreases by an amount from 1 to 5 μR/h, while the contrast of the gamma-radioactivity anomalies in this area is not high, and during ground measurements the gamma background does not exceed 12 μR/h. At the same time, regardless of the degree of attenuation of the gamma field, the epicentres of the main anomalies are visible, and from the cartographic positions they remain in their places. This determines the possibility of obtaining correct and informative radiometric maps with an individual classification of each geostatistical surface.
As in the previous case, it is not possible to see a fundamental increase in geological information during UAV surveys with a “large” detector of 100 cm
3 in comparison to a small one (6.5 cm
3) (
Figure 15). This confirms the hypothesis that there is no need to use detectors with a volume of more than 10–15 cm
3 for low-altitude UAV surveys in radiometric mode.
4. Discussion about the Prospects of Integrated UAV-Geophysical Surveys
The results of the experimental surveys demonstrate the possibility of obtaining geologically significant results using small scintillation detectors. One of the practical consequences of this conclusion is the possibility of effective integration of gamma-ray surveys with other types of geophysical survey, even simultaneously on one UAV, since a small additional payload mass (spectrometer or radiometer) insignificantly increases the cost of work. The integration of geophysical and other methods of remote sensing, performed using light unmanned systems, is an objective trend in the development of UAV-aerogeology, since the expansion of the set of available geodata significantly simplifies the interpretation of the geological situation and increases the reliability of decisions [
5,
15,
16,
17].
Lightweight radiometric detecting modules with SiPM photodetectors do not affect the UAV flight time at all, even if two units are used to improve data quality, and not one, as in this experimental work. The spectrometers are heavier, but in many cases, when working on sites with an area of even tens of square kilometres, it is not necessary to use the maximal operational radius of the UAV; in such cases a spectrometer with a mass of 1 kg has little effect on survey performance. At the same time, a gamma survey is one of the most versatile and informative methods of geologic and geophysical mapping, and its application simplifies the interpretation of the data obtained. In this regard, over the past few years, a mono-method UAV-geophysical survey was seldom performed [
15,
16], with the exception of geological situations when it is reliably known that the gamma survey at the site is not informative. The basic version of the SibGIS UAS assumes integrated magnetic and radiometric surveys during the first stage of geological prospecting of the sites (with a step between profiles of 100 m), and subsequent detailing (on a scale of 1:5000 and larger) with the spectrometric gamma survey.
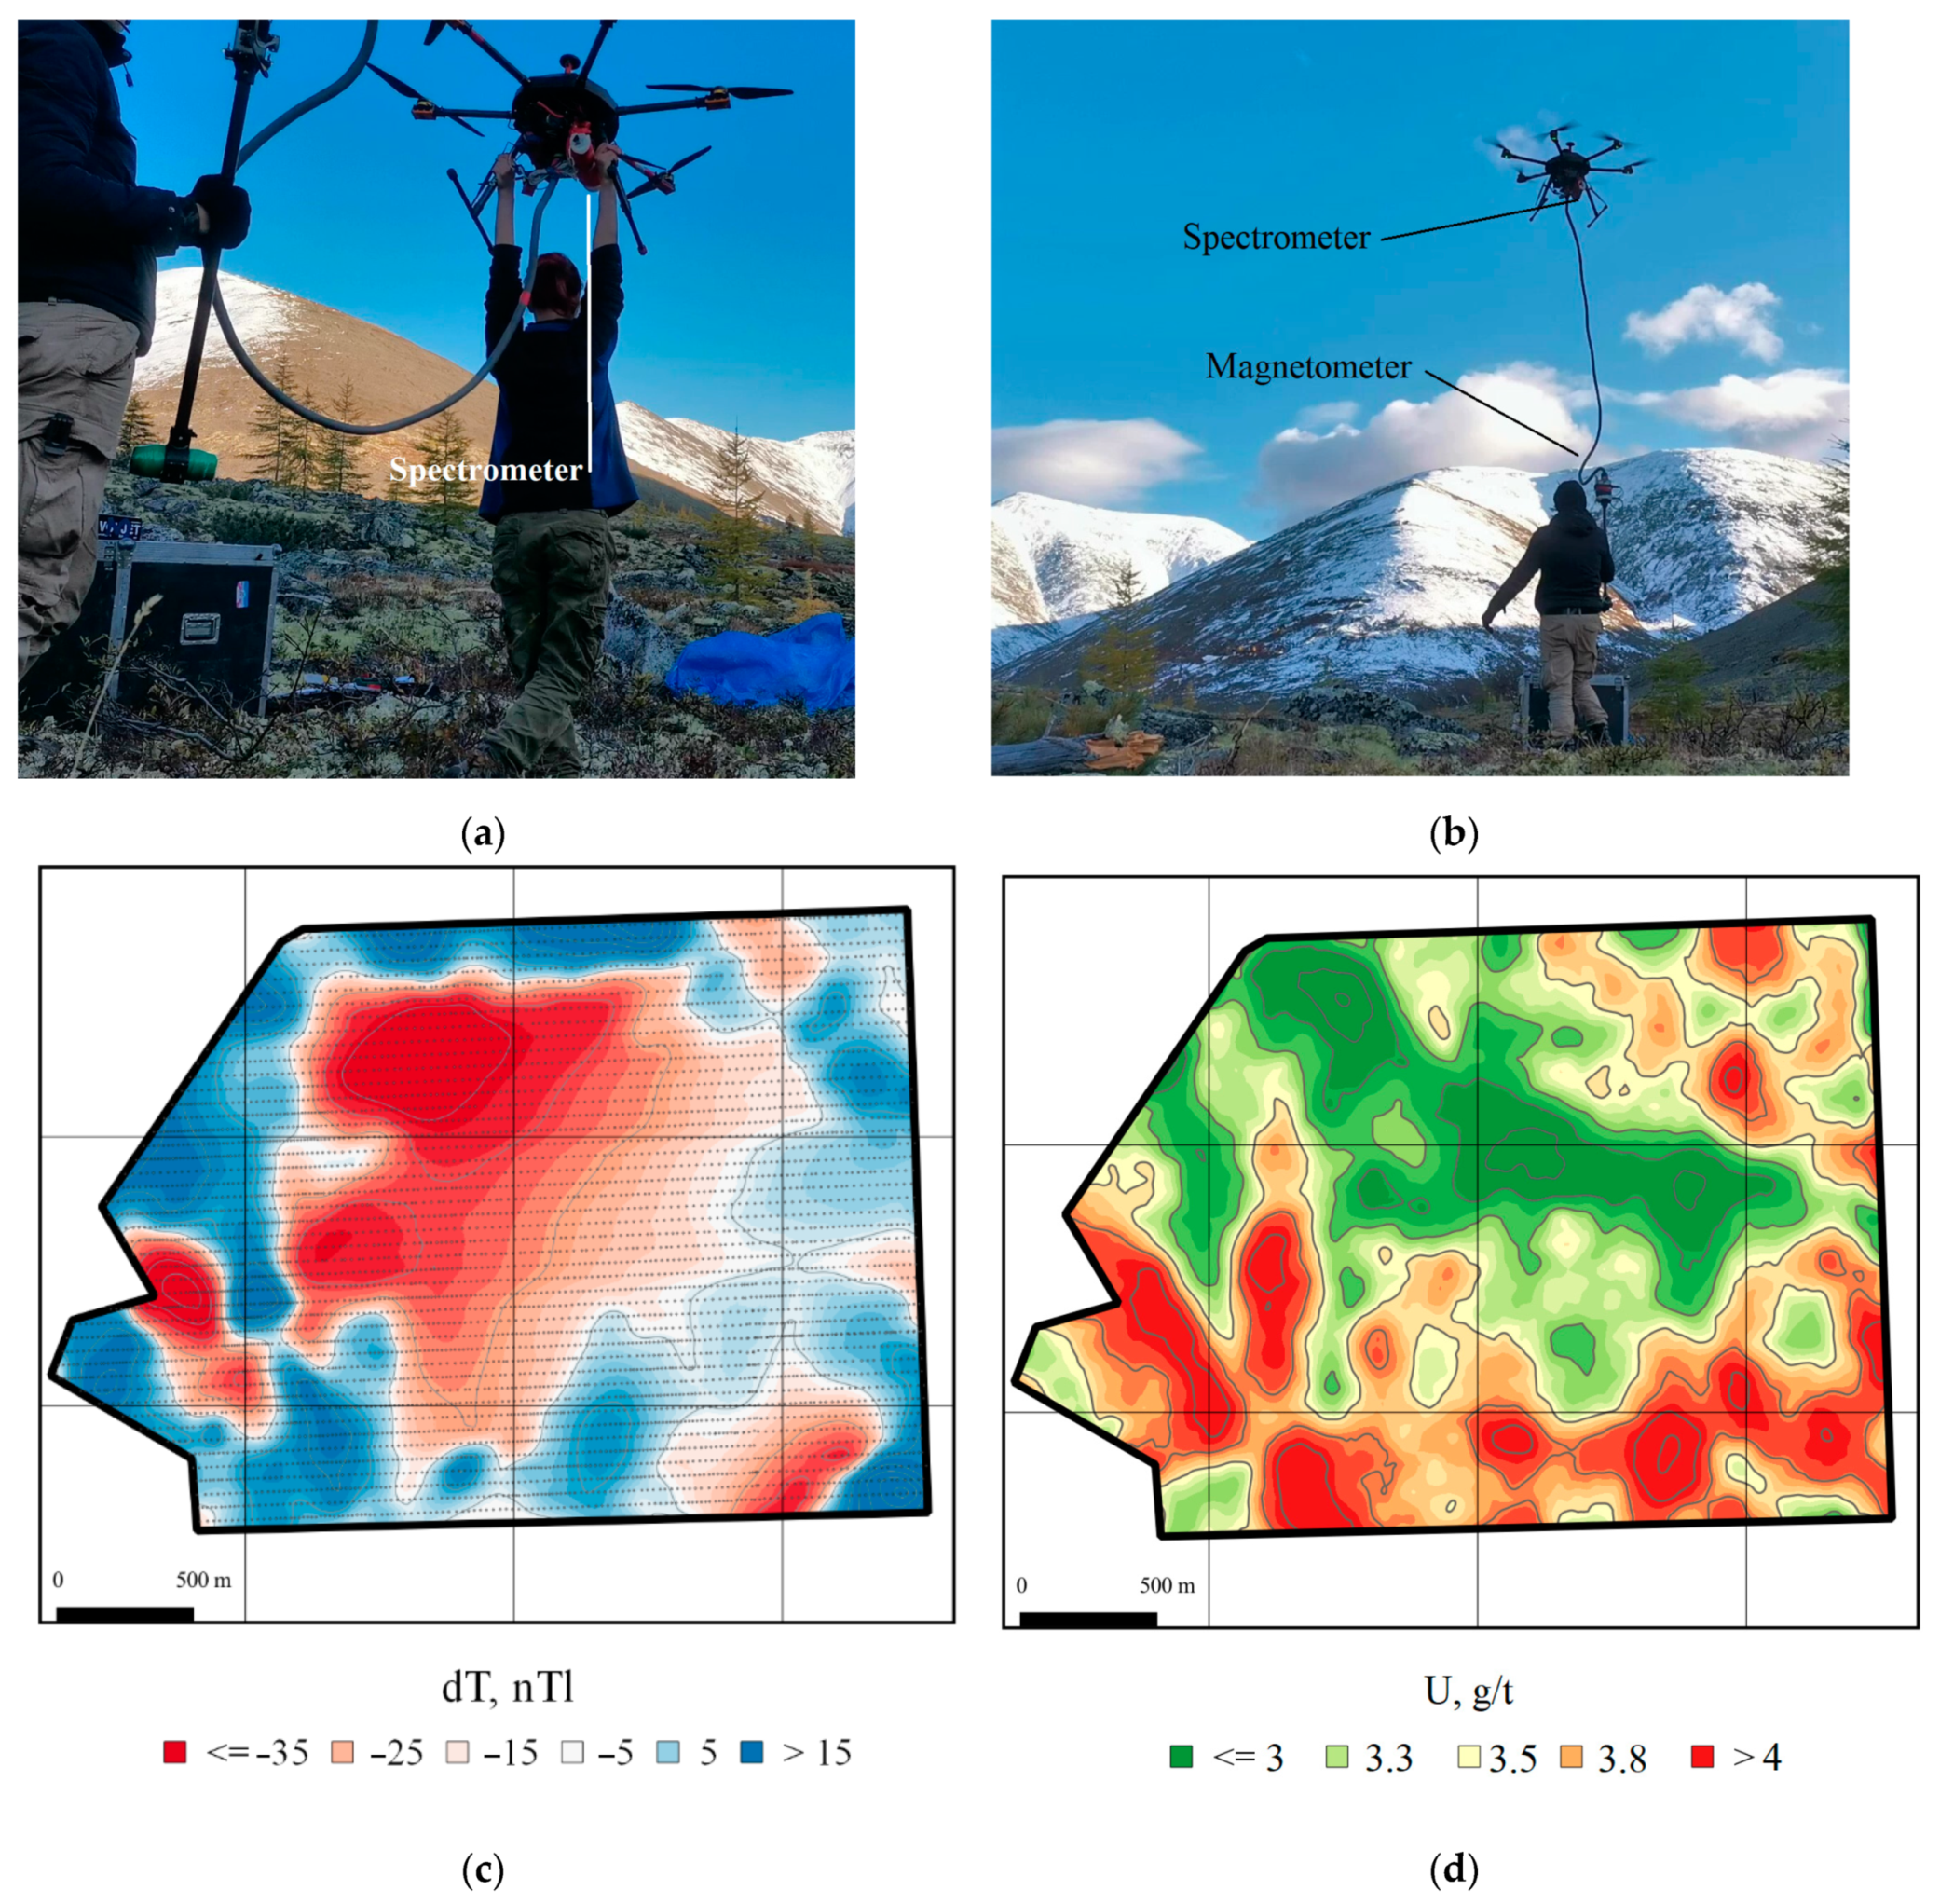
Figure 15 shows the UAS (a,b) and fragments of a spectrometric survey (d) carried out on such a detailing area in combination with a magnetic survey (c). The survey altitude is 35 m, 50 m between the profiles. In this case, some correlation between the anomalies of increased values of the uranium channel of the gamma-field and increased values or anomalies of the change in the sign of the magnetic field is noticeable. The source of the latter is fracture tectonics and zones of granitoid magmatism, and these are visible in both geophysical fields.
Figure 16 shows fragments of a gamma-spectrometric survey at one of the sites in the Republic of Buryatia, the coordinates of which cannot be disclosed due to commercial sensitivity. It is interesting that the object of the contract was a UAV-magnetic survey, which is still in most demand in the geological prospecting market (results of the survey cannot be cited for the same sensitivity concerns), while the gamma survey was carried out by our own initiative. However, the results of gamma spectrometry turned out to be more informative than magnetic survey data. In the radioactivity field, the boundaries of sedimentary and igneous rocks are clearly traced, and according to the different ratios of uranium and thorium, there are also two formations of granites distributed over the area.
Figure 16d shows another possible variant of UAV-gamma spectrometry—the variant of “hovering”, which can be used to obtain high-precision concentrations of radionuclides with relatively large detectors [
16], or as compensation for a very small volume of a gamma detector [
6,
13].
Another promising geophysical method that can be combined with a gamma survey in one UAV is electrical prospecting in the TDEM version [
18],
Figure 17.
Such electromagnetic soundings in the UAV version are also performed with a small distance between the survey profiles, at low flight speed (about 7 m/s), and at a minimal available altitude. The measuring system used by the authors in 2020 [
18] was heavy for light UAVs. It was, therefore, possible to carry only radiometric units with it. However, at present, the mass of the TDEM system has already been reduced from 7 kg to 5 kg, which makes it possible to free up 1 kg for the spectrometer, reduce payload in general, and redistribute the load ratio between suspended equipment with a floating centre of gravity and equipment rigidly fixed to the UAV frame, which increases the flight characteristics of UAS.
Thus, the use of lightweight scintillation detectors as part of unmanned systems for integrated geophysical surveying allows an increase in geological information without a significant decrease in productivity and an increase in the cost of work in general.


 ,
, 


