1. Introduction
Recently, the development of IoT applications, the consideration of efficient wireless service for IoT devices, and the issue of resource management (RM) become vital. The overall performance of RM involves the efficient and dynamic use of resources such as times, bandwidth, and frequency [
1]. Therefore, higher throughput, higher data rate, lower interference, and better coverage are appropriate considerations for RM in the IoT-based wireless networks. The unmanned aerial vehicles (UAVs) are used in large-scale applications such as security inspection, aerial patrol, and traffic assessment [
2]. Hence, UAV-assisted resource management becomes vital for the advancement of the fifth-generation networks. The reasons for the use of UAVs to assist the resource management include: (i) it can be used for rapid management of resource requests from the overloaded IoT users; (ii) it is easy to accommodate the further growth of system coverage and capacity; (iii) it can be operated at different altitudes; and (iv) it can provide rapid and on-demand service for IoT users [
3,
4]. Due to the higher altitude and greater coverage, aerial base stations have a higher chance of having line-of-sight (LOS) connections with ground users. Therefore, to provide reliable services to IoT users, UAV based resource management is an essential and hot issue for enhancing the resource utilization of IoT networks [
5,
6].
In order to improve the accuracy of regression and classification tasks in the RM scheme, deep learning methods are more preferable over conventional machine learning methods [
7]. Additionally, deep learning methods allow extracting features automatically from large datasets [
8,
9]. Specifically, deep reinforcement learning (DRL) has made a substantial improvement in RM that is difficult to model with conventional approaches [
5]. Mainly, conventional methods have faced a significant challenge due to the wide range and complexity of wireless networks [
10]. To this end, the gaps of traditional machine learning-based RM schemes, such as the model complexity, costly use training, and the generalization from test workloads to the actual application of user workloads are identified. Therefore, to solve the most complicated RM problems in IoT networks, this paper proposes a DRL method, in which the state, action, and reward are important parameters that should be designed to generate an optimal policy [
11]. The DRL-based approach has been applied to various fields, such as resource management and allocation [
12,
13], dynamic channel access [
12], mobile offloading [
13], mobile and unified edge computing caching, and communication (3C) [
14,
15,
16], fog radio access networks [
17,
18]. The implementation of DRL is more successful than the single agent Q-learning approach [
19]. However, most of them were limited to designing and analyzing the DRL-based method in fixed base stations for solving the joint resource allocation problems. As a result, our proposed method can solve the joint RM optimization by using the DRL approach. According to Reference [
20], the DRL agents consider the maximum long-term rewards rather than simply obtaining the current optimal rewards. This is critical for time-changing and dynamic systems.
This paper focuses on UAV-based RM with the application of the DRL approach. Our main initiatives are applying a multi-agent-based DRL model, round robin with K-means for user request queue, and clustering tasks. To the best of our knowledge, these issues are open ones that have not yet been fully investigated. To jointly manage user data, as well as UAV-based orthogonal frequency-division multiplexing (OFDM) signal values in a real environment, the DRL approach is applied. We considered one UAV connected through wireless backhauls with the core network. Under this layout, the objective is to optimize the management of resources for IoT users based on the A2G access links. Different from previous studies, our study focuses on the actual data collection environment. Additionally, this paper uses a large dataset with the integration of DRL and K-means. The real data collection includes both the signal variations and their LOS/ non-line of sight (NLOS) views. Thus, the DRL can reduce the computational times and is a better way to test a large number of datasets, and produce an optimal strategy with a range of real environments relative to conventional RM approaches [
21]. Finally, it inspired us to investigate the issues based on the application of the DRL approach.
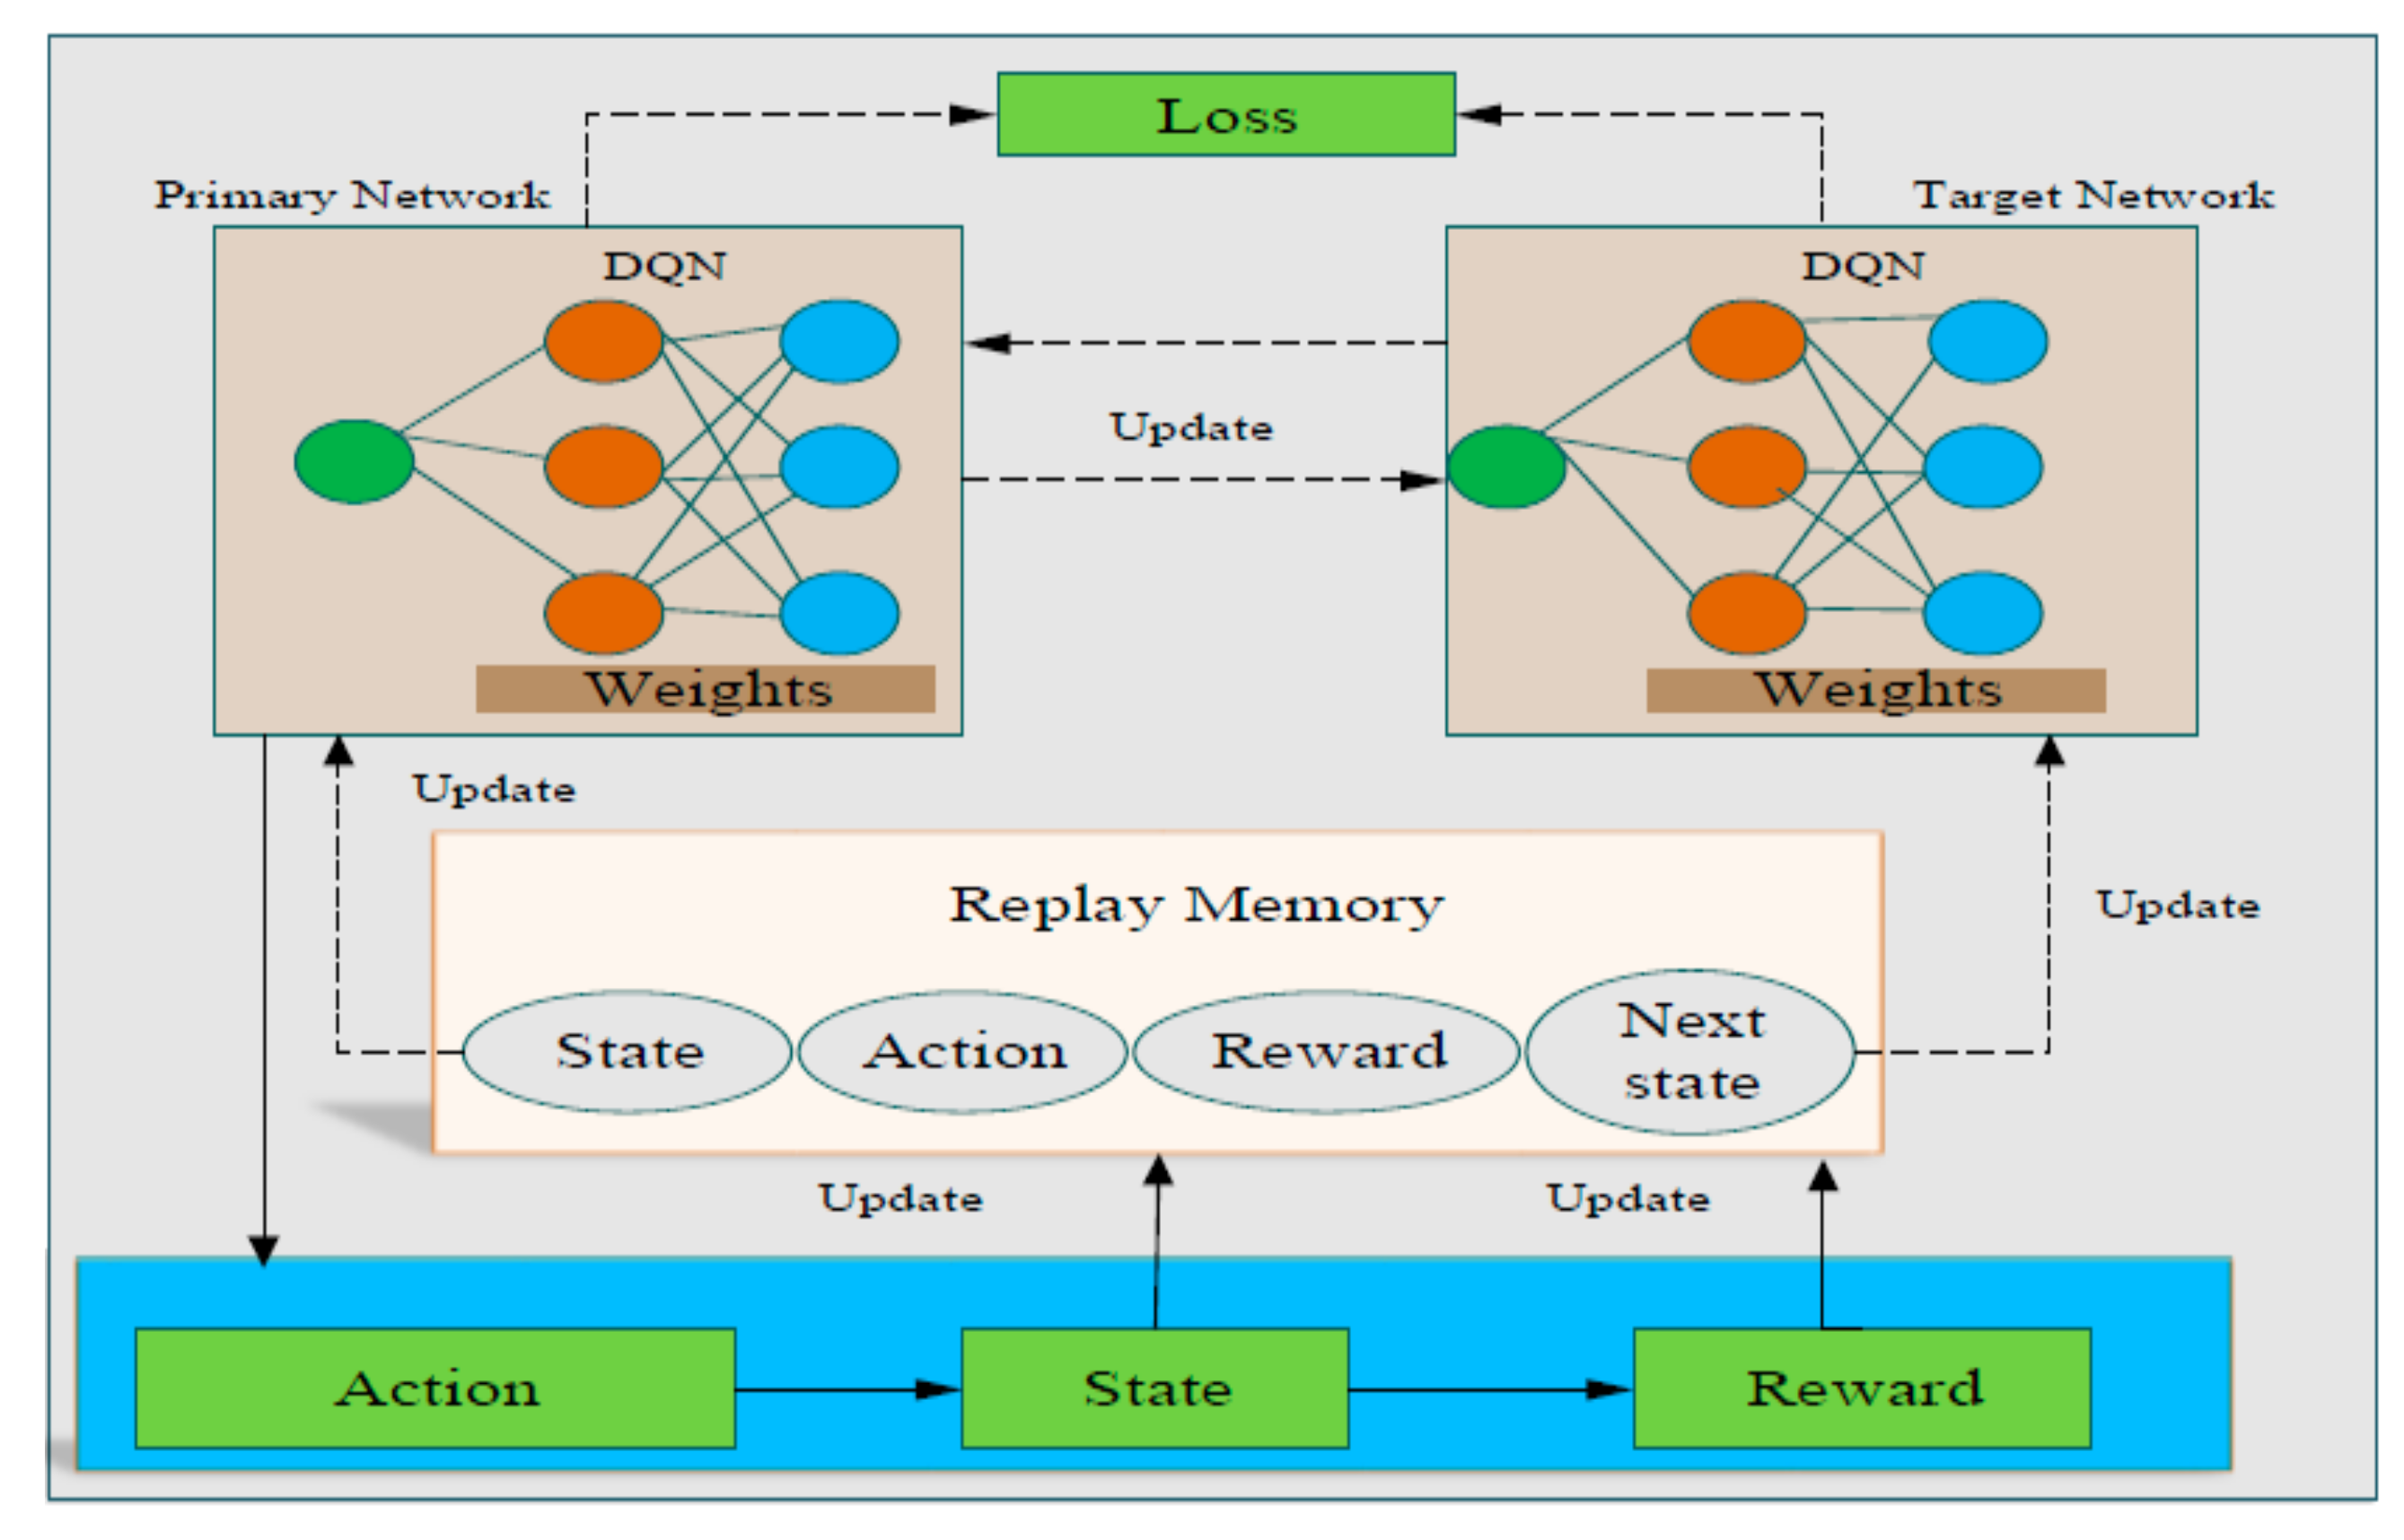
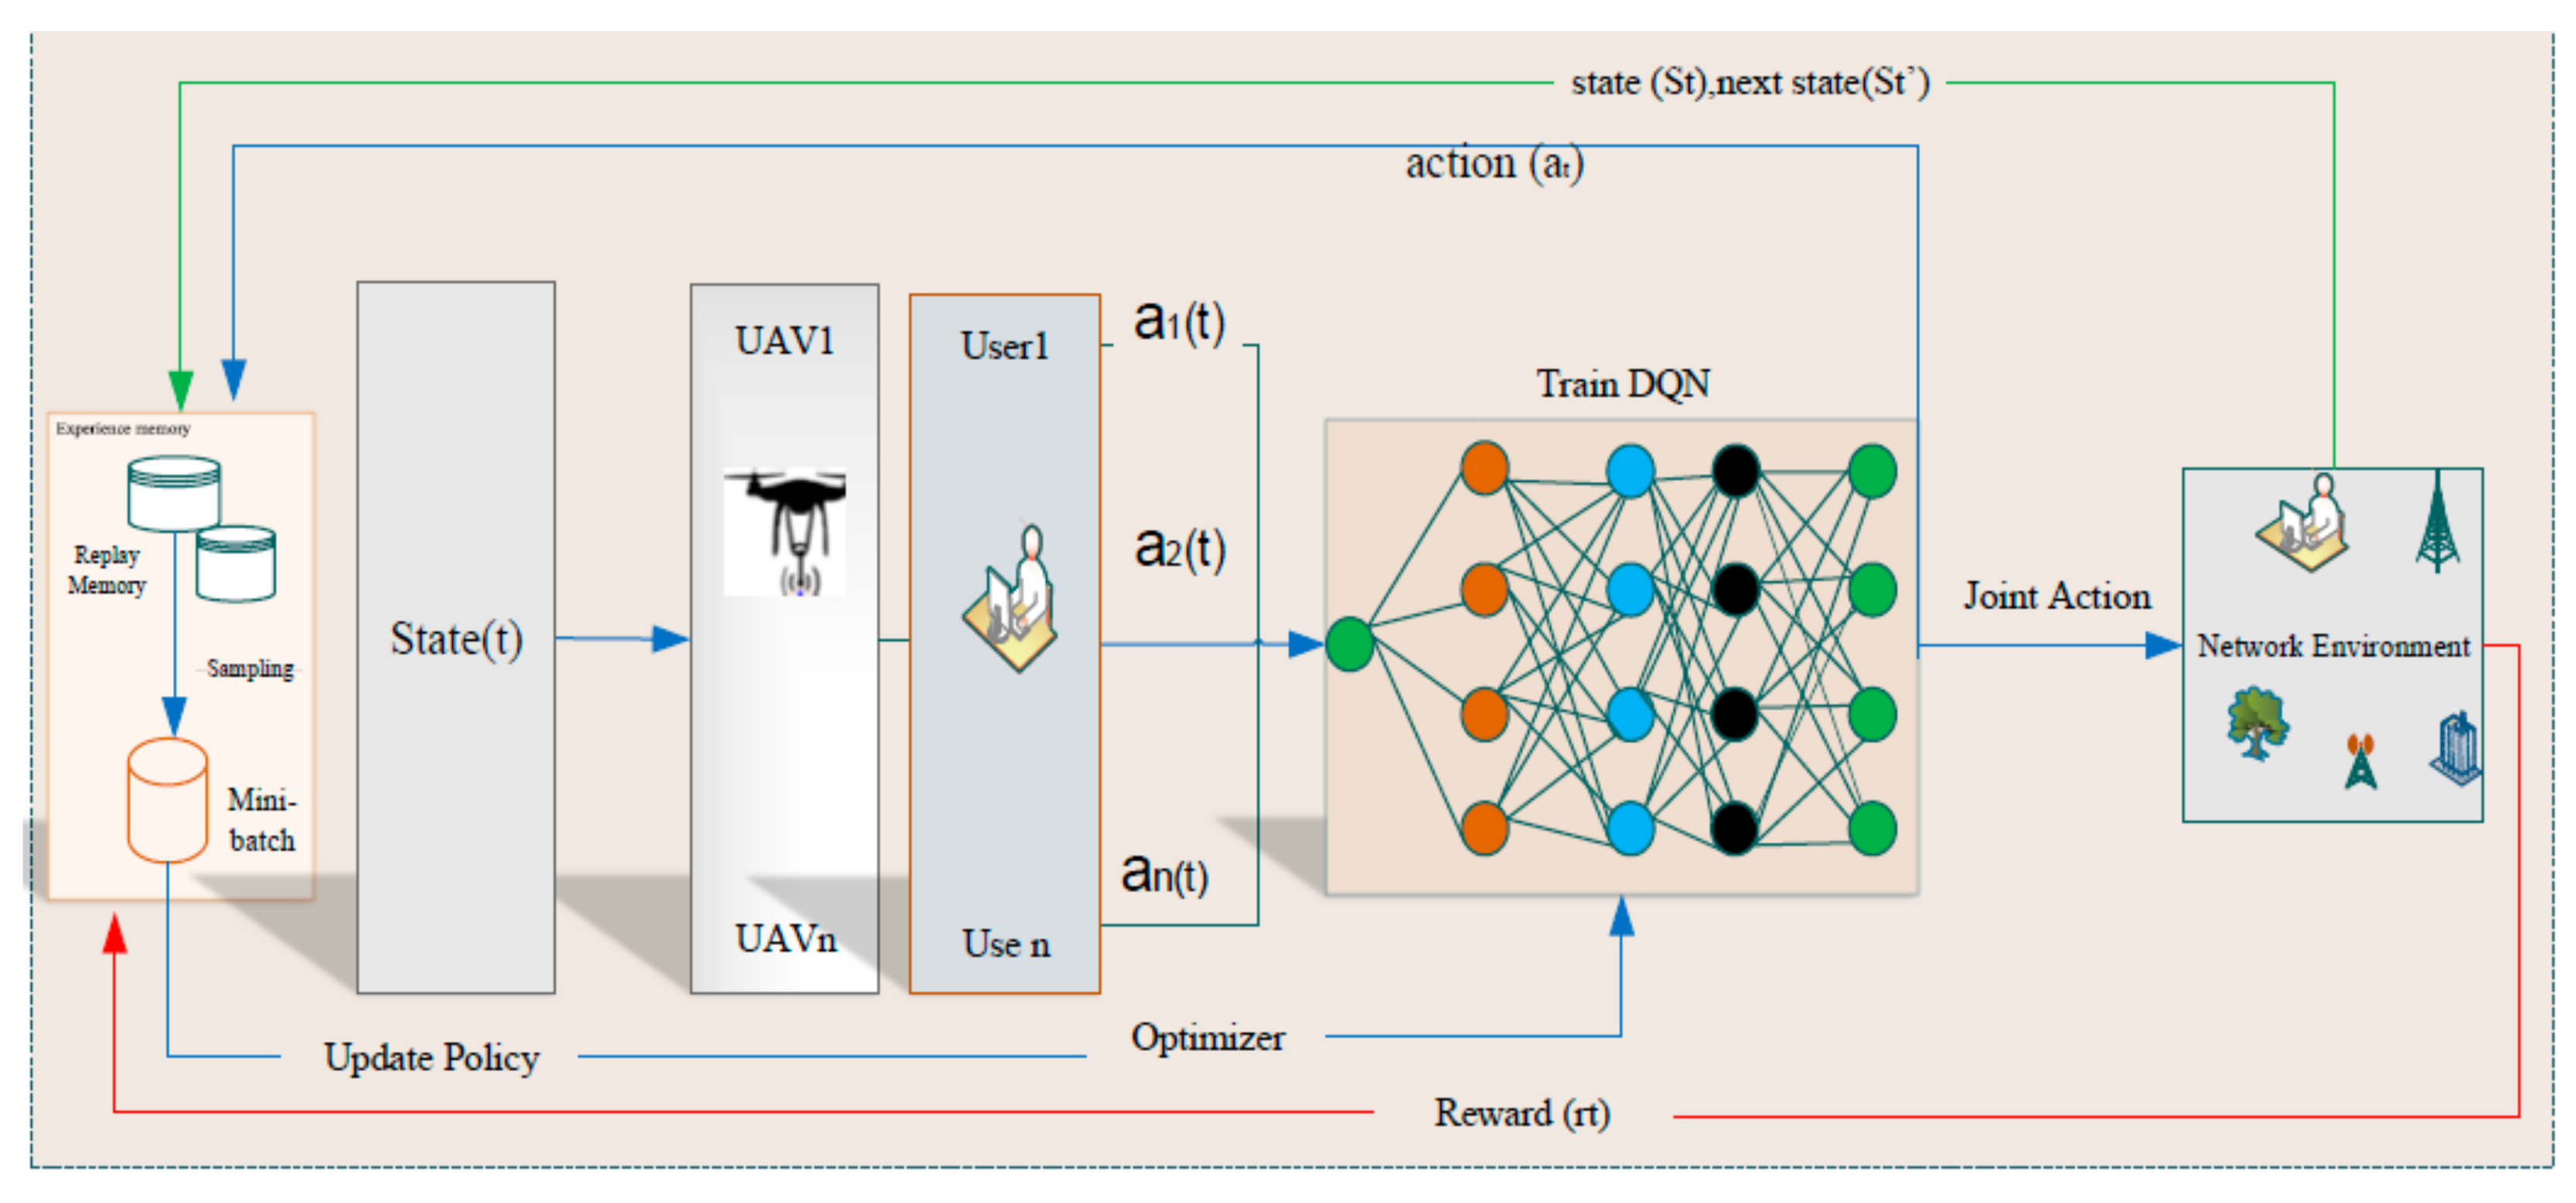
Figure 1 illustrates the general architecture of the DRL algorithm for our system design.
The architecture displays both the primary and target networks, which contains all the obtained dataset values and the final results for allocating resources, respectively. Then, the weights of DQN are outlined to update the loss values based on the primary and target networks. Additionally, the action, state, and reward section values are considered in the environment. Then, all these are updated in the next action, next state and next reward, respectively. In the end, all values are stored into replay memory and used for making policies and decisions. Therefore, the proposed DRL learning architecture can learn user data from the grid points, clusters, and UAV altitudes. As the proposed learning architecture can automatically learn the characteristics of the environment based on the learning input sequences with different time scales.
The major contributions of our work can be summarized as follows: We consider a UAV-assisted wireless IoT network and assess the RM schemes. Then, we propose a multi-agent DRL with a round robin resource-scheduling algorithm for the optimization of joint RM. A joint RM optimization method is proposed to minimize the power consumption and maximize the user throughput and the signal-to-interference-plus-noise ratio (SINR)
- (1)
We design a system model that is connected to IoT users, UAV-BS, and A2G channel access links. This framework contains a DRL based RM problem with multiple constraints, such as the number of users, channel gains, signal noise ratio (SNR) issues, and power consumption levels. These variant parameters are used to characterize the heterogeneous and dynamic nature of the environment at each time slot.
- (2)
The DRL is applied for the development of the main system model with K-means as a clustering approach. Then, the round-robin algorithm is used to handle the service request queue for the IoT users. The IoT devices are clustered into cluster 1 (urban) and cluster 2 (sub-urban) based on their location and signal distribution. This makes our system more computationally efficient and stable. The proposed DRL framework is therefore used to perform the optimal RM for the UAV assisted IoT devices. Additionally, the DRL techniques with neuron activation mechanisms are used to compare and evaluate the impact of neuron activation on the convergence of the proposed system.
- (3)
Ultimately, based on the proposed system, two scenarios (cluster 1 and cluster 2) are used for system evaluation. It is important to handle mobile users within the transmission range of the A2G based UAV access link.
In the rest of the paper,
Section 2 provides the related works, and
Section 3 explains the system model architecture. In the Methods and Materials Section, such as experimental setup and data collection procedures, are discussed in
Section 4.
Section 5 provides the proposed system design, such as the round robin scheduling-algorithm for resource management, multi-agent DRL for joint resource management, proposed system architecture, and evaluation metrics.
Section 6 reports the experimental results and discussions. Finally, the conclusion and future works are outlined in
Section 7. Lastly, references are listed.
2. Related Works
In the wake of IoT heterogeneous networks, there is a need for equal management of network resource strategies. The DRL-based approach has been used to resolve various issues related to resource management and allocation [
22]. However, the objectives are highly limited to the analysis of the DRL-based approach. In Reference [
23], the reinforcement learning approach has been suggested for user group vehicle networks. The objective was to investigate the optimal power control solution and network capability in heterogeneous networks (HetNets) based on the resource management strategy. In previous studies, Q-learning has been extensively applied as the reinforcement learning approach [
24]. Additionally, based on the Q-learning approach, it is difficult to handle the large environment [
25]. The action is also limited for small section optimal approach conditions. However, none of the works centered on the HetNets A2G UAV-based access links. Hence, DRL [
23] is assumed to be an effective method for resolving the complex and joint RM system. More specifically, it is applicable for controlling the fluctuation effects of the single-agent framework based on the resource sharing system [
19,
26]. The authors investigated the reinforcement learning-based approach to improve the strategy for power control and network rate adaptation. In Reference [
26], the initial users and secondary users based on a constant control were considered. The objective was to adjust the power based sharing scheme after the detailed learning. Similarly, Reference [
27] suggested a new approach of centralized DRL-based power allocation. The authors used the deep Q-learning method to perform near-optimal power allocation and to achieve a higher user throughput. Also, Reference [
28] suggested a DRL-based throughput maximization scheme in small cell networks. In this paper, a DRL algorithm with a deep recurrent neural network was used. The channel selection and fractional spectrum access are considered as resources to be managed. However, the existing works do not consider the use of the actual dataset and focus only on the request queue of the user service. In short, the existing Q-learning method works for a limited environment, action, and decision or reward. It is difficult for a large environment to manage the optimal solution with the Q-learning method [
27,
28,
29].
According to Reference [
30], Q-learning and DQN methods were used for the power allocation scheme. The key objective was to reduce interference and cooperation of power allocation to boost the quality of service with LTE-femtocells. Using the same proposed method, the analysis in Reference [
20] considered a distributed technique under centralized training conditions. However, the research sought to test outcomes with a fixed allocation of resources. Therefore, at this time, UAVs are used to assist the terrestrial base stations [
31] for many purposes, such as power allocation, connectivity enhancement, and throughput maximization [
2,
20,
29]. UAVs can be applicable for RM on-demand standard service [
21,
32] of power and user throughput as a supplier of information from A2G to IoT devices [
22,
25]. We, therefore, use UAVs as the key base station to collect data, optimize throughput, and manage SINR. The paper in Reference [
33] proposed a multi-agent DRL as resource allocation for vehicle-to-vehicle communications. The system mapped the local observations of channel state information and the interference management level. The study considered vehicles as agents to interact with the environment for efficient power transmission decisions. The objective was to minimize transmission overhead with available resources. Additionally, the authors in References [
34,
35] intended to use a deep learning-based method for the optimization of wireless resources. The main objective was to forecast a resource allocation based scheme with 24-hour wireless resource management of multiple timescale features.
Unlike conventional resource management methods, such as heuristics-based, game-theoretical, and cooperative approaches, the DRL can derive actions from the run-time context information [
3,
31]. Therefore, the DRL makes the decision based on retuning and retraining via the distributed and dynamically changing of the IoT environment for automatic resource management [
35,
36]. While the above works applied DRL for RM, most of them used too small and simulated dataset representations. After critically identifying the gaps, we are initiated to assess the optimization ways of resource management based on various performance indicators. Then, to rapidly analyze and optimize the cluster-based resource management performance through a large number of real datasets, this study focuses on cluster-based data collection with IoT users and UAV based communication. Therefore, our work’s unique feature is using a real data collection environment rather than simulations. Then, the K-means method is applied to cluster the data collection environment. Then, we apply a round robin algorithm to manage the resource request queue for the users to generate a service. Then, we apply DRL approaches for the main system model construction. Therefore, our proposed system has the benefit of extracting the most representative features from datasets better than conventional approaches.
3. System Model
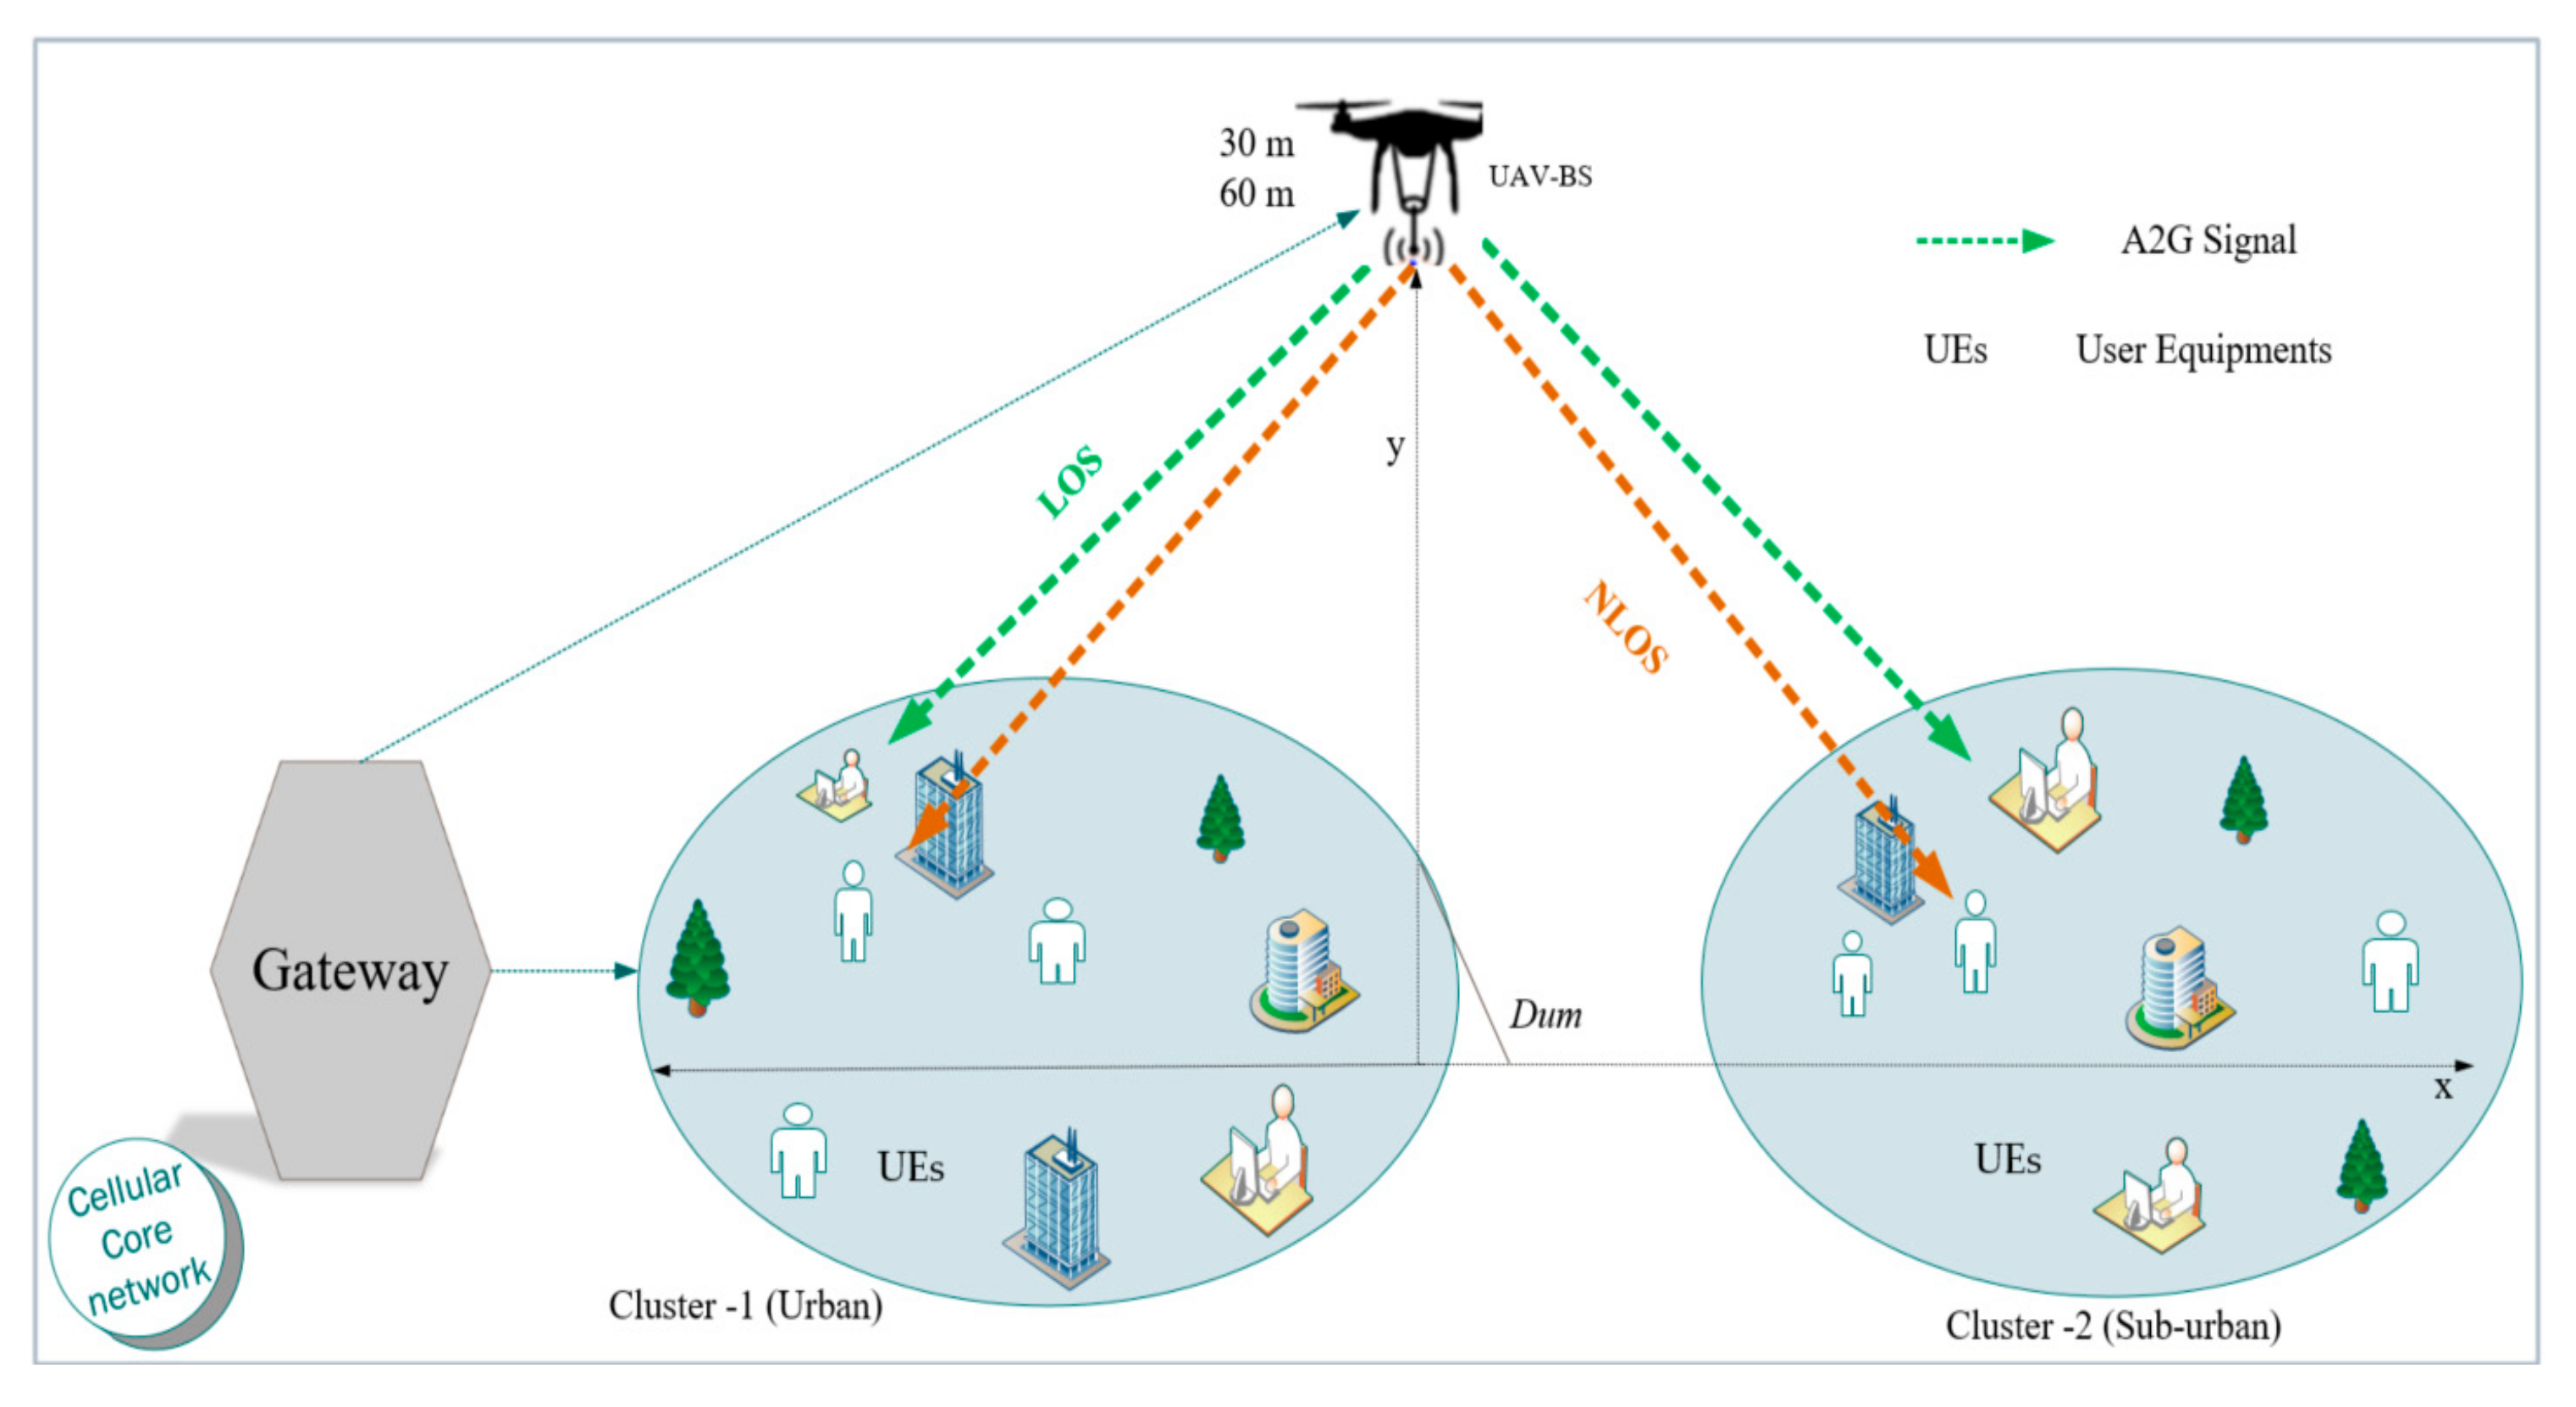
Figure 2 displays the UAV-assisted IoT system model. It consists of an A2G signal access link transmission, LOS/NLOS views, and the altitude between the UAV and the user (
). Assume that UAV is used by ground users to provide access-sharing information. The UAV as a base station is used and deployed at altitudes of 30 and 60 m and reach all the users randomly distributed on the ground inside the actual area. The OFDM signal, as the received signal strength (RSS) and SNR values, which could influence any user equipment, has been collected. The transmitter (Tx), i.e., the UAV, is represented as M and the receiver (Rx), i.e., the mobile user, is represented as U. The system architecture configuration covers the network location with 35 users, denoted by
U1,
U2,
U3, …,
U35, serviced by UAV.
Figure 2 shows the relation between the M-U A2G link; clusters are used as target areas. All mobile users operate on the same frequency band. Therefore, all users are expected to receive the same OFDM signals. The control station is used to monitor and access the network. The defined clusters are presumed to be urban and sub-urban for cluster 1 and cluster 2, respectively. Then, the deployed UAV reaches both clusters based on their altitude and user interest for resource usage. The path loss (
) model in the states as S=LOS or S=NLOS is shown in Equation (1) according to References [
37,
38],
where
is the altitude between UAV and the user (in m),
α is the path loss exponent,
models the shadowing effect, which is a Gaussian random variable, N(0,
), while
is the carrier frequency. Then, the channel gain is composed of the
, which are the path loss and small-scale fading coefficient between UAV to a user, respectively. Then, the channel gain can be expressed, as in Equation (2),
To estimate the interference, it is assumed that all N channel resources are occupied by M to users [
26,
27]. The UAV at the altitude of 30 m and 60 m has an estimation of SINR on the channel n, which is given by:
where
and
are the power transmission and the channel gain ratio from M to U1 to the control station, respectively;
is the noise power,
is the altitude from M to Un. Therefore, the overall SINR is expressed as follows:
where
and
are the channel gains between M to U and M to Un based on the altitude of the Tx and Rx, respectively;
is the power transmission between M to U.
Assuming that there is a physical capacity of
and user throughput
. Then, there is a user throughput capacity, where
has an effective throughput of
,
is the number of users who interact with UAV. Then,
is the time slot of a user communicates with
to use the A2G link. The resource request (
) ratio of the user, then the maximum
, are analyzed in Equation (5). Therefore, the total throughput is measured at a grid level with clusters. To calculate the entire throughput of the separate user and total throughput (
T) as in Equation (6):
where
is the sum of all
values in each cluster,
is the average number of
values per clusters, and
is the time slot to produce signal values. Therefore, this manages the optimal allocation of throughput values.
Equation (7) calculated the analysis of power transmission (Pt) for the A2G access link with the altitude between M to U (
). Let
represent the data rate access ratio from M to U access. As a reference, we used the Shannon formula, as in Equation (8), where
and
are the Tx and Rx antenna gains, respectively, i.e., the difference between the average transmitted and received power in a random transmit as well as received direction. Then,
is computed as:
where
is the full transmitting power of the UAV and the total received power of users by dBm in all directions. The value of lambda (
λ) is the wavelength of the radio rate. In short, user throughput is generated through the available values of bandwidth, data rate ratio, and the efficient throughput capacity to users.
5. Proposed Method Description
This section contains the general architecture of DRL for our system, the round robin scheduling-algorithm for resource management, multi-agent DRL for the joint resource management problem, the detailed architecture of the proposed system, and evaluation metrics.
5.1. Round-Robin Scheduling Algorithm for Resource Management
According to Reference [
26], round robin is a scheduling algorithm in which each resource can be assigned with a duration of time and iteration. The algorithm mainly focuses on the time slot and time-sharing-based scheduling, and is applied to ensure that resources are allocated fairly at each time slot. If the RM processes are not assigned or completed at a given time, the allocation queue comes after other resources have arrived, which makes scheduling fair [
19]. Therefore, the round robin scheduling-algorithm has various advantages, such as being easy to implement, cyclical, and starvation not occurring. For different resources, it supports first come and first serve to schedule, and gives equal access to all resources to be allocated. When a new resource request comes in, it is added to the end of the queue and is ready to be managed and allocated. Therefore, each resource has a chance of being rescheduled for allocation with a particular time slot. Generally, the following steps are applied for our proposed system to compute the resource management requests:
- (1)
Decide the resource that comes first and then start to allocate the resources as a time slot only.
- (2)
Check the other resource requests. If there is a resource request that is available in a one-time slot while another resource request is being filled, the incoming resources are put on a waiting list as a ready queue.
- (3)
After the time slot has gone, check for any more resource requests in the queue. If the existing RM process is not finished, add the existing request to the end of the queue.
- (4)
Take the first request from the waiting ready queue and start to allocate it (same rules),
- (5)
Steps (2)–(4) can be repeated.
- (6)
If the resource request is finished and none are waiting in the queue, then the assigning work is done.
For instance,
Table 3 illustrates the resource management process with the round robin scheduling-algorithm. It contains a list of resources (resource 1 (R1), resource 2 (R2), and resource 3 (R3)), duration, the order of the queue, and arrival time slots. Therefore, R1, R2, and R3 are given a waiting time slot of four (4), six (6), and six (6), respectively. Hence, the average waiting time (AWT) of all resource requests is (4 + 6 + 6)/3 = 5.33. Lastly, three-time slot considerations are crucial for applying RR as an RM issue.
Then, we consider the time slot value is one (1):
- (a)
Completion Time: the time slot at which the resource request allocation assignment ends.
- (b)
Turnaround Time: the total time that the service request is available in the queue (i.e., turnaround time = completion time − arrival time).
- (c)
Waiting Time (WT): the total waiting duration (i.e., waiting time = turnaround time − burst time).
5.2. Multi-Agent DRL for the Joint Resource Management Problem
According to
Figure 5, a multi-agent DRL is used to build a joint strategy for resource management. It is because the cumulative reward values of one user equipment are certainly influenced by other user equipment’s actions in the resource management process. Hence, the initial state and UAV to user actions affect the value of the reward.
Therefore, Equations (9)–(19) illustrate the relationship between the state, action, and reward for a multi-agent DRL-based scheme.
- (1)
State: The A2G channel used by IoT users, the consumption of power rate, and the effects of interference are considered as a state. Then, the values of each state
with the state-action pairs at a time slot as
for the next state values as
(
). Thus, for Equation (9),
and
are the values of a state and the next state, respectively. Moreover,
, is the value of the reward;
is the value of action at a time slot;
is used to represent and control the changing situations. The value of
represents the policy. Next, the agent will have access to the next state of
.
Then, the expected values of the next state, as in Equation (10), where
is the target value; (
) used for the next state and action as in
(
. Then, the time slot calculation for the state to action communicates, as in Equations (11) and (12). Then, the time slot (
) is calculated as in Equation (13):
- (2)
Joint action selection strategy: The allocation of resources such as channel allocation of bandwidth, throughput, and power is the action taken by the agent. This is used to equate action1 with next action vs. action1 to target1, and action n to target n. Where, to control the randomness of the environment, add the time slot as in Equation (14). Based on Equation (13) of
and the time slot of
. Then, as in Equation (15), this shows how our target (
values are learned from the state and updated over time with
as in Equation (16):
Next, the loss function is computed as in Equation (17), with the sum of the Q-values and their target differences as follows:
- (3)
Reward: users need to achieve QoS constraints such as throughput, power, and bandwidth called rewards. However, the SINR values must be higher than the SINR threshold. Therefore, the reward is the effective management of resources; otherwise, the reward is zero. As UEs takes the action of
by observing
it obtains the immediate
. After an action is taken, reward the agent based on the result obtained. Then, the value of the new state is computed, as in Equation (18):
- (4)
Replay memory: It used to save the evaluation of the cost of past experiences, i.e., past state-action pairs in our system. The combination of using the batch method and replay memory improves the convergence of DRL [
28]. Then, for each episode, take a batch of samples from the past experiences. Then, find the gradient of the weights and store it into replay memory. Finally, train the weights of the deep neural network to estimate the loss function.
- (5)
Policy: updating the value function, the agent also needs to sample and learn the environment by performing some non-optimal policy (i.e., the optimal policy : is obtained to maximize long-term reward). Then, each UE learns the optimal policy = ∈based on the state space through the A2G access link from the associated UAV. Therefore, all the agents need to obtain the optimal policy.
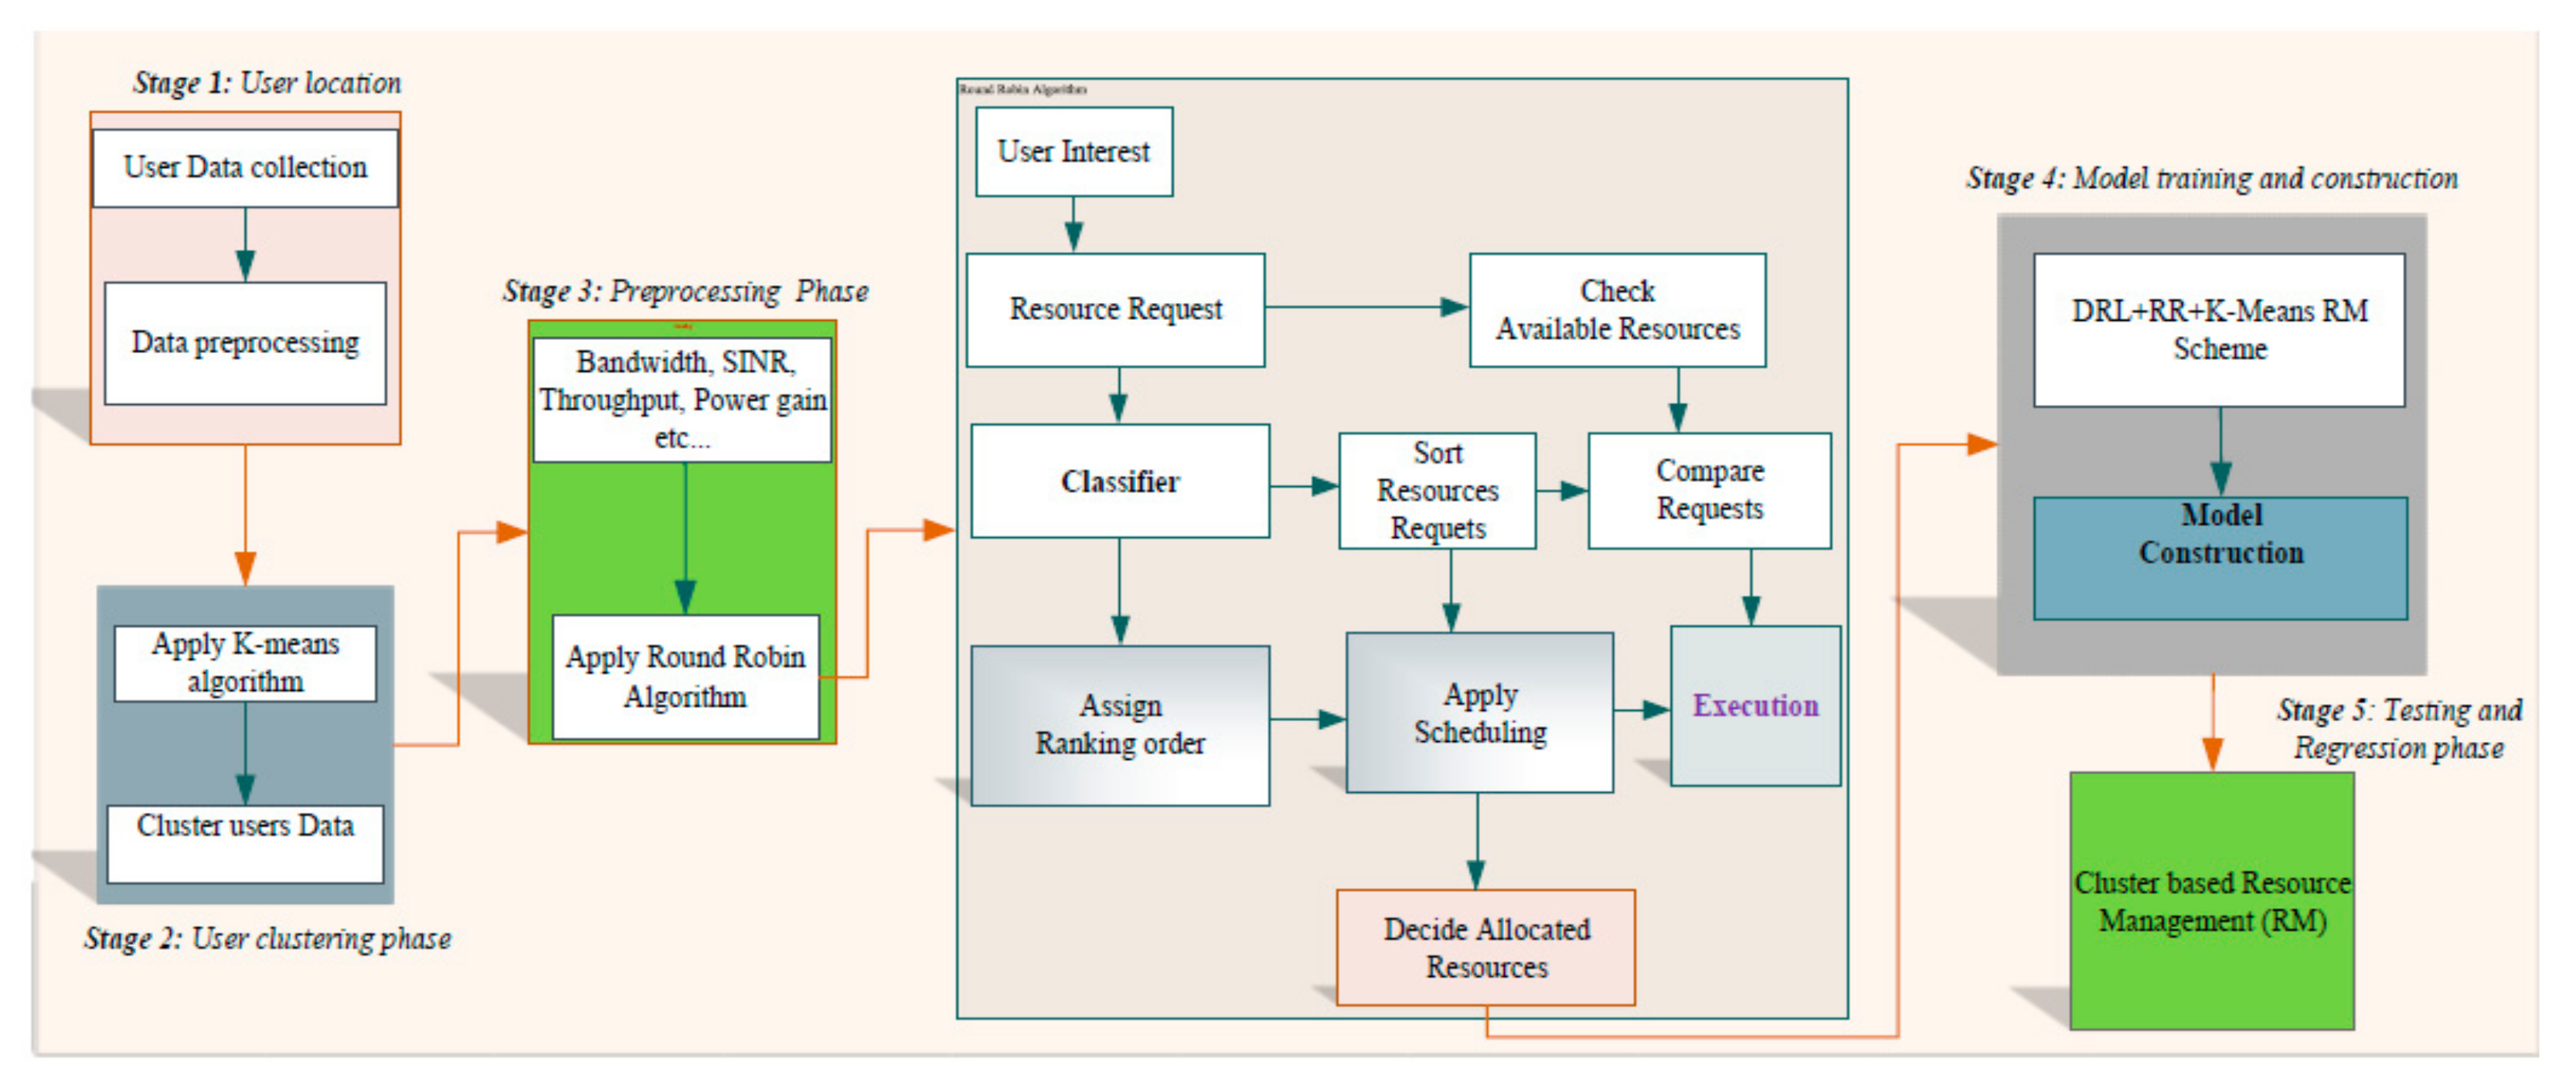
5.3. Proposed Method Architecture
In the working environment, each user observes and submits requests for services. Additionally, users involve activities in the state; UAV takes action to design and learn suitable policies for the next state. The environmental capability of individual users has been observed. After the DRL agent builds its state based on previous actions and local observations, then determine the state of the environment. Local observations are used to provide and enhance the observation of the global state in the environment [
26].
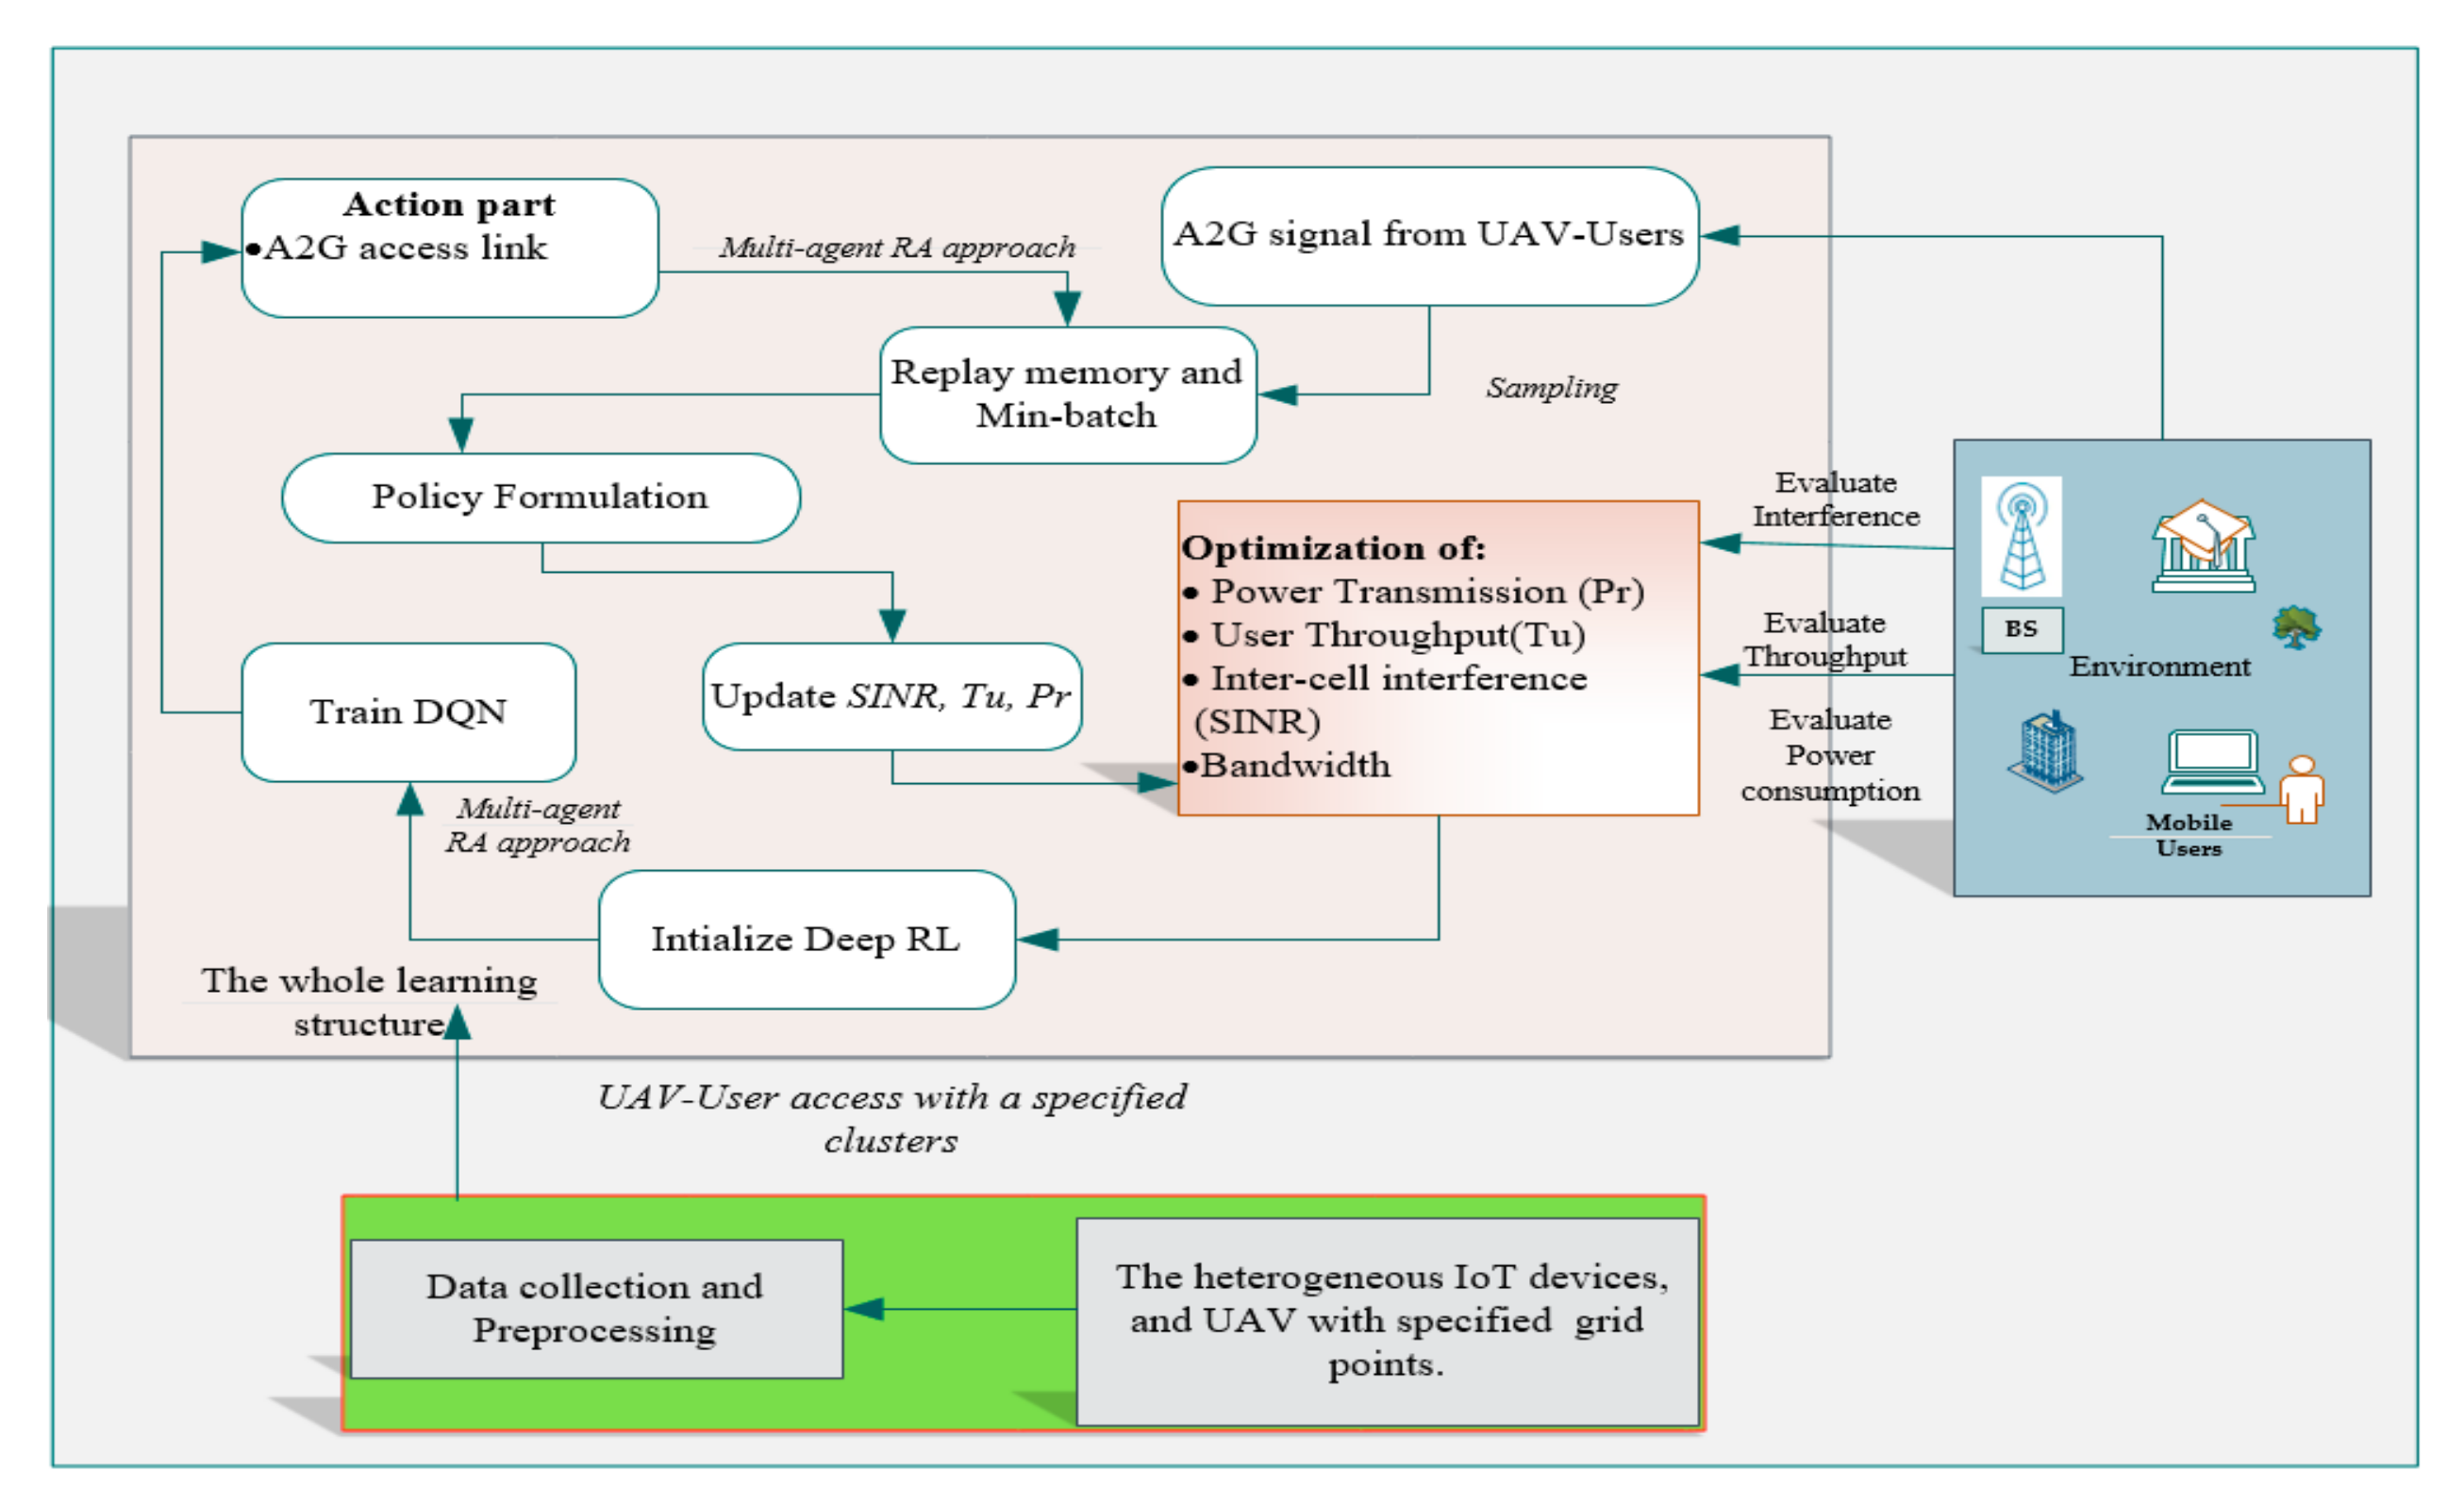
Figure 6 shows the structure of our proposed system. The figure considers the principle of DRL for the RM parameters of power (Pr), throughput (Tu), and SINR. Therefore, we need to correlate the state, environment, action, reward, policy, and training parameters. The format of the figure is as follows. Users and UAVs are regarded as agents. The data collection area of NTUT (500 × 700 m) is the environment. The transmission of the A2G channel allowed for cooperation between users and UAVs, the resources (bandwidth, power, throughput, and SINR) are allocated. Then, each participating agent attempts to assign power with the throughput and management of SINR as an action. When resources are efficiently managed, lower than the threshold, it is a reward. Thus, when the threshold matches the situation, the reward value is effective; otherwise, the reward is zero. The action selection strategy is used to balance exploration and exploitation [
13]. Hence, there may be actions conducted randomly for searching the effects of unknown actions, so it is easier to devise policies.
By compiling all datasets, preprocessing was done. Initially, the DRL algorithm is initialized and trained. Then, the next action component is evaluated based on A2G access links with the multi-agent DRL. Mainly, information is transmitted from the A2G channel for IoT users. Then, the system took samples for policy formulation after saving to a mini-batch to a replay memory. Then, evaluate the capacity of SINR, power and throughput, and average values. Based on the generated results, a new policy is formulated for the next active state. Then, the policy is updated for the optimization of RM. These proposed rotations will have to be conducted until we find the optimal solution. Then, the reward offered to the agent included the average reward values of every agent. If the observable values changed and the value of each reward is more than the threshold, the event is activated. Then, the action and policy are updated by an agent unless the actions are ended.
Generally, when an agent exceeds a given threshold, it learns from the environment for the new solution. Past experiences are used for learning through batch replay memory. Then, based on the previous experiences, the agent randomly picks from the uniformly distributed samples in the batch.
5.4. Evaluation Metrics’
For the accurate evaluation of our proposed system, the evaluation metrics, such as root mean square error (RMSE), precision, and recall are used. The precision and recall can both indicate the accuracy of the model. Consider the proportion of the sum of significant results properly categorized by our proposed model, to evaluate the proportion of significant outcomes, and computed as follows:
where
n is the total forecasted values;
is the real value; and
y is the expected value in terms of the UAV to user altitude. Then,
refers to true positives,
refers to actual values, and
,
and
are the predicted results, false negatives, and positives, respectively.
6. Experimental Results and Discussions
The experimental outcomes are illustrated in this section. The real data collected from the outdoor environment were used for the evaluation as well as analysis of the results. Prepossessing was performed to label each signal record and minimize the number of irrelevant features. Then, an appropriate and structured training dataset for machine training formats was built. The performance of the proposed method is analyzed through different measurement metrics. Then, different parameters, such as the number of epochs, hidden layers and units, types of optimization, and the activation function were adjusted. Our proposed approach was trained using adam optimizer because it is computationally efficient, requires less memory, and minimize noise. Additionally, specific activation functions such as sigmoid, reLU, tanH, and softmax were used to compress the output of the system. As a result, the optimum values were obtained with a batch size of 500, 200 and 250 epochs/iterations, four hidden layers, and 824 hidden units. The classification and testing schemes were executed through the scenarios, which prove the effectiveness of the proposed approach. Accordingly, the comparison of our system performances with other related algorithms based on clusters 1 and 2 scenarios with UAV altitudes of 30 and 60 m were conducted.
Table 4 shows the hardware and software experimental setups for implementing the proposed system. The Keras library of a TensorFlow 3.7 backend with a combination of a variety of deep learning frameworks has been chosen. This is because it is easy to use, has better visualization and has optimized numerical computations.
Figure 7a shows the DRL-based classification evaluation of the real distribution OFDM signal values. Then, it is illustrated through the training and testing evaluation. The OFDM_data values are represented in blue color and range from −40 to −85; the training_set and testing_set values are represented in yellow and green colors, respectively.
Figure 7b shows the clustering of signal distribution. It shows the real distribution of OFDM signal values in terms of user density. The green squares indicate the signal distribution of cluster 1. The black squares show cluster 2’s plotting results. The plotting is performed through the consideration of signal distribution ranges and the LOS/NLOS estimation.
Table 5 shows the performance evaluation of single-agent Q-learning and DRL approaches for clusters 1 and 2. As measurement metrics, accuracy, precision, and recall are used. The evaluation is concerned with the average allocation of throughput, interference management, and power consumption issues. In the Q-learning method, 87.03%, 75.00%, and 80% and 85.00%, 80.01%, and 85.02% are the values for accuracy, precision, and recall cluster 1and cluster 2, respectively. In the DRL method, 94.06%, 88.05%, and 90.01% and 91.2%, 92.00%, and 93.04% are the values for accuracy, precision, and recall in cluster 1 and cluster 2, respectively. Therefore, the evaluation result shows that the performance accuracy is better in DRL evaluation for both clusters for multi-action-based RM optimization in a real and dynamic environment. Thus, multi-agent DRL is better in retrieving relevant features than single-agent Q-learning methods in complex and dynamic environments.
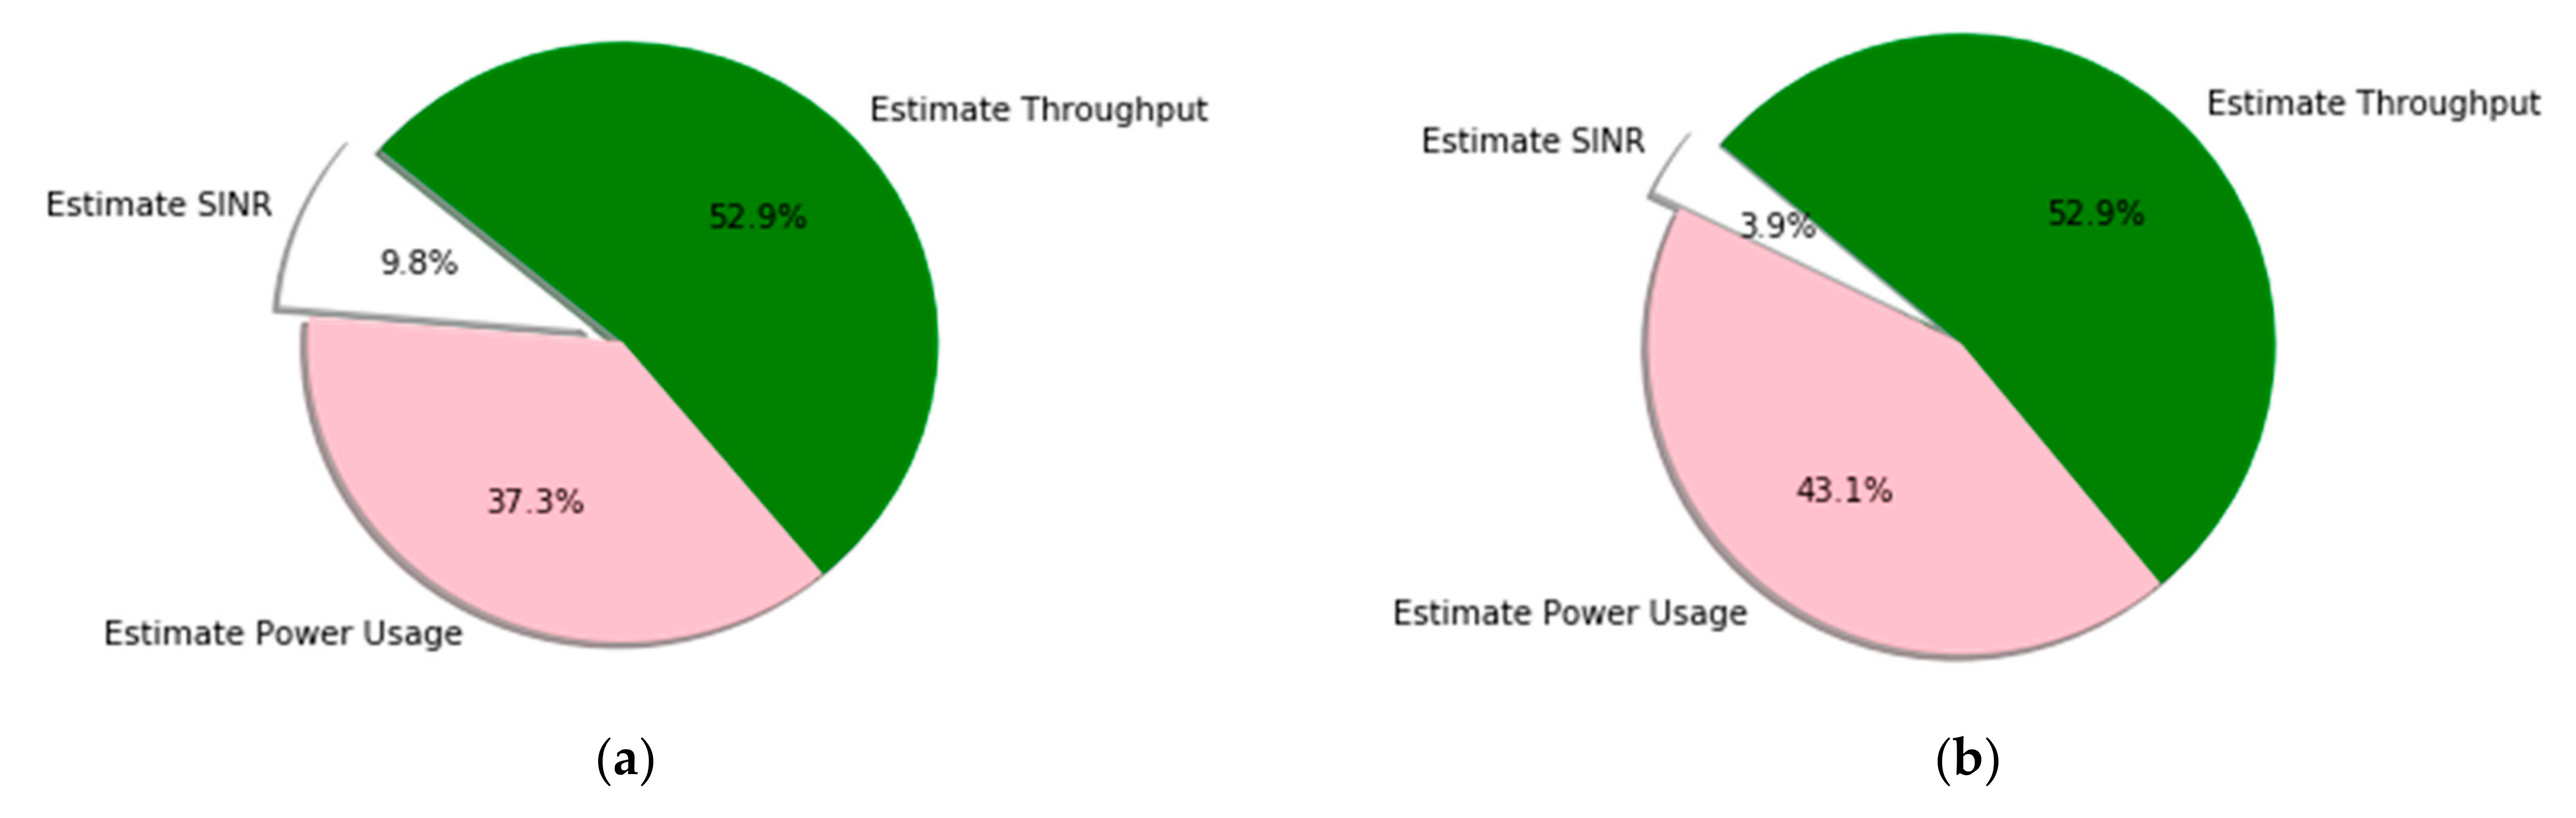
Using pie charts,
Figure 8 shows each resource management scheme and calculates the QoS satisfaction ratio. The figure provides a detailed performance comparison among the resource management parameters, where the results for the DRL method are obtained with different learning updates. The percentage of resource requests for cluster 1 (urban) and cluster 2 (sub-urban) are illustrated in
Figure 8a, b.
Figure 8a accounts for 52.9% of throughput estimation, 37.3% of power consumption estimation, and 9.8% of SINR estimation.
Figure 8b accounts for 52.9% of throughput estimation, 43.1% of power consumption estimation, and 3.9% of SINR estimation. This implies that more resource values are shared between users with the minimum values of power consumption and SINR. The resource management capability of our proposed system with a UAV altitude of 30 m and 60 m, respectively, is illustrated in
Figure 8c,d. When the A2G access link transmission involves 30 m and 60 m altitudes, the management of resources leads to a 31.4% and 90.2% throughput estimation user satisfaction ration, 58.8% and 5.9% power consumption estimation ratio, and 9.8% and 3.9% SINR estimation ratio. Therefore, DRL-based resource management is best when the altitude of the UAV is larger (i.e., 60 m) because its value is automatically changed and it has better performance in terms of user throughput values and lower values of power consumption and SINR. However,
Figure 8e shows the management of resource estimations without applying the scheduling algorithm (i.e. round-robin). Even if the result is not bad, it is lower compared to others. The resource management of user throughput ratio, power consumption estimation ratio, and SINR estimation ratio is 7.8%, 82.4%, and 9.8%, respectively. Therefore, the integration of the DRL system with the round robin scheduling algorithm performs better for the UAV-based IoT user resource management scheme.
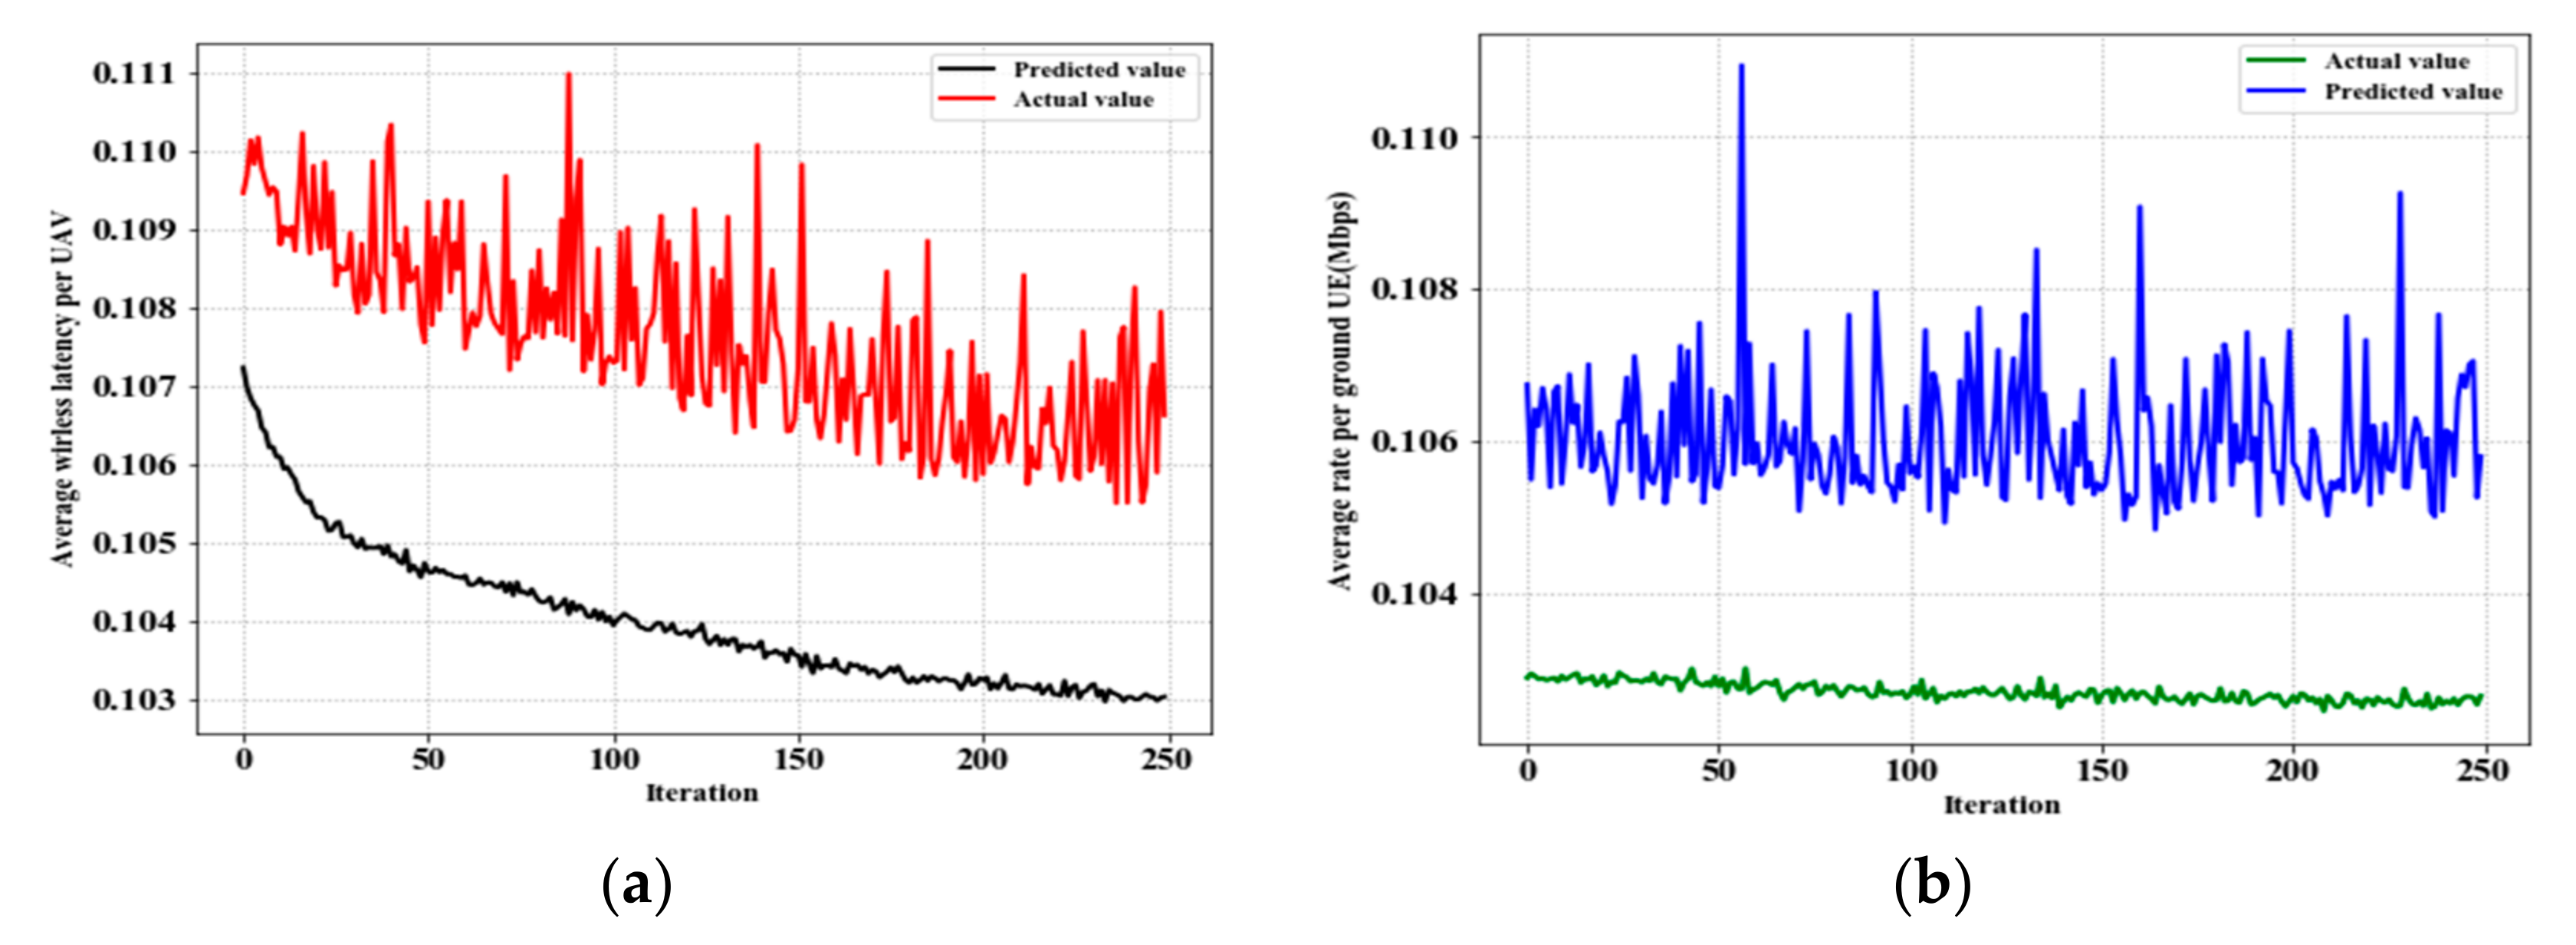
Figure 9a,b evaluates the DRL-based average A2G wireless latency values and the data access rate of A2G IoT user equipment. In the figures, the measurement effects enable us to precisely control the user throughput variance at each reference point. As a result, taking into account UAV heights, the proposed system will accommodate user throughput issues. It handles multiple IoT users with varying UAV altitudes and ranges. Moreover, even when users are shifted, the proposed DRL model can accurately measure user throughput and power consumption rates.
Under different scenarios,
Table 6 shows the user throughput performance, average power consumption, and average SINR distribution with distinct user density. The user throughput value accuracy assessment is estimated to be 0.96, 0.967,0.967,0.97,0.97, and 0.97, respectively, when the user density is 1, 3, 6, 11, 21, and 26. This illustrates that, when user density is increased, it also improves the value of user throughput performance. This shows that the algorithm can manage a large number of IoT users in a dynamic environment. The energy of average consumption is estimated as 0.96, 0.965, 0.967, 0.967, 0.967, and 0.96, when the user density becomes 1, 3, 6, 11, 21, and 26, respectively. From the Tx to the Rx is diminished when the number of IoT users is increased, which means a balance of power usage is maintained. The SINR and user density are also calculated to be 0.96, 0.97, 0.75, 0.96, 0.966, and 0.966 where the user density is 1, 3, 6, 11, 21, and 26, respectively. This demonstrates that, when the number of IoT users is increased, the SINR from a transmitter to a receiver is significantly decreased. The proposed algorithm can handle the interference between a user transmitter or an A2G access channel, even though the result is better as the number of IoT users increase. The performance measurement is then carried out using average user throughput data, average power usage, and average SINR results from the target values of clusters 1 and 2. Therefore, in terms of managing resources for IoT users in each cluster, the proposed framework contributes to better performance.
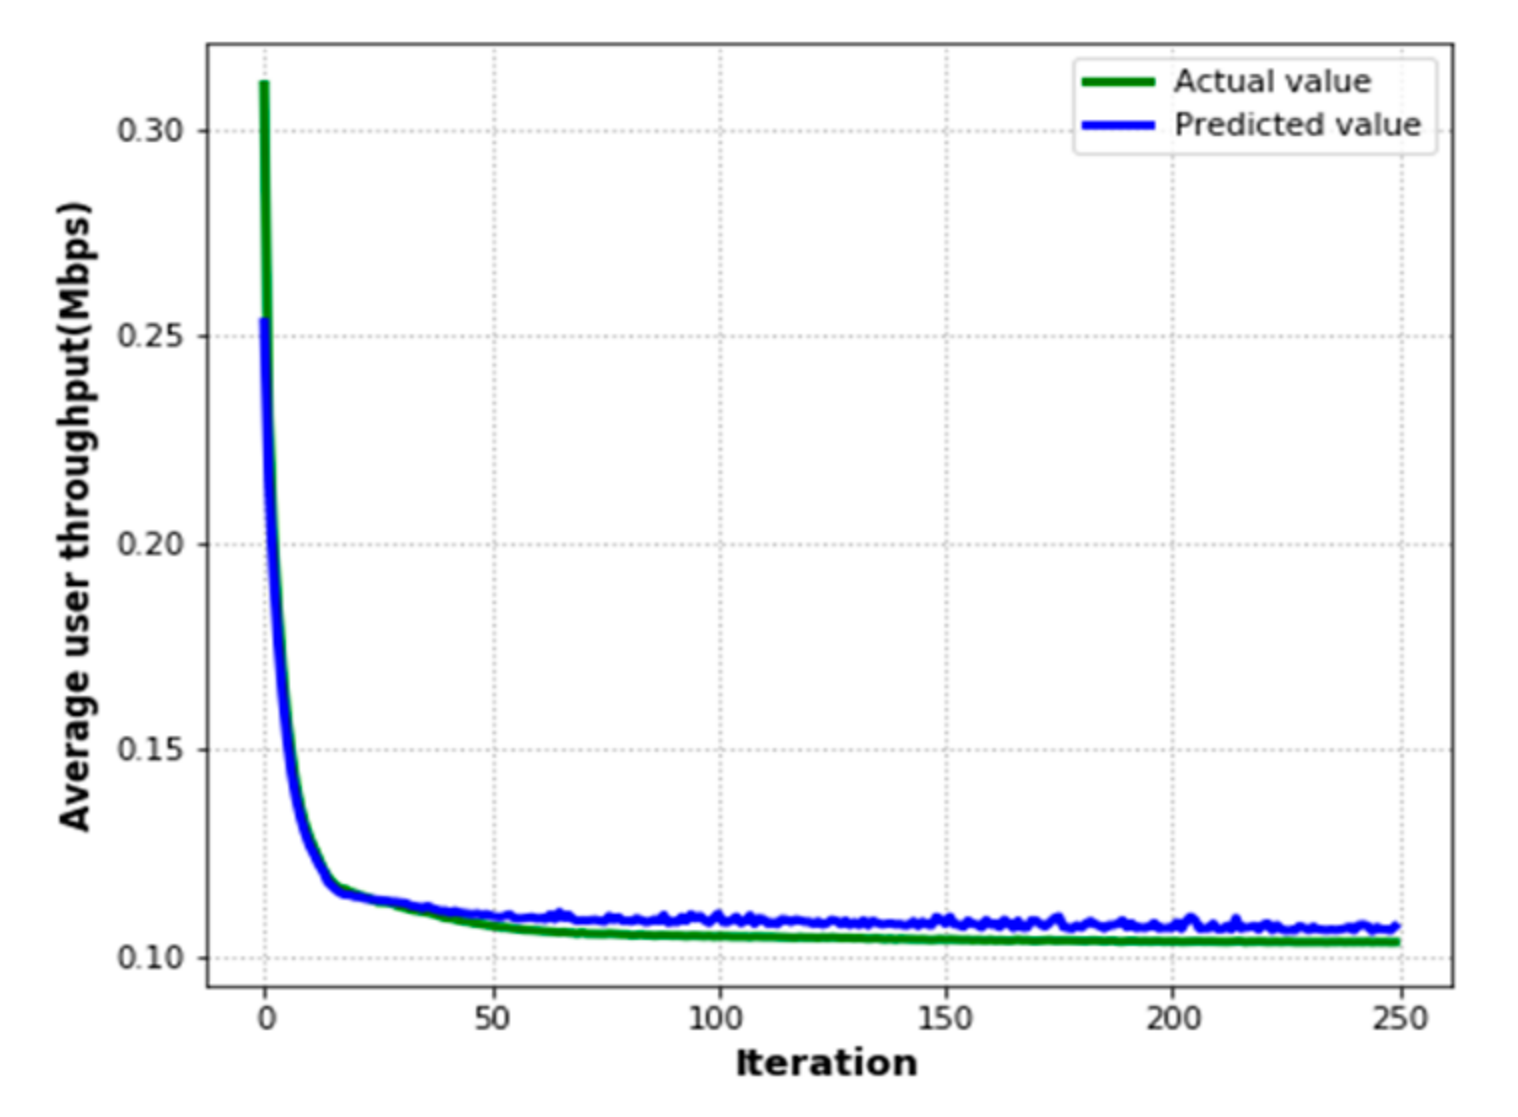
Figure 10 shows the accuracy of the average values for user throughput in the target area based on the DRL method of iterations. As presented in the figure, the real and forecasted throughput values converge rapidly at a value of 0.015 after 20 iterations. Subsequently, the actual values are closely aligned with the expected values. It is feasible that the network cannot be over adapted to the training data.
Table 7 contains the sample performance comparison of our system with previous related works. Previous studies [
22,
29] applied DRL and Q-learning+D3QN algorithms, respectively. At the same time, our work used DRL+K-means and integrated the scheduling algorithm of round robin. The accuracy performance is 87%, 81.3%, and 94% for the specified related works and our proposed method estimation, respectively. The RMSE estimation evaluation indicates 5.2%, 7.33%, and 2.40% for the specified related works and our proposed method estimation, respectively. The testing time is 2.5%, 2.01%, and 1.05% for the specified related works and our proposed method estimation, respectively. Hence, our proposed system outperforms other related works. Compared to the performance in similar scenarios, all the previous methods (i.e., DRL, Q-learning+D3QN) achieved lower system accuracy and RMSE evaluation.
Therefore, our proposed method shows better performance in terms of accuracy and RMSE testing time evaluations. This implies that our system has good generalization ability, low computational time, and adaptability to real and dynamic IoT environments. Furthermore, this indicates that the proposed DRL+K-means+round-robin method has capability in terms of solving large-scale learning problems. Therefore, the testing time of the proposed model is smaller than the other models and this indicates that the proposed model can be trained faster.
7. Conclusions
By applying the DRL, this study focuses on UAV-based resource management on cellular and IoT networks. Initially, we started by identifying the challenges of resource management in IoT networks assisted by UAV-BSs. Then, we reviewed the traditional resource management mechanisms for IoT networks and assessed the usage of DRL techniques for resource management. Subsequently, a multi-agent DRL approach was proposed in order to obtain an efficient resource management method for UAV-assisted IoT communication systems. The resource management algorithm is used to manage the bandwidth, throughput, interference, and power usage issues. First, we looked at the actual data collection setting for joint RM issues. Then, we used a DRL for system development with K-means for clustering as well as round robin for service request queue. To improve the RM scheme, our proposed approach allows for allocating the available resources with UAV to IoT users. Then, with the measurement of accuracy, RMSE and testing time(s), our proposed method was compared to previous works. The proposed system was found to have a 94% RM accuracy with respect to the classification scheme. It achieved RMSE and testing times(s) levels of 2.40% and 1.05s, respectively, for the selected scenarios. Additionally, our method was found to have a better evaluation of precision and recall estimation than the Q-learning approach as 88.05%, 93.04% and 92%, 90.01% for cluster 1 and 2, respectively. Thus, the result demonstrates the well-trained multi-agent DRL learned from sequential features. The proposed method is better for generating optimal policy with low computational complexity than a single-agent-based Q-learning method. Therefore, the proposed DRL model can manage the resource management scheme in dynamic IoT environments. For future work, this study will be expanded to take into account the mobility of users in dynamic environments with a focus on additional resource considerations.


 ,
, 


