Article

Gazing Characteristics of a Driver during Vehicle Backing

1
National Traffic Safety and Environment Laboratory, 7-42-27 Jindaiji-Higashi-machi, Chofu 182-0012, Tokyo, Japan
2
Faculty of System Design, Tokyo Metropolitan University, 6-6 Asahigaoka, Hino-shi 191-0065, Tokyo, Japan
*
Author to whom correspondence should be addressed.
Appl. Sci. 2021, 11(5), 2180; https://doi.org/10.3390/app11052180
Submission received: 19 January 2021 / Revised: 23 February 2021 / Accepted: 25 February 2021 / Published: 2 March 2021
(This article belongs to the Section Mechanical Engineering)

Abstract

:
We investigated a driver’s gazing time during backing vehicle maneuvers in a 90-degree reverse parking system for the phase from start to the 5-m point (start phase) and the phase from backing from the 5-m point to stop (stop phase). The objective of this study was to elucidate the driver’s gaze while approaching the parking area and in the parking area during backing. We used a sport utility vehicle with the driver’s seat at the right-hand side. We modified the vehicle with four technological conditions: no-tech vehicle, sonar vehicle, backup-camera vehicle, and backup camera with sonar vehicle. The monitor, rearview mirror, left-side mirror, and right-side mirror were designated as the area of interest (AOI) in the gaze. For the start phase, there were no significant differences in the total gazing time of all the AOIs in the four technologies. For the stop phase, however, the total gazing time of all the AOIs for the vehicle with a backup camera was significantly longer than that of the vehicle without a backup camera owing to the increase in the gazing time of the monitor. The results obtained from these experiments will form a basis for the future development of vehicle camera systems.

1. Introduction

In 2019, there were 3215 traffic deaths in Japan, and pedestrian deaths accounted for the highest percentage of these deaths at 1176 or 37% of the total [1]. Passive and active safety technologies are employed for pedestrian protection. The type approval vehicle safety regulation for passive pedestrian protection in Japan aims to reduce the risk of pedestrians sustaining head and leg injuries from the impacts of vehicles at 40 km/h [2]. For the pedestrian head protection test in the regulation [2], adult and child headform impactors [3] are impacted on a bonnet at 35 km/h on a stationary test vehicle to evaluate the risk of serious head injury. For the pedestrian leg protection test in the regulation [2], an adult legform impactor [4,5] is impacted on a bumper at 40 km/h to evaluate the risk of knee ligament injuries [6] and tibia fractures [7].
In 2021, Japan is scheduled to introduce technical requirements for automatic emergency braking (AEB) systems for active safety pedestrian protection [8]. New vehicles will be required to be fitted with AEB systems for pedestrian detection to reduce vehicle travel speed before an impact. Tests are conducted with a child dummy walking laterally across a road. This regulation requires a vehicle to be able to stop in front of a pedestrian at speeds of up to 30 km/h, and to reduce the vehicle speed by 15 km/h at the point of collision at speeds of 35–60 km/h. The requirements were chosen based on an accident analysis study, which found that a 10 km/h reduction in impact velocity could reduce the frequency of pedestrian fatalities drastically in cases involving impact velocities ≥ 40 km/h [9].
Thus, Japan currently produces vehicles equipped with AEB systems for pedestrian detection [10,11,12,13]. For visual information, stereo cameras are one kind of sensor used to acquire visual data in AEB systems. Stereo cameras can detect the shape of a pedestrian and measure its distance from a vehicle. Visual data have been used to develop lane change decision aid systems (LCDASs) [14] that comprise cameras and laser radars for detecting obstacles in adjacent rear areas during lane change maneuvers [15]. The distance between an obstacle and the side of the vehicle is measured using laser radar devices, and cameras detect objects to the rear [15]. The main role of current passive and active safety technologies is to reduce pedestrian injuries at relatively high vehicle speeds.
Results from accident analyses using the Japanese traffic accident database indicate that pedestrian fatalities persist at lower vehicle travel speeds [16]. Moving backward is one of the vehicle maneuvers performed at a low vehicle travel speed. Backover accidents by reversing vehicles can cause severe and fatal injuries to pedestrians. Provided that safety devices are installed in vehicles, there are parking sonars and a backup camera to prevent accidents involving pedestrians while vehicles are backing. Conventionally, a sonar is used to detect an obstacle behind a vehicle, such as a wall in the parking area, to prevent contact between the vehicle and the obstacle. The sonar system uses ultrasonic waves emitted from the rear of the vehicle to detect objects behind the vehicle and alert the driver to their presence. Matsui et al. found that parking sensors using ultrasonic waves emitted from the rear bumpers of vehicles can detect humans [17]. Therefore, a sonar is one of the vehicle safety technologies used while backing to prevent backover accidents involving pedestrians. A backup camera is installed on the rear of the vehicle and provides the view of an area behind the vehicle using a monitor.
Presently, no safety requirements have been introduced for vehicle backing accidents in Japan and Europe. The relation between vehicle safety technologies while backing and the behavior of a driver should be clarified to introduce a new safety requirement.
Several researchers employed the eye tracker technology to follow the eye movements of a driver for understanding his/her behavioral characteristics while driving [18,19,20,21,22,23,24]. Hergeth et al. assessed the feasibility of measuring drivers’ automation trust via gaze behavior during highly automated driving with eye tracking using a simulator and concluded a negative relationship between the driver’s self-reported automation trust and monitoring frequency [25]. Using an eye tracker, the effectiveness of a head-up display to increase the safety performance for vehicle-to-vehicle, vehicle-to-pedestrian, and vehicle-to-bicycle was investigated using a simulator in which the head-up display can provide information on the distance between the host vehicle and other road users by changing color [26]. Li et al. designed an in-vehicle eco-safe driving system and confirmed that the eco-safe human–machine interface system did not cause visual distraction during driving in a simulator study focusing on the driver’s glance behavior [27]. Kountouriotis et al. examined the effects of visual distractions during driving using a driving simulator and showed that when the visual task is presented centrally, the driver’s lane deviation decreases [28]. Although many researchers have investigated the driver’s gaze when driving a vehicle in the forward direction, the features of the driver’s gaze during backing remain unclear. When a driver parks a vehicle, the driver can see the parking area by direct vision during forward parking and by indirect vision during reverse parking.
The objective of this study was to elucidate the effect of vehicle safety technology on a driver’s gaze characteristics during backing vehicle maneuvers.
Most vehicle parking in the urban areas of Japan employs the 90-degree reverse parking system, which utilizes the highest space efficiency owing to the limited size of land [29]. An example of vehicles parked in reverse in Japan is shown in Figure 1. In the 90-degree reverse parking system, the vehicle initially moves forward with a slight right turn and then stops (Figure 1a); then, it restarts backing rearward until it stops in the parking area (Figure 1b). In the present study, we focused on the driver’s gaze while the vehicle is backing rearward (Figure 1b) using a test vehicle.
For vehicles not equipped with a rear camera, it is unclear what the driver is looking at through the rearview mirror. Even when a rear camera is installed, it is unclear how long the driver uses the monitor, if at all, and whether they are also using the conventional rearview mirror. In other words, if there is a monitor in the cabin of a vehicle, it is unclear whether the driver needs conventional rearview mirrors during backing. Therefore, in the present study, we conducted an experiment using a real vehicle to clarify which mirrors drivers use, and for how long they use them, during vehicle reversal. Similarly, in the case of a vehicle with a rear camera, we investigated how long drivers spend looking at the dashboard monitor. These outcomes will offer basic information to understand a driver’s psychology and influence the design of vehicles and parking areas.
In the present study, we investigated the features of the driver’s gaze while backing using an eye tracker. We employed four conditions for vehicle safety technology: no-tech vehicle (NT-V), sonar vehicle (S-V), backup-camera vehicle (BC-V), and backup camera with sonar vehicle (BCS-V).

2. Materials and Methods

2.1. Volunteers for Driver

In the experiment, the volunteers were instructed to back the vehicle into the parking area according to the driving operation, as shown in Figure 1b. Fourteen people (9 women and 5 men) participated in the experiment as drivers. The average age of the volunteers was 44.6 years (standard deviation of 7.8 years). Seven volunteers drove every day, while the rest drove 2–3 times a week. The test protocol employing volunteers in the present study was approved by the ethical committee of the National Traffic Safety and Environment Laboratory (NTSEL) in Japan.

2.2. Test Vehicle

The test vehicle used was a sport utility vehicle (SUV) equipped with sonar parking sensors and a backup camera, which met the sonar detection area specified in the ISO 17386 Transport information and control systems—Maneuvering Aids for Low Speed Operation (MALSO) [17]; for instance, the ISO center detection area was between 200 and 1000 mm from the rear face of the vehicle in the vehicle width [30]. The test vehicle was a Japanese SUV manufactured in 2015, and the driver’s seat was on the right side. The total engine displacement was 1997 cc, and the total length, width, and height were 4540, 1840, and 1705 mm, respectively. Using off-switch functions, the test vehicle was modified under four technological experimental conditions, namely NT-V, S-V, BC-V, and BCS-V. In the experiment, a volunteer drove the test vehicle once in each technological experimental condition.

2.3. Parking Area

The length of the parking area used in the present study was 4990 mm. In the experiment, wheel stoppers were placed in the parking area. A baseline was defined as the rear end line of the vehicle when the rear tires of the vehicle were in contact with the wheel stoppers, as shown in Figure 2. A pipe recommended by ISO to investigate the detection range of sonar [30] was used. The dimensions of the pipe, made of polyvinyl chloride (PVC), were 1 m and 75 mm (height and diameter, respectively). The pipe was placed on the baseline at a position corresponding to the center between the center sensor and corner sensor on the rear bumper of the driver side of the test vehicle, which was 500 mm from the center of the vehicle widthwise, as shown in Figure 2.

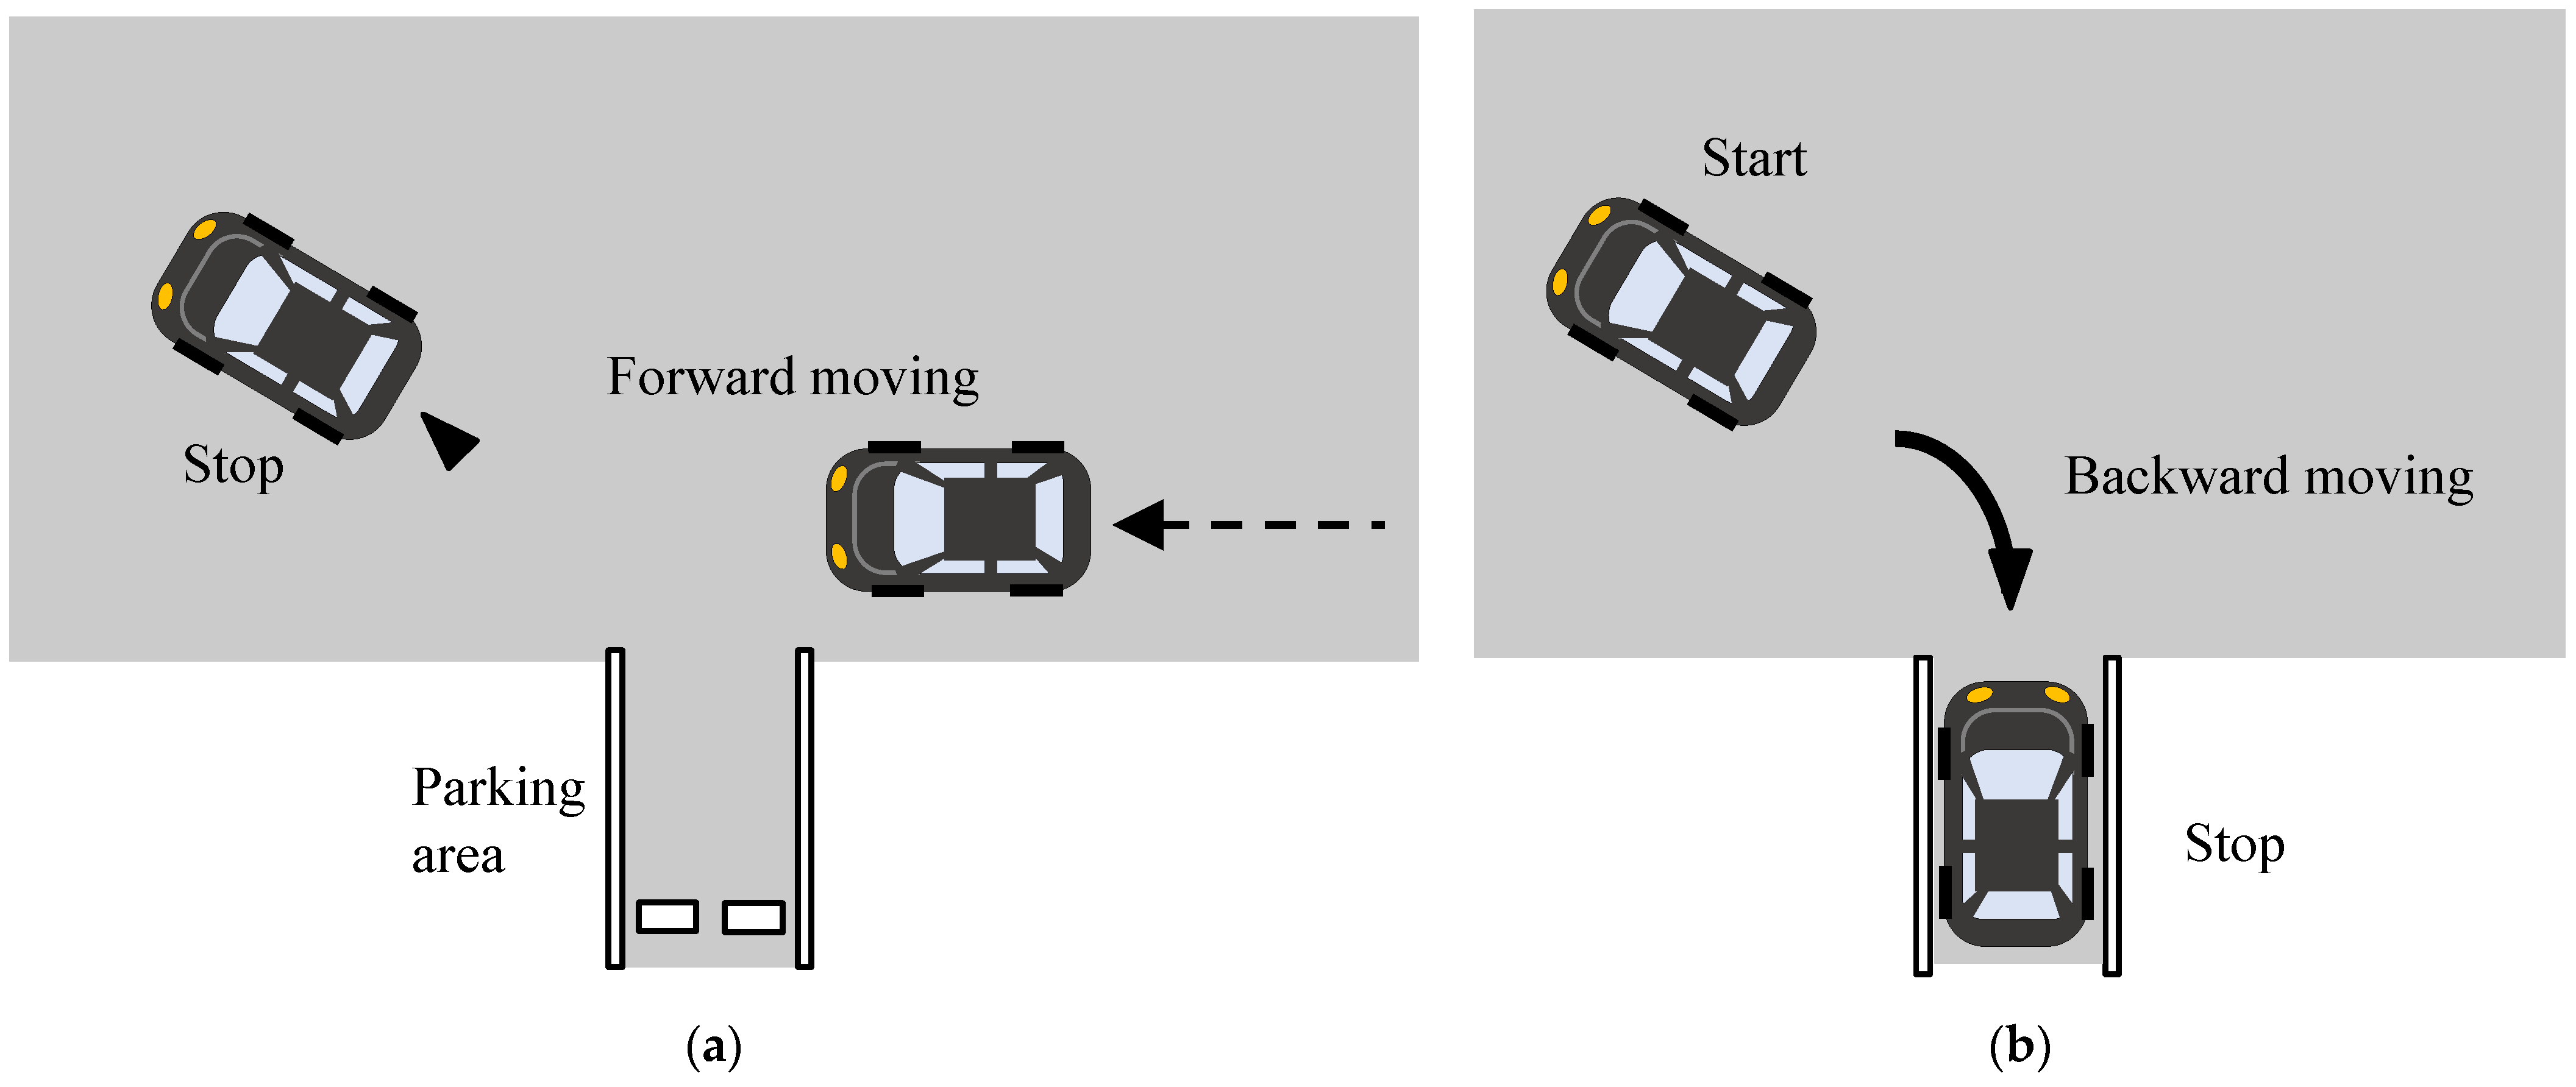
2.4. Experimental Backing Procedure

The initial position of the test vehicle is shown in Figure 3. The tilt angle was 25°, and the distance from the vehicle to the parking area was set to ensure easy reversing operation for drivers. In this experiment, a volunteer backed the test vehicle from this initial position to the parking area, as shown in Figure 1b.
The vehicle position was measured using a global positioning system (GPS) receiver (VGVS SP5Ci, VIOS Inc., Shizuoka, Japan) installed on the roof of the vehicle. An example of the vehicle positions during backing is shown in Figure 4. Since the length of the parking area was approximately 5 m (4990 mm) in this study, we divided the vehicle positions into two: the phase from the start to the 5-m point (start phase) and the phase from backing from the 5-m point to stop (stop phase) to clarify the driver’s gaze while approaching the parking area and in the parking area during backing.

2.5. Drivers’ Gaze in the Area of Interest

While driving, a driver observes everything, including the roads; hence, we needed to specify the gaze area for the current analyses, the so-called area of interest (AOI). In this study, four locations were designated as AOIs: (1) monitor, (2) rearview mirror, (3) left-side mirror, and (4) right-side mirror. The AOI specified in this present study is shown in Figure 5. We investigated the total gaze time at the start phase and stop phase, defined as the “gaze time” for the respective driving locations. For instance, when a driver gazed at one AOI (e.g., monitor) several times during backing, the total gaze time for the AOI was analyzed.
The gaze situation of the volunteers during the driving operation was investigated by asking them to wear gaze examination glasses. An eye tracking device (Tobii Pro Glasses 2, Tobii Technology Inc., Danderyd, Sweden) was used to record volunteers’ eye movements at 100 Hz [31,32]. The glasses were equipped with eye tracking sensors to record the position of the eye gaze and a scene camera to capture the field of view of the drivers. Using the analysis software (Tobii Pro Lab, Tobii Technology Inc.), the data of whether drivers looked at each AOI were obtained in CSV format. These data were displayed as a time-series, and the gaze time for each AOI was inferred.
Some volunteers gazed at a specific AOI (e.g., rearview mirror), while others did not. Therefore, among the 14 drivers, the percentage of those who used a specific AOI during reversing was defined as the AOI usage rate. For example, if there were 7 volunteers using the rearview mirror, the usage rate was 50%.
To clarify the driver’s gaze characteristics while driving backwards at each driving location, we performed the following analyses.
  • Significant difference in the average gazing time of all the subjects in each AOI in the given technology between the start and stop phases.
  • Significant difference in the AOI usage rate in the given technology between the start and stop phases.
  • Significant difference in the average gazing time of all the subjects between the two given technologies for the start phase.
  • Significant difference in the average gazing time of all the subjects between the two given technologies for the stop phase.

3. Results

Figure 6 shows an example of the distance series of an AOI gaze plot for (a) NT-V, (b) S-V, (c) BC-V, and (d) BCS-V, measured from one volunteer. When a driver drove NT-V and S-V, the driver mainly gazed at the left-side mirror for the start phase, and the right-side mirror for the stop phase; when driving BC-V and BCS-V, the driver mainly gazed at the left-side mirror for the start phase and the monitor and right-side mirror for the stop phase. The driver did not use the rearview mirror for any phase under the four technological conditions.
The significant differences in the average gazing time of all the volunteers in each AOI in the given technology between the start and stop phases are indicated in Table 1. Figure 7 shows the gazing time ratio of individual AOIs compared to all AOIs. For example, for the start phase, it is shown that the gaze time for the left-side mirror (5.57 s) was 83% of the total AOI (6.67 s) for the NT-V. For the start phase, the gazing time of the left-side mirror was the longest among the AOIs when drivers drove all types of vehicle technologies. For the stop phase, when drivers drove NT-V and S-V, the gazing time on the right-side mirror was the longest, and when they drove BC-V and BCS-V, the gazing time on the monitor was the longest among the AOIs.
When drivers drove NT-V, the gazing time of the left-side mirror for the start phase (5.57 s) was significantly longer than that for the stop phase (2.32 s). The gazing time of the right-side mirror for the start phase (0.78 s) was significantly shorter than that for the stop phase (5.06 s). When they drove S-V, a similar trend as that obtained for the NT-V was observed. The gazing time of the left-side mirror for the start phase (5.49 s) was significantly longer than that for the stop phase (2.54 s). The gazing time of the right-side mirror for the start phase (0.54 s) was significantly shorter than that for the stop phase (4.57 s). These results indicate that when drivers drove a vehicle without a backup camera (NT-V or S-V), they mainly used the left-side mirror for the start phase, and both the right-side mirror and the left-side mirror for the stop phase.
When drivers drove BC-V, the gazing time of the monitor for the start phase (2.89 s) was significantly shorter than that for the stop phase (9.70 s). The gazing time of the left-side mirror for the start phase (3.37 s) was longer than that for the stop phase (1.10 s), but there was no significant difference. The gazing time of the right-side mirror for the start phase (0.49 s) was significantly shorter than that for the stop phase (2.32 s). For BCS-V, a similar trend as that obtained for BC-V was observed. The gazing time of the monitor during the start phase (2.15 s) was significantly shorter than that for the stop phase (8.44 s). The gazing time of the left-side mirror for the start phase (3.85 s) was significantly longer than that for the stop phase (1.31 s). The gazing time of the right-side mirror for the start phase (0.30 s) was significantly shorter than that for the stop phase (2.13 s). These results indicate that when drivers drove a vehicle with a backup camera (BC-V or BCS-V), they mainly used the left-side mirror together with a monitor for the start phase, and they mainly used a monitor in addition to the right-side mirror for the stop phase.
Table 1 also presents the significant difference in the average total gazing time of all AOIs in each type of vehicle. For instance, for NT-V and S-V, the total gazing time of all AOIs consists of three types of mirrors (the rearview mirror, left-side mirror, and right-side mirror). For BC-V and BCS-V, the total gazing time of all AOIs consists of a monitor and three types of mirrors. For NT-V, there was no significant difference in the total gazing time of all AOIs between the start phase (6.67 s) and the stop phase (7.48 s). For S-V, there was no significant difference in the total gazing time of all AOIs between the start phase (6.24 s) and the stop phase (7.15 s). On the contrary, for BC-V, the total gazing time of all AOIs for the stop phase (13.12 s) was significantly longer than that for the start phase (6.79 s). Furthermore, for BCS-V, the total gazing time of all AOIs for the stop phase (11.89 s) was significantly longer than that for the start phase (6.37 s). The reason for the longer total gazing time of all AOIs for BC-V and BCS-V is possibly because of the use of a monitor in the vehicle with a backup camera.
Table 2 presents the significant difference in the AOI usage rate in each technology between the start and stop phases. For NT-V, all the drivers used the left-side mirror in both the phases. The rate of using the right-side mirror for the stop phase (93%) was higher than that for the start phase (64%). However, there was no significant difference between them (93% and 64%); the p-value was close to the 5% level (p = 0.065). For S-V, most of the drivers used the left-side mirror in the start phase (100%) and stop phase (93%). The rate of using the right-side mirror for the stop phase (100%) was significantly higher than that for the start phase (57%). For BC-V, the rate of using the monitor for the stop phase (100%) was significantly higher than that for the start phase (57%). The rate of using each mirror was not significantly different in the two phases. For BCS-V, the rate of using a monitor for the stop phase (100%) was higher than that for the start phase (79%). However, no significant difference was observed between them (100% and 79%); the p-value was also close to the 5% level (p = 0.067). The rate of using the right-side mirror for the stop phase (93%) was significantly higher than that for the start phase (57%).
For the start phase, the significant difference in the average gazing time of all the subjects between the given technologies is presented in Table 3. The table presents six comparisons between the two given vehicle technologies. In the comparison between NT-V and S-V (comparison No.1), the gazing time of each mirror was similar, and there was no significant difference between them. In the comparison between NT-V and BC-V (comparison No.2), the gazing time of the rearview mirror for BC-V (0.03 s) was significantly shorter than that for NT-V (0.33 s). The gazing time of the left-side mirror for BC-V (3.37 s) was significantly shorter than that for NT-V (5.57 s). The gazing time of the right-side mirror for BC-V (0.49 s) was shorter than that for NT-V (0.78 s). Comparing NT-V with BCS-V (comparison No. 3), the gazing time of each mirror for BCS-V was shorter than that for NT-V. Comparing between S-V and BC-V (comparison No. 4), and between S-V and BCS-V (comparison No. 5), the same trend as the results obtained in the gazing characteristics between NT-V and BCS-V (comparison No. 3) was observed. Comparing BC-V with BCS-V (comparison No. 6), each of the gazing times of the monitor and that of each mirror was similar, and there was no significant difference between them.
Table 3 also presents the significant difference in the total gazing time of all AOIs between the given technologies for the start phase. There were no significant differences among the four technologies.
For the stop phase, the significant difference in the average gazing time of all the subjects between the given technologies is presented in Table 4. While comparing NT-V with S-V (comparison No. 1), the gazing time of each mirror was similar, and no significant difference between them was observed. When comparing NT-V and BC-V (comparison No. 2), the gazing time for BC-V was shorter for the left-side and right-side mirrors than that for NT-V. There was a significant difference in the gazing time of the right-side mirror between NT-V and BC-V. In the comparisons between NT-V and BCS-V (comparison No. 3), between S-V and BC-V (comparison No. 4), and between S-V and BCS-V (comparison No. 5), the same trend as the results observed in the gazing characteristics between NT-V and BC-V (comparison No. 2) was observed. In the comparison between BC-V and BCS-V (comparison No. 6), each of the gazing time of the monitor and that of each mirror was similar, and there was no significant difference between them.
Table 4 also presents the significant difference in the total gazing time of all AOIs between the given technologies for the stop phase. For the total gazing time of all AOIs, there were no significant differences between NT-V and S-V (comparison No. 1) and between BC-V and BCS-V (comparison No.6). On the other hand, the total gazing time of all AOIs for the vehicle with a backup camera (BC-V and BCS-V) was significantly longer than that of the vehicle without a backup camera (NT-V and S-V) (comparison Nos. 2, 3, 4, and 5).

4. Discussion

For the start phase, when drivers drove a vehicle without a backup camera, the average gazing time of the left-side mirror was the longest (NT-V: 5.57 s, S-V: 5.49 s) among the AOIs, as presented in Table 1. The results indicate that drivers mainly used the left-side mirror to check the location of the parking area in this experimental setup. When drivers drove vehicles equipped with a backup camera, the average gazing time of the left-side mirror was the longest (BC-V: 3.37 s, BCS-V: 3.85 s), followed by that of the monitor (BC-V: 2.89 s, BCS-V: 2.15 s). In the vehicles equipped with a backup camera, the drivers mainly used the left-side mirror in addition to the monitor while approaching the parking area. This implies that the left-side mirror might be more efficient in identifying the location of the parking area compared with the monitor when the driver is moving the vehicle backward in a tilted angle. Conventionally, when a driver recognizes a parking area while approaching, for example, a vehicle parked next to the parking area can be a good marker. Here, the image reflected on the left-side mirror and the monitor was investigated using an orange-colored pole as a marker instead of a vehicle parked next to the parking area to avoid impact between vehicles. When a vehicle stopped to change from forward to backward motion, as shown in Figure 8ai, the left-side mirror reflected the pole and vehicle body side. The driver could grasp the approximate distance between the pole and vehicle body side, as shown in Figure 8aii. However, the monitor reflected the pole but not the vehicle body side, as shown in Figure 8aiii, where the driver could not grasp the approximate distance between them. When the backing vehicle was at the entry edge of the parking area, as shown in Figure 8bi, the left-side mirror still reflected the pole and vehicle body side as shown in Figure 8bii. However, the monitor did not reflect both, as shown in Figure 8biii. This is considered to be a result of the increase in the gazing time of the left-side mirror, even though the vehicle had a monitor.
For the stop phase, when drivers drove a vehicle without a backup camera, the average gazing time of the right-side mirror was the longest (NT-V: 5.06 s, S-V: 4.57 s), followed by that of the left-side mirror (NT-V: 2.32 s, S-V: 2.54 s) as presented in Table 1. This is possibly because the right-side mirror was located closer to a driver seated on the right-hand side of the test vehicle. When drivers drove vehicles with a backup camera, the average gazing time of the monitor was the longest (BC-V: 9.70 s, BCS-V: 8.44 s), followed by the right-side mirror (BC-V: 2.32 s, BCS-V: 2.13 s). In the parking area, the driver is more likely to perform backing by looking at the monitor rather than at the right-side mirror because the driver can see a sufficient area straight behind the vehicle, as shown in Figure 9. The Tokyo Metropolitan Public Corporation for Road Improvement and Management (TMPC) investigated the features of actual traffic accidents in parking lots in Japan. They pointed out that during backing maneuvers under the 90-degree reverse parking system, the crossing of a moving vehicle and a pedestrian’s trajectories in a parking lot caused accidents [33]. By using the monitor while backing a vehicle, the driver can easily notice a pedestrian walking through just behind the vehicle in the parking area. The backup camera can be very effective in preventing such collision accidents involving pedestrians during vehicle backing maneuvers.
In this study, we investigated the time spent looking at the mirrors and rearview monitor during vehicle reversal. The results revealed that when a rear camera was installed in a vehicle, the total gaze time increased for all AOIs. This leads to an increase in the time spent checking behind the vehicle during backing, thereby improving safety. However, as a limitation of the present study, the projected range of the rear camera was not investigated. In the United States, it became mandatory to install rear cameras in 2018. The projected range is required to be 3 m in width and 6 m behind the vehicle (United States Federal Motor Vehicle Safety Standard (FMVSS) 111) [34]. On the contrary, in Japan and Europe, there are no restrictions on vehicle rear visibility requirements. In the future, the camera range should be examined to investigate whether the rear visibility requirements of FMVSS111 are suitable for Japanese parking environments, e.g., 90-degree reverse parking systems.
Vehicle safety equipment, such as a rearview mirror, is required by the Ministry of Land, Infrastructure, Transport and Tourism (Japan) to ensure the safety of vehicles traveling on public roads. In the present methodology, we designated the rearview mirror and the left- and right-side mirrors as AOIs because they are safety equipment enabling drivers to view behind their vehicles. In addition, in the case of a vehicle equipped with a rear camera, the monitor is also an AOI, and these monitors will become vehicle safety equipment if the installation of a rear camera becomes mandatory. Thus, the main aim of this study was to clarify the necessity of vehicle safety equipment by investigating mirror and monitor gazing time during reversing. On the contrary, to understand the psychological state of distracted drivers, it is necessary to investigate time spent gazing at others, such as the road and other vehicles parked in the parking lot. In an actual parking environment, a pedestrian may walk around a backing vehicle; therefore, investigating the gaze under more realistic parking conditions, such as using a pedestrian dummy and other vehicles to add AOIs, is necessary in the future.
In this study, we analyzed the gaze time of AOIs during the start and stop phases while reversing. To understand the process of backing in greater detail, it is important to investigate the sequence of AOI gazes. In the future, it will also be necessary to investigate the relationship between the sequence of gazes and the gaze time.
For BC-V, drivers gazed at the monitor on the dashboard and sometimes watched the side mirrors attached to both doors. Because the monitor was installed on the dashboard with the left side from the steering wheel and the side mirrors were attached outside the vehicle, it would take time to move the driver’s gaze from the side mirror to the monitor due to the distance between them. Recently, a camera monitor system that displays the rear view of the vehicle from the position of the side mirrors has been developed, and has recently been used; for instance, Toyota has developed digital side-view monitors, in which the conventional mirror is replaced with electronic mirrors using small cameras, and the projected monitors are located inside the vehicle cabin [35]. One of the advantages of the digital side-view monitors is the shortened time required to move the driver’s gaze. In the future, checking a vehicle’s rear view more efficiently using a system that displays images from the rearview images from the sides and the rear of the vehicle on one monitor will be possible.
All volunteers parked the test vehicle (SUV) in the parking area successfully. One of the factors considered for this is that the average age of the volunteers was relatively in the middle-age group (average: 44.6 years, standard deviation: 7.8 years), and many volunteers drive minivans or SUVs daily. We conducted the present experiments during the day, so volunteers could recognize the white lines that serve as a parking frame. We would expect increased monitor gaze time at night. In the future, we plan to carry out similar experiments by increasing the number of volunteers and including older people. Furthermore, it will be necessary to investigate the behavior of drivers while backing in the dark.

5. Conclusions

In this study, we investigated the drivers’ gazing time during a backing maneuver in the 90-degree reverse parking system. We used a Japanese SUV with the steering wheel at the right-hand side. We modified the vehicle with the following four technological conditions: no-tech vehicle (NT-V), sonar vehicle (S-V), backup-camera vehicle (BC-V), and backup camera with sonar vehicle (BCS-V). The gazing time of the drivers was investigated from start to the 5-m point (start phase) and the phase from backing from the 5-m point to stop (stop phase) to elucidate the driver’s gaze while approaching the parking area and in the parking area during backing. The following conclusions are drawn from the findings of this study.
  • In the comparison between NT-V and S-V, the results indicated that the average total gazing time of each mirror was similar, and there was no significant difference between them for the start phase and stop phase. The same trend was seen in the comparison between BC-V and BCS-V. Thus, the gazing time during backing maneuvers was not influenced by the presence or absence of sonars.
  • For the start phase, the average gazing time of the left-side mirror was the longest among the AOIs when drivers drove all types of vehicle technologies. For the stop phase, when drivers drove a vehicle without a backup camera (NT-V and S-V), the gazing time on the right-side mirror was the longest, and when they drove vehicles with a backup camera (BC-V and BCS-V), the gazing time on the monitor was the longest among the AOIs.
  • For the start phase, there were no significant differences in the total gazing time of all AOIs in the four technologies. For the stop phase, however, the total gazing time of all AOIs for the vehicle with a backup camera (BC-V and BCS-V) was significantly longer than that of the vehicle without a backup camera (NT-V and S-V) owing to the increase in the gazing time of the monitor.
  • The results obtained from the present experiments can contribute to the development of a vehicle camera system that combines the left- and right-side mirror cameras and the rear camera into one screen.

Author Contributions

Conceptualization, Y.M.; investigation, S.O.; writing-original draft, Y.M.; writing-review and editing, S.O. All authors have read and agreed to the published version of the manuscript.

Funding

This research was funded by the Ministry of Land, Infrastructure, Transport and Tourism (MLIT), Japan in 2017.

Institutional Review Board Statement

Not applicable.

Informed Consent Statement

Informed consent was obtained from all subjects involved in the study.

Data Availability Statement

No new data were created or analyzed in this study. Data sharing is not applicable to this article.

Acknowledgments

None.

Conflicts of Interest

The authors declare no conflict of interest.

References

  1. Annual Traffic Accident Report in 2019; Institute for Traffic Accident Research and Data Analysis of Japan (ITARDA): Tokyo, Japan, 2020. (In Japanese)
  2. Japan Automobile Standards Internationalization Center (JASIC). Test for protection of heads and legs of pedestrians, TRIAS18-J099(2)-01. In Automobile Type Approval Handbook for Japanese Certification; JASIC: Tokyo, Japan, 2013. [Google Scholar]
  3. Matsui, Y.; Tanahashi, M. Development of JAMA—JARI pedestrian headform impactor in compliance with ISO and IHRA standards. Int. J. Crashworthiness 2014, 9, 129–139. [Google Scholar] [CrossRef]
  4. Matsui, Y. Safety assessment characteristics of pedestrian legform impactors in vehicle-front impact tests. Accid. Anal. Prev. 2014, 73, 65–72. [Google Scholar] [CrossRef] [PubMed]
  5. Mizuno, K.; Ueyama, T.; Nakane, D.; Wanami, S. Comparison of responses of the Flex-PLI and TRL legform impactors in pedestrian tests. SAE Int. J. Passeng. Cars–Mech. Syst. 2012, 5, 203–213. [Google Scholar] [CrossRef]
  6. Matsui, Y. New injury reference values determined by TRL legform impactor from accident reconstruction test. Int. J. Crashworthiness 2003, 8, 179–188. [Google Scholar] [CrossRef]
  7. Matsui, Y. Biofidelity of TRL legform impactor and injury tolerance of human leg in lateral impact. Stapp Car Crash J. 2001, 45, 495–510. [Google Scholar] [PubMed]
  8. Japan Automobile Standards Internationalization Center (JASIC). Test for advanced emergency braking systems of passenger motor vehicle, etc., TRIAS12-R152-01. In Automobile Type Approval Handbook for Japanese Certification; JASIC: Tokyo, Japan, 1999; Available online: https://www.jasic.org/e/index_e.htm (accessed on 10 February 2021).
  9. Matsui, Y.; Oikawa, S.; Ando, K. Risks of pedestrian serious injuries and fatalities associated with impact velocities of cars in car-versus-pedestrian accidents in Japan. Stapp Car. Crash J. 2013, 57, 201–217. [Google Scholar]
  10. Shibata, E. Development of driving assist system “EyeSight” by new stereo camera. J. Soc. Automot. Eng. Jpn. 2009, 63, 93–98. (In Japanese) [Google Scholar]
  11. Kuzumaki, S. Our approach to a safe sustainable society. J. Soc. Automot. Eng. Jpn. 2009, 63, 11–19. (In Japanese) [Google Scholar]
  12. Sekiguchi, M. Introduction of SUBARU advanced driving system “EyeSight ver.2”. In Proceedings of the Safety Engineering Symposium, Tokyo, Japan, 7 July 2011; The Japan Society of Mechanical Engineers: Tokyo, Japan, 2011. (In Japanese). [Google Scholar]
  13. Makabe, S. Active safety system new eyesight version 2. J. Soc. Automot. Eng. Jpn. 2012, 66, 88–93. (In Japanese) [Google Scholar]
  14. Chung, E.; Jung, H.; Lee, I. Vehicle detection algorithm for lane change decision aid system. In SAE Technical Paper 2006–01–0570; SAE: Detroit, MI, USA, 2006. [Google Scholar] [CrossRef]
  15. Tsuji, M.; Yamada, K.; Koreishi, J. The obstacle warning system in adjacent rear area. IEICE PRMU 1997, 97, 33–38. (In Japanese) [Google Scholar]
  16. Matsui, Y.; Oikawa, S. Situational characteristics of fatal pedestrian accidents involving vehicles traveling at low speeds in Japan. Traffic Inj. Prev. 2019, 20, S1–S6. [Google Scholar] [CrossRef] [Green Version]
  17. Matsui, Y.; Hosokawa, N.; Oikawa, S. Pedestrian detection during vehicle backing maneuvers using ultrasonic parking sensors. Stapp. Car Crash J. 2019, 63, 343–358. [Google Scholar]
  18. Maciej, J.; Vollrath, M. Comparison of manual vs. speech-based interaction with in-vehicle information systems. Accid. Anal. Prev. 2009, 41, 924–930. [Google Scholar] [CrossRef]
  19. Shahar, A.; Loon, E.; Clarke, D.; Crundall, D. Attending overtaking cars and motorcycles through the mirrors before changing lanes. Accid. Anal. Prev. 2012, 44, 104–110. [Google Scholar] [CrossRef] [PubMed]
  20. Lehtonen, E.; Lappi, O.; Koskiahde, N.; Mansikka, T.; Hietamäki, J.; Summal, H. Gaze doesn’t always lead steering. Accid. Anal. Prev. 2018, 121, 268–278. [Google Scholar] [CrossRef] [Green Version]
  21. Gaspar, J.; Ward, N.; Neider, M.; Crowell, J.; Carbonari, R.; Kaczmarski, H.; Ringer, R.; Johnson, A.; Kramer, A.; Loschky, L. Measuring the useful field of view during simulated driving with gaze-contingent displays. Hum. Factors 2016, 58, 630–641. [Google Scholar] [CrossRef] [Green Version]
  22. Petermeijera, S.; Cielerb, S.; Winter, J. Comparing spatially static and dynamic vibrotactile take-overrequests in the driver seat. Accid. Anal. Prev. 2017, 99, 218–227. [Google Scholar] [CrossRef] [PubMed]
  23. Lemonnier, S.; Brémond, R.; Baccino, T. Gaze behavior when approaching an intersection: Dwell time distribution and comparison with a quantitative predictions. Transp. Res. Part F Traffic Psych. Behav. 2015, 35, 60–74. [Google Scholar] [CrossRef]
  24. Sun, Q.; Xia, J.; He, J.; Foster, J.; Falkmer, T.; Lee, H. Towards unpacking older drivers’ visual-motor coordination: A gaze-based integrated driving assessment. Accid. Anal. Prev. 2018, 113, 85–96. [Google Scholar] [CrossRef] [PubMed]
  25. Hergeth, S.; Lorenz, L.; Vilimek, R.; Krems, J. Keep your scanners peeled: Gaze behavior as a measure of automation trust during highly automated driving. Hum. Factors 2016, 58, 509–519. [Google Scholar] [CrossRef] [PubMed]
  26. Tanikawa, Y.; Oikawa, S.; Hirose, T. Head-up display with distance information evaluated using a driving simulator. In Proceedings of the 5th International Symposium on Future Active Safety Technology toward Zero Accidents (FAST-zero ‘19), Blacksburg, VA, USA, 9–11 September 2019. [Google Scholar]
  27. Li, X.; Vaezipour, A.; Rakotonirainy, A.; Demmel, S. Effects of an in-vehicle eco-safe driving system on drivers’ glance behaviour. Accid. Anal. Prev. 2019, 122, 143–152. [Google Scholar] [CrossRef] [PubMed]
  28. Kountouriotis, G.; Spyridakos, P.; Carsten, O.; Merat, N. Identifying cognitive distraction using steering wheel reversal rates. Accid. Anal. Prev. 2016, 96, 39–45. [Google Scholar] [CrossRef] [PubMed]
  29. Hirasawa, T.; Kamei, J.; Aki, M.; Koga, T.; Suda, Y. Basic study of parking ITS for functional design of parking spaces. Ind. Sci. 2012, 64, 161–166. (In Japanese) [Google Scholar]
  30. International Organization for Standardization (ISO) ISO 17386 Transport Information and Control Systems–Manoeuvring Aids for Low Speed Operation (MALSO); Performance Requirements and Test Procedures: Geneva, Switzerland, 2010.
  31. Tobii Technology, Tobii Pro Glasses 2 Product Description. 2018. Available online: https://www.tobiipro.com/siteassets/tobii-pro/product-descriptions/tobii-pro-glasses-2-product-description.pdf (accessed on 10 February 2021).
  32. Tobii Technology, Tobii Pro Glasses 2 User‘s Manual. 2016. Available online: https://www.tobiipro.com/siteassets/tobii-pro/user-manuals/tobii-pro-glasses-2-user-manual.pdf (accessed on 10 February 2021).
  33. Study on Facility Operation to Improve Safety for Reduction of Traffic Ain Parking Lots; Tokyo Metropolitan Public Corporation for Road Improvement and Management (TMPC): Tokyo, Japan, 2018. (In Japanese)
  34. National Highway Traffic Safety Administration (NHTSA) Laboratory test procedure for FMVSS 111 Rear Visibility. Washington. Available online: https://www.nhtsa.gov/sites/nhtsa.dot.gov/files/documents/tp-111-v01-final_tag.pdf (accessed on 10 February 2021).
  35. Toyota Motor Corporation. Lexus Digital Side-View Monitor Debuts on the New ES. 2018. Available online: https://global.toyota/en/newsroom/lexus/24544476.html (accessed on 10 February 2021).
Figure 1. Example of a reverse parking procedure in the 90-degree reverse parking system: (a) Forward moving with slight right turning; (b) Backward moving *. (* This study focused on the vehicle backing rearward).
Applsci 11 02180 g001
Figure 2. Test vehicle when stopped in the parking area (unit: mm).
Applsci 11 02180 g002
Figure 3. Initial position of the test vehicle in this study (unit: mm).
Applsci 11 02180 g003
Figure 4. Example of vehicle positions during backing: (a) Approaching the parking area (start phase); (b) Parking area (stop phase).
Applsci 11 02180 g004
Figure 5. Area of interest for the driver’s gaze.
Applsci 11 02180 g005
Figure 6. Example of the distance series of an AOI gaze plot measured from one volunteer: (a) NT-V; (b) S-V; (c) BC-V; (d) BCS-V.
Applsci 11 02180 g006
Figure 7. Gazing time ratio of individual AOIs compared to all AOIs: (a) Start phase; (b) Stop phase.
Applsci 11 02180 g007
Figure 8. Examples of (i) vehicle location, (ii) rear views with left-side mirror, and (iii) monitor (* D: Distance between the pole and vehicle body side): (a) When a vehicle stopped to change from forward to backward motion; (b) When a backing vehicle was at the entry edge of the parking area.
Applsci 11 02180 g008
Figure 9. View through the monitor of the test vehicle in a parking area.
Applsci 11 02180 g009
Table 1. Significant difference in the average gazing time of all volunteers in each AOI in a given technology between the start phase and stop phase.
AOIGaze Time for Start Phase (s)Gaze Time for Stop Phase (s)p-Value
AverageSDAverageSD
1. No-tech vehicle (NT-V)
Rearview mirror0.330.500.100.290.161
Left-side mirror5.572.802.322.290.002 **
Right-side mirror0.780.865.063.08<0.001 **
Total of all AOIs6.672.997.484.470.580
2. Sonar vehicle (S-V)
Rearview mirror0.210.310.040.140.080
Left-side mirror5.492.392.542.360.003 **
Right-side mirror0.540.674.572.97<0.001 **
Total of all AOIs6.242.667.153.810.469
3. Backup-camera vehicle (BC-V)
Monitor2.893.089.704.44<0.001 **
Rearview mirror0.030.080.000.00-
Left-side mirror3.372.741.101.370.145
Right-side mirror0.490.572.321.950.004 **
Total of all AOIs6.793.0313.124.35<0.001 **
4. Backup-camera with sonar vehicle (BCS-V)
Monitor2.152.148.443.35<0.001 **
Rearview mirror0.070.240.010.040.353
Left-side mirror3.852.461.311.530.003 **
Right-side mirror0.300.392.131.540.001 **
Total of all AOIs6.372.8511.893.10<0.001 **
Note: ** p-Value < 0.01. The unpaired t-test was conducted to determine the significant difference. Number of all volunteers: 14.
Table 2. Significant difference in the AOI usage rate in the given technology between the start phase and stop phase (n = 14).
AOIStart PhaseStop Phasep-Value
Number of Volunteers Who Used the AOIAOI Usage Rate (%)Number of Volunteers Who Used the AOIAOI Usage Rate (%)
1. No-tech vehicle (NT-V)
Rearview mirror7504290.246
Left-side mirror1410014100-
Right-side mirror96413930.065
2. Sonar vehicle (S-V)
Rearview mirror6432140.094
Left-side mirror1410013930.309
Right-side mirror857141000.006 **
3. Backup-camera vehicle (BC-V)
Monitor1071141000.031 *
Rearview mirror214000.142
Left-side mirror139310710.139
Right-side mirror96411790.403
4. Backup-camera with sonar vehicle (BCS-V)
Monitor1179141000.067
Rearview mirror214170.541
Left-side mirror139311790.280
Right-side mirror85713930.029 *
Note: * p-Value < 0.05, ** p-Value < 0.01. Number of all volunteers: 14. A significant difference was determined using a statistical two-tailed test of the sample rates.
Table 3. Significant difference in the average gazing time of all the subjects between the two given technologies for the start phase.
Com-ParisonAOIVehicle TechnologyGaze Time (s)Vehicle TechnologyGaze Time (s)p-Value
AverageSDAverageSD
No.1Rearview mirror1. No-tech vehicle (NT-V)0.330.502. Sonar vehicle
(S-V)
0.210.310.459
Left-side mirror5.572.805.492.390.937
Right-side mirror0.780.860.540.670.421
Total of all AOIs6.672.996.242.660.689
No.2Monitor1. No-tech vehicle (NT-V)--3. Backup-camera vehicle (BC-V)2.893.08-
Rearview mirror0.330.500.030.080.047 *
Left-side mirror5.572.803.372.740.046 *
Right-side mirror0.780.860.490.570.304
Total of all AOIs6.672.996.793.030.921
No.3Monitor1. No-tech vehicle (NT-V)--4. Backup-camera with sonar vehicle (BCS-V)2.152.14-
Rearview mirror0.330.500.070.240.103
Left-side mirror5.572.803.852.460.098
Right-side mirror0.780.860.300.390.071
Total of all AOIs6.672.996.372.850.786
No.4Monitor2. Sonar vehicle
(S-V)
--3. Backup-camera vehicle (BC-V)2.893.08-
Rearview mirror0.210.310.030.080.052
Left-side mirror5.492.393.372.740.039 *
Right-side mirror0.540.670.490.570.826
Total of all AOIs6.242.666.793.030.616
No.5Monitor2. Sonar vehicle
(S-V)
--4. Backup-camera with sonar vehicle (BCS-V)2.152.14-
Rearview mirror0.210.310.070.240.200
Left-side mirror5.492.393.852.460.087
Right-side mirror0.540.670.300.390.244
Total of all AOIs6.242.666.372.850.901
No.6Monitor3. Backup-camera vehicle (BC-V)2.893.084. Backup-camera with sonar vehicle (BCS-V)2.152.140.464
Rearview mirror0.030.080.070.240.532
Left-side mirror3.372.743.852.460.630
Right-side mirror0.490.570.300.390.305
Total of all AOIs6.793.036.372.850.711
Note: * p-Value < 0.05. The unpaired t-test was conducted to determine the significant difference. Number of all volunteers: 14.
Table 4. Significant difference in the average gazing time of all the subjects between the two given technologies for the stop phase.
Com-ParisonAOIVehicle TechnologyGaze Time (s)Vehicle TechnologyGaze Time (s)p-Value
AverageSDAverageSD
No.1Rearview mirror1. No-tech vehicle (NT-V)0.100.292. Sonar vehicle
(S-V)
0.040.140.489
Left-side mirror2.322.292.542.360.803
Right-side mirror5.063.084.572.970.673
Total of all AOIs7.484.477.153.810.837
No.2Monitor1. No-tech vehicle (NT-V)--3. Backup-camera vehicle (BC-V)9.704.44-
Rearview mirror0.100.290.000.00-
Left-side mirror2.322.291.101.370.099
Right-side mirror5.063.082.321.950.009 **
Total of all AOIs7.484.4713.124.350.002 **
No.3Monitor1. No-tech vehicle (NT-V)--4. Backup-camera with sonar vehicle (BCS-V)8.443.35-
Rearview mirror0.100.290.010.040.258
Left-side mirror2.322.291.311.530.185
Right-side mirror5.063.082.131.540.005 **
Total of all AOIs7.484.4711.893.100.005 **
No.4Monitor2. Sonar vehicle
(S-V)
--3. Backup-camera vehicle (BC-V)9.704.44-
Rearview mirror0.040.140.000.00-
Left-side mirror2.542.361.101.370.059
Right-side mirror4.572.972.321.950.026 *
Total of all AOIs7.153.8113.124.350.001 **
No.5Monitor2. Sonar vehicle
(S-V)
--4. Backup-camera with sonar vehicle (BCS-V)8.443.35-
Rearview mirror0.040.140.010.040.408
Left-side mirror2.542.361.311.530.115
Right-side mirror4.572.972.131.540.013 *
Total of all AOIs7.153.8111.893.100.001 **
No.6Monitor3. Backup-camera vehicle (BC-V)9.704.444. Backup-camera with sonar vehicle (BCS-V)8.443.350.405
Rearview mirror0.000.000.010.04-
Left-side mirror1.101.371.311.530.696
Right-side mirror2.321.952.131.540.778
Total of all AOIs13.124.3511.893.100.400
Note: * p-Value < 0.05, ** p-Value < 0.01. The unpaired t-test was conducted to determine the significant difference. Number of all volunteers: 14.
Publisher’s Note: MDPI stays neutral with regard to jurisdictional claims in published maps and institutional affiliations.

