Article

You Only Look Once, But Compute Twice: Service Function Chaining for Low-Latency Object Detection in Softwarized Networks †

by
Zuo Xiang
1,*,‡,
Patrick Seeling
2,‡ and
Frank H. P. Fitzek
1,‡
1
Centre for Tactile Internet with Human-in-the-Loop, Technische Universität Dresden, 01187 Dresden, Germany
2
Department of Computer Science, Central Michigan University, Mount Pleasant, MI 48859, USA
*
Author to whom correspondence should be addressed.
Extended version of Xiang, Z.; Zhang, R.; Seeling, P. Machine learning for object detection. In Computing in Communication Networks; Fitzek, F.H., Granelli, F., Seeling, P., Eds.; Elsevier/Academic Press: Cambridge, MA, USA, 2020.
The authors contributed equally to this work.
Appl. Sci. 2021, 11(5), 2177; https://doi.org/10.3390/app11052177
Submission received: 22 December 2020 / Revised: 19 February 2021 / Accepted: 25 February 2021 / Published: 2 March 2021

Abstract

:

Featured Application

Splitting of formerly only integrated inference from object recognition and other trained (and potentially untrained) machine learning approaches has broad applicability in all application scenarios that rely on these types of models, with connected autonomous cars, smart city applications, and video surveillance being prominent examples.

Abstract

With increasing numbers of computer vision and object detection application scenarios, those requiring ultra-low service latency times have become increasingly prominent; e.g., those for autonomous and connected vehicles or smart city applications. The incorporation of machine learning through the applications of trained models in these scenarios can pose a computational challenge. The softwarization of networks provides opportunities to incorporate computing into the network, increasing flexibility by distributing workloads through offloading from client and edge nodes over in-network nodes to servers. In this article, we present an example for splitting the inference component of the YOLOv2 trained machine learning model between client, network, and service side processing to reduce the overall service latency. Assuming a client has 20% of the server computational resources, we observe a more than 12-fold reduction of service latency when incorporating our service split compared to on-client processing and and an increase in speed of more than 25% compared to performing everything on the server. Our approach is not only applicable to object detection, but can also be applied in a broad variety of machine learning-based applications and services.

1. Introduction

Multimedia network traffic has permeated all types of networks, and its dominance continues with increased adoptions of new connected services. Within the range of multimedia network traffic types, video is typically the most dominant form, especially with respect to bandwidth requirements. For example, Cisco forecasts in [1] that 82% of Internet Protocol (IP) traffic will be comprised of video by the year 2022. Within the video domain, specifically the object detection sub-category has an additional significant latency requirement, especially when applied in certain scenarios, see, e.g., [2]. The object identification and understanding within an ongoing video stream is based on the Computer Vision (CV) domain of real-time video analysis. Prominent examples for real-time object detection and analysis include Google Lens or smart city applications that perform video surveillance [3,4,5] or for connected autonomous cars, as illustrated in Figure 1. Especially for the latter, incorporating new sensor data such as from LIDAR and other on-board sensors that goes beyond image data alone is also attracting interest [6,7,8].
Significant challenges exist to reliably perform real-time video analysis on resource-limited devices, such as mobile phones or ad-hoc deployed video monitoring, when considering higher frame rates of live video captures. The requirements are typically high when locally processing data, as captured image analysis and machine vision tasks that comprise visual understanding commonly encompass involved Artificial Intelligence (AI) approaches. The AI component of these types of systems has undergone steady improvements in recent years as well, with increasing precision and recall, especially for Deep Learning (DL) approaches [11]. As these approaches exceed traditional methods, deep learning-based mechanisms have become increasingly popular, themselves commonly based on Convolutional Neural Networks (CNN) [12]. This enables CV systems to more reliably detect objects even in complicated scenes. The training of these models is typically highly resource-intensive; however, continuous improvements in hardware alleviate some of these problems and make a focus on the inference from these models more important. Example approaches include R-CNN [13], Faster R-CNN [14], and YOLO [15] combine precision with improved detection speed (also referred to as the inference speed).
The focus on latency optimization in a mobile context has to combine several requirements, such as resource usage and low latency of detection. Common resources considered include memory, CPU, and bandwidth on the computing side, however, overall system costs commonly need to be factored into solutions as well. For example, future intelligent transport system and connected autonomous vehicle applications of object detection are highly latency sensitive and mission-critical at the same time. Current approaches commonly are limited in realizing the full potential that upcoming network softwarization provides:
  • Object detection as outlined above is resource demanding and commonly not suitable for prolonged execution on mobile (i.e., battery-limited) devices and can overwhelm the computational resources of embedded solutions.
  • Instead, cloud computing typically offers flexible resource management for computationally intensive tasks through computational offloading, see, e.g., [16,17].The need to communicate with far-away cloud computing resources in traditional network infrastructures, however, increases the overall service latency significantly.
  • One approach to overcome the limitations of mobile processing while providing low latency services is to combine local processing and geographically close cloud services for more computationally expensive processing. While current communication networks infrastructure does not typically allow for in-network computing, new softwarized networks provide this flexibility.
  • In this article, we focus on the latency optimization aspects of mobile object detection by combining on-device and in-network computing. Our approach can be applied in 5G and beyond networks (as well as any network that has in-situ computing enabled).
In this article, we describe the implementation and performance analysis for a real-time object detection method that incorporates this network softwarization and computing resource provisioning.
The current trend to edge computing [18,19] and network softwarization in general enables the flexible service and application deployment under tight latency constraints, such as the one we consider here. Typically, deployments in softwarized networks include a combination of technologies to fulfill the requirements of real-time use cases: Software-Defined Networking (SDN) [20], Network Function Virtualization (NFV) [21], and Service Function Chaining (SFC) [22]. As the network becomes softwarized, Computing in the Network (COIN) and the Mobile Edge Cloud (MEC) [23] become powerful concepts to combine mobile, local, and far computing resources in a flexible fashion per use-case. Computing in the network will significantly reduce latency and issues that stem from extended packet switching across multiple networks, such as congestion. Virtualized resources can be flexibly deployed at various locations closer to the user, follow the user, and be reallocated in a dynamic fashion. In such a setup, initial pre-processing could be performed at edge nodes and reduce the subsequent nodes’ latency requirements for real-time services. This split of overall service processing needs is enabled by the layer-based approach used in object detection neural networks and the ability to split the location of processing by connecting the different layers flexibly over the network.
We describe the overall approach in the following Section 2, which contains information about the general on-device or on-server object recognition approach. Additionally, we describe the implementation of a single service function split between an initial service client and the server, noting that multiple splits could be performed as well. We follow with the description of results for a latency-focused performance evaluation in Section 3 and discussion in Section 4 before concluding in Section 5.

2. Materials and Methods

In this manuscript, we employ the You Only Look Once (YOLO) object detection library as a concrete example, noting that similarities with other neural networks can be exploited to modify our described approach with those models and mechanisms as well. In this section, initially discuss the general approach before describing YOLO and our setup in greater detail.

2.1. CNN Object Detection Model Split

CNN approaches for object detection generally feature several types of interconnected layers: convolutional layers, pooling layers, fully-connected layers, and batch normalization layers. These layers are typically stacked in a pattern of convolutional layers and activation functions followed by pooling layers, which (in multiple iterations) reduces the overall size of the image to a smaller size. Once a desired small size has been reached, fully connected layers are used, whereby the final layer contains the output. The output of each convolutional or pooling layer is an intermediate representation of the original image data relying on convolutional filters, their parameters derived via CNNs. The parameters (or weights) are dynamic while the feature maps representing different features of an image remain static and the overall outcome depends on the image input. Typically, the weights and resulting output data types are floating-point numbers. After a convolution layer, activation functions such as ReLU [24] are applied. To simplify the overall process, it is also common that the overall image will be initially pre-processed, as multi-layer models typically were trained for and assume a specific image size.
The limitations of computing resources (here, processing and memory) of edge nodes motivates a split of the overall processing to take place via different levels of offloading. For example, should traditional cloud computing approaches be involved, the entire sequence of images (or video frames) generated at the client on the network edge would have to be forwarded to centralized cloud servers. In compute-and-forward networks, on the other hand, computing resources are available inside the network which enables intermediate processing. In turn, reduced amounts of data alleviate network congestion and can improve overall service latency. We assume that deep learning frameworks such as Tensorflow [25] can be deployed as VNFs inside the network as well as on the centralized server. We additionally note that here, we consider a general CPU-based baseline evaluation, which can greatly be enhanced with additional accelerators, such as GPUs or FPGAs.
A significant initial consideration is how and where to perform a potential split between the on-device, edge, and centralized server processing in this overall architecture. Table 1 provides the initial layers for YOLOv2 [26], SSD [27], VGG16 [28], and Faster R-CNN [14].
Comparing these entries, all feature different combinations of similar layers that can be evaluated to determine a favorable point to split the original model such that the part before a split can be executed on a network device and bandwidth savings result. This requires limiting the number of layers prior to a split. Consequently, the number of layers before the split point should not be too high and the output data of the front part should be smaller than the original input image size in order to realize bandwidth savings.
Given a particular split to enable the offloading of processing parts, the structure of the pipeline for evaluating the performance of deploying object detection services in edge computing such as MEC is presented in Figure 2 with a detailed visualization of basic components.
The implementation of this example is focused on the VNF, which supports both store-and-forward and compute-and-forward to adapt to the network state. The outer Service Function Path is not modified during computation, i.e., the VNF will not affect other protocols or the SFC architecture.
The VNF is employed to offload part of the overall computational burden of the CNN related computations in the object detection from centralized servers to the network edge. We employ YOLOv2 as example for such object detection methods. YOLOv2 is deployed in the VNF at the edge and the server. As described, we follow the outlined approach of splitting the CNN model into two parts. The first part is deployed in the VNF and the second part is deployed on the server. Following the overall desire to reduce the overall service latency under the computational constraints, the complexity of the first part is lower than that of the second part, where in our case, the first part will be the pre-processor for video frames.

2.2. You Only Look Once (YOLO), But Twice

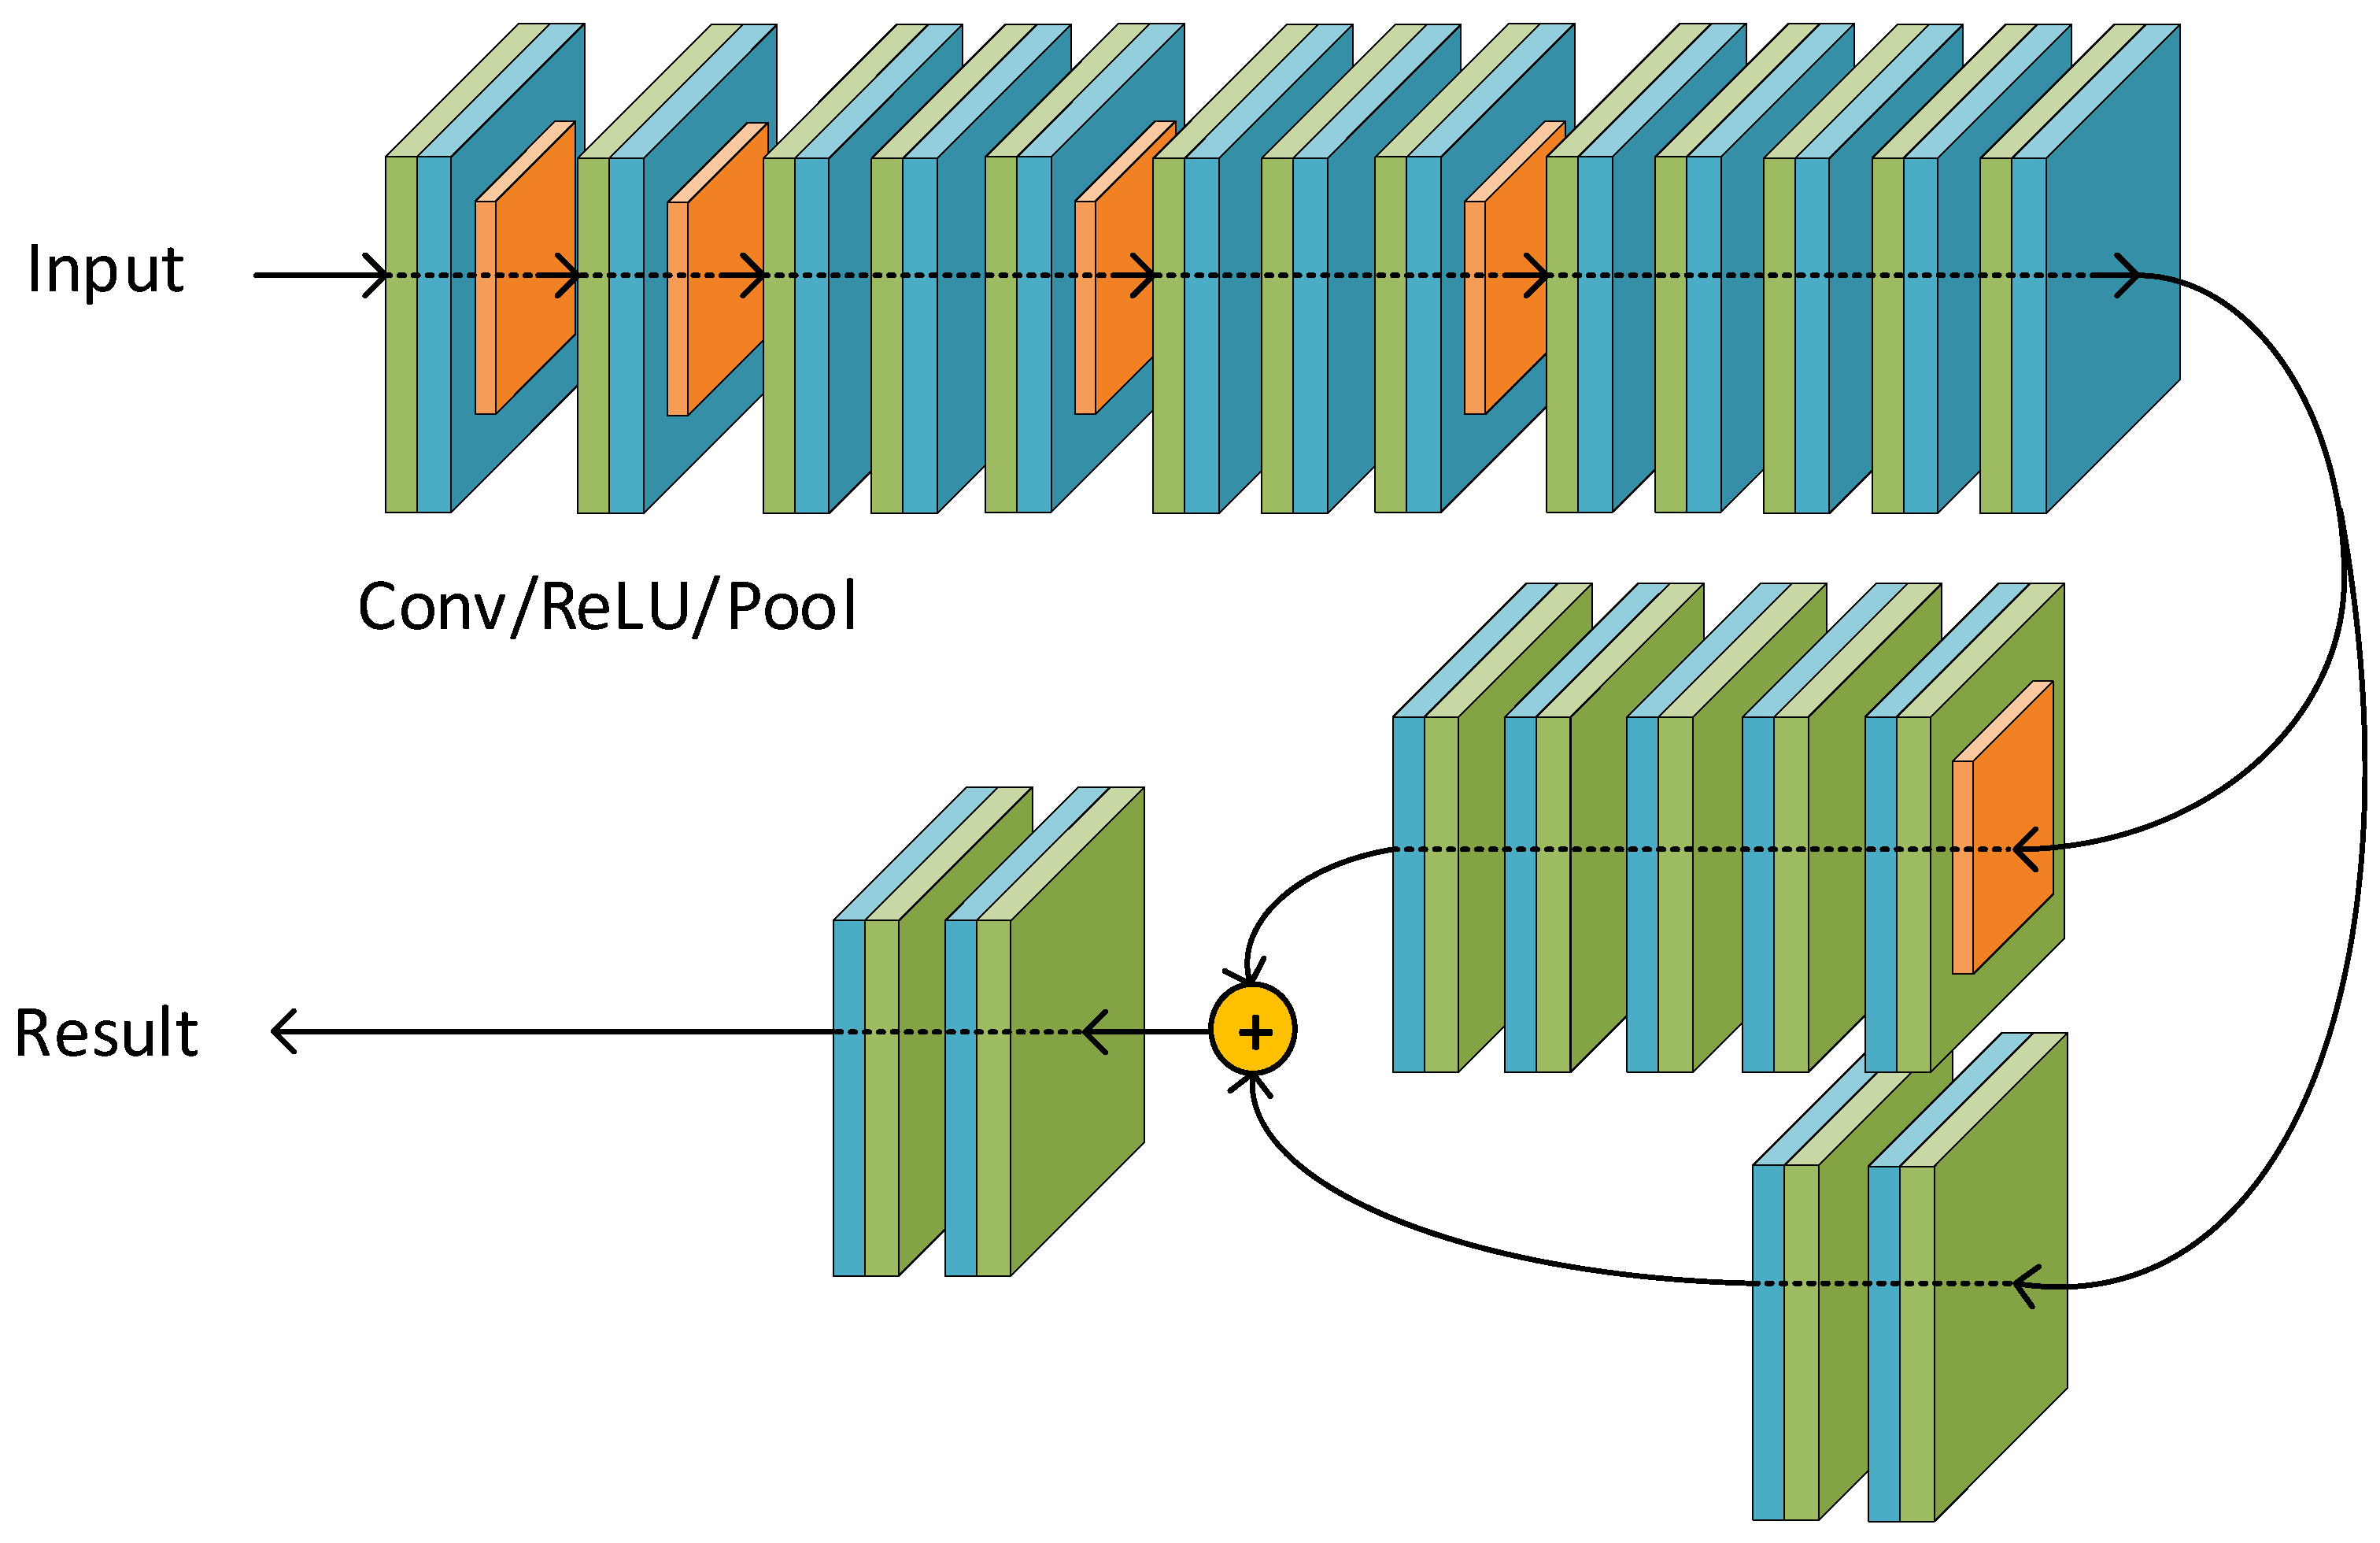
We now focus on the concrete implementation employed in the remainder of this article. YOLOv2 is mainly constructed of convolutional layers and max-pooling layers [26], similar to several other approaches highlighted in Table 1 and illustrated in Figure 3.
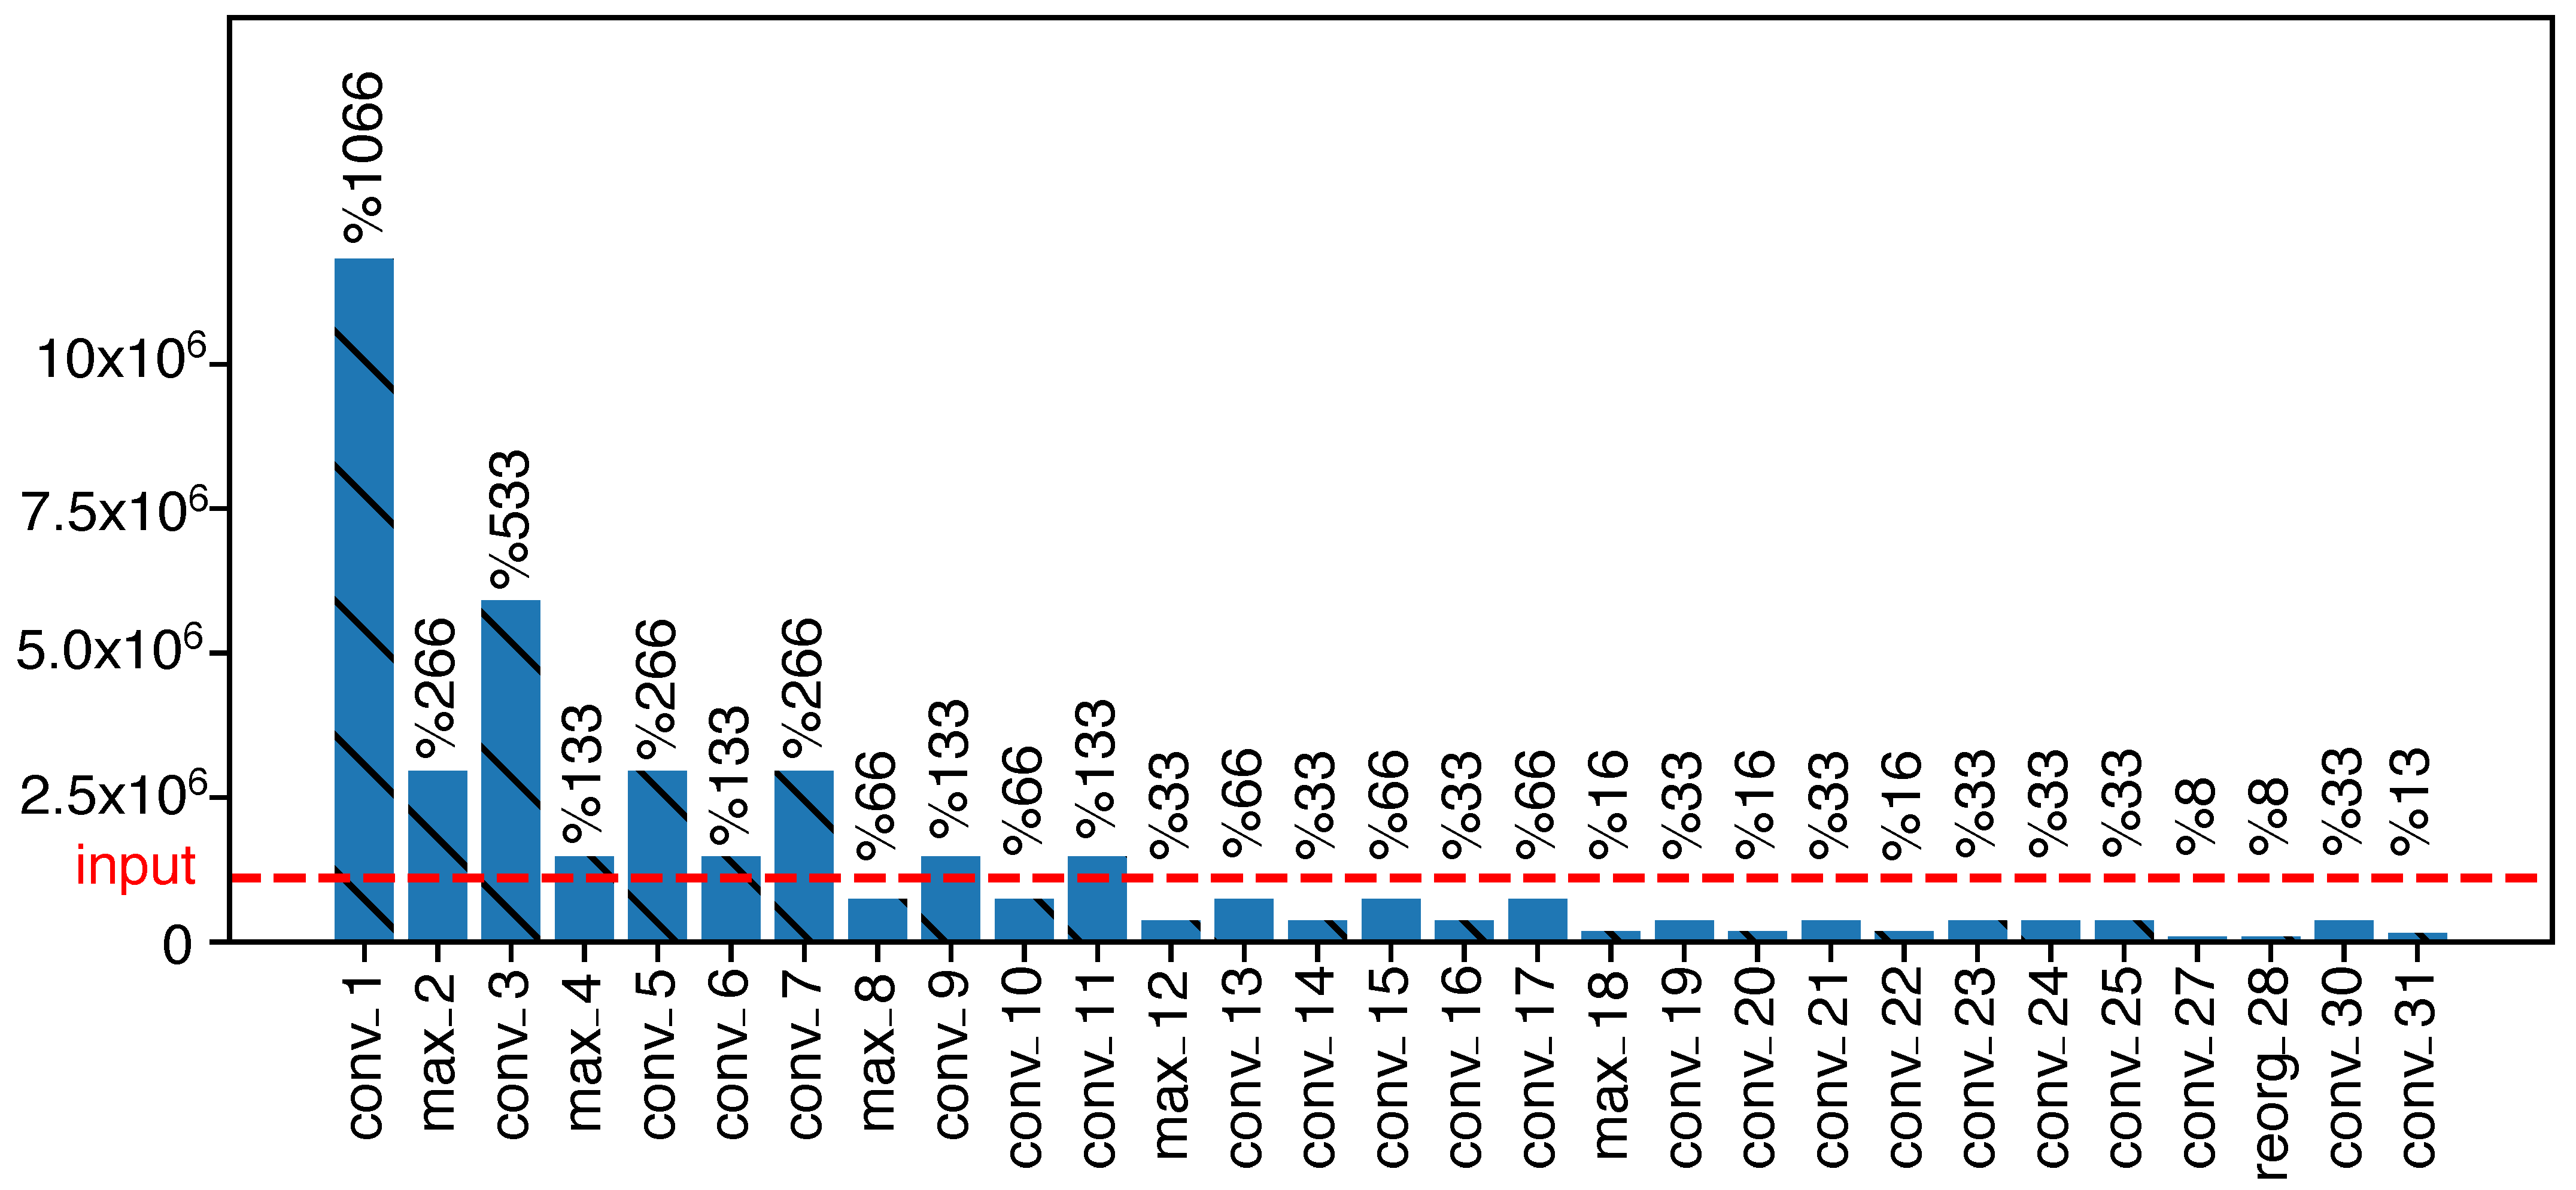
Following our assumption of computational resource availability at clients, edge nodes, and centralized cloud computing servers, increasing distance from the network edge corresponds to higher computational resources. Subsequently, splitting workloads should focus on the initial layers, provided that the split takes place at an advantageous processing step in the neural network. Similarly, not too many layers should have been processed at the initial nodes to improve the overall service latency and adhere to computing resource restrictions. Figure 4 illustrates the different layer outputs in relation to the initial input image for YOLOv2. Figure 4 additionally contains the reference input size (i.e., 1 × 608 × 608 × 3 ).
While some initial layers clearly outsize the original input, the outputs of the latter layers are very small. For example, the final convolutional layer has only 13% of the original input size. In the first 10 layers, the output size of max_8 and conv_10 are both 66% of the input size, which are both candidates for a potential early split. To expedite the processing, we here consider the first candidate max-pooling layer’s output as a split point. This provides a possibility to compress the resulting feature maps (which should result in smaller sizes than the input images). The resulting model’s split is illustrated in Figure 5, showcasing how the outputs are communicated further into the network.
In our particular example, the VNF consists of the following three components packaged as container:
Data Processor
The data processor collects the incoming video packets and performs relevant pre-processing tasks. These tasks could encompass video decoding, image manipulations (especially reshaping to proper input dimensions), or pixel representation changes.
YOLO Part 1
The initial part of YOLO as VNF provides initial detection model processing as outlined in this section. The resulting feature maps contain the extracted information from the original image.
Encoder 
The encoder ecodes (compresses) the resulting feature maps before sending them to the server to reduce bandwidth requirements even further. As the feature maps themselves are representable as image data data, we consider several image compression approaches.
The alternative approach to the YOLO service function split is the monolithic deployment on the central cloud server. A significant benefit is that cloud servers are generally assumed to have an abundance of computing resources at their disposal. In our example implementation, the server deploys the regular (full as in Figure 3) YOLOv2. Additionally, the server also deploys the remaining layers of the split YOLOv2 service (as in Figure 5). To enable separation of the server-side service to use, the VNF adds a small header indicating which approach to use. Should the received data be pre-processed by the VNF, the potentially compressed feature maps are decoded and entered in the remaining chain of layers. Alternatively, should the received data be simply forwarded data from user equipment, the traditional YOLOv2 pre-processing chain commences (employing the same mechanisms as in the VNF). In either case, the object detection result is obtained on the server and sent back to the user equipment after processing is completed.

2.3. Testbed Input Data Performance Metrics

Our example evaluation is based on the COCO data set [30], employing YOLOv2 [26] as described in this section. We consider three different object detection scenarios, namely ( i . ) on-device, ( i i . ) server-based, and ( i i i . ) service function split. In addition to pre-processing and subsequent YOLOv2 object detection fully deployed on the client/server, we also perform a split with only layers after the max_8 on the server, and the layers and processing before being implemented as VNF. In our example, the input images are normalized to the range [0–1], i.e., the data type of all feature maps will be 32-bit float. For the overall testbed, we employ a generic computer system with an i7-6700T CPU with 16GB RAM using Ubuntu 18.04 LTS and implement the system in the Communication Networks Emulator (ComNetsEmu), see [31]. The Tensorflow library v1.13 is used to implement the object detection function of VNF and server. All programs and measurement scripts are implemented in Python 3.6 and are publicly accessible in the repository of ComNetsEmu [32]. All source code can be found in the folder: app/machine_learning_for_object_detection. Detailed descriptions (for reproducible measurements) of all the libraries and environments used can be found in the Dockerfile included in the repository. Provided the nature of non-accelerated performance evaluation here, our results provide an upper first limit to attainable latency, which can be improved upon, e.g., with GPU accelerations. The client, VNF and server are running on different physical CPUs (using Linux cpuset_cpus) to minimize interference. For the latency measurements, a multi-hop topology is used connecting client to in-network service function (processing or forwarding as illustrated in Figure 2) and server. All links in the topology have the same homogeneous bandwidth is limits of to 10 Mbit/s with a fixed propagation delay of 150 ms. The same source image data is sent by the client (pedestrian.jpg with a original size of 48 kB) for 30 repeated measurements. All measurements were performed utilizing JPEG compression for the original and in-network computation’s intermediate result forwarding.
As not only latency performance, but also the actual prediction outcome performance are important for object detection services, a careful trade-off between the two should be made. For the 8th layer (split point) of YOLOv2, the output data shape is 1 × 78 × 78 × 128, which results in approximately 92% as a baseline average precision for the entire COCO data set without YOLOv2 modifications. We select compression format and working point following our reasoning in [29], with results illustrated in Figure 6 for multiple compression approaches’ compression factor versus the average attainable precision.
As illustrated, only JPEG and WebP result in higher attainable average precision beyond the 92% baseline. Subsequently, we select JPEG compression of about 50% to be applied to the 7th layer output; the compressed data is about half of the original image data (also in JPEG format).
We initially assume that the client features a limited processing capacity that is 20% that of the server/service function in a common scenario. We base this split on the CoreMark Benchmark [33] values per MHz for the Samsung Exynos 5422 (15.077 for four cores at 2.1 GHz) and the Intel Core i5-8500 (57.207 for four cores at 3 GHz). The Samsung Exynos as a popular mobile device CPU and representative for a low-power fixed smart city device or smartphone at just below 20% performance of the i5-8500. Similar comparisons for other benchmarks confirm this general approach, e.g., the Passmark Average CPU Mark [34] results for the entire CPU of current Android phones are around 6000 while current dual CPU server systems are rated around 90,000. Based on single thread ratings, it would require 1/10th of a modern server’s threads to replicate the entire available CPU performance of a smartphone. Similarly, multi-core benchmarks from Geekbench v5 for a Google Pixel 5 smartphone range around 1500 while the AMD Threadripper 3990X is rated at around 27,000. Again, the idea of providing fractional resources for NFV would allow us to serve 18 phones at full virtualized CPU performance in this foundational comparison. In turn, we reason that our split is representative of the common performance differences between mobile and short-term available edge computing resources. As we perform our evaluations in the ComNetsEmu environment with the above settings, we note that during the experimentation, the server is always allocated with 100% CPU time while the client is allocated a dynamic portion of the server’s CPU time, denoted as α . With the overall service latency T as the main focus of this article, we determine it as
T = t C P U C l i e n t + t C P U S e r v e r + 2 · t p r o p + t t r a n u p + t t r a n d o w n .
where intuitively t C P U C l i e n t | S e r v e r denotes the required CPU times for client and server, respectively. Similarly, we denote the fixed propagation delay as t p r o p and the up- or downstream transmission delays as t t r a n u p | d o w n .

3. Results

In this section, we describe the obtained service latency results for the three evaluated scenarios of on-device, server-based, and service function split object detection service with YOLOv2 as described in prior sections. We initially present our overarching results in Table 2.
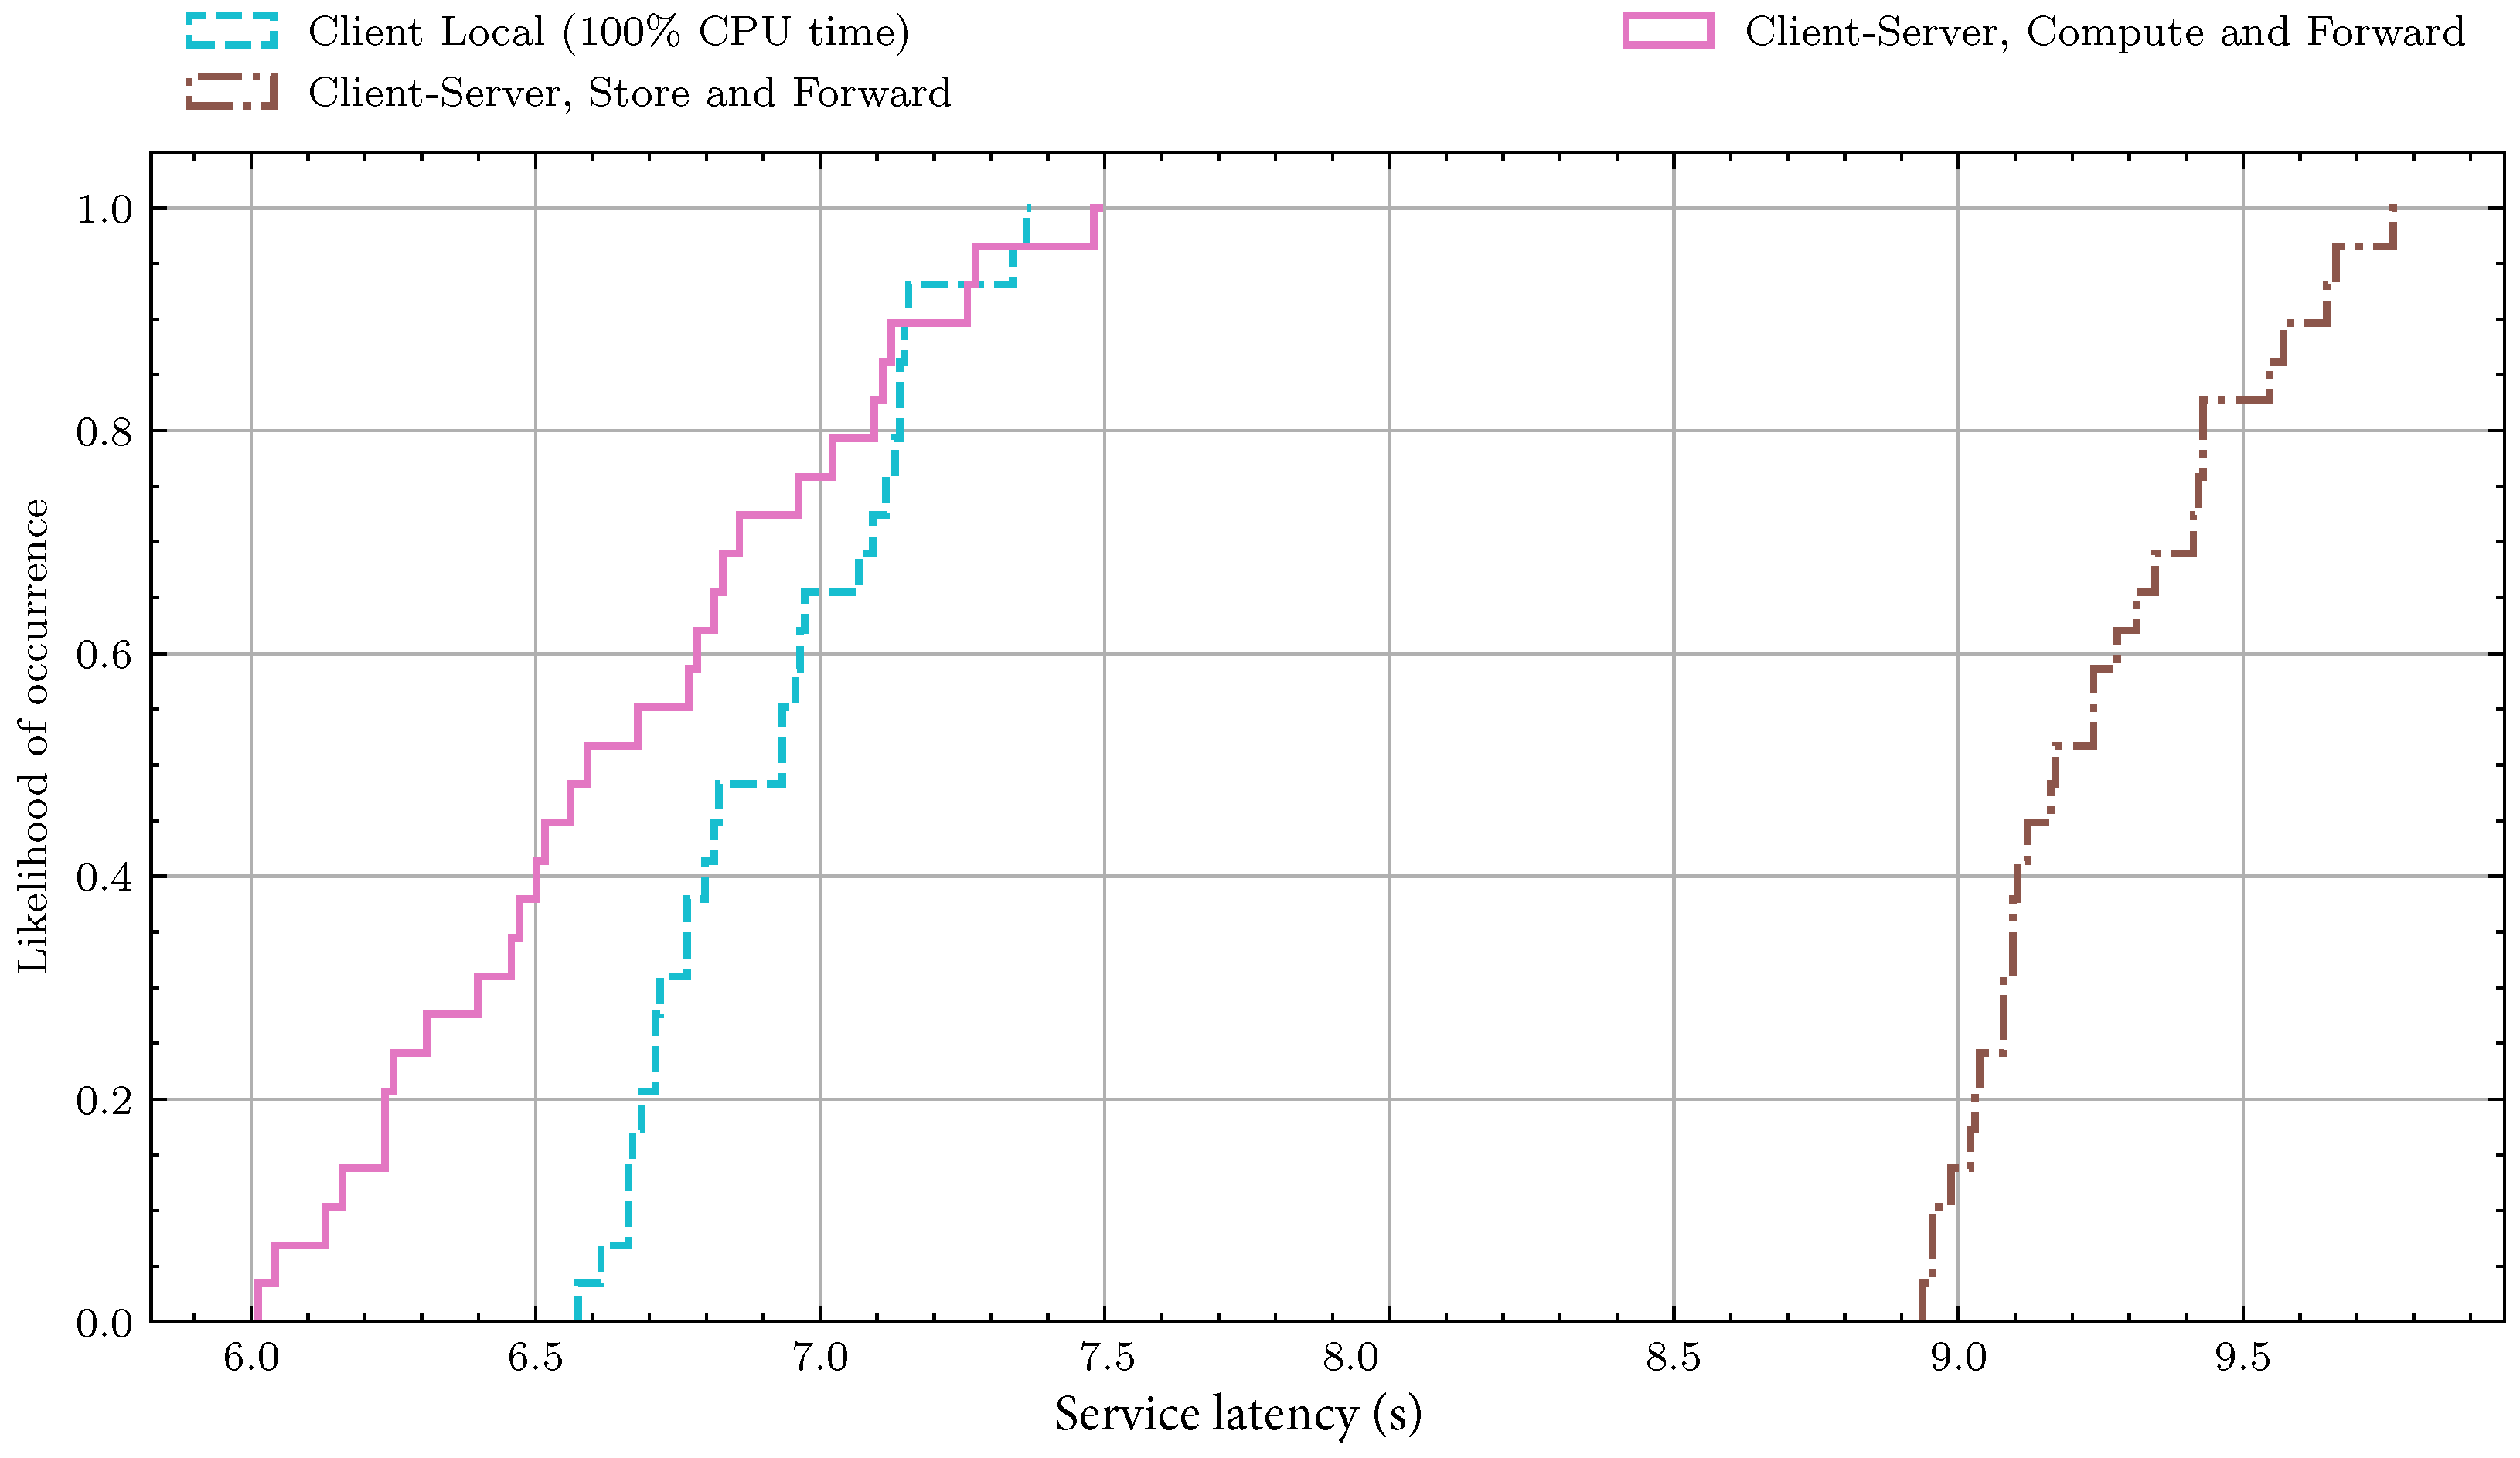
We first observe that for the two scenarios of fully on-device ( α = 1) and fully on-server (Store), the server-side processing incurs a delay of just over 2 seconds. For the client-only service latency, we notice an exponential increase as the performance of the client in relation to the server diminishes. At α = 0.2 , the client requires almost a 12-fold increase to process the image. As outlined in the motivation in Section 2.3, we employ this as a comparison point to the server for the compute-and-forward scenario. The compute-and-forward case provides a total service latency that is just below that of the client having the full server resources itself. We additionally notice from the table that the median and average are fairly close to another, with generally less than one percent difference. A visual comparison of these three service approaches is illustrated in Figure 7.
We observe that the store-and-forward approach is in this comparison not desirable at all, as it exhibits the highest service latency. The comparison of an assumed full server-level CPU performance on the client side with the compute-and-forward approach with only 20% server-side equivalent resources on the client side showcases a significant overlap in service time distributions. Particularly, we notice that 50% of the compute-and-forward latency times observed are lower than any local processing, while the remaining 50% are spread over the entire client-side processing range. In comparison, the store-and-forward approach yields a lower spread of latency values and is more comparable to the on-client processing in this regard.
We now consider the impact of different local processing capabilities of the client in comparison to the server. We illustrate the outcomes for the overall service latency for different client computational resources in Figure 8. We initially note the increase in service latency as the evaluation moves from compute-and-forward over store-and-forward to the scenario of α = 0.5 in Table 2, assuming the client’s processing resources are 50% of the server resources. We observe that the visual difference to the other two server-side approaches is significant. We additionally observe the continuous increase of service latency to the α = 0.2 case, which is the alternative to the compute-and-forward case and showcases the immense benefit that can be obtained from our described approach visually. Overall, we derive that the split between in-network processing and server-side processing heavily favors the service function split, especially for scenarios where clients have low computational resources when compared to available server-side resources.

4. Discussion

Overall, our results are indicative of significant service latency reductions that can be attained through splitting the inference workload in the multi-layer YOLOv2 object recognition model. Some of our results have show an increasing spread across service latency values, especially in scenarios where the client has only smaller fractional CPU times. This spread can be attributed to the increased burden on the CPU of performing multiple operations and the overhead, especially when considering the computational burden of the various layers in the YOLOv2 model. It is particularly noteworthy that the emulation framework employed (ComNetsEmu) was not designed for ultra-low latency usage and is originally a prototyping and teaching tool and we expect additional gains can be realized when implementing our approach on production-level systems.
We note that our assumptions were based around similar architectures employed on client and server implementations here, which could be even further abstracted across different platforms and, most importantly, through the utilization of GPUs on the server side rather than the CPU-driven approach we are evaluating here. Indeed, the comparison between server and client is based on a generic viewpoint and does not account for potential additional gains due to parallel processing and multi-threading. Significant increases in server core density also will increase the potential for the server side having significantly more computational resources available for bursty operations such as individual image operations even without GPUs.
Indeed, moving into ultra-low latency application scenarios will require changes to the current approach to networked services, such as with a ChAin-based Low latency VNF ImplemeNtation (CALVIN) [35], which significantly reduced processing times at the network’s MEC. While negative effects can result [36], we showcased that in the generic scenario we considered this was not the case. While commonly, specific hardware is required to provide speed-up factors for learning, not inference, recent research has also evaluated the possibility to employ commodity hardware for these scenarios [37,38]. Specifically, in [39], the authors were able to achieve a throughput of 19 decisions per second for autonomous line following on a smart network interface. While the task at hand is different, the overall concept of offloading potrtions or all of the computer vision tasks into the network is similar.
Ongoing research takes place that continues on the various facets of object detection mechanisms as well – in our context with continuous upgrades of the YOLO model. In [40], the authors describe and improve upon YOLOv3 for the outlined significant ITS scenario. They derive processing times of just below 10 ms, which reaches service latency levels that are suitable for real-time object detection. Indeed, the interest for improvement and implementation for YOLO at the network edge is continuously attracting research interest [41,42,43] to improve upon the continuously developed YOLO, including hardware implementations [44]. Comparing these optimized approaches to our evaluation base don CPU processing alone is limited, as mostly, GPU or specialized hardware is employed for this type of task. In turn, our results can be seen as a ceiling evaluation of the resulting service latency for cases where no specialized hardware is available and processing needs to be performed on the CPU.

5. Conclusions

There will be an increased need for object detection as well as other machine learning-based approaches that are performed in a low-latency fashion in future application scenarios. For example, future Intelligent Transport Systems (ITS) will rely on pedestrian and car detection mechanisms to avoid loss of life and damage to property. Similarly, in connected autonomous driving, an object detection service is helpful for decision-making, such as for braking and obstacle avoidance. In the driver view, for example, object detection services can help the car to protect vulnerable road users (VRUs) such pedestrians and bicycles as we originally illustrated in Figure 1b.
Approaches that rely on machine learning commonly require significant processing, which is not always available on device, but becomes available in the softwarized 5G and beyond cellular networks. We present an approach to implement a service that splits the traditional YOLOv2 model between an on-device client and centralized server component by performing only the initial layers’ processing on the client and the remainder on the server. Comparing our approach with traditional on-client and on-server processing with varying degrees of client computational resources, we find that a 12-fold reduction of the service latency can be achieved when the client has 20% of the server’s resources—a scenario we deem likely in future connected device scenarios, especially for battery-limited devices.
The approach to split the intermediate results in systems incorporating neural network layers is not limited to object recognition tasks alone, but can be applied for all such systems. The increased embedding of AI approaches in modern networked systems provides broad opportunities to employ approaches such as ours to improve service levels and decrease their latency times. A particularly interesting future avenue here would be the reliance on partially pre-determined outcomes from prior cached results for distributed edge systems. Another venue currently under consideration is the combination of the service function split we showcased here together with network coding.

Author Contributions

Conceptualization, Z.X., P.S., and F.H.P.F.; methodology, Z.X., P.S., and F.H.P.F.; software, Z.X.; validation, Z.X. and P.S.; formal analysis, Z.X.; investigation, Z.X.; resources, F.H.P.F.; data curation, Z.X.; writing—original draft preparation, Z.X.; writing—review and editing, Z.X., P.S., and F.H.P.F.; visualization, Z.X.; supervision, F.H.P.F.; project administration, F.H.P.F.; funding acquisition, F.H.P.F. All authors have read and agreed to the published version of the manuscript.

Funding

Partially funded by the German Research Foundation (DFG, Deutsche Forschungsgemeinschaft) as part of Germany’s Excellence Strategy–EXC 2050/1–Project ID 390696704–Cluster of Excellence “Centre for Tactile Internet with Human-in-the-Loop” (CeTI) of Technische Universität Dresden.

Conflicts of Interest

The authors declare no conflict of interest. The funders had no role in the design of the study; in the collection, analyses, or interpretation of data; in the writing of the manuscript, or in the decision to publish the results.

Abbreviations

The following abbreviations are used in this manuscript:
5GFifth-Generation Cellular Networks
AIArtificial Intelligence
CNNConvolutional Neural Network
COINCOmputing In the Network
CPUCentral Processing Unit
CVComputer Vision
DLDeep Learning
FPGAField-Programmable Gate Array
GPUGraphics Processing Unit
IPInternet Protocol
ITSIntelligent Transport System
JPEGJoint Photographic Experts Group
LIDARLight Detection and Ranging
MECMobile Edge Cloud
NFVNetwork Function Virtualization
RAMRandom Access Memory
ReLURectified Linear Unit
SDNSoftware-Defined Network
SFCService Function Chaining
UDPUser Datagram Protocol
VNFVirtual Network Function
VRUVulnerable Road User
YOLOYou Look Only Once
WebPWeb Picture

References

  1. CISCO. VNI Global Fixed and Mobile Internet Traffic Forecasts. Available online: https://www.cisco.com/c/en/us/solutions/service-provider/visual-networking-index-vni/index.html (accessed on 28 February 2021).
  2. Kim, J.; Cho, J. Exploring a Multimodal Mixture-Of-YOLOs Framework for Advanced Real-Time Object Detection. Appl. Sci. 2020, 10, 612. [Google Scholar] [CrossRef] [Green Version]
  3. Yoon, C.S.; Jung, H.S.; Park, J.W.; Lee, H.G.; Yun, C.H.; Lee, Y.W. A Cloud-Based UTOPIA Smart Video Surveillance System for Smart Cities. Appl. Sci. 2020, 10, 6572. [Google Scholar] [CrossRef]
  4. Mandal, V.; Mussah, A.R.; Jin, P.; Adu-Gyamfi, Y. Artificial Intelligence-Enabled Traffic Monitoring System. Sustainability 2020, 12, 9177. [Google Scholar] [CrossRef]
  5. Wei, P.; Shi, H.; Yang, J.; Qian, J.; Ji, Y.; Jiang, X. City-Scale Vehicle Tracking and Traffic Flow Estimation Using Low Frame-Rate Traffic Cameras. In Adjunct Proceedings of the 2019 ACM International Joint Conference on Pervasive and Ubiquitous Computing and Proceedings of the 2019 ACM International Symposium on Wearable Computers; UbiComp/ISWC ’19 Adjunct; Association for Computing Machinery: New York, NY, USA, 2019; pp. 602–610. [Google Scholar] [CrossRef]
  6. Yang, W.; Zhang, X.; Lei, Q.; Shen, D.; Xiao, P.; Huang, Y. Lane Position Detection Based on Long Short-Term Memory (LSTM). Sensors 2020, 20, 3115. [Google Scholar] [CrossRef]
  7. Kim, W.; Cho, H.; Kim, J.; Kim, B.; Lee, S. YOLO-Based Simultaneous Target Detection and Classification in Automotive FMCW Radar Systems. Sensors 2020, 20, 2897. [Google Scholar] [CrossRef]
  8. Castelló, V.O.; del Tejo Catalá, O.; Igual, I.S.; Perez-Cortes, J.C. Real-time on-board pedestrian detection using generic single-stage algorithms and on-road databases. Int. J. Adv. Robot. Syst. 2020, 17, 1729881420929175. [Google Scholar] [CrossRef]
  9. Dominguez-Sanchez, A.; Cazorla, M.; Orts-Escolano, S. Pedestrian Movement Direction Recognition Using Convolutional Neural Networks. IEEE Trans. Intell. Transp. Syst. 2017, 18, 3540–3548. [Google Scholar] [CrossRef]
  10. Hui, J. Real-time Object Detection with YOLO, YOLOv2 and now YOLOv3. Available online: https://medium.com/@jonathan_hui/real-time-object-detection-with-yolo-yolov2-28b1b93e2088 (accessed on 28 February 2021).
  11. Sze, V.; Chen, Y.; Yang, T.; Emer, J.S. Efficient Processing of Deep Neural Networks: A Tutorial and Survey. Proc. IEEE 2017, 105, 2295–2329. [Google Scholar] [CrossRef] [Green Version]
  12. Gu, J.; Wang, Z.; Kuen, J.; Ma, L.; Shahroudy, A.; Shuai, B.; Liu, T.; Wang, X.; Wang, G.; Cai, J.; et al. Recent advances in convolutional neural networks. Pattern Recognit. 2018, 77, 354–377. [Google Scholar] [CrossRef] [Green Version]
  13. Girshick, R.B.; Donahue, J.; Darrell, T.; Malik, J. Rich feature hierarchies for accurate object detection and semantic segmentation. In Proceedings of the IEEE Conference on Computer Vision and Pattern Recognition (CVPR), Columbus, OH, USA, 23–28 June 2014; pp. 580–587. [Google Scholar]
  14. Ren, S.; He, K.; Girshick, R.B.; Sun, J. Faster R-CNN: Towards Real-Time Object Detection with Region Proposal Networks. arXiv 2015, arXiv:1506.01497. [Google Scholar] [CrossRef] [Green Version]
  15. Redmon, J.; Divvala, S.K.; Girshick, R.B.; Farhadi, A. You Only Look Once: Unified, Real-Time Object Detection. arXiv 2015, arXiv:1506.02640. [Google Scholar]
  16. Lin, L.; Liao, X.; Jin, H.; Li, P. Computation Offloading Toward Edge Computing. Proc. IEEE 2019, 107, 1584–1607. [Google Scholar] [CrossRef]
  17. Melendez, S.; McGarry, M.P. Computation offloading decisions for reducing completion time. In Proceedings of the 2017 14th IEEE Annual Consumer Communications Networking Conference (CCNC), Las Vegas, NV, USA, 8–11 January 2017; pp. 160–164. [Google Scholar] [CrossRef] [Green Version]
  18. Abbas, N.; Zhang, Y.; Taherkordi, A.; Skeie, T. Mobile Edge Computing: A Survey. IEEE Internet Things J. 2018, 5, 450–465. [Google Scholar] [CrossRef] [Green Version]
  19. Taleb, T.; Samdanis, K.; Mada, B.; Flinck, H.; Dutta, S.; Sabella, D. On Multi-Access Edge Computing: A Survey of the Emerging 5G Network Edge Cloud Architecture and Orchestration. IEEE Commun. Surv. Tutor. 2017, 19, 1657–1681. [Google Scholar] [CrossRef] [Green Version]
  20. Haleplidis, E.; Pentikousis, K.; Denazis, S.; Salim, J.H.; Meyer, D.; Koufopavlou, O. Software-Defined Networking (SDN): Layers and Architecture Terminology. RFC 7426, RFC Editor. 2015. Available online: http://www.rfc-editor.org/rfc/rfc7426.txt (accessed on 28 February 2021).
  21. Duan, Q.; Ansari, N.; Toy, M. Software-defined network virtualization: An architectural framework for integrating SDN and NFV for service provisioning in future networks. IEEE Netw. 2016, 30, 10–16. [Google Scholar] [CrossRef]
  22. Intel. Internet Engineering Task Force (IETF). Available online: https://tools.ietf.org/html/rfc7665 (accessed on 28 February 2021).
  23. Doan, T.V.; Fan, Z.; Nguyen, G.T.; You, D.; Kropp, A.; Salah, H.; Fitzek, F.H.P. Seamless Service Migration Framework for Autonomous Driving in Mobile Edge Cloud. In Proceedings of the 2020 IEEE 17th Annual Consumer Communications Networking Conference (CCNC), Las Vegas, NV, USA, 10–13 January 2020; pp. 1–2. [Google Scholar] [CrossRef]
  24. Krizhevsky, A.; Sutskever, I.; Hinton, G.E. ImageNet Classification with Deep Convolutional Neural Networks. In Advances in Neural Information Processing Systems 25; Pereira, F., Burges, C.J.C., Bottou, L., Weinberger, K.Q., Eds.; Curran Associates, Inc.: Red Hook, NY, USA, 2012; pp. 1097–1105. [Google Scholar]
  25. Tensorflow Official Website. Available online: https://www.tensorflow.org (accessed on 15 December 2020).
  26. Redmon, J.; Farhadi, A. YOLO9000: Better, Faster, Stronger. In Proceedings of the 2017 IEEE Conference on Computer Vision and Pattern Recognition (CVPR), Honolulu, HI, USA, 21–27 July 2017; pp. 6517–6525. [Google Scholar] [CrossRef] [Green Version]
  27. Liu, W.; Anguelov, D.; Erhan, D.; Szegedy, C.; Reed, S.; Fu, C.Y.; Berg, A.C. SSD: Single Shot MultiBox Detector. In Computer Vision—ECCV 2016; Leibe, B., Matas, J., Sebe, N., Welling, M., Eds.; Springer International Publishing: Cham, Switzerland, 2016; pp. 21–37. [Google Scholar]
  28. Liu, S.; Deng, W. Very deep convolutional neural network based image classification using small training sample size. In Proceedings of the 2015 3rd IAPR Asian Conference on Pattern Recognition (ACPR), Kuala Lumpur, Malaysia, 3–6 November 2015; pp. 730–734. [Google Scholar] [CrossRef]
  29. Xiang, Z.; Zhang, R.; Seeling, P. Chapter 19—Machine learning for object detection. In Computing in Communication Networks; Fitzek, F.H., Granelli, F., Seeling, P., Eds.; Elsevier/Academic Press: Cambridge, MA, USA, 2020; pp. 325–338. [Google Scholar] [CrossRef]
  30. Lin, T.; Maire, M.; Belongie, S.J.; Bourdev, L.D.; Girshick, R.B.; Hays, J.; Perona, P.; Ramanan, D.; Dollár, P.; Zitnick, C.L. Microsoft COCO: Common Objects in Context. In European Conference on Computer Vision; Springer: Cham, Switzerland, 2014. [Google Scholar]
  31. Xiang, Z.; Pandi, S.; Cabrera, J.; Granelli, F.; Seeling, P.; Fitzek, F.H.P. An Open Source Testbed for Virtualized Communication Networks. IEEE Commun. Mag. 2021, 1–7, in print. [Google Scholar]
  32. ComNetsEmu Public Repository. 2020. Available online: https://git.comnets.net/public-repo/comnetsemu (accessed on 28 February 2021).
  33. (EMBC), E.M.B.C. CoreMark CPU Benchmark Scores. Available online: https://www.eembc.org/coremark/ (accessed on 28 February 2021).
  34. Software, P. PassMark CPU Benchmark Datasets. Available online: https://www.cpubenchmark.net/ (accessed on 28 February 2021).
  35. Xiang, Z.; Gabriel, F.; Urbano, E.; Nguyen, G.T.; Reisslein, M.; Fitzek, F.H.P. Reducing Latency in Virtual Machines: Enabling Tactile Internet for Human-Machine Co-Working. IEEE J. Sel. Areas Commun. 2019, 37, 1098–1116. [Google Scholar] [CrossRef]
  36. Yang, F.; Wang, Z.; Ma, X.; Yuan, G.; An, X. Understanding the Performance of In-Network Computing: A Case Study. In Proceedings of the 2019 IEEE Intl Conf on Parallel Distributed Processing with Applications, Big Data Cloud Computing, Sustainable Computing Communications, Social Computing Networking (ISPA/BDCloud/SocialCom/SustainCom), Xiamen, China, 16–18 December 2019; pp. 26–35. [Google Scholar] [CrossRef]
  37. Xiong, Z.; Zilberman, N. Do Switches Dream of Machine Learning? Toward In-Network Classification. In Proceedings of the 18th ACM Workshop on Hot Topics in Networks; HotNets ’19; Association for Computing Machinery: New York, NY, USA, 2019; pp. 25–33. [Google Scholar] [CrossRef] [Green Version]
  38. Sanvito, D.; Siracusano, G.; Bifulco, R. Can the Network Be the AI Accelerator? In Proceedings of the 2018 Morning Workshop on In-Network Computing; NetCompute ’18; Association for Computing Machinery: New York, NY, USA, 2018; pp. 20–25. [Google Scholar] [CrossRef]
  39. Glebke, R.; Krude, J.; Kunze, I.; Rüth, J.; Senger, F.; Wehrle, K. Towards Executing Computer Vision Functionality on Programmable Network Devices. In Proceedings of the 1st ACM CoNEXT Workshop on Emerging In-Network Computing Paradigms; ENCP ’19; Association for Computing Machinery: New York, NY, USA, 2019; pp. 15–20. [Google Scholar] [CrossRef] [Green Version]
  40. Cao, J.; Song, C.; Peng, S.; Song, S.; Zhang, X.; Shao, Y.; Xiao, F. Pedestrian Detection Algorithm for Intelligent Vehicles in Complex Scenarios. Sensors 2020, 20, 3646. [Google Scholar] [CrossRef] [PubMed]
  41. Han, B.G.; Lee, J.G.; Lim, K.T.; Choi, D.H. Design of a Scalable and Fast YOLO for Edge-Computing Devices. Sensors 2020, 20, 6779. [Google Scholar] [CrossRef]
  42. Zhao, H.; Zhou, Y.; Zhang, L.; Peng, Y.; Hu, X.; Peng, H.; Cai, X. Mixed YOLOv3-LITE: A Lightweight Real-Time Object Detection Method. Sensors 2020, 20, 1861. [Google Scholar] [CrossRef] [Green Version]
  43. Yang, Y.; Deng, H. GC-YOLOv3: You Only Look Once with Global Context Block. Electronics 2020, 9, 1235. [Google Scholar] [CrossRef]
  44. Wang, Z.; Xu, K.; Wu, S.; Liu, L.; Liu, L.; Wang, D. Sparse-YOLO: Hardware/Software Co-Design of an FPGA Accelerator for YOLOv2. IEEE Access 2020, 8, 116569–116585. [Google Scholar] [CrossRef]
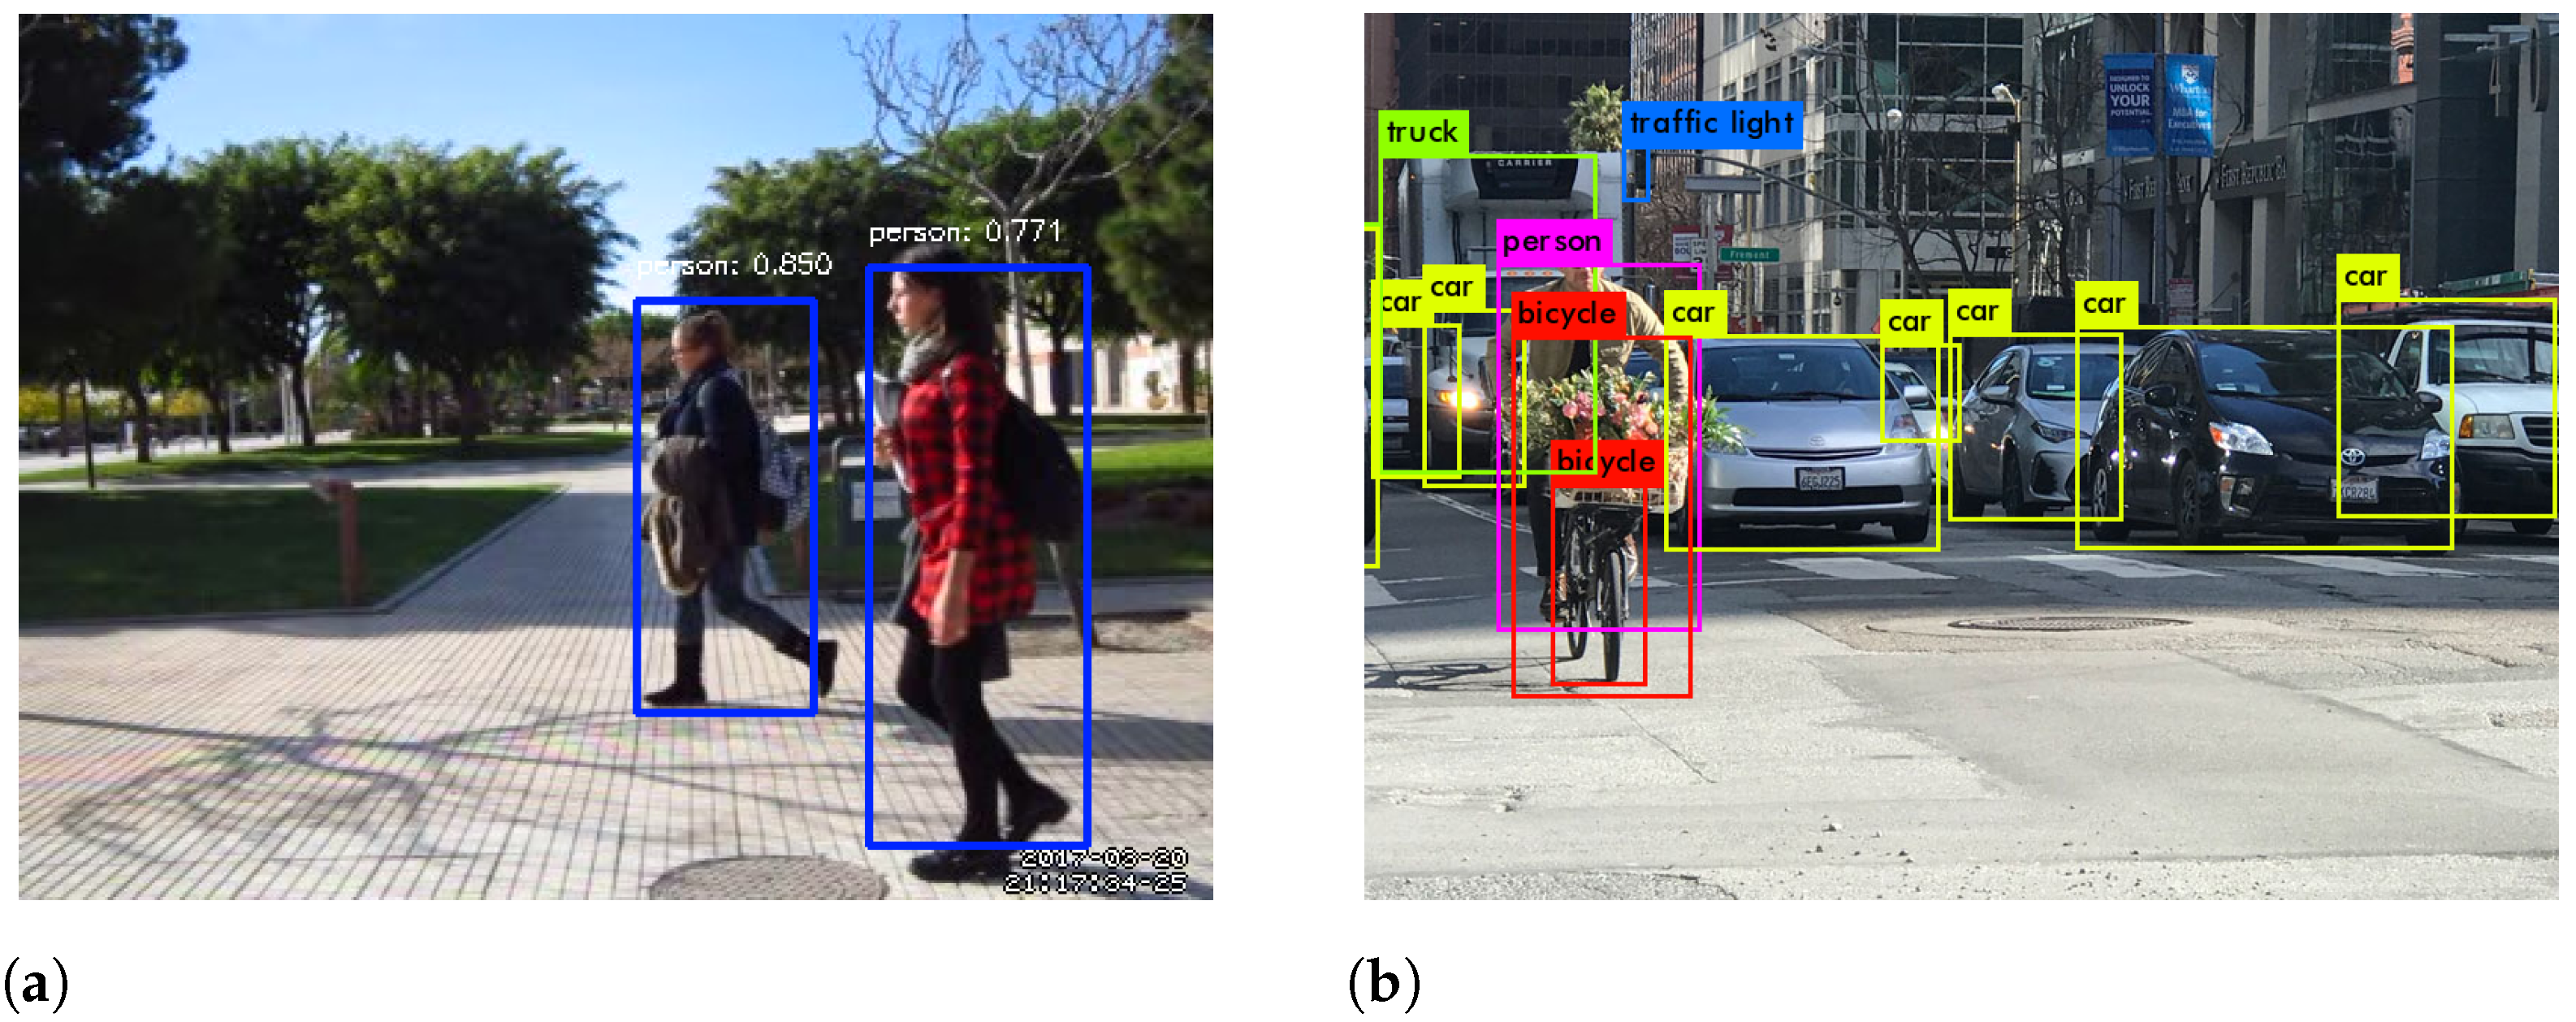
Figure 1. Object detection use cases including pedestrians and vehicles detection. (a) Pedestrian data set detection by YOLOv2 (image from [9]). (b) Object detection on the street (image from [10]).
Applsci 11 02177 g001
Figure 2. Overview of the distributed architecture, here for the example employing YOLO [29].
Applsci 11 02177 g002
Figure 3. Combined Model structure of YOLOv2 as executed as a single instance.
Applsci 11 02177 g003
Figure 4. Output size of each layer in YOLOv2 for conv-olutional and max-pooling layers [29].
Applsci 11 02177 g004
Figure 5. YOLOv2 split into two separate instances with the output of the eighth layer communicated over the network.
Applsci 11 02177 g005
Figure 6. Image-based compression methods for JPEG input assumption, from [29].
Applsci 11 02177 g006
Figure 7. Service latency likelihood for YOLOv2 performed on-device only (with device computational resources equal to server-side resources, α = 1 ), store-and-forward networking with server-side processing only, and compute-and-forward with α = 0.2 client-side processing up to layer 8 of YOLOv2 and remainder processing server-side.
Applsci 11 02177 g007
Figure 8. Overall service latency times for YOLOv2 object detection for on-client (with client computation resources equal to 20–50% server resources), traditional store-and-forward of image data to the server for object detection, and service split between in-network computing and forwarding to server.
Applsci 11 02177 g008
Table 1. Initial 10-layer designs for example object detection models.
ModelStructure of First 10 Layers
YOLOv2Conv. + Pool. + Conv. + Pool. + 3 Conv. + Pool. + 2 Conv.
SSD2 Conv. + Pool. + 2 Conv. + Pool. + 3 Conv. + Pool.
VGG162 Conv. + Pool. + 2 Conv. + Pool. + 3 Conv. + Pool.
Faster R-CNN2 Conv. + Pool. + 2 Conv. + Pool. + 3 Conv. + Pool.
Table 2. Overview of obtained service latency T results for YOLOv2 performed on-device (with varying degrees α of server computation resource), store-and-forward networking with server-side processing, and compute-and-forward with α = 0.2 client-side processing up to layer 8 of YOLOv2 and remainder processing server-side. All results are in seconds.
Client, α StoreCompute
0.10.20.30.40.50.60.70.80.91 ( α = 0.2)
Min116.49874.99050.10328.38116.13211.8839.5178.2297.3686.5758.9376.012
Median150.70181.90154.14031.27616.69312.3599.9848.7357.6786.8829.1706.581
Average147.88481.65653.90231.27516.74612.4069.9648.6957.7126.9049.2426.643
Max155.29685.39757.72234.62917.99613.04910.6239.3198.2287.3709.7727.496
StdDev8.9522.5651.8441.6390.4500.3200.3130.2960.2530.2260.2370.408
Publisher’s Note: MDPI stays neutral with regard to jurisdictional claims in published maps and institutional affiliations.