1. Introduction
Sustainability and sustainable development are two of the most significant concerns of our time, urban environments being locations that represent a high percentage of our energy expenses and emissions of gases, waste, resources use, etc. [
1] Managing urban areas has become one of the most critical challenges of the century [
2].
The areas contemplated by sustainable urban development are described within the four pillars of sustainability (Environmental, Social, Economic, and Governance pillars) [
3,
4]. Some areas acquire particular importance as they imply transversal issues that may affect every pillar heavily. Among these, we can find well-being, which has been object of increasingly more study due to its direct impact on human health, and on diverse financial, economic, social, and governance factors [
5]. Well-being is closely related to indoors environmental quality and air quality, which are considered in several of the United Nations Sustainable Development Goals [
6]. Among others, the UN SDGs contemplate Good Health and Well-Being (Goal 3) and Sustainable Cities and Communities (Goal 11), which include as targets to accomplish by 2030 to substantially reduce the number of deaths and illnesses from hazardous chemicals and air, water, and soil pollution and contamination, and to reduce the adverse per capita environmental impact of cities, including by paying particular attention to air quality and municipal and other waste management.
Concretely, air pollution is a relevant issue in relation to human health and well-being: it is the fourth greatest overall risk factor for human health worldwide, after high blood pressure, dietary risks, and smoking. It includes both ambient air pollution (outdoors) and household air pollution (indoors), which combined cause about 6.5 million premature deaths to air pollution [
7], as a result of increased mortality from stroke, heart disease, chronic obstructive pulmonary disease, lung cancer, and acute respiratory infections. It also implies relevant environmental and economic risks.
Indoors or household air pollution includes both pollutants from cooking, heating, and lighting sources; as well as pollutants emitted from non-combustion sources. Within the second group, radon represents one of the biggest concerns, as recent studies on indoor radon in Europe, North America, and Asia indicate that lung cancers attributable to radon may range from 3% to 20% [
8], making it the leading cause of lung cancer among non-smokers. Moreover, applying the United States Environmental Protection Agency (EPA) action level [
9], radon has a role in 25% of all lung cancers [
10]. Statistical data establishes that the causes of death in Spain due to radon gas exposure are between 600 and 2900 deaths per year.
Radon is a naturally occurring radioactive gas that belongs to the 238U decay chain. It emanates from certain rock and soil formations and concentrates in buildings in the absence of adequate ventilation or evacuation systems. Outdoors, it quickly dilutes to very low concentrations and is generally not a matter of concern. However, it may be found in indoor environments, especially in below ground building areas, as they often lack proper ventilation systems.
The exposure to radon in indoor environments such as homes, workplaces, and schools, may end up in a very high time of exposure to high radon levels [
11,
12]. The increase in risk is assumed to be linear in relation to radon concentration (i.e., the risk is ten times higher at 1000 Bq/m³ compared to 100 Bq/m³), and to increase linearly with exposure time as well [
13]. Therefore, both radon levels and exposure time to high radon levels have to be taken into account when aiming to reduce health risks from indoor radon exposure.
Strategies aiming at improved air quality concerning radon interact directly with other climate change mitigation targets, and with several aspects of socioeconomic nature: energy efficiency savings which could materialize in both resources and economic savings, a decrease in certain health issues which could also imply a reduction in healthcare costs, access to a healthy, comfortable living space of workspace, which could result in better performance and productivity [
14].
One of the main solutions to decrease radon levels indoors in existing buildings is continuous ventilation, or the installation of a continuous ventilation system. As much as this technique is an effective, low-cost, easy-to-implement solution for gas dilution, which works simply by exchanging indoor and outdoor air, it implies certain aspects that can compromise energy efficiency in ventilated spaces [
15]. This could result negatively in other aspects, besides working against energy efficiency: it could considerably worsen the comfort of those present in a heavily ventilated area (including noise pollution, inadequate temperature ranges, unpleasant air currents), all of which would eventually result in additional costs, both personal and economic [
16].
Radon measurement protocols should therefore ensure quality and consistency in radon levels while minimizing any possible negative side-effects that solutions such as continuous ventilation would cause, resulting in a sustainable, cost-effective control of indoors radon. Describing the most appropriate indicators allows us to measure the involved variables in the current processes and to measure the effect of taken actions, and therefore develop qualitative and quantitative descriptors that can be used for comparing and evaluating the taken actions [
17].
Air quality is a key factor in environmental indicators, and its importance has grown during the recent decades since it has been linked to both climate change and human health [
18,
19]. Within air quality indicators, pollution is defined as “the contamination of the physical and biological components of the earth/atmosphere system to such an extent that normal environmental processes are adversely affected”, and it may lead to chronic diseases [
20]. Even though gas pollution and air quality might be some of the most relevant and more studied factors within pollution, noise and light [
21,
22] pollution have also been proved to be related to population well-being, and therefore should be taken into account when implementing ventilation strategies.
Energy consumption and efficiency are two closely related concepts. Vast quantities of energy are consumed as economy [
23] and people’s expectations of comfort grow [
24], which makes it vital to move towards more self-sufficient, renewable-based, pollutant-mitigating consumption policies [
25]. Buildings constitute one of the main consumers of energy in cities, besides industry and transportation systems. They must be constructed to be safe, efficient, and self-sufficient, according to their geographical situation [
26] and use. A considerable number of certifications are available nowadays to ensure the accomplishment of these aspects [
27].
These issues are also contemplated in the concept of Indoor Environmental Quality (IEQ), which popularity has grown as the general public became increasingly aware of the health hazards related to contaminated air. IEQ involves several factors, as it refers to the quality of the interior spaces of a building in relation to the well-being of those that make use out of it. It includes previously mentioned aspects such as air quality, comfortable temperature, noise pollution, all of those aspects related to this study. Research has shown that IEQ has a relevant impact on the performance of those who occupy the space [
28,
29,
30]. Besides the before-mentioned health, economic and environmental impacts, poor IEQ in buildings makes its occupants less happy and less productive, specifically in workplaces [
31]. Most existing buildings suffer from inadequate performance, including energy consumption and overall comfort (noise, air quality, temperature, air currents, etc.), which inevitably results in an undesirably low level of IEQ. [
32].
In this work, we designed and developed a system that can autonomously control the air quality of the residence where it is deployed. The automatic air quality control system is based on a previous work of some of the authors of the current work [
33]. In that work, the authors developed a secure radon monitoring system that could send alerts to the selected users based on the radon levels it measured. The current work builds on the previous design and implements the capability of automatically controlling ventilation systems based on the air quality predictions. To achieve this, in this work, we developed control devices that could be attached to an existing ventilation system and can receive commands from the server.
This work’s main goal was not only to develop an automatic air quality control system but to develop an algorithm intended to control, by activating the airflow system, some of the variables the system uses to measure air quality and test the best parameters for the algorithm.
When processing the data, we need to choose which variables the prediction algorithm uses to decide if the airflow is activated. In this work, we present the results of using the system to control the radon level automatically. We chose to use the radon level to assess the system viability and stability due to high radon concentrations being a direct health risk that has a more immediate impact than other environmental measures such as temperature or humidity. To evaluate the obtained results, we took into account other variables that do affect the previously mentioned issues: energy efficiency, thermal comfort, noise pollution and generally, indoor environmental quality.
Concerning the international regulatory state of radon control, public health organizations and governments at all levels are currently implementing different recommendations, guides, and other normative to regulate this issue and developing programs that involve both notions towards a safer quality of life for citizens while maintaining overall growth. Generally, it has been slowly defined during the past few decades, strongly in first world-countries with higher radon concentration issues, but overall it is still an on-going task [
34,
35].
At a national level, Spain became part of the European Atomic Energy Community (Euratom) in 1985 after the signing of the Madrid Treaty, with the main objective of raising the living standard in the Member States and establishing conditions that would contribute to the creation and safe development of nuclear industries.
In 1990, The European Commission published its Recommendation 90/143/Euratom [
36], relative to the protection of the population against the dangers of exposure to radon inside buildings, leading the way towards its proper regulation. In 2018, the European Directive of 2013 [
37] came into force, establishing safety standards for protection against ionizing radiation: radon levels in the air may not exceed 300 Bq/m³ as the annual average concentration of activity in the air. Meanwhile, other countries are already working with lower levels: 100 Bq/m³ in the UK, 200 in Ireland, 150 in the USA. According to the WHO, the risk of cancer grows 16% with each increment of 100 Bq/m³.
The Technical Building Code, which constitutes the main set of regulations of the construction of buildings in Spain since 2006, has not included any updates concerning radon until very recently, despite the above mentioned regulation. In December of 2019, the Council of Ministers finally approved a Royal Decree to Modify the Technical Building Code [
38], which will now include a new section of the “Basic Health Document” dedicated to the protection of buildings against exposure to radon gas [
39]. This section contains the regulatory measures to limit radon’s penetration into buildings based on the radon risk of the municipality in which they are located. In each of these areas, different construction formulas must be implemented to avoid this gas’s immission in new constructions. The publication of a new Instruction IS-33 of the Nuclear Safety Council is also expected, which would provide new aspects of radiological criteria for protection against exposure to natural radiation.
2. Materials and Methods
The air quality control system’s main objective is to monitor and control the air quality of the residence where the system is deployed. This section explains the system as a whole, its composing parts, and the algorithm developed to predict air quality values and automatically control the airflow system.
2.1. The System
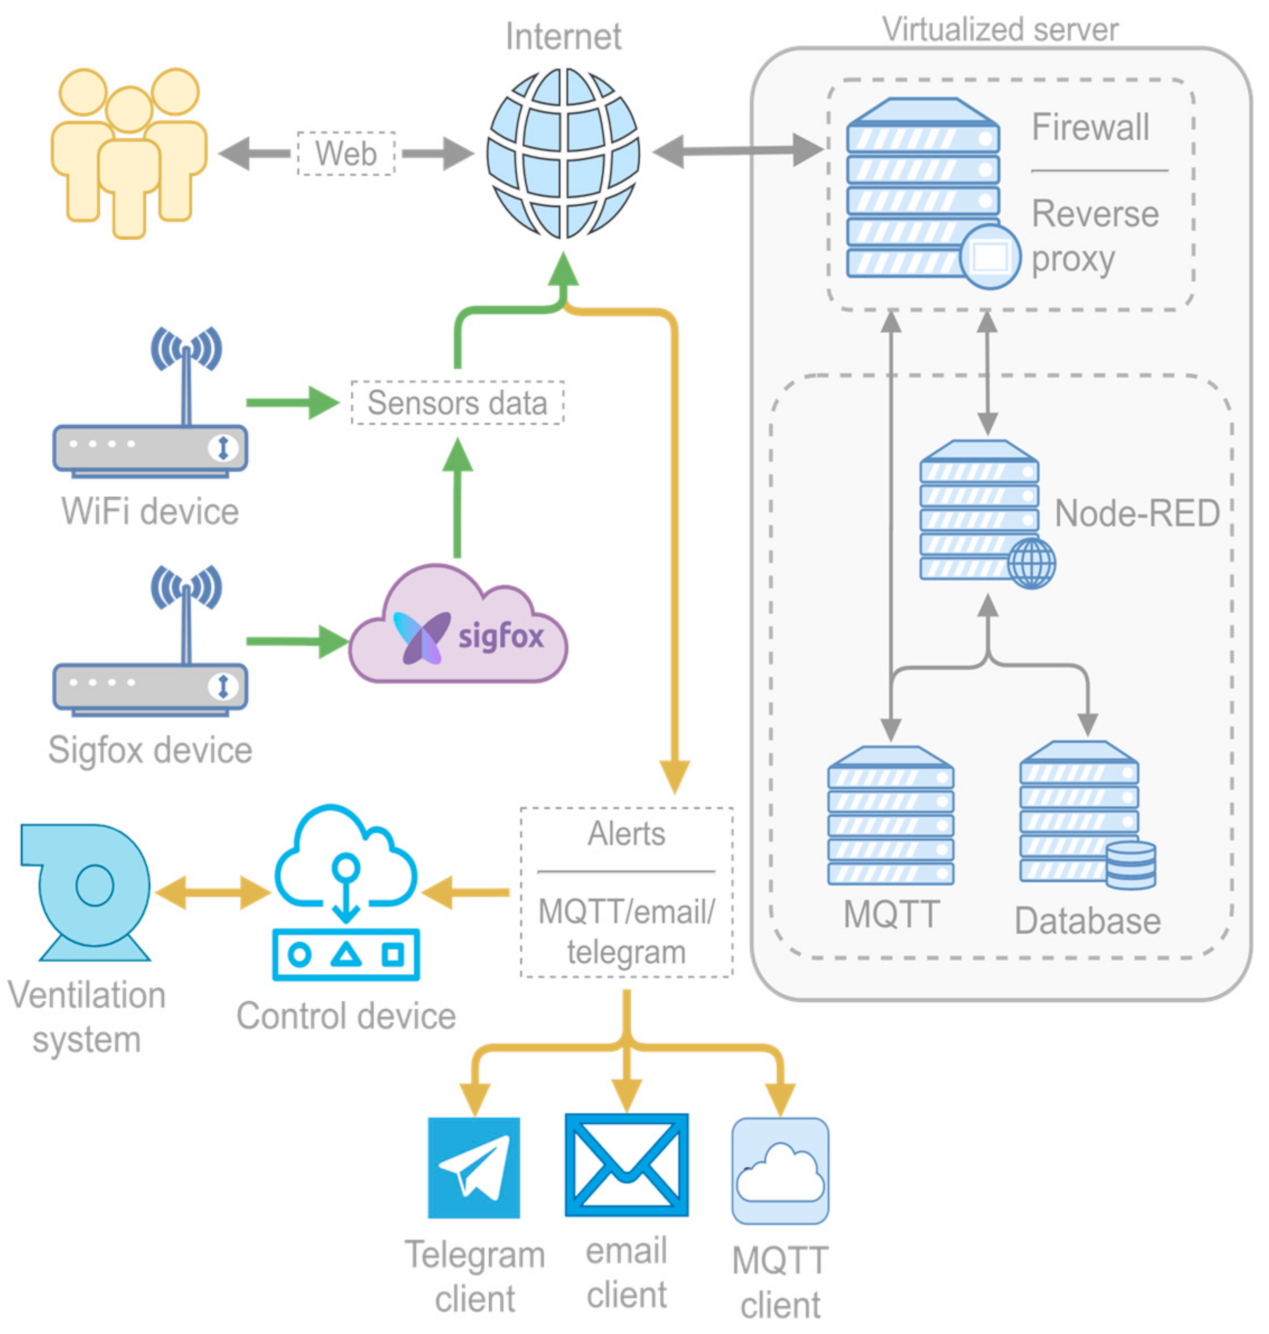
The system is composed of two main parts: the devices and the server (backend).
Figure 1 shows the architecture of the system.
There are two types of devices: monitoring devices and control devices.
The monitoring devices measure several variables related to air quality and send them to the server.
The server gathers all the data from the monitoring devices and stores it in a database. The system uses the data to predict the air quality, using an algorithm developed in this work. With each prediction, the system decides whether to activate/deactivate the airflow system associated with the monitoring device to control the air quality.
The ability to (de)activate the airflow system is provided by the control devices, which can be attached to an existing airflow control mechanism such as a ventilation system or a motorized window and controlled via messages from the backend.
The control devices also inform the server of its associated airflow system state, which the server also stores in the database.
Figure 2 depicts the structure of the system’s database.
There are some situations where there is not an airflow system installed. The air quality control system can send alerts to the configured user via different channels: it can send emails, MQTT messages to the MQTT topic configured for the device, and send messages to a Telegram bot associated with the device. The system can inform the users configured for a given monitoring device via any of those channels. Once notified, the users can decide to open a window or any other measure to improve the air quality.
The system also provides a web frontend where we can visualize the system devices state (both the monitoring devices measures and the control devices state) and the collected data for different time ranges.
The server functionality was implemented using Node-RED, a programming tool for wiring together hardware devices and Application Programming Interfaces (APIs) [
40]. Node-RED provides a browser-based editor that makes it easy to wire together processing flows using predefined nodes that can be easily deployed to its runtime. It also provides nodes to connect to databases and nodes to design and deploy web frontends.
2.2. The Devices
The monitoring devices developed in this project can collect and display data related to air quality. They incorporate several environmental sensors:
The BME280 digital sensor [
41] that measures relative humidity, barometric pressure, and ambient temperature.
The CCS811 digital gas sensor solution [
42] that measures a wide range of Total Volatile Organic Compounds (TVOC), including equivalent carbon dioxide (eCO2) and metal oxide (MOX) levels. Volatile Organic Compounds, also categorized as pollutants, can come from various sources like construction materials, machines, and even people (breathing, smoking, and such). This sensor can give more precise measures if we provide it the temperature, so the monitoring devices use the temperature readings provided by the BME280 sensor to obtain preciser readings of the CCS811 sensor.
The RD200M radon sensor [
43]. An instant radon sensor based on a pulsed ionization chamber. Its main characteristics are:
- ◦
Sensitivity: 0.81 cph at 1 Bq/m3.
- ◦
Measurement range: from 7.4 to 3.700 Bq/m3.
- ◦
Precision: < ±10% at 370 Bq/m3.
- ◦
Default 10 min collision integration period.
- ◦
Each sensor is individually calibrated.
- ◦
It has a built-in vibration sensor for preventing errors in radon detection.
In summary, we have sensors to collect the following data: radon concentration, temperature, humidity, barometric pressure, and TVOCs.
The monitoring devices read the sensors in a continuous mode, but it needs to integrate some sensor readings over time. For instance, radon measures (collisions per second or Becquerels, Bq) need to be integrated over time, usually 10 min to 1 h, to obtain an accurate reading. The monitoring devices use a processing unit that integrates the sensors readings for 10 min and then sends all the readings to the server. The radon sensor manufacturer recommends this sampling period to integrate the measured instant collisions for a reasonable amount of time.
The processing units were developed using the Arduino MKR microprocessor family. A family of microprocessors based on the ARM Cortex-M0+ CPU that can run up to 48 MHz. We chose this platform for the monitoring devices due to the high-performance of the ARM Cortex-M0+ processor and its energy-efficiency. This high performance is needed to integrate and process all the data from the different sensors and to manage all the communications with the server.
The monitoring devices use two different communication technologies: WiFi and Sigfox.
The WiFi devices can be used in locations where a WiFi network is available. WiFi technology is widely used and allows the exchange of higher amounts of data.
The Sigfox devices use the Sigfox Communication Network, a low power wide area networks (LPWAN), which uses an ultra-narrow frequency band to achieve high coverage while consuming low energy.
Sigfox communications use a public band (868MHz). The European Telecommunications Standards Institute (ETSI) regulations stipulate that devices operating on a public band can only transmit 1% of the time over the course of 1 h. In Sigfox, this translates into six messages, of 12 bytes each, per hour, or 144 messages per day. This restriction is not imposed as a hardware limitation, but it is a gentleman’s agreement. Despite the low data exchange rates, it is sufficient for sending the data that the devices developed in this work collect: our devices send data every 10 min, so we need to send 144 messages per day. This transmission speed and maximum data exchange are much lower than WiFi and even lower than other LPWANs such as LoRaWAN and NB-IoT [
44], but the Sigfox network provides broader coverage. This characteristic is especially relevant for environmental monitoring because it allows using the monitoring devices in regions where other communication technologies are not available. For instance, there are some rural areas in the northwest of Spain without internet access. Using WiFi is not possible, and Sigfox allows to use the air quality control system in those locations.
In both cases, the devices send the same data to the server, and the server stores and processes the data in the same manner.
The monitoring devices have an OLED display for visualizing all the readings in real-time. The sensors, processing unit, and the OLED display are assembled in a 3D printed case of 15 × 15 × 30 cm.
Figure 3 shows the aspect of the monitoring device.
As explained before, the system can control an existing airflow system (ventilation system or a motorized window) using the control devices. These devices were implemented using the Arduino platform and have Ethernet connectivity. They also have several relays that can control the power supply of one or several airflow systems on a residence.
In the server, we can associate a monitoring device with a specific control device, so the prediction algorithm would send a command to turn on or off the control device associated airflow system when it predicts a bad air quality value for the location of the monitoring device.
The commands the server sends are via the MQTT protocol. Each monitoring and control device is associated with a topic related to their location. The server sends the command (‘on’ or ‘off’) to the control device’s topic. The device turns on/off the airflow system and sends the airflow system’s state to the appropriate MQTT topic. The server receives the message and stores it in the database.
2.3. The Prediction Algorithm
The piece that links the monitoring devices’ readings and the control devices’ state providing the automatic air quality control is the air quality prediction algorithm. We designed the algorithm with the following requisites:
- 1.
Its inputs should be the current measures of a device, and its outputs should be the commands (on/off) sent to the control device associated with the monitoring device or no command.
- ◦
It could hold an internal state, but it should be minimal to fulfill requisite 3.
- 2.
The relationship between inputs and outputs should be based on a prediction for the air quality measure, not on the current air quality.
- ◦
The air quality measure can be based on a subset of the variables a monitoring device can sense.
- 3.
The algorithm should be simple enough to run on an edge device.
- ◦
It should be fast.
- ◦
It should require low resources: low memory and low processing power.
- 4.
It should have the ability to have different behaviors by changing some parameters.
The implementation of the algorithm fulfilled the requisites in the following manner:
- 5.
Requisite 1: the input of the algorithm is the current radon concentration of a specific monitoring device, the time when the reading was done, and the parameters (see requisite four implementation). The algorithm’s output is the command to send to the associated control device (‘on’ or ‘off’) or no action (‘NULL’).
- ◦
The algorithm has a minimal internal state of two values: the time when the device sent the previous readings to the server and the previous radon slope.
- 6.
Requisite 2: the prediction algorithm uses the radon concentration as the measure of the air quality. We chose the radon concentration as the air quality measure because high radon concentrations cause health problems [
10,
11,
12,
13]. Radon has a notable incidence in Spain, especially in Galicia, where we carried out this work, caused by its strongly linked to granite geology, the primary source of radon emissions [
45,
46].
- ◦
We carried out some initial tests that showed that the radon concentration values showed temporary spikes. The prediction algorithm uses the radon concentration slope to interpolate the radon value, so brief spikes in the radon concentration give a wrong prediction. The prediction algorithm mitigates this effect by using the exponentially weighted moving average (EWMA) of the radon concentration slope (the difference between the current and previous radon concentration over the time difference of the readings). The algorithm uses the radon concentration slope EWMA to predict the future radon concentration by interpolation, using the time window specified.
- ◦
If the algorithm predicts that the radon concentration will be above the configured threshold, it outputs an ‘on’ command. The server sends it, via MQTT, to the control device associated with the current monitoring device. It also sends the corresponding “high radon concentration” alert via MQTT, email, and Telegram, if configured.
- ◦
If the airflow system is on and the actual radon concentration is below the threshold, the algorithm outputs the command for stopping the airflow system, and the server sends it to the associated control device. It also sends the corresponding “back to normal” alert via MQTT, email, and Telegram, if configured.
- 7.
Requisite 3: each time a monitoring device sends a new reading to the server, the prediction algorithm runs. The algorithm restores its state for the current monitoring device (two values as explained in the requisite one implementation). Then the algorithm sets some constants, calculates the current radon concentration slope, calculates the EWMA using the current reading and the previous state, and outputs a command if needed.
- ◦
Although the algorithm runs every time a new reading is sent to the server, it is fast, and it only outputs a command if it predicts a high radon concentration or the airflow system needs to be turned off. This behavior reduces the amount of data sent between the server has to send to the devices and the MQTT, Telegram, and email clients, so the processing capacity needed for the server is reduced, and we can deploy it on machines with low resources.
- ◦
Currently, the algorithm runs on the server, and its behavior is the same for all monitoring devices. However, we established this requisite so the algorithm could run on an edge device (the monitoring device). This would allow the system to work when the devices cannot connect to the server due to communication failures. This also enables the possibility of deploying a reduced system consisting of a monitoring device and a control device placed in a residence and connected to the same local network, where they communicate directly with each other without the need for a server.
- 8.
Requisite 4: the ability to change the prediction algorithm’s behavior, and the results it provides, is achieved by changing the interpolation time window. The algorithm uses this value as the point in time where it predicts the future radon concentration. Increasing this parameter would make the algorithm turn on the airflow system sooner.
- 9.
The algorithm uses some fixed values to operate. The most critical fixed value is the radon concentration used as a threshold in the algorithm. The WHO handbook [
12] states “...establishing a national annual average concentration reference level of 100 Bq/m³, but if this level cannot be reached under the prevailing country-specific conditions, the reference level should not exceed 300 Bq/m³”. This work was carried out in Galicia, in the northwest of Spain, where the indoor radon concentration could naturally be above 400 Bq/m
3. Thus, the algorithm uses the 300 Bq/m³ limit of the WHO handbook as the radon gas level threshold. The RD200M sensor can read radon concentration from 7.4 to 3.700 Bq/m
3, so its characteristics make it suitable for the air quality control system. Another fixed value is alpha, the exponential moving average factor. The algorithm sets it to 0.85, a value that mitigates the brief radon concentration spikes’ effect while giving more weight to the current radon concentration [
47]. Another fixed value is the time between readings that makes the algorithm discard the old readings. The algorithm implements this behavior, so if there were a communication failure, the system would not work based on old data that could not resemble the actual radon concentration. The algorithm sets this to one hour, i.e., if the last reading was 1 h before the current one, the algorithm resets the moving average, so it only takes the current value into account.
Algorithm 1 shows the algorithm’s implementation pseudocode, and it depicts all the explained behavior that implements the requisites.
| Algorithm 1: Air quality prediction algorithm using radon concentration as the air quality measure |
| INPUT current radon concentration rl, current time reading t, interpolation time window INT_WD |
| OUTPUT air flow system control command (‘on’ or ‘off’) or no command (NULL) |
| Step 1 Set ALPHA = 0.85; (exponential moving average factor) |
| MV_AVG_TL = 3600; (moving average time limit, 1 hour by default) |
| RADON_LIMIT = 300; (radon limit in Bq/m3) |
| current_slope = 0; |
| moving_average = 0; |
| Step 2 Recover previous data from storage: |
| prev_t; (time of the previous reading) |
| prev_rl; (previous radon concentration) |
| prev_ma; (previous moving average) |
| Step 3 If previous data != NULL and (t - prev_t) < MV_AVG_TL |
| slope = (rl – prev_rl)/(t - prev_t ) |
| ma = ALPHA * (slope) + (1 – ALPHA) * prev_ma |
| Step 4 Save current data to storage: t; rl; ma; |
| Step 5 Set currently_over_limit = rl >= RADON_LIMIT; |
| future_over_limit = (rl + ma*INT_WD) >= RADON_LIMIT |
| Step 5 If currently_over_limit or future_value_over_limit then |
| Set air_flow_command = ‘on’; |
| Else |
| Set air_flow_command = ‘off’; |
| Step 6 Recover air flow control status from storage: air_flow_status; |
| Step 7 If air_flow_status == NULL or air_flow_status != air_flow_command Then |
| OUTPUT air_flow_command |
| Else |
| OUTPUT NULL |
3. Results and Discussion
In this section, we provide the results of testing the automatic air quality control system as a whole and the prediction algorithm, in particular, using different values for the interpolation time window that modifies the prediction algorithm’s behavior, and thus the behavior of the system.
The tests were carried out in a radon research room located inside the Center for Technological Innovation in Construction and Civil Engineering (CITEEC in Spanish) of the University of A Coruña, Spain [
48]. The room is in a location where the radon concentration is naturally high. It is equipped with usual office furniture to emulate the heat and air dynamics of a regular workplace.
The room has the same ventilation system as the rest of the building rooms, a Soler & Palau TD-350/100-125 ventilation system [
49]. This ventilation system can provide an airflow of 350 m
3/h at free discharge at a theoretical sound pressure level around 40 dB, measured in free field condition at 3m working at 2235 rpm.
As previously explained, radon gas can enter a residence through pipes (electrical, water, and similar), cracks in the construction, or other openings in the room walls. The best way to avoid radon gas entering a room is to increase the room’s air pressure. This is achieved in the radon research room by using the TD-350/100-125 fan to force air from the outside of the room to the inside. The fan is coupled with a Soler & Palau MBE-125/12B heater [
50], which heats the air forced inside the room, increasing the air pressure and avoiding the room’s temperature to fall drastically.
The ventilation system’s total power consumption is around 1220 W, and the total noise is around 70 dB.
We attached a control device to the ventilation system so that the air quality control system can activate it remotely. We placed a monitoring device in the room and configured the association between the monitoring device and the control device in the server.
The experiments consisted of testing 10 min, 30 min, 1 h, and 2 h for the prediction algorithm’s interpolation window. Each test was carried out, in the same condition, for a week (168 h), where the devices gathered data in a continuous mode, sending data to the server every 10 min. All the radon concentrations presented in this section have the error of measurement that the radon sensor has: less than 10% at 370 Bq/m³.
To compare the results with the room’s natural radon concentrations, we collected data for a week without the ventilation system activated.
Figure 4 shows the radon concentration evolution during that week, where the red horizontal line depicts the radon threshold the system uses (indicated in the WHO handbook).
We chose a week for each test because a week is a time long enough to avoid temporary weather changes that could affect the radon concentrations, and it is short enough to avoid seasonal influences because the total test time is five weeks.
Table 1 shows the minimum, mean and maximum radon concentration for that room and the total time the radon concentration was above the threshold during one week without the ventilation system activated. The time above limit is a crucial measure because regulatory limits are established for annual continuous levels, not temporary ones; thus, this is the value we should focus on to select the appropriate interpolation windows for the prediction algorithm.
As we can see in
Table 1, the natural radon concentration is almost 11 times higher than the recommended concentration, posing a clear health hazard, and the radon concentration was higher than the threshold 99% of the week that the test lasted.
As explained, the experiments consisted of testing 10 min, 30 min, 1 h, and 2 h for the interpolation window of the prediction algorithm.
Figure 5 shows the radon concentration evolution (blue line) for each interpolation time window tested for a week each.
The system controls the air quality by turning on and off the ventilation system. In these tests, the air quality was measured as the radon concentration due to its too high natural values. The system needed to mitigate the radon concentration has to be powerful, so it has a high power consumption and high noise, as the ventilation system technical characteristics show.
The system’s main objective is to maintain the radon concentration below the threshold. Its secondary objective is to reduce the power consumed by the ventilation system and the noise, thermal and air waves discomfort it may produce, resulting in a worsened indoors environmental quality. The primary objective would keep the people working in the room where the system is deployed safe, and the secondary objective would allow them to work more comfortably and be more productive, while minimizing the cost of used resources (ventilation system).
The background of each image in
Figure 5 shows, in red, when the prediction algorithm activated the ventilation system.
Table 2 shows the mean radon concentration for each interpolation time window tested, the maximum level reached, and the total time the airflow system was turned on during the week that each test lasted.
We can see in
Table 2 that all the interpolation window values tested can maintain the mean radon concentration below 70% of the threshold, when naturally it is 4.1 times higher than the threshold, as shown in
Table 1. The 10 min and 2 h interpolation windows are the ones that provide the lowest mean radon concentration.
We can also see in
Table 2 that all the interpolation window values tested lowered the Maximum radon concentration with respect to the highest level reached naturally. Using the prediction algorithm with the 2 h interpolation window provides the lowest Maximum radon concentration. In this case, the maximum radon concentration is approximately 15% of the highest value reached naturally, without the ventilation system activated (almost a 86% decrease).
The time the algorithm kept the ventilation system on to achieve the previous values are similar, the interpolation window providing the lowest value and the 1-h interpolation window the highest. The algorithm configured with the 10 min interpolation window needed to keep the ventilation system on approximately 28% of the total test time to keep the radon concentration below the threshold.
As explained, the regulatory limits are established for annual continuous levels, not temporary ones; thus, the time above limit is the metric we should focus on to select the appropriate interpolation windows for the prediction algorithm.
Table 1 shows that the 2 h interpolation window was the value that kept the radon concentration below the threshold the longest. In this case, the radon concentration was below the threshold 90% of the time, when naturally it was below the threshold only 0.01% of the time, as can be calculated with the values shown in
Table 1.
The boxplot shown in
Figure 6 compares the natural radon concentration distribution and the distribution of the radon concentration during the tests for the different interpolation time windows. The horizontal red bar shows the radon threshold (300 Bq/m³). The figure shows that the system kept the median radon concentration below the threshold for all interpolation windows tested. The 10 min and 2 h windows provide the best results, but the ones provided by the 2 h interpolation window are less dispersed.
The air quality metric used for all the tests is based on the radon concentration. This metric is critical due to high radon concentrations being a direct health risk that has a more immediate impact than other environmental measures such as temperature or humidity. Despite this, it is interesting to evaluate the evolution of temperature and humidity during the tests due to the effect these variables have on energy efficiency, thermal comfort, noise pollution, and indoor environmental quality.
Figure 7 shows the temperature and humidity evolution for each interpolation time window tested for a week.
When interpreting these results, we need to consider that the air quality control system did not try to control the temperature and humidity during the test, and also that the ventilation system moves air from the outside of the building to the room, making the temperature and humidity dependent on the weather conditions during the test.
We can see that the one-hour and two-hour interpolation windows provide the most stable temperature levels. Still, the two-hour interpolation window kept the temperature at a more comfortable level. The humidity also suffered fewer fluctuations during the tests for the one-hour and two-hour interpolation windows.
As previously explained, when exposed to radon, the risk increment is assumed to be linear with respect to radon concentration ((i.e., the risk is ten times higher at 1000 Bq/m³ compared to 100 Bq/m³). The risk increment is also linear with respect to the time one is exposed to high radon concentrations, as shown in [
13]. The time one is exposed to high radon concentrations is an essential metric because the WHO handbook and the European regulation establish the limits for safe annual continuous radon levels, not temporary ones [
12,
37]. The air quality control system uses this limit (300 Bq/m³) as a threshold for activating the ventilation system when it predicts a radon concentration above the threshold. To reduce health risks from indoor radon exposure, we need to consider both radon concentrations and exposure time to high radon concentrations. Therefore, to select the interpolation window that offers the best results, we also need to consider both metrics.
The results show that the ten minutes and two hours interpolation windows provide the lowest mean radon concentration. The two-hour interpolation window provides the lowest Maximum radon concentration.
The results also show that using a two-hour interpolation window gives the best results regarding the total time it keeps the radon below the limit during the test (lowest exposure time).
The radon concentration using the two-hour interpolation windows also shows less dispersion (less variability), so the radon concentrations are more stable.
Considering these results, the two-hour interpolation window provides the best results among all the interpolation windows tested.
4. Conclusions
This work’s main objective was to create a fully autonomous low-cost air quality control system that would maintain the air quality at a certain level. A secondary objective was to define an air quality metric and use the system for testing several interpolation windows for the air quality prediction algorithm that uses the defined metric and compare the results to see which one would achieve the best air quality given the metric.
We achieved the primary objective by creating a low-cost system based on open source technologies, consisting of monitoring devices able to collect radon concentration, temperature, humidity, barometric pressure, and TVOCs.
To achieve the second objective, due to the health problems that high radon concentrations cause [
10,
11,
12,
13], and the particular high radon concentration of Galicia (northwest of Spain), we used the radon concentration as the air quality metric. When the devices send data to the server, the prediction algorithm predicts the air quality using the defined metric. If the algorithm predicts a decrease in air quality, it sends a command to the control devices to turn on the airflow system they are attached to, located in the same room as the monitoring devices.
We carried out several tests in a radon research room with naturally high radon concentration, using 10 min, 30 min, 1 h, and 2 h for the air quality prediction algorithm’s interpolation window, and compared the results with the levels reached with the airflow system deactivated. The results show that using a two-hour interpolation window gives the best results regarding the total time it keeps the radon concentration below the limit and the mean and maximum radon concentration reached during the test.
This work’s objective was to test the system’s fully autonomous nature and create an air quality metric to test it. In future works, we plan to create a multivariate, more complex air quality metric that would consider more of the variables the monitoring devices can sense. This more complex metric should be a weighted derived metric that uses the radon concentration, temperature, humidity, and TVOCs. The metric should give more weight to the radon concentration due to the health risk it poses. The weight the metric assigns to the other variables could be determined by testing to obtain values close to the ones considered optimal in the literature [
28,
29,
30].
Although the prediction algorithm created in this work is simple, the results prove that it works appropriately with a simple air quality metric, such as the one used in this work. Supposing a more complex air quality metric does not work appropriately with the current prediction algorithm, we could use a machine learning-based predictor that used all the variables the devices are collecting. However, this kind of model also requires a more powerful device to run it, and the algorithm created in this work is intended to run on a compact edge device.
One crucial challenge of using a machine learning predictor would be to create the dataset for training the machine learning model. The air quality monitoring and airflow control based on those values would be a dynamic system. The outputs of a prediction model (the commands to the airflow system) directly impact the system’s input, the air quality. Creating a dataset would entail running the system and turning the airflow system on and off at as many different air quality states as possible to gather a fair distribution of data that maps the prediction model’s inputs and outputs.
We only tested the system with an airflow system that can be turned on or off, but we cannot regulate its speed. As a possible improvement, we could modify the prediction algorithm to output the percentage of the total speed the airflow system should work at and the heater’s temperature, thus reducing the noise and power consumption further. This percentage could be based on the amount the prediction algorithm predicts the radon concentration will be above the threshold.


 ,
, 


