Article

Locomotion of Self-Excited Vibrating and Rotating Objects in Granular Environments

1
College of Liberal Arts and Sciences, National University of Defense Technology, Changsha 410073, China
2
Gonville & Caius College, University of Cambridge, Trinity St., Cambridge CB2 1TA, UK
*
Authors to whom correspondence should be addressed.
Appl. Sci. 2021, 11(5), 2054; https://doi.org/10.3390/app11052054
Submission received: 2 December 2020 / Revised: 28 January 2021 / Accepted: 10 February 2021 / Published: 25 February 2021

Abstract

:
Many reptiles, known as ‘sand swimmers’, adapt to their specific environments by vibrating or rotating their body. To understand these type of interactions of active objects with granular media, we study a simplified model of a self-excited spherical object (SO) immersed in the granular bed, using three-dimensional discrete element method (DEM) simulations. Modelling the vibration by an oscillatory motion, we simulate the longitudinal locomotion of the SO in three modes: transverse vibration, rotation around different axes, and a combination of both. We find that the mode of oscillation in y direction coupled with rotation around x-axis is optimal in the sense that the SO rises fastest, with periodic oscillations, in the z direction while remaining stable at the initial x position. We analyze the physical mechanisms governing the meandering up or down and show that the large oscillations are caused by an asynchronous changes between the directions of oscillation and rotation. We also observed that the SO’s rising rate is sensitive to three parameters: the oscillation amplitude, the oscillation frequency, f, and the rotation angular velocity, Ω . We report the following results. 1. When the frequencies of the rotation and transverse motion are synchronised, SO rises when Ω < 0 and sinks when Ω > 0 ; the average rising/sinking rate is proportional to | Ω | . 2. The rising rate increases linearly with the oscillation amplitude. 3. There exists a critical oscillation frequency, above and below which the rising mechanisms are different. Our study reveals the range of parameters that idealized ‘swimmers’ need to use to optimize performance in granular environments.

1. Introduction

Granular Materials (GMs) are common in nature. A GM is defined as an assembly of many discrete macroscopic solid particles that interact via a hard-core potential and dissipate energy on collisions [1]. GMs can behave like a solid, supporting loads, or flow like a fluid [2]. However, full continuum theories for the solid and fluid [3] behaviors are still to emerge. Therefore, understanding GM in general is still a challenging problem.
Some sand lizards, such as Scincus scincus, are well known to ‘swim’ through sand beds by effecting a solid-to-fluid and back transition of the media around them [4,5]. Such lizards can both dive into desert sand, to hide from heat and predators, and travel beneath the dry sand surface with considerable speed over reasonable distances [6,7,8]. These capabilities are enabled: by physiological attributes: the spatula-shaped snout, the streamlined body shape, the smooth integument, and fringed digits [4,9,10], which are well adapted to life in the desert, and by the rapid lateral oscillations that loosen the sand surrounding the swimmer’s body, leading to vertical burrowing. Another mechanism of moving in GM is by helical rotation, such as employed by Pelargonium and Erodium seeds for digging into cohesionless soils [11,12]. This mechanism is reminiscent of a common propulsion method of many bacterial species, such as E. coli, that propel themselves by rotating bundles of helical filaments [13,14]. Thus, discovering mechanism of locomotion for organisms in GMs is of great engineering significance, not least to the development of walking robots in sandy terrains.
Recently, Maladen et al. [7] have studied the swimming of sandfish Scincus scincus in sand using high-speed X-ray imaging. Takashi et al. [15] have constructed a simplified model of periodic contraction and extension of large intruders in granular beds, using an event-driven simulation. A number of researchers applied the resistive force theory (RFT) [16,17] in fluid mechanics to model the sandfish swimming dynamics [18,19] and concluded that RFT predicts reasonably well the motion on granular surfaces [20]. Legged sand walking robots and sand swimming robots have been developed, based on experiments and simulations [21,22]. However, the aforementioned studies focused mainly on the in-plane motion the walking or swimming, less is known about the mechanics of large-scale vertical motion within the GM.
The main aim of this work is to investigate the vertical behavior of a self-energized SO within a dense granular medium. In this paper, we report three-dimensional DEM simulations of the locomotion of vibrating and/or rotating SOs, studying their trajectories under various conditions. To the best of our knowledge, this is the first work to study such a coupled mode of motion, which could prove very efficient for subsurface locomotion. Specifically, we studied the effect of three parameters: A, Ω , and f, on the rise/sink of SO in this mode of motion. The results of this study have the potential to advance the design of a bio-inspired robot to rapidly rise to the surface or dive into sand to a significant depth. The rest of the paper is organized as follows. In Section 2 we describe the numerical simulation method and the system. In Section 3 we present all the simulation results and includes our analysis and discussion. In Section 4, we present our conclusions and suggest future work.

2. Simulation Implementation Details

2.1. Simulation Method

Numerical simulation of GMs are used extensively both as a cheap alternative to experiments and because they enable good resolution of grain-scale analysis. Advances in computer processing speed continue making this approach ever more attractive, as well as the inherent difficulties in constructing continuum theoretical models for the dynamics of, and in, non-cohesive GMs [23]. In particular, the DEM [24,25,26] has become a powerful and reliable tool for numerical modelling of granular materials. The rationale underlying DEM simulation of granular dynamics is based on the dynamics of collisions between particles. Specifically, the method requires a time-discretized form of equations of motion for particles displacements and rotations, as well as a force-displacement relation for particle interactions [27].
In the DEM method, the simulation starts from an initial state of a collection of particles within a designated region. The particles have mathematically well-defined shapes, which can be arbitrary, in principle. Particle properties are used to calculate interaction forces between particles on collision [28]. The (intergranular) interactions are often modelled as linear springs, dashpots, and joints [28,29], whose normal and tangential components (with respect to the overlap) are given by, using Hertz contact model,
f n = k n δ 3 / 2 η n v n δ 1 / 2
f t = k t α η t v t | f t | μ | f n | μ | f n | | f t | > μ | f n |
where the δ is the normal overlap, α is the tangential displacement of the colliding particles from the initiation of the contact, μ is the particle-particle friction coefficient, and v n and v t are the normal and tangential component of the relative velocity at the contact points, respectively. The parameters k n , k t , η n , and η t represent, respectively, the normal and tangential hardness and viscoelastic coefficients, which are functions of material properties:
k n = 4 3 Y * R * ; k t = 8 G * R * ; η n = 5 β k n m * ; η t = 2 5 6 β k t m *
The material characteristics in (3), are calculated as follows,
1 Y * = 1 ν i 2 Y i + 1 ν j 2 Y j ; 1 G * = 2 ( 2 ν i ) ( 1 + ν i ) Y i + 2 ( 2 ν j ) ( 1 + ν j ) Y j 1 R * = 1 R i + 1 R j ; β = l n e l n 2 e + π 2 ; 1 m * = 1 m i + 1 m j
where Y is Young’s modulus, ν Poisson’s ratio, e the restitution coefficient, G the shear modulus, R the particle’s radius, and m its mass. Using the forces, determined from Equtions (1) and (2), in Newton’s second law, a particle’s acceleration, a , is determined and, from it, the particles velocity and displacement increments from time t to time t + Δ t , using the Velocity-Verlet integration method:
v ( t + Δ t ) = a ( t ) Δ t ; r ( t + Δ t ) = r ( t ) + v ( t + Δ t ) ( Δ t )
This is done at each time step for each particle.

2.2. Simulation Software

We used the open-source software LIGGGHTS [30,31] to simulate numerically a SO moving within a granular medium. This software is particularly convenient for simulating spherical objects [32]. For simplicity and to avoid using too many parameters, we represent the self-excited object as a sphere, larger than the bed particles. The spherical object (SO) can vibrate, rotate or do both simultaneously. We investigated in the simulations the dynamics of the SO, in particular the effects on its vertical locomotion, as well as of the granular medium surrounding it. To compare with existing experiments, we parameterized the particle material properties to imitate SO dynamics in sand or glass bead beds, for which standard values are used in Molecular Dynamic simulations [33]. The material properties of the SO are adjusted to achieve the largest possible rise and sink rates. Table 1 summarized the values of the material properties of the bed particles and SO used in our simulations.The positions of the particles are updated in discrete time steps [34].
To model the physical phenomenon, the larger the number of simulated bed particles the better. Yet, this number os constrained by running time and memory resources, partly mitigated by parallel processing on high performance supercomputers. We used the supercomputer, Sunway-TaihuLight, in Wuxi. The service consists of a Sunway26010 massively parallel processor (MPP) distributed memory system. It has 128 main memory per 24 core processor, using Non-Uniform Memory Architecture (NUMA). In our simulation, we specified processors with a factorization P = 6 × 6 × 6 , i.e., 6 processors in each of the x, y, and z directions.

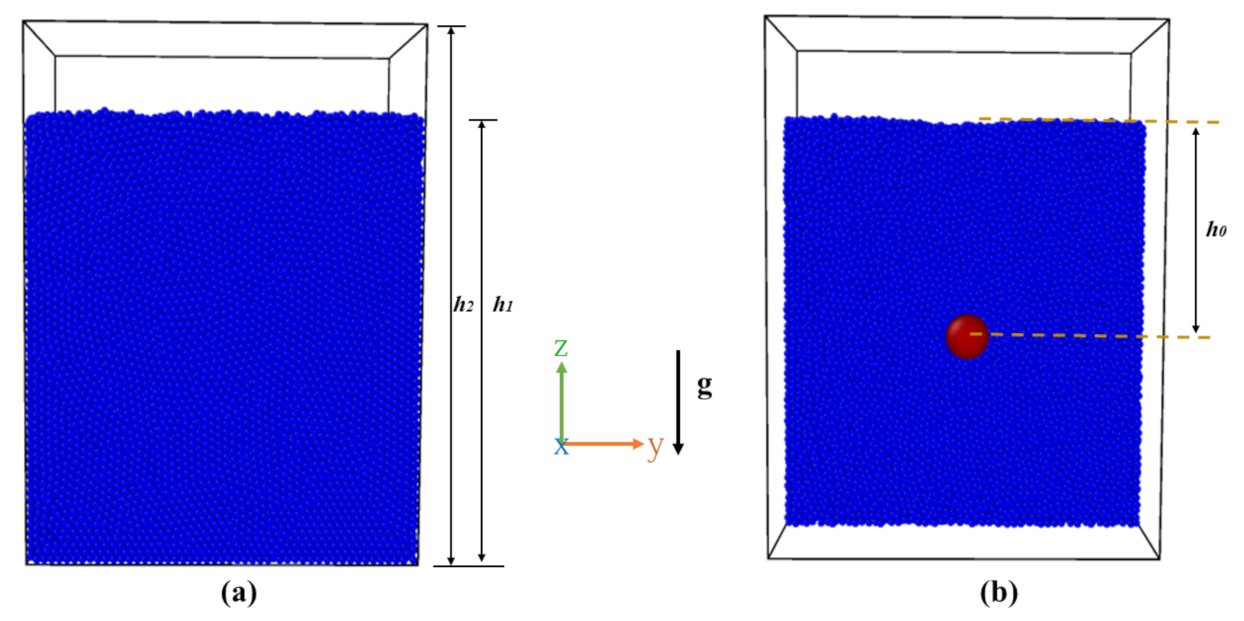
2.3. The Simulated System

The simulations took place in a container of dimensions 0.5 m × 1.0 m × 1.3 m. We used periodic boundary conditions in the x and y directions, with the dimensions in these direction deemed sufficiently large to avoid boundary effects, as well as interactions of the SO with its periodic image. The bottom of the container was fixed at z = 0.5 m. Earth gravity was in the z direction. We generated bed particles with diameter d 0 = 0.02 m and density ρ 0 = 2500 kg/m 3 at the top of the container and let them fall under gravity and fill the box up to z = 0.0 m. At this stage, a SO of diameter d i = 0.12 m and density ρ i = 2500 kg/m 3 was placed as close as possible to position ( 0 , 0 , 0 ). Then, more bed grains were poured into the box up to the level of z = 0.5 m. In total, a bed of 8 * 10 5 particles was generated, filling a volume of 0.5 m × 1.0 m × 1.0 m, with the SO buried in its center (Figure 1). Before starting each formal simulation, we ran an initial equilibration simulation to stabilize the system structure. The system was considered in equilibrium when the kinetic energy dropped to 10 4 of its initial value.
Starting from the equilibrated initial state, we carried out two sets of simulations. In the first, the SO was driven by excitation in a composite mode of oscillation and constant speed velocity rotation. The oscillation is simulated by a periodic oscillation in the y direction, y = A s i n ( 2 π f t ) , with amplitude A = 0.03 m and frequency f = 3 Hz, using the values in [35]. We set the SO rotations around x-axis, y-axis, z-axis, and an x z -axis at an oscillating angular velocity of amplitude ω = 80 rad/s, using the value in [36], which was shown to lead to a significant rise of SOs. In the second set of simulations, the SO was driven by both directional and rotational oscillations, y = A sin ( 2 π f t ) and ω = Ω sin ( 2 π f t ) , respectively. We varied the three parameters, A, Ω , and f in a series of DEM simulations, described in Section 2.1, and analyzed their effect on the motion of the SO. The time step in all the simulations was 10 5 s. Altogether, we ran 58 simulations, each with different parameters, 56 of which for 4 × 10 5 time steps, corresponding to = 4 s physical time, and 2 simulations for 5 × 10 5 time steps, corresponding to = 5 s physical time. One simulation of 4 s physical time took about 2 h to run in CPU time.

3. Results and Analysis

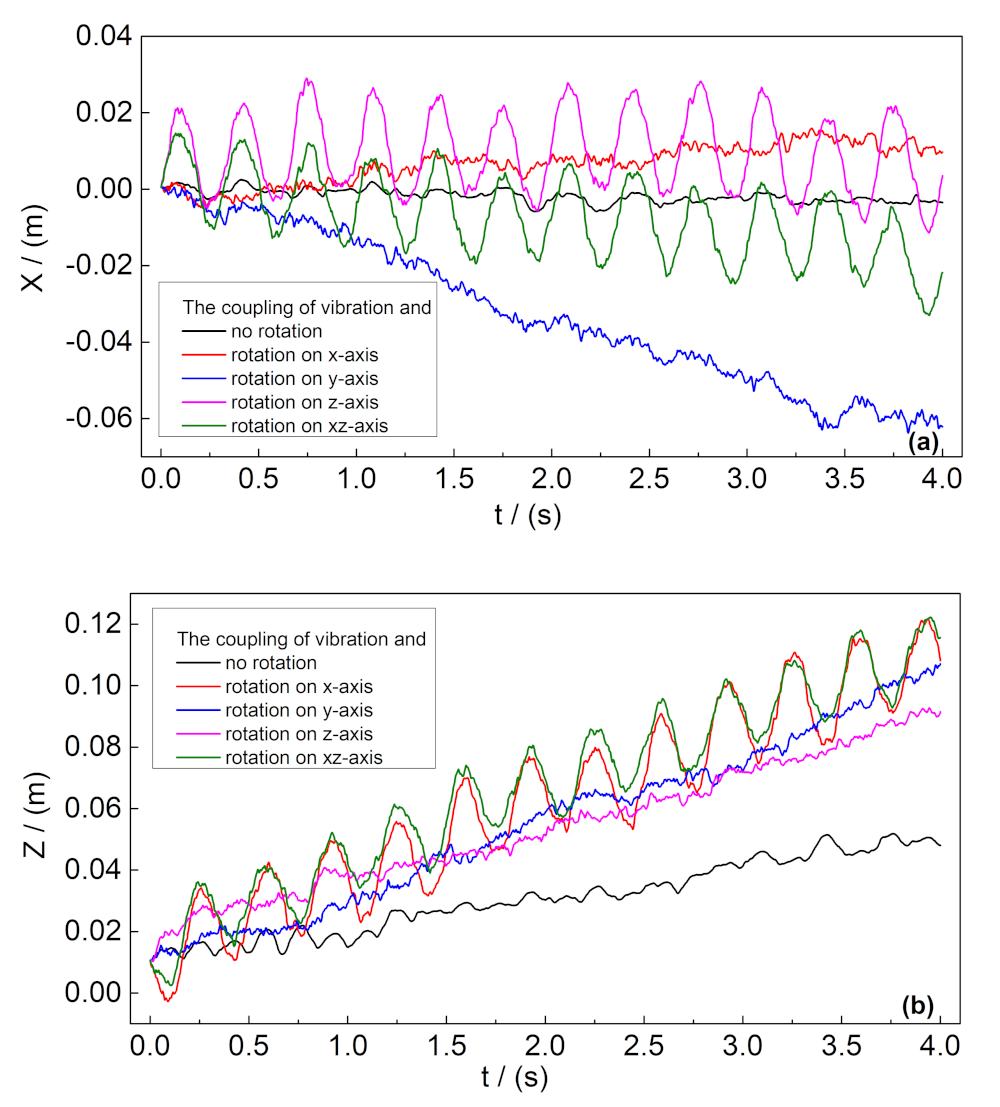
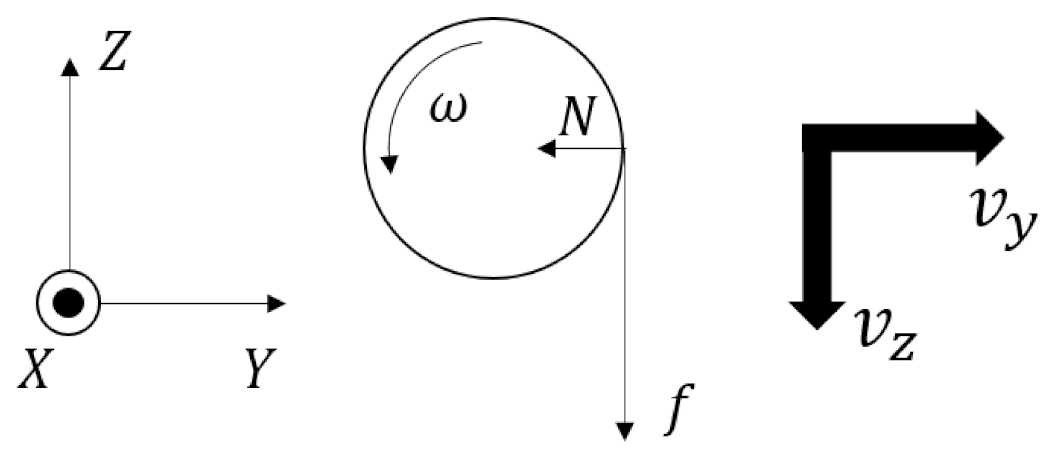
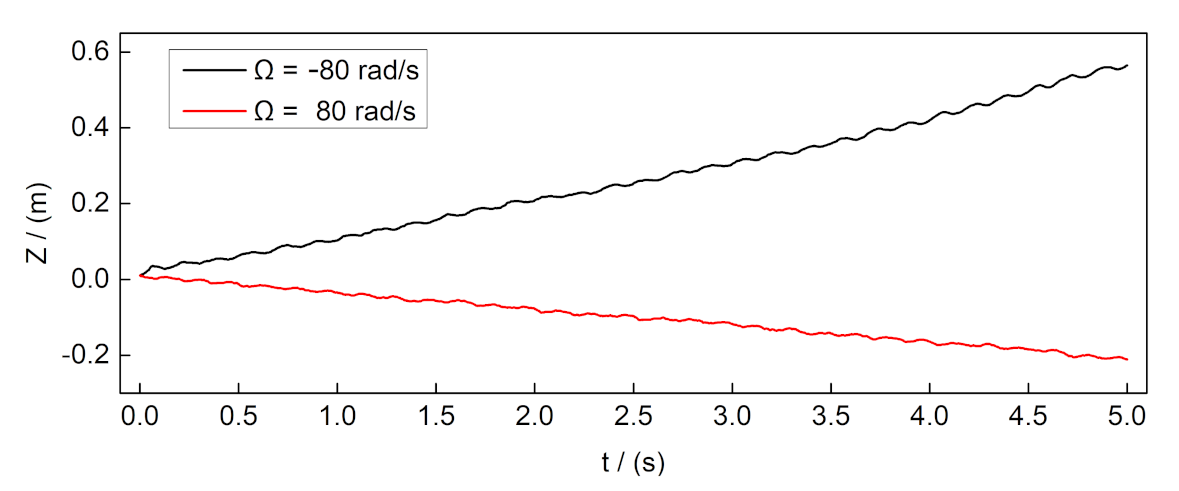
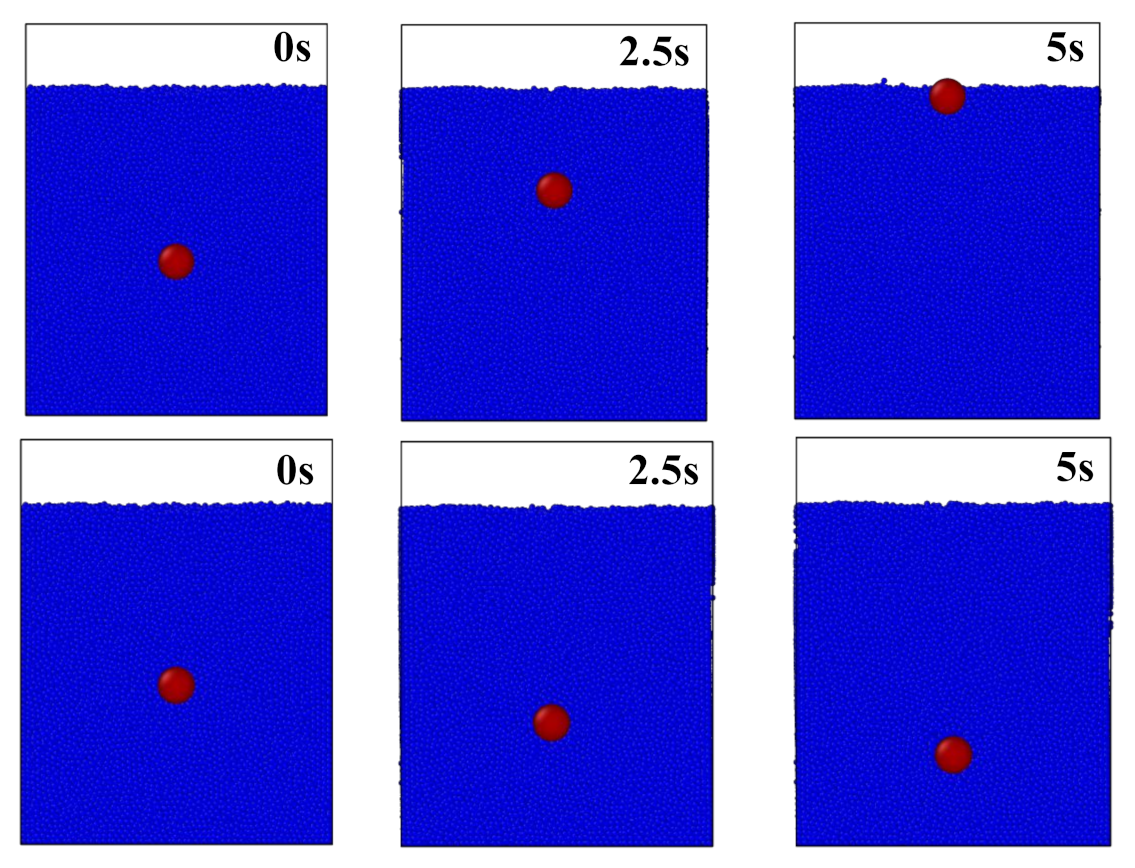
3.1. Coupling Oscillatory Translation and Constant Rotation Speed

We set the oscillation amplitude and frequency to A = 0.03 m and f = 3 Hz, and the rotation angular velocity to ω = 80 rad/s, with ω > 0 denoting henceforth a counter-clockwise rotation of the SO. We ran five types of simulations: only vibration, vibration and rotation about the x-, y-, z-, or x z -axis. In each run, we monitored the dynamics and tracked the trajectory of the SO. Observing that its movement in the y direction is relatively small, we focus on the displacement in x and z directions.
Our observations, shown in Figure 2, can be summarized as follows.
  • The displacement in the x direction oscillates strongly at frequency f whenever ω has a component about the z-axis, while otherwise it is relatively smooth.
  • The x displacement is vanishingly small except when the rotation is about the y-axis, in which case the SO moves steadily in the x direction.
  • The displacement in the z direction oscillates strongly at frequency f when ω has a component about the x-axis, otherwise it is relatively smooth.
  • The displacement in the z direction is always upward, with rotation enhancing the rising rate.
To understand the dynamics under coupled vibration and rotation, consider, for example, rotation about the x-axis. As the SO moves in the + y direction, the pressure from the medium on its forward moving ( + y ) surface is larger than the pressure on the rear surface. The constant counter-clockwise rotation around the x-axis then induces a friction force in the z -direction on the forward moving surface, as illustrated in Figure 3, and a lower friction force in the + z direction on the rear surface. Therefore, the combined action of vibration and rotation leads to an overall downward force during this one-quarter of the cycle. On changing direction, the pressure is higher on the surface facing the y direction and, since the rotation direction is constant, the overall friction force is upwards. Thus, the friction force oscillates between up and down with the translational motion. Nevertheless, the displacement in the + z direction is larger than in the z direction because the layer supporting the SO is slightly less fluid than the medium above it, being deeper in the medium. This leads to an overall rise with time, consistently with the displacement marked in the red line in Figure 2b.
Since the displacements in the x direction are negligible compared to those in the y z plane, shown in Figure 2, we focus in the following on the rising and sinking in the z direction.

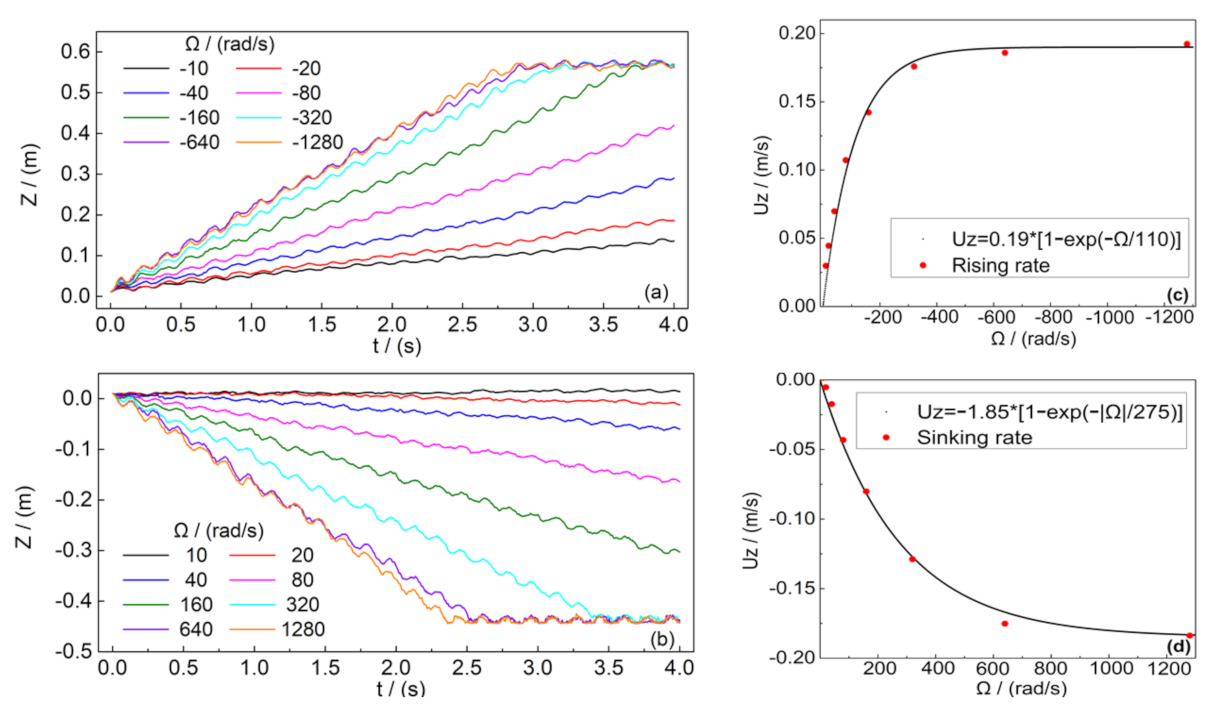
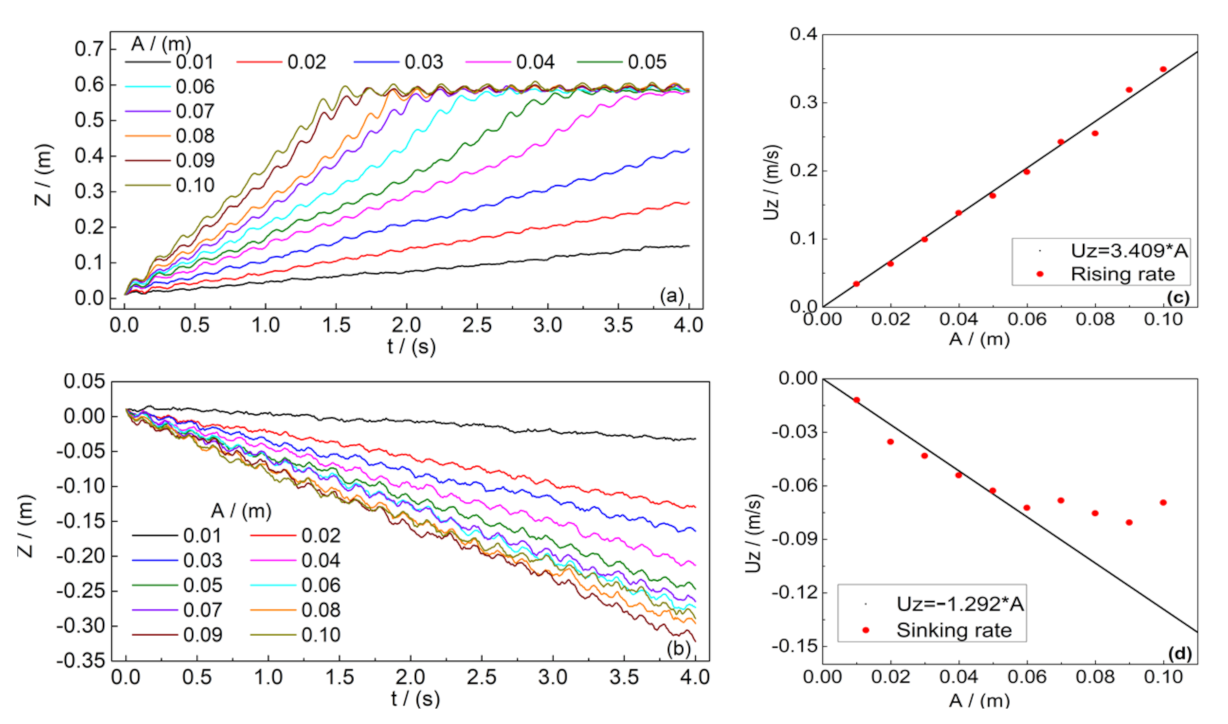
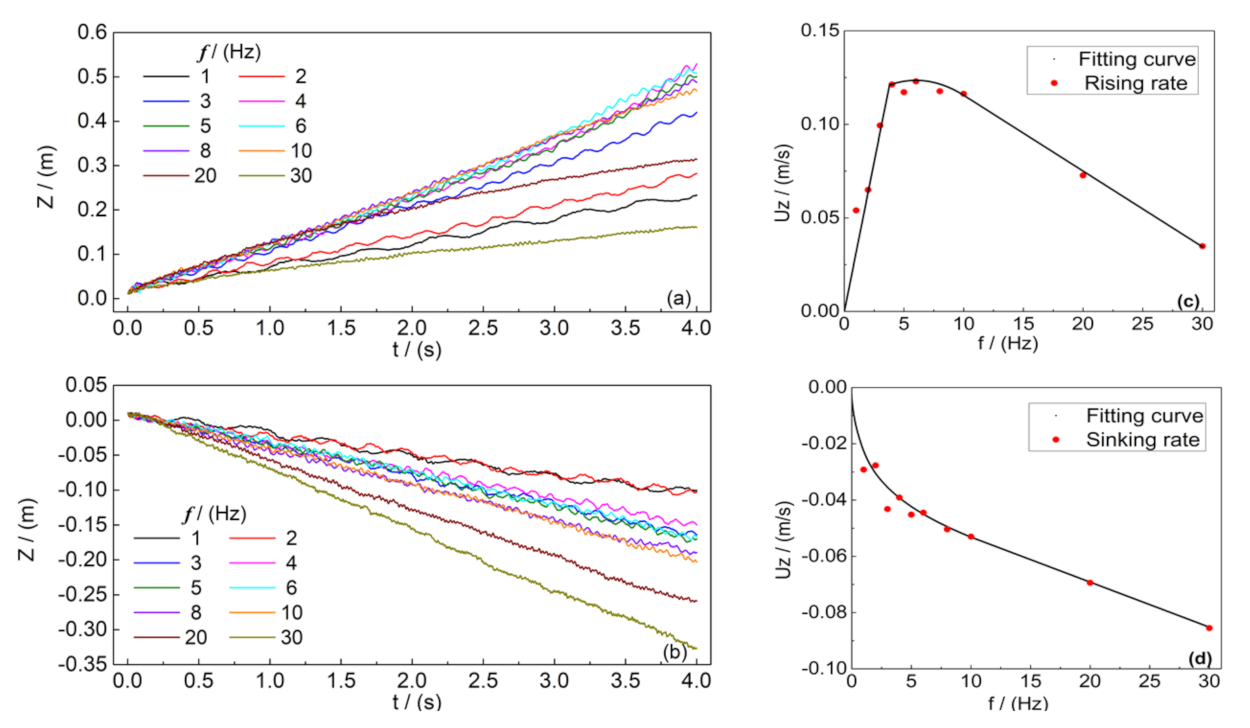
3.2. Coupling Oscillatory Translation and Oscillatory Rotation Speed

The above understanding of the oscillations in the z displacement during one cycle suggests changing the rotation direction in phase with the translational one,
ω = Ω c o s ( 2 π f t ) ,
with Ω the amplitude of the rotational angular velocity and f its oscillating frequency, which was the same as that of the translational vibration in the y-direction. The idea was that the direction of the displacement,
S i g n Δ z ( t ) y ( t ) × ω ( t ) ,
would then be either always negative or always positive, resulting in a steady rise or sink during the cycle. The results for the z displacement of the SO for A = 0.03 m, Ω = ± 80 rad/s, and f = 3 Hz, shown in Figure 4, confirmed the above expectation—the SO sank steadily with positive Ω and rose steadily with negative Ω .
We tracked the trajectories and show in Figure 5 examples of slices of the system in the y z plane through the SO at times 0 s, 2.5 s, and 5 s for both the rising and sinking. In Table 2 and Table 3 we summarize the observed dynamics during a cycle for Ω = 80 rad/s.
The motion in the z direction, both up and down, is due to the imbalance in the friction forces on the SO induced by the rotation. When Ω = 80 rad/s, the SO is subject to a steady upward friction force, given in Table 2 and Table 3, and consequently rises steadily, as shown in Figure 4 (black line). When Ω = 80 rad/s, the friction force on the SO is downward, leading to steady sinking, also shown in Figure 4 (red line). As can be observed in Figure 4, the steady rising and sinking were accompanied by fluctuations that were much smaller than those shown in Figure 2. These fluctuations, which appeared also at frequency f, were caused by a combined effect of particles falling into the cavity, which the moving SO left behind, and of the stress release in the compressed medium ahead of the SO as it changes direction. Thus, the in-phase coupling of the rotation to the vibration eliminates the large oscillations, observed the constant rotation mode, and the steady rise and sink are faster in this mode. It follows that this mode of locomotion is a more efficient technique for desert robots and most likely for burrowing desert animals as well.
To determine the conditions for the fastest locomotion, we turn next to investigate the effects of A, Ω , and f on the rising or sinking rates in this mode.

3.2.1. The Effect of Rotation Amplitude, Ω

We fixed the vibration amplitude at A = 0.03 m, the frequency at f = 3 Hz, and varied the angular velocity amplitude Ω = ± 10 × 2 n rad/s, with n = 0 , 1 , 2 , . . . , 7 . Plots of the SO displacement vs. time for negative and positive Ω are shown in Figure 6a,b. The mean rate of displacement, U z = d ( Δ z ) / d t depends sensitively on the rotation angular velocity. Figure 6c,d summarize our following observations. (i) As established in Section 3.2, the SO rose and sank for Ω negative or positive, respectively. (ii) The rising and sinking rates increased with Ω . (iii) When Ω exceeded 320 rad/s, the SO either broke the top surface or stabilized very close to the bottom of the container.
The relationship between the rising and sinking rates and Ω can be fitted well by
U z = ± C 1 ( 1 e C 2 Ω )
where the C 1 and C 2 are different constants for the rising and sinking processes. These fits are shown in Figure 6c,d.

3.2.2. The Effect of the Translational Amplitude, A

To test the effect of the translational amplitude on the vertical displacement, we carried out a series of simulations in which we fixed rotation angular velocity at Ω = ± 80 rad/s and the frequency at f = 3 HzA, and varied A from 0.01 m to 0.10 m. The direction of Δ z for negative and positive Ω , respectively, remained unaffected, but the rates of rising and sinking did vary, as shown in Figure 7a,b. In Figure 7c,d, we show that the mean rising rate increased linearly with A until the SO gets close to the top surface. In contrast, the sinking rate was linear only down to about A > 0.06 m. The reason for plateauing at this specific depth is probably because of the increased solidity of the supporting layer as a result of both the increased depth and the proximity to the bottom layer. With the exception of this effect, the rising rate and the amplitude appears to be linear:
U z = C 3 A

3.2.3. The Effect of the Frequency, f

Next, we fixed the vibration amplitude at A = 0.03 m, the rotation amplitude at Ω = ± 80 rad/s and varied: f = 1 , 2 , 3 , 4 , 5 , 6 , 8 , 10 , 20 , 30 Hz. The direction of rising and sinking depended again only on the sign of O m e g a . The resulting SO’s vertical displacements are shown in Figure 8a,b and the rates are shown in Figure 8c,d. In this case, the rates display a richer behavior then before. While the SO sinks faster with frequency, there appears to exist a critical frequency, f c = 5 Hz, up to which the rising rate increases and above which it decreases. We understand this latter behavior as follows. When f < f c , the rising mechanism is as described above, namely, because of upwards force generated by friction. This force persists throughout every stroke. The temporal z displacement is determined only by this force and the amplitude A and is therefore constant at each stroke. As a result, the rising rate is proportional to the the number of strokes per unit time, i.e., frequency.
The same mechanism persists also when f > f c , but in this regime, the high kinetic energy of the SO starts to de-solidofy the layer of bed particles supporting it and it also sinks slightly every stroke. These two mechanisms compete and while the combined effect is still upward, the rate of rising is reduced. The higher the frequency the higher the SO’s kinetic energy and the less solid the supporting layer.
The sinking rate with frequency, seen in Figure 8d, is also the result of the same two mechanisms. In this case, the friction force acts downwards, forcing the SO to sink against its supporting layer. At low frequencies, this layer is relatively solid and it becomes increasingly difficult to fluidize it with depth. As the frequency increases there is a combined effect of the force downward and the partial de-solidifcation of the support layer. However, in our system there is a third effect - the approach to the rigid bottom boundary. The latter prevents de-solidification of the support layer, thus slowing the rate of sinking, as observed in Figure 8d.

4. Conclusions and Future Research

Inspired by the biological experiments of sand lizard diving into desert sand and Escherichia coli propelling themselves forward by rotating helically in a viscous fluid, we used DEM numerical simulations to design a rising-sinking device in granular materials, driven by a combination of vibration and rotation. The simulations allowed us to test the vertical motion of the SO in response to periodic same-frequency rotational and translational transverse oscillations. The transverse oscillation was in the y direction, y = A s i n ( 2 π f t ) , and the rotation was around the x axis, ω = Ω c o s ( 2 π f t ) . We have found that the SO rose to the bed surface when Ω < 0 and sank to approximately Z = 0.3 m when Ω > 0 . The saturation in the sinking is likely an effect of the bottom boundary. To understand the effects of the key SO actuation parameters: A, f, and Ω , on its rising and sinking rates, we varied these parameters systematically. Our results show that the rising rate is linearly proportional to the A and Ω and that there is an optimal operation region for f. These findings can inform locomotion biology in understanding how animals appear to move effectively across a diversity of complex substrates. This work also has the potential to facilitate the design, control and development of a new type of bio-physically inspired robots on or within complex seabed or desert terrains.
This research can be extended in several directions, some of which we intend to explore. The range of motion and material parameters can be broadened, including the density, size and friction coefficient, so as to mimic living organisms, which often operate optimally in variable environments [7]. For example, the cross-sectional shape of the sandfish has been shown to aid rapid burial into granular media [37]. This also suggests that it would be interesting to explore the effect of this morphology, combined with head tapering on performance. Other intruder shapes should also be investigated. Another interesting direction would be to simulate non-spherical, e.g., polyhedral, bed particles, to understand the effect on the SO dynamics. We believe that in such environments the SO vertical motion would be slower, but this remains to be investigated. Another important direction is theoretical—a mathematical predictive model for this phenomenon does not yet exist. Such a theoretical model could be then tested quantitatively against our numerical results.

Author Contributions

Conceptualization: P.L., X.R., W.T. and R.B.; data collection: J.Z. and P.L.; methodology, P.L. and X.R.; Resources, Q.C.; Supervision, X.R. and R.B.; original draft, P.L.; review and editing, W.T. and R.B.; All authors have read and agreed to the published version of the manuscript.

Funding

This research was funded by the National Natural Science Foundation of China (Grant No. 11002162) and General Scientific Research Projects of NUDT (Grant No. ZK16-03-01).

Acknowledgments

The authors acknowledge the administrative support given by the Physics Department of our college. The authors are also grateful to the Sunway-TaihuLight supercomputer Center for the technical support given. P.L. is grateful for the hospitality of the Cavendish Laboratory, Cambridge university, where this paper was prepared.

Conflicts of Interest

The authors declare no conflict of interest.

References

  1. Jaeger, H.; Nagel, S.; Behringer, R. Granular solids, liquids, and gases. Rev. Mod. Phys. 1996, 68, 1259–1273. [Google Scholar] [CrossRef]
  2. Nedderman, R.M. Statics and Kinematics of Granular Materials; Cambridge University Press: Cambridge, UK, 1992. [Google Scholar]
  3. Landau, L.D.; Lifshitz, E.M. Fluid Mechanics, 2nd ed.; Butterworth-Heinemann, Pergamon Press: Oxford, UK, 1987; Volume 6, pp. 3, 4, 29. [Google Scholar]
  4. Arnold, E.N. Identifying the effects of history on adaptation: Origins of different sand-diving techniques in lizards. J. Zool. 1995, 235, 351–388. [Google Scholar] [CrossRef]
  5. Arnold, E.N.; Leviton, A.E. A revision of the lizard genus Scincus. Bull. Br. Mus. Nat. Hist. (Zool.) 1977, 31, 189–248. [Google Scholar]
  6. Baumgartner, W.; Fidler, F.; Weth, A.; Habbecke, M.; Jakob, P.; Butenweg, C.; Böhme, W. Investigating the locomotion of the sandfish in desert sand using nmr-imaging. PLoS ONE 2008, 3, e3309. [Google Scholar] [CrossRef] [PubMed] [Green Version]
  7. Maladen, R.D.; Ding, Y.; Li, C.; Goldman, D.I. Undulatory Swimming in Sand: Subsurface Locomotion of the Sandfish Lizard. Science 2009, 325, 314–318. [Google Scholar] [CrossRef] [PubMed] [Green Version]
  8. Wu, W.; Lutz, C.; Mersch, S.; Thelen, R.; Greiner, C.; Gomard, G.; Hölscher, H. Characterization of the microscopic tribological properties of sandfish (Scincus scincus) scales by atomic force microscopy. Beilstein J. Nanotechnol. 2018, 9, 2618–2627. [Google Scholar] [CrossRef] [PubMed]
  9. Halloy, M.; Etheridge, R.; Burghardt, G.M. To bury in sand: Phylogenetic relationships among lizard species of the boulengeri group, Liolaemus (Reptilia: Squamata: Tropiduridae), based on behavioral characters. Herpetol. Monogr. 1998, 12, 1–37. [Google Scholar] [CrossRef]
  10. Luke, C. Convergent evolution of lizard toe fringes. Biol. J. Linn. Soc. 1986, 27, 1–16. [Google Scholar] [CrossRef]
  11. Evangelista, D.; Hotton, S.; Dumais, J. The mechanics of explosive dispersal and self-burial in the seeds of the filaree, Erodium cicutarium (Geraniaceae). J. Exp. Biol. 2011, 214, 521–529. [Google Scholar] [CrossRef] [Green Version]
  12. Jung, W.; Choi, S.M.; Kim, W.; Kim, H.Y. Reduction of granular drag inspired by self-burrowing rotary seeds. Phys. Fluids 2017, 29, 041702. [Google Scholar] [CrossRef] [Green Version]
  13. Vogela, R.; Stark, H. Force-extension curves of bacterial fagella. Eur. Phys. J. E 2010, 33, 259–271. [Google Scholar] [CrossRef] [Green Version]
  14. Darbois Texier, B.; Ibarra, A.; Melo, F. Helical locomotion in a granular medium. Phys. Rev. Lett. 2017, 119, 068003.1–068003.5. [Google Scholar] [CrossRef] [Green Version]
  15. Takashi, S.; Dirk, K.; Troy, S.; Hans, H.J. Swimming in granular media. Phys. Rev. E 2009, 80, 020301. [Google Scholar]
  16. Gray, J.; Hancock, G.J. The propulsion of sea-urchin spermatozoa. J. Exp. Biol. 1955, 32, 802–814. [Google Scholar]
  17. Ui, T.J.; Hussey, R.G.; Roger, R.P. Stokes drag on a cylinder in axial motion. Phys. Fluids 1984, 27, 787. [Google Scholar] [CrossRef]
  18. Ding, Y.; Gravish, N.; Goldman, D.I. Drag induced lift in granular media. Phys. Rev. Lett. 2011, 106, 028001. [Google Scholar] [CrossRef] [Green Version]
  19. Maladen, R.D.; Ding, Y.; Umbanhowar, P.B.; Kamor, A.; Goldman, D.I. Mechanical models of sandfish locomotion reveal principles of high performance subsurface sand-swimming. J. R. Soc. Interface 2011, 8, 1332–1345. [Google Scholar] [CrossRef] [Green Version]
  20. Percier, B.; Manneville, S.; Mcelwaine, J.N.; Morris, S.W.; Taberlet, N. Lift and drag forces on an inclined plow moving over a granular surface. Phys. Rev. E 2011, 84, 051302. [Google Scholar] [CrossRef] [Green Version]
  21. Li, C.; Umbanhowar, P.B.; Komsuoglu, H.; Koditschek, D.E.; Goldman, D.I. Sensitive dependence of the motion of a legged robot on granular media. Proc. Natl. Acad. Sci. USA 2009, 106, 3029–3034. [Google Scholar] [CrossRef] [Green Version]
  22. Maladen, R.D.; Ding, Y.; Umbanhowar, P.B.; Goldman, D.I. Undulatory swimming in sand: Experimental and simulation studies of a robotic sandfish. Int. J. Robot. Res. 2011, 30, 793–805. [Google Scholar] [CrossRef]
  23. Katsuragi, H. Physics of soft impact and cratering. J. Phys. Condens. Matter. 2015, 6, 977. [Google Scholar]
  24. Cundall, P.A.; Strack, O.D.L. A discrete numerical model for granular assemblies. Geotechnique 1979, 29, 47–65. [Google Scholar] [CrossRef]
  25. Kishino, Y. Disc model analysis of the granular media. Micromech. Granul. Mater. 1988, 20, 143–152. [Google Scholar]
  26. Kishino, Y. Computer analysis of dissipation mechanism in granular media. In Powders and Grains; Balkema: Montpellier, France, 1989; pp. 323–330. [Google Scholar]
  27. Radjai, F.; Jean, M.; Moreau, J.J.; Roux, S. Force distributions in dense two-dimensional granular systems. Phys. Rev. Lett. 1996, 77, 274–277. [Google Scholar] [CrossRef] [Green Version]
  28. Cundall, P.A.; Hart, R. Numerical modeling of discontinua. J. Eng. Comp. 1992, 9, 101–113. [Google Scholar] [CrossRef]
  29. Cook, B.K.; Jensen, R.P. Discrete element methods: Numerical modeling of discontinua. In Proceedings of the Third International Conference on Discrete Element Methods, Santa Fe, NW, USA, 23–25 September 2002; American Society of Civil Engineers: Reston, VA, USA, 2002. [Google Scholar]
  30. Vango, M.; Feilmayr, C.; Pirker, S.; Lichtenegger, T. Data-assisted CFD modeling of transient blast furnace tapping with a dynamic deadman. Appl. Math. Model. 2019, 73, 210–227. [Google Scholar] [CrossRef]
  31. Kloss, C.; Goniva, C.; Hager, A.; Amberger, S.; Pirker, S. Models, algorithms and validation for opensource dem and cfd-dem. Prog. Comput. Fluid Dyn. 2012, 12, 140–152. [Google Scholar] [CrossRef]
  32. Podlozhnyu, A.; Pirker, S.; Kloss, C. Efficient implementation of superquadric particles in discrete element method within an open-source framework. Comput. Part. Mech. 2016, 4, 101–118. [Google Scholar] [CrossRef] [Green Version]
  33. Silbert, L.; Ertas, D.; Grest, G.; Halsey, T.; Levine, D.; Plimpton, S. Granular flow down an inclined plane: Bagnold scaling and rheology. Phys. Rev. E 2001, 64, 051302. [Google Scholar] [CrossRef] [PubMed] [Green Version]
  34. Plimpton, S.J. Fast Parallel Algorithms for Short-Range Molecular Dynamics. J. Comp. Phys. 1995, 117, 1–19. [Google Scholar] [CrossRef] [Green Version]
  35. Huang, L.; Ran, X.; Blumenfeld, R. Vertical dynamics of a horizontally oscillating active object in a two-dimensional granular medium. Phys. Rev. E 2016, 94, 062906. [Google Scholar] [CrossRef] [PubMed] [Green Version]
  36. Cheng, Q.; Ran, X.; Liu, P.; Tang, W.; Blumenfeld, R. Numerical simulation of a spinning sphere moving in granular matter. Acta Phys. Sin. 2018, 67, 014702. [Google Scholar]
  37. Mosauer, W. Adaptive convergence in the sand reptiles of the Sahara and of California: A study in structure and behavior. Copeia 1932, 72–78. [Google Scholar] [CrossRef]
Figure 1. The simulated system: (a) the initial state, with h 2 = 1.3 m the height of the container and h 1 = 1.0 m the height of the bed medium; (b) a cross-section at x = 0 , showing the initial SO at depth h 0 .
Applsci 11 02054 g001
Figure 2. The dynamics of the SO with the coupling of vibration and rotation around different axes. (a) The movement of the SO in the x direction. (b) The movement of the SO in the z direction.
Applsci 11 02054 g002
Figure 3. The forces on the SO in the first quarter cycle.
Applsci 11 02054 g003
Figure 4. The displacement-time graph describing the locomotion of the SO in the z direction at two opposite rotation angular velocities.
Applsci 11 02054 g004
Figure 5. Snapshots during the rising and sinking processes. Only the relevant part of the system is shown. Top: the initial, intermediate and final positions of the SO, for Ω = 80 rad/s, A = 0.03 m, and f = 3 Hz. The relevant simulation ended when the SO broke the top surface of the granular bed. Bottom: the initial, intermediate and final position of the SO, for Ω = 80 rad/s, A = 0.03 m and f = 3 Hz. The SO settles at about z = 0.3 m due to the interaction with the bottom boundary.
Applsci 11 02054 g005
Figure 6. The displacement of the SO in the z direction for fixed translational amplitude A = 0.03 m and oscillatory frequency f = 3 Hz. (a) The rising height for Ω < 0 ; (b) the sinking depth for Ω > 0 ; (c) the rising rate for Ω < 0 ; (d) the sinking rate for Ω > 0 . The lines in (c) and (d) represent exponential fits for U z ( Ω ) .
Applsci 11 02054 g006
Figure 7. (a) The displacement of the SO in the z direction with amplitude A varying from 0.01 m to 0.1 m, for f = 3 Hz and Ω = 80 rad/s; (b) the same for Ω = 80 rad/s; (c) the rising rate as a function of A for Ω < 0 ; (d) the sinking rate as a function of A for positive Ω > 0 .
Applsci 11 02054 g007
Figure 8. The displacement of the SO in the z direction as a function of the frequency f for A = 0.03 m for (a) Ω = 80 rad/s and (b) Ω = 80 rad/s. The rising rate as a function of f at the same amplitude for (c) Ω = 80 rad/s and (d) Ω = 80 rad/s.
Applsci 11 02054 g008
Table 1. The material properties used in the simulation.
ParameterUnitBed ParticleSO
ShapeNo unitSphericalSpherical
Diameterm0.020.12
Densitykg/m 3 25002500
Young’s ModulusPa 10 7 10 7
Coefficient of RestitutionNo unit0.9 (bed particle-bed particle)0.5 (SO-bed particle)
Coefficient of FrictionNo unit0.45 (bed particle-bed particle)0.5 (SO-bed particle)
Poisson RatioNo unit0.250.25
Gravity Accelerationm/s 2 9.819.81
Table 2. The corresponding values of vibration displacement and rotation velocity at one period.
T (s)t = 0t = T/4t = T/2t = 3T/4t = T
Displacement y (m)y = 0y = Ay = 0y = −Ay = 0
Rotation velocity ω (rad/s) ω = Ω ω = 0 ω = Ω ω = 0 ω = Ω
Table 3. The direction of vibration and rotation.
Region(t = 0 → t = T/4)(t = T/4 → t = T/2)(t = T/2 → t = 3T/4)(t = 3T/4 → t = T)
Vibration direction + y direction y direction y direction + y direction
Rotation directionclockwisecounter-clockwisecounter-clockwiseclockwise
Resultant friction direction + z direction + z direction + z direction + z direction
Publisher’s Note: MDPI stays neutral with regard to jurisdictional claims in published maps and institutional affiliations.

