Abstract
In this paper, a novel method for the effective extraction of the light stripes in rail images is proposed. First, a preprocessing procedure that includes self-adaptive threshold segmentation and brightness enhancement is adopted to improve the quality of the rail image. Secondly, center of mass is utilized to detect the center point of each row of the image. Then, to speed up the procedure of centerline optimization, the detected center-points are segmented into several parts based on the geometry of the rail profile. Finally, piecewise fitting is adopted to obtain a smooth and robust centerline. The performance of this method is analyzed in detail, and experimental results show that the proposed method works well for rail images.
1. Introduction
With the rapid development of high-speed railway systems, railway profile detection has become an important method by which to measure rail wear to guarantee the safety of railway transportation. Rather than the use of a manual detection method, line-structured light measurement is extensively applied due to its advantages of being non-contact, fast, and highly accurate [1,2,3].
A line-structured light sensor containing a camera and one laser projector is mounted on the inside of the rail. The sensor projects a laser onto the surface of the rail, and the camera then captures an image of the distorted laser stripe modulated by the rail surface. The architecture of this system is shown in Figure 1. Three-dimensional (3D) information about the profile of the rail can be obtained based on the laser stripe center and the calibrated results [4,5,6,7]. Therefore, the light stripe center extraction of the rail image is a significant step in the measurement of rail wear.
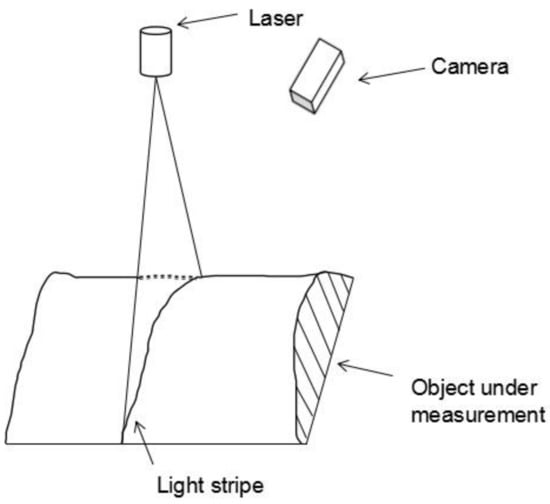
Figure 1.
The architecture of the line-structured light sensor.
The process of light stripe center extraction in rail wear measurement systems based on laser triangulation techniques is difficult. Different from the under-controlled conditions of the surrounding light, many factors, such as variable luminance and uneven surfaces, modulate the shape of the light stripe on a rail image captured in outdoor environments, and show up as image noise. While most noise can be filtered with the assistance of interferential filters, it usually cannot be removed completely, as shown in Figure 2. The light stripe in the rail image may be of different widths and luminance, and while some regions of the stripe appear dim, other regions are already saturated. Moreover, in some regions, the cross-sectional distribution of the light stripe no longer conforms to the Gaussian distribution. This results in the difficulty of light stripe center extraction in complex environments, and most traditional light stripe extraction methods cannot be directly applied to rail images.
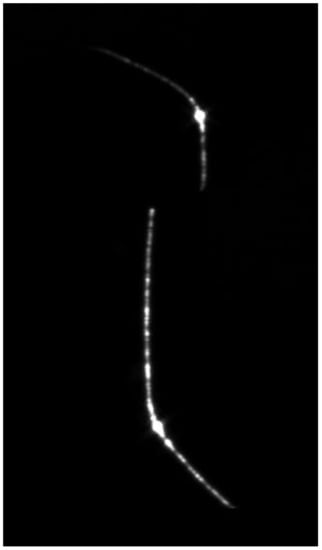
Figure 2.
Light stripe in a rail image.
Most existing light stripe extraction methods are sensitive to noise, and therefore cannot work well in outdoor environments. The Center of Mass method detects the center-points in each column or row, whereas the correlations between columns and rows are not taken into account; thus, this method is sensitive to image noise. The Steger method [8,9] is most commonly used for light stripe extraction because of its high accuracy; however, it is time-consuming, and it is difficult to select a proper scale factor when the widths of the light stripe vary over a large range. In addition, the Gaussian distribution is normally thought to be satisfied on the cross-section, which is impractical for rail images. Fisher et al. [10] evaluated the performances of five methods, including Gaussian approximation, the Center of Mass method, parabolic estimation, the Blais and Rioux detector, and linear approximation. The results showed that their accuracies were all on the sub-pixel level. Other works, such as that by Haug et al. [11], have revealed that the Center of Mass method can be conducted in real time with strong robustness.
In addition to these traditional methods, some novel robust laser stripe extraction methods have been proposed. In the work by Yang et al. [12], a high-dynamic-range imaging system was constructed to measure an object partially highlighted or partially reflected in a specular manner; however, this method requires a sophisticated hardware setup. In the method developed by Usamentiaga et al. [13], center of mass is used in rows only if the maximum grayscale of pixels in the row is larger than the adjacent background. Then, a laser peak linking process is applied to fill in the gaps generated in the previous step. In the method proposed by Yin et al. [14], preprocessing, including self-adaptive convolution and threshold segmentation, is adopted to reduce the influence of noise before center of mass is determined. Piecewise fitting is then applied to acquire the optimized laser stripe centerline. However, while there is always a gap in rail images, these methods [13,14] cannot recognize the gaps between surfaces caused by the shooting angle, and cannot always link the gaps; moreover, a considerable amount of time is spent on centerline optimization. In the work by Du et al. [15], a robust laser stripe extraction method that uses ridge segmentation and region ranking was proposed; however, ridge direction cannot be computed for saturated regions of the stripe, which may occur in rail images. In the method proposed by Liu et al. [16], template matching is utilized to enhance the light stripe image. In this method, the grayscale distribution of the normal cross-section of the corresponding position of a good-quality light stripe image is used as a template for poor-quality light stripe images. However, this strategy is not appropriate for use in rail profile measurement, as the obtained results cannot represent the true profile. In the method developed by Pan et al. [17], a multi-scale Retinex (MSR) algorithm is used to enhance the light stripe image. However, because this method enhances the entire image, it is prone to local over-enhancement.
Recently, some light stripe extraction methods [18,19] particularly for use on rail images have been proposed. In the work by Liu et al. [2], regions containing the rail waist light stripe are tracked using a Kalman filter, and the extreme value method, center of mass, and Hessian matrix are then combined to extract the precise sub-pixel coordinates of the light stripe centers. In the method proposed by Wang et al. [20], the deep learning model ENet was applied to segment the rail laser stripe using the grayscale and gradient direction, which makes it more robust to noise. Nevertheless, the construction of the ENet model is complicated, and due to the influence of changing ambient light, the grayscale and gradient information of the same segment may not be consistent.
The current image enhancement methods can be divided into two categories, including the spatial domain and frequency domain. For the frequency domain method, firstly, the image is converted to a frequency domain, then processed with an enhancement operator, and the enhanced image is finally obtained by inverse transform. Fourier transform (FT) [21] provides a means for transformation to the frequency domain, and the information will not be lost in the process of inverse transform. This method is efficient, but has difficulty coping with adaptive image enhancement. Wavelet transform (WT) [22], like FT, is a mathematical transform. Its basic idea is to use a family of functions to express or approximate a signal. The WT image enhancement algorithm can effectively highlight the details of the image, but can easily magnify the noise in the image. The spatial method performs the operation on each pixel in the image, and directly changes the gray value of the image pixel. The Savitzky Golay filter [23] is a kind of low-pass filter. It calculates the filter coefficients by using polynomial convolution. This method is simple and easy to understand, and has strong operability. However, its parameters need to be set carefully, and automatic filtering cannot be realized.
Via the preceding analysis, it is evident that the existing light stripe extraction methods are not robust to image noise, and do not make full use of the characteristics of the rail light stripe image in the procedures of preprocessing and centerline optimization. Therefore, the image quality after preprocessing remains poor, and the speed of centerline optimization is slow. To overcome these problems, this paper proposes a laser stripe center extraction method for rail images captured in outdoor environments by considering the characteristics of the rail stripe image. This method consists of two steps, namely, image preprocessing and center extraction. In the first step, complete light stripe regions are extracted with the adaptive multi-threshold Otsu algorithm [24], and the dark regions of the light stripe, rather than the entire light stripe, are enhanced by simple histogram equalization. In the second step, the center of mass method is adopted to detect the center-points. Then, based on the geometric information and the continuity of the laser stripe, the center-points are optimized via light stripe segmentation and polynomial fitting technology.
2. Laser Stripe Center Extraction for Rail Images
2.1. Light Stripe Preprocessing
The rail image is preprocessed by threshold segmentation. The Otsu algorithm is the optimal algorithm for threshold selection due to its efficient computation and robustness to image brightness and contrast. A rail image processed by the single-threshold Otsu method is displayed in Figure 3a. As can be seen, a portion of the stripe segments disappears because the grayscale of these pixels is similar to the background. To address this issue, a novel preprocessing method is proposed, which integrates self-adaptive threshold segmentation and image enhancement.
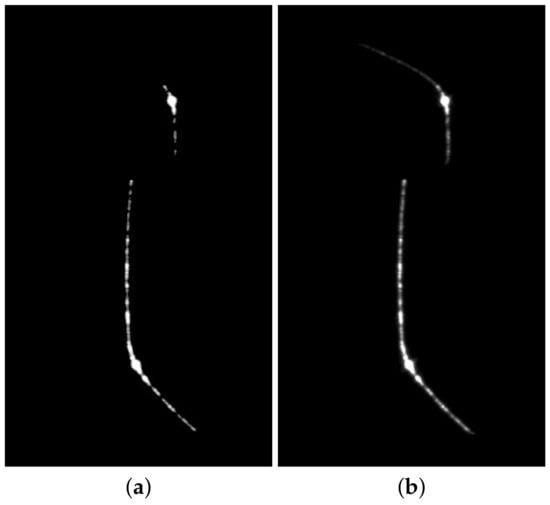
Figure 3.
Different Otsu segmentation methods: (a) Single-threshold Otsu segmentation; (b) modified Otsu segmentation.
First, the multiple-threshold Otsu method is adopted to segment the light stripe from the background. The number of thresholds is chosen, by enumeration from one to nine, as the value that can produce the maximum interclass variance. Then, the minimum value of the optimal multiple thresholds is selected to segment the light stripe from the background. As can be seen in Figure 3b, the segmentation result achieved with the proposed method can retain more complete light stripe information than the single-threshold Otsu method. Image enhancement is subsequently conducted to improve the contrast of dark segments of the stripe.
Inspired by Hanmandlu [25], a parameter related to exposure is defined to divide the light stripe into under-exposed and over-exposed regions. The value of stripe exposure can be calculated as
where k is the gray-level values of the light stripe, is the histogram of the image, L is the total number of gray levels, is the threshold to segment the light stripe and the background, and is the maximum gray level of the light stripe.
t is another parameter related to exposure. It provides a value of the gray boundary, which can divide the image into sub-images of under-exposure and over-exposure.
Rows on the light stripe with a maximum value less than t are considered the under-exposed sub-image, and histogram equalization (HE) is subsequently applied to enhance this sub-image. The probability density function (PDF) is defined as
where N is the total number of pixels in this sub-image. The corresponding cumulative density function (CDF) is defined as
The transfer function for HE can then be defined as
For each point of the under-exposed sub-image, the corresponding gray value after enhancement can be calculated according to Equation (5).
Comparative tests are carried out to verify the reliability of the proposed method, and the results are displayed in Figure 4. The MSR and CLAHE methods led to over-exposure to different extents, whereas the proposed method achieved better performance for stripe image enhancement. The dark area of the light stripe was recovered, especially the top section of the rail stripe; this can ensure the accuracy of light stripe center extraction, as well as the measurement of rail wear.
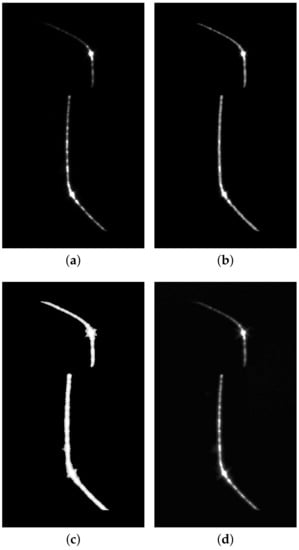
Figure 4.
Results of comparative tests on light stripe image enhancement: (a) The original image; (b) the result of the proposed method; (c) the result of MSR; (d) the result of contrast-limited adaptive histogram equalization (CLAHE).
2.2. Light Stripe Extraction
After the preprocessing procedure is conducted, the laser stripe center for each row can be calculated with subpixel precision by using the center of mass, as given by Equation (6):
where is the center of the light stripe in row i, and is the pixel value in row i and column j.
The detection results are presented in Figure 5. As is evident, most parts of the light stripe were successfully detected. However, the centerlines in the curved parts are not very smooth, which mainly resulted from the reflectivity. Another reason is that the detection method does not take into account the continuity between adjacent center-points; this can be overcome by laser stripe centerline optimization, which is subsequently elaborated.
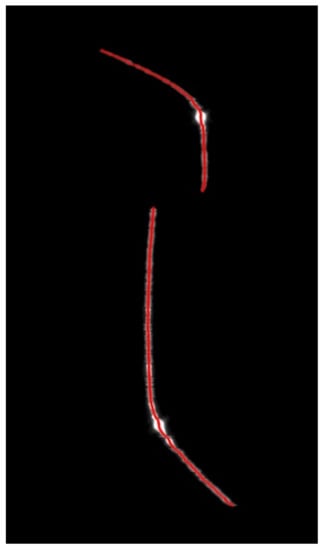
Figure 5.
Light stripe center detection results.
Piecewise fitting is selected to optimize the center-points, but light stripe segmentation must first be conducted. The neighborhood difference method is used to segment the laser stripe into the rail head region and rail waist region. First, an array is constructed, the elements of which are horizontal coordinates of the centers detected previously. The neighborhood difference is then calculated by Equation (7):
The position at which the maximum value is located is considered as the segmentation point between the rail head and rail waist. The distribution of the neighborhood difference values is displayed in Figure 6, and the segmentation results are shown in Figure 7.
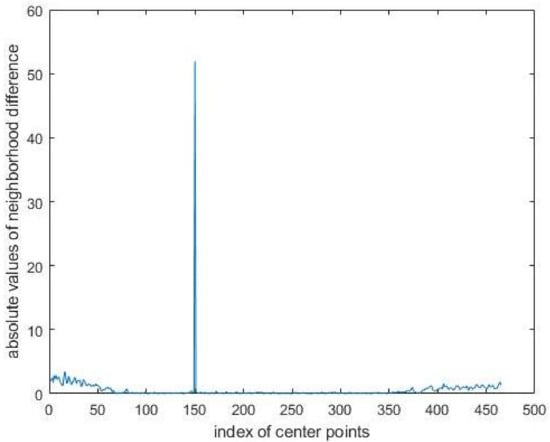
Figure 6.
The distribution of the absolute values of the neighborhood difference.
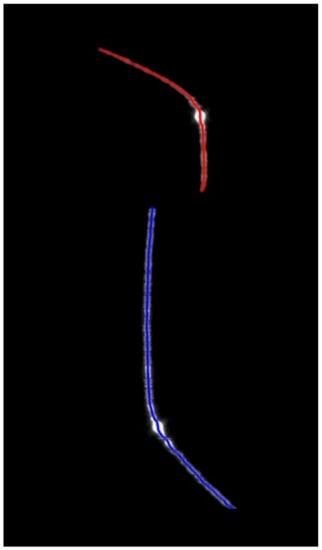
Figure 7.
Rail head and rail waist segmentation.
According to the geometric characteristics of the rail profile, the rail head and rail waist regions are respectively subdivided into three parts. For the laser stripe segment of the rail head, the first and last center-points are used to estimate the coefficients of the line that links them. The distance between the approximation function and the detected center-points can be calculated based on these coefficients, and the largest distance is located at the corner of the region, which is indicated by the blue point in Figure 8a. The points in the neighborhood of the blue point compose the middle part of the rail head, while the points at the ends of this section compose the other two parts. Considering speed and accuracy, and taking advantage of the profile feature and experimental research, three-order and two-order polynomials are selected to fit the subsection curves for the middle and end parts, respectively. The same procedures are applied for the segment of the rail waist. The results of segmentation and piecewise approximation are shown in Figure 8. The proposed method takes only 14% of the time required by the iterative endpoint method to perform centerline optimization.
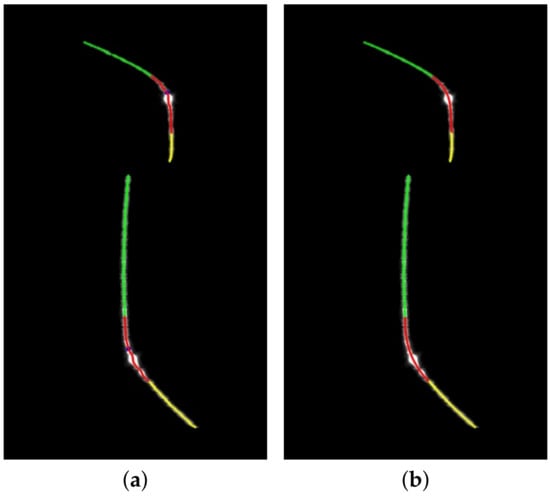
Figure 8.
(a) Segmentation of the rail profile; (b) piecewise approximation of the rail profile.
3. Experiments
In this experiment, a line-structured light measurement system was set up. The system included a camera (MER-131-75GM-P NIR, DaHeng), a lens (M0814-MP2, Computar), a laser (LWIRL808-CD, LeiZhiWei), and a corresponding filter. The laser source was located approximately 50 cm away from the surface under measurement, and the laser plane was perpendicular to the measured surface. The images displayed in the previous figures were obtained from this system. Moreover, the images were tailored so as to be shown clearly.
3.1. Robustness
Two methods were implemented for comparison with the proposed method. The first method is the Usamentiaga’s method (UM) [13], which adopts the improved Center of Mass method to detect centers, and then utilizes the iterative endpoint method to optimize the centerline. Its result is shown in Figure 9b. The second comparison method is Steger; its extraction result is displayed in Figure 9c. It can be seen from the detection results that the center-points are missing in the low-brightness part of the light stripe, while the excess center-points are detected in the over-exposed part of the light stripe. This is because the parameter setting of the Steger method is related to the stripe width, and the stripe width is varied in a range for rail stripe images. Therefore, it is difficult to determine the most suitable parameters for Steger to be suitable for the stripe with different width. As can be seen from Figure 9a, the center-points acquired with the proposed method are unbroken and smoother, and the robustness of our method is comparable to that of the UM method. In addition, several other rail images were processed with the proposed method, as shown in Figure 10, and the results further verify its robustness.
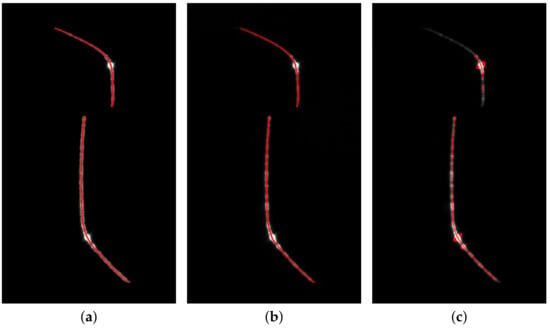
Figure 9.
Comparison of experimental results achieved by (a) the proposed method, (b) the UM method, and (c) the Steger method.
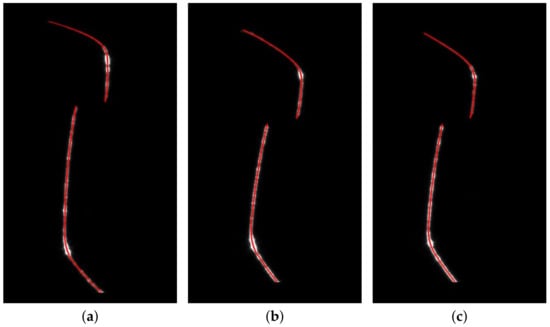
Figure 10.
(a–c) Experimental results of center extraction for different rail images.
3.2. Efficiency
A short execution time is essential in industrial environments. In the experiments conducted in the present study, the program was run on an Intel(R) Core (TM) i3-4150U CPU at 3.5 GHz with 4 GB of RAM. The compared methods were coded in MATLAB [26] r2014a compiled for 32 bits on Windows 7. The compared methods were run 20 times, and the average times of different center extraction methods were recorded. The UM method, the Steger method, and the proposed method took 1.09 s, 0.792 s, and 0.20 s to process the image in Figure 2 with a resolution of 330 × 570 pixels, respectively. For the iterative endpoint method in UM, quadratic function was used for fitting, with a threshold of . The main reason why our method is faster than the UM method is that we make use of the shape characteristics of the rail stripe in the process of optimizing the centerline of the light stripe. The Steger method needs to convolve the whole image with Gaussian kernels five times, so it takes more time than our method. Furthermore, the proposed method was implemented sequentially, and the run time would be significantly reduced if they are implemented in a parallel manner on multiple processors. Specifically, it was implemented by multi-thread flow acceleration and the serialized output constraints program in [17].
3.3. Accuracy
In order to verify the accuracy of the detected center-points, we manually generated an image containing one light stripe. The synthetic image is 512 × 512 pixels, and the horizontal coordinates of the ideal center line of the light stripe is 256. In order to simulate the light stripe with different width and brightness, for the first 200 rows, the width of the light stripe is set to 11, and the central lightness of the light stripe is 80. For other rows, the width of the light stripe is set to 17, and the central lightness of the light stripe is 255. Then, Gaussian noise of 0 mean and standard deviation is added to the light stripe. The synthetic image is shown in Figure 11. It should be noted that, in order to analyze sub-pixel center extraction accuracy, centerline fitting is not employed for the UM method and the proposed method.
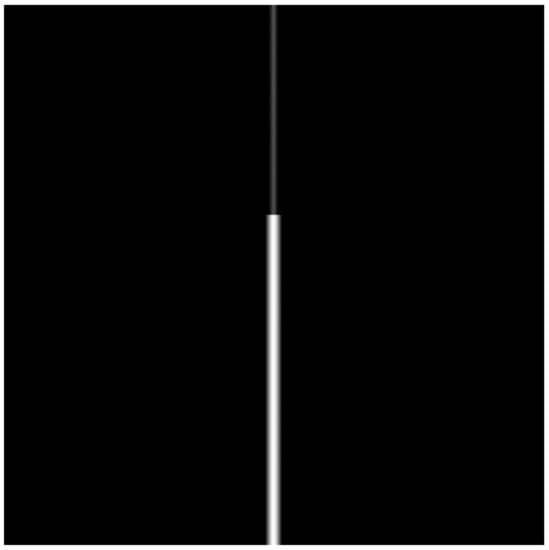
Figure 11.
The synthetic image for the accuracy test.
The detection error can be calculated as:
Here, and are the detected and ideal positions of the kth line point, and N is the number of detected points. The comparison results are reported in Table 1. It can be seen that the detection error of the proposed method is the smallest. For the Steger method, its accuracy is poor when the light stripe width is varied. Both the UM and proposed methods are based on center of mass, which is more robust for the width variety of the light stripe, and the detection accuracy of our method is slightly higher than that of the UM method.

Table 1.
Comparative results of detection accuracy.
4. Conclusions
A robust, fast, and accurate light stripe extraction method for rail images was proposed in the present work. Via the self-adaptive multi-threshold segmentation method, the light stripe can be completely extracted from the background without the interference of variable illumination and reflection. Additionally, the image quality is improved by the proposed image enhancement method. Moreover, the light stripe is segmented into several parts via the geometry of the rail profile, which simplifies the procedure of light stripe segmentation. Piecewise fitting based on polynomials makes the centerline smoother, and is a fast process. The results of the conducted experiments validate the performance of the proposed method, and center-points of different rail images were successfully extracted. For rail profile stripes with different widths and brightness, the proposed method can obtain comparable robustness with the UM method, and its average run time is only about one-fourth and one-fifth of the Steger and UM methods, respectively. Besides, the proposed method can achieve higher center extraction accuracy level for synthetic images. Consequently, the proposed method is suitable for the light stripe extraction of rail profile images.
Author Contributions
Methodology, investigation, validation, writing original draft preparation, H.G.; review, supervision, funding acquisition, G.X. All authors have read and agreed to the published version of the manuscript.
Funding
This research was funded by National Key R&D Program of China (2018YFB2003803), National Key R&D Program of China (2017YFF0107300), National Key R&D program of China (2016YFB1102600), National Natural Science Foundation of China (62073161), and Starting Fund for New Teachers of Nanjing University of Aeronautics and Astronautics (YAH18066).
Data Availability Statement
The image data used to support the findings of this study are available from the corresponding author upon request.
Conflicts of Interest
The authors declare no conflict of interest.
References
- Zhou, P.; Xu, K.; Wang, D.D. Rail profile measurement based on line-structured light vision. IEEE Access 2018, 6, 16423–16431. [Google Scholar] [CrossRef]
- Liu, Z.; Sun, J.H.; Wang, H.; Zhang, G.J. Simple and fast rail wear measurement method based on structured light. Opt. Lasers Eng. 2011, 49, 1343–1351. [Google Scholar] [CrossRef]
- Molleda, J.; Usamentiaga, R.; Millara, Á.F.; García, D.F.; Manso, P.; Suárez, C.M.; García, I. A profile measurement system for rail quality assessment during manufacturing. IEEE Trans. Ind. Appl. 2016, 52, 2684–2692. [Google Scholar] [CrossRef]
- Bouguet, J. Camera Calibration Toolbox for Matlab. Available online: c://www.vision.caltech.edu/bouguetj/calib_doc/ (accessed on 2 October 2019).
- Zhang, Z. A flexible new technique for camera calibration. IEEE Trans. Pattern Anal. Mach. Intell. 2000, 22, 1330–1334. [Google Scholar] [CrossRef]
- Wang, C.; Li, Y.F.; Ma, Z.J.; Zeng, J.Z.; Jin, T.; Liu, H.L. Distortion rectifying for dynamically measuring rail profile based on self-calibration of multiline structured light. IEEE Trans. Instrum. Meas. 2018, 67, 678–689. [Google Scholar] [CrossRef]
- Liu, Z.; Li, X.J.; Yin, Y. On-site calibration of line-structured light vision sensor in complex light environments. Opt. Express 2015, 23, 29896–29911. [Google Scholar] [CrossRef] [PubMed]
- Steger, C. An unbiased detector of curvilinear structures. IEEE Trans. Pattern Anal. Mach. Intell. 1998, 20, 113–125. [Google Scholar] [CrossRef]
- Steger, C. Unbiased extraction of lines with parabolic and Gaussian profiles. Comput. Vis. Image Underst. 2013, 117, 97–112. [Google Scholar] [CrossRef]
- Fisher, R.; Naidu, D. A comparison of algorithms for subpixel peak detection. In Image Technology; Springer: Berlin/Heidelberg, Germany, 1996; pp. 385–404. [Google Scholar]
- Haug, K.; Pritschow, G. Robust laser-stripe sensor for automated weld-seam-tracking in the shipbuilding industry. In Proceedings of the 24th Annual Conference of the IEEE Industrial Electronics Society (Cat. No. 98CH36200), Aachen, Germany, 31 August–4 September 1998; Volume 2, pp. 1236–1241. [Google Scholar]
- Yang, Z.D.; Wang, P.; Li, X.H.; Sun, C.K. 3D laser scanner system using high dynamic range imaging. Opt. Lasers Eng. 2014, 54, 31–41. [Google Scholar]
- Usamentiaga, R.; Molleda, J.; García, D.F. Fast and robust laser stripe extraction for 3D reconstruction in industrial environments. Mach. Vis. Appl. 2012, 23, 179–196. [Google Scholar] [CrossRef]
- Yin, X.Q.; Tao, W.; Feng, Y.Y.; Gao, Q.; He, Q.Z.; Zhao, H. Laser stripe extraction method in industrial environments utilizing self-adaptive convolution technique. Appl. Opt. 2017, 56, 2653–2660. [Google Scholar] [CrossRef] [PubMed]
- Du, J.; Xiong, W.; Chen, W.Y.; Cheng, J.R.; Wang, Y.; Gu, Y.; Chia, S.C. Robust laser stripe extraction using ridge segmentation and region ranking for 3D reconstruction of reflective and uneven surface. In Proceedings of the 2015 IEEE International Conference on Image Processing (ICIP), Quebec, QC, Canada, 27–30 September 2015; pp. 4912–4916. [Google Scholar]
- Liu, S.Y.; Bao, H.J.; Zhang, Y.H.; Lian, F.H.; Zhang, Z.H.; Tan, Q.C. Research on image enhancement of light stripe based on template matching. EURASIP J. Image Video Process. 2018, 2018, 124. [Google Scholar] [CrossRef]
- Pan, X.; Liu, Z. High dynamic stripe image enhancement for reliable center extraction in complex environment. In Proceedings of the International Conference on Video and Image Processing, Singapore, 27–29 December 2017; pp. 135–139. [Google Scholar]
- Wang, W.H.; Sun, J.H.; Liu, Z.; Zhang, G.J. Stripe center extrication algorithm for structured-light in rail wear dynamic measurement. Laser Infrared 2010, 40, 87–90. [Google Scholar]
- Sun, J.H.; Wang, H.; Liu, Z.; Zhang, G.J. Rapid extraction algorithm of laser stripe center in rail wear dynamic measurement. Opt. Precis. Eng. 2011, 19, 690–696. [Google Scholar]
- Wang, S.C.; Han, Q.; Wang, H.; Zhao, X.X.; Dai, P. Laser Stripe Center Extraction Method of Rail Profile in Train-Running Environment. Acta Opt. Sin. 2019, 39, 0212004. [Google Scholar] [CrossRef]
- Bracewell, R.N.; Bracewell, R.N. The Fourier Transform and Its Applications; McGraw-Hill: New York, NY, USA, 1986; Volume 31999. [Google Scholar]
- Walnut, D.F. An Introduction to Wavelet Analysis; Springer Science & Business Media: Berlin/Heidelberg, Germany, 2013. [Google Scholar]
- Press, W.H.; Teukolsky, S.A. Savitzky-Golay smoothing filters. Comput. Phys. 1990, 4, 669–672. [Google Scholar] [CrossRef]
- Otsu, N. A threshold selection method from gray-level histograms. IEEE Trans. Syst. Man Cybern. 1979, 9, 62–66. [Google Scholar] [CrossRef]
- Hanmandlu, M.; Verma, O.P.; Kumar, N.K.; Kulkarni, M. A novel optimal fuzzy system for color image enhancement using bacterial foraging. IEEE Trans. Instrum. Meas. 2009, 58, 2867–2879. [Google Scholar] [CrossRef]
- Available online: https://www.mathworks.com/products/matlab.html (accessed on 2 October 2019).
Publisher’s Note: MDPI stays neutral with regard to jurisdictional claims in published maps and institutional affiliations. |
© 2021 by the authors. Licensee MDPI, Basel, Switzerland. This article is an open access article distributed under the terms and conditions of the Creative Commons Attribution (CC BY) license (http://creativecommons.org/licenses/by/4.0/).