1. Introduction
Life expectancy, one of the most important indices in evaluating human health and aging, could be regarded as a comprehensive index reflecting levels of development in regional economy, education and healthcare [
1]. To improve human wellbeing and ensure healthier living conditions, the United Nations’ Sustainable Development Goals (2015–2030) explicitly advocated reducing global pregnancy-related deaths, ending preventable newborn and under-five deaths, cutting down on the fatality rate of various diseases and so on [
2]. In the past half century, the world’s average life expectancy has increased from 52.62 years in 1960 to 69.64 in 2010; the global health level has generally improved, but the growth rate has been slowing down. Meanwhile, the growth rate of the less developed areas has been greater than that of the developed areas. Although life expectancy between the two shows a narrowing trend, there is still a huge gap in the life expectancy of countries [
3]. Life expectancy in most developing countries began to increase rapidly after World War II because of the sharp decline in mortality [
4], especially in China and India, the most two populous developing countries, health improvement of which contributes greatly to the improvement of global life expectancy [
5]. Therefore, the improvement of global life expectancy mainly depends primarily on developing countries. Prior studies have shown various factors like natural environment, economic development level, and living habits etc. are related to life expectancy, and have illustrated their distinct effects in more- and less-developed countries and regions [
6,
7,
8,
9,
10,
11,
12,
13,
14]. As human beings face increasing challenges in the process of increasing life expectancy, countries and regions need to take comprehensive measures, including developing their economies, formulating health policies based upon their own specific conditions, improving the environment, and promoting social progress, so as to effectively maintain the continuous improvement of life expectancy [
6,
7,
8,
9,
10,
11,
12,
13,
14].
For Chinese government, extending life expectancy and promoting public health and wellbeing are also two major concerns. It was proposed in the 13th Five-Year Plan to extend national average life expectancy by one year from 2015 to 2020 [
15]. Moreover, increasing life expectancy is also one of the main indicators of “Healthy China 2030” [
16]. Since the establishment of new China, life expectancy has been increasing a lot, from 35 years old in the early days of the establishment of new China to 68 in 1982, further reaching 74.8 years in 2010. In addition, the growth rate began to slow down when life expectancy reached about 70 years, which is similar to many developed countries [
17]. Meanwhile, the growth rate of the less developed areas is greater than that of the developed areas, because of which the regional inequality of health level has been effectively alleviated, but a gap remains in comparison to developed countries. There is still room for further improvement in China’s health inequality [
18]. Various empirical studies have clarified differences in the upside for life expectancy in regions with different economic development levels [
19]. Meanwhile, factors influencing life expectancy are also different in different regions and at various development stages [
1,
20,
21]. Therefore, how to further improve life expectancy in different regions when the current life expectancy has reached a certain level depends mainly on the local governments. They must scientifically assess the dynamics of life expectancy and its causes, which is fundamental for setting reasonable goals and formulating effective policies to increase life expectancy.
Most previous studies focused primarily on using cross-sectional data to explore the factors of life expectancy in a certain year or on using panel data to analyze the influencing factors in a certain period of time. However, change in life expectancy is limited to the analysis of temporal and spatial differences, and the mechanism behind this change is seldom considered [
22,
23,
24,
25,
26]. Thus, based on the 5th and 6th censuses data, this paper illustrates the spatial distribution and influencing factors of the change in life expectancy of cities at the prefecture level or above in China, and aims to answer the following research questions: (1) What are the spatial distribution characteristics of the change in life expectancy of Chinese cities from 2000 to 2010? (2) What are the major factors that influence the change in life expectancy of Chinese cities? and (3) How do the effects of these dominant factors on the change in life expectancy vary across China?
This paper is structurally arranged as follows: following the introduction, the next section is the literature review mainly summarizing recent research on changes in life expectancy. The third part presents the study area investigated, data used, and methods employed. The fourth part shows the main empirical results, including the spatial pattern of the change in life expectancy and its influencing factors in study area. The final part is the conclusion and discussion.
2. Literature Review
Recently, studying what factors influence life expectancy has drawn much scholarly attention [
6,
11,
14,
27,
28,
29,
30,
31,
32,
33,
34]. The contribution of economic growth to health varies in regions with different economic development levels. The level and accessibility of healthcare services are closely related to the life expectancy; demographic indicators including educational level, age structure, gender structure, family size all have different effects on life expectancy; air quality, topography, climate, and other natural conditions also contribute to change in life expectancy.
How economic development influences life expectancy has attracted wide scholarly attention. As Richard Wilkinson’s inequality hypothesis indicates a law of diminishing marginal returns in the effects of economic development on health [
35,
36], socio-economic improvement might be more important for human wellbeing than technological progress in developing countries with relatively low income [
29]. Thus, in this stage, the rise of average income, urbanization rate, and other socio-economic conditions promote the extension of life expectancy the mostly [
14]. However, with economy developing, individual lifestyle and living habits play increasingly important roles [
36,
37]. Meanwhile, income inequality, along with social segregation, relative deprivation, and long-term stress, have become the leading factors causing regional disparities of life expectancy in developed countries [
38]. This relationship indicates that narrowing income gap would be a proper way to improve human health and wellbeing in developed countries or rich areas [
13]. For China as a developing country, some of prior studies have demonstrated the applicability of Richard Wilkinson’s theoretical hypothesis [
37,
39]. Different cities are at distinct economic development level and there are regional differences in the impact of economic growth on the further improvement of life expectancy in China. Hence, more empirical efforts are needed to clarify the influences of economic growth on the change in life expectancy.
Medical facilities and access to them are also critical factors influencing regional life expectancy. There are significant differences in medical and health resources on types and degrees of scarcity among developed and developing countries. Life expectancy in developing countries are more influenced by basic public health services than elsewhere [
38]. When health resources are not enough, increasing the supply and improving the accessibility of health care resources are critical for extending life expectancy. Comparatively, earlier diagnosis of chronic diseases is much more essential in developed countries [
8]. Among different ethnic groups, improvement of accessibility to healthcare and medical interventions means less gap in mortality [
39]. Empirical study also found that attentive care and the amount of public health nurse are important for extending life expectancy of those at 65 years and above [
10]. Unexceptionally, in China, there are remarkable variations in the level and accessibility of medical resources in different regions and cities. Thus, only focusing on the quantity of medical and health resources is not enough; the quality and utilization of these resources must also be considered [
25]. Meanwhile, given that infant deaths have been generally low in recent decades, the elderly are increasingly important in the change of life expectancy. Thus, the medical and health investments for the elderly worth more attention [
19].
Demographic structure is also an important factor that affects life expectancy. The first aspect to be considered is educational level [
14]. It is widely acknowledged that people with higher educational level are more prone to accept new lifestyles, tend to learn more about knowledges about health, which is decisive to their cultivation of better living habits [
22,
23,
24]. Higher educational level also means a higher income and a more sanitary living condition. Moreover, women with higher level of education are less likely influenced by traditions. They care more about fewer and better births, and their behavior of child rearing is much more scientific, which promotes the decline of fertility and fatality [
22]. Empirical study also indicates a co-variation between higher educational level and longer life expectancy [
7]. Larger gap of educational level leads to more differences in life expectancy [
11]. In China, variations in the educational level among cities is substantial; therefore, improving health status by facilitating a higher educational level deserves further discussion. The second aspect to be considered is the age structure. Both ends of life—childhood and the elder years—are the main contributors to the increase in life expectancy, namely under-five children and over-sixty elderly people. At present, the mortality rate of children under five years old in China has dropped to a low level; in the future, the population that will drive life expectancy to continue to increase will be the elderly over 60 years old [
19]. In addition, the birth rate is an indicator that could reflect economic development level, culture and education, demographic structure, and other factors in a region. Generally speaking, areas with a high birth rate are economically depressed and have a low educational level, which leads to low life expectancy of the population, such as in Tibet. The implementation extent of family planning policy affects the lifespan through affecting family economy and age structure [
22]. The third aspect is the gender structure within a population. There is a significant difference between the life expectancy of females and males, a difference which indicates an increasing trend with the continuous development of society. Thus, gender has a certain impact on life expectancy [
8]. The fourth aspect to be explored is family structure. Reducing family size—related to the level of family planning and people’s beliefs—is one method to improve life expectancy [
22]. On the one hand, as a symbol of regional development and modernization level, a reduction in family size signifies an improvement in economic development level and is conducive to the improvement of health status. On the other hand, the reduction of family size means fewer family resources and less care for the elderly, and neither of them are conducive to the improvement of life expectancy. In China, significant differences in the economic development level of different cities exist among east, central, and west regions. Family size also exhibits differences regionally, thus, its role in improving life expectancy also has obvious regional variations.
The natural environment is also an important factor that affects life expectancy. With development of society, the impact of environmental quality on life expectancy is increasingly significant [
22,
24]. Air quality is an important element. Increasing the risk of suffering lung cancer, bad air quality is thought to be a negative factor for extending life expectancy [
40]. Two additional significant elements are topography and climate. In China, regional differences of correlation between topography and population are significant [
41]. Human economic activities are deeply influenced by topographic and other natural conditions. Prior studies have demonstrated that natural conditions including topography and climate are significantly related to life expectancy [
42,
43,
44]. The average altitude of eastern China is below 500 m, while western China is much higher with Qinghai and Tibet over 3000 m and other regions in western China about 1000 m. The high altitude of western China, along with arid and cold climate is not suitable for living, which is correlated with a shorter life expectancy [
44,
45]. To summarize, the following two hypotheses are presented:
Hypothesis 1. The initial level of life expectancy may have a negative correlation with the extension of life expectancy, and life expectancy in different areas will eventually converge to a certain higher level. Moreover, the convergence degree of life expectancy in cities with different economic development levels varies, and it may lead to a stronger narrowing trend of the gap in life expectancy in middle-income areas than that in low-income and high-income areas.
Hypothesis 2. The causes of the gap variation in life expectancy vary from region to region; at the same time, the effect direction and intensity of the same variable on life expectancy may differ in different areas with varying economic development levels.
3. Methods
With large social, economic, and environmental variations across the country, China is selected as the study case to analyze the spatial patterns and influencing factors of the change in life expectancy from 2000 to 2010. Specifically, this study first uses the concept of absolute β convergence to analyze the convergence of the change in life expectancy, and then employs the OLS method to explore factors of the change in life expectancy. Meanwhile, the OLS regression analysis is conducted according to the economic development level to illustrate the different effects of factors, which indicates the necessity of employing GWR model to unravel factors influencing the change in life expectancy at a regional and more micro scale.
3.1. Calculation of Life Expectancy
The method to calculate life expectancy is to track and investigate the group of people born at the same time, record the death toll of each age group until the end of the last person’s life, and then calculate life expectancy according to the number of people living up to different ages. As it is very difficult to track the complete life cycle of a group of people born at the same time, we can often use the mortality level of different ages in the same year to replace the mortality level of the same generation at different ages in application. Then, we can calculate the average survival number of people of all ages, thus calculating the life expectancy in this year. Therefore, life expectancy is related to the mortality rate during the same period. The calculation steps of the abridged life table are as follows:
- (1)
Calculating age-specific mortality rate nmx: nmx = Dx/Px
- (2)
Calculating age-specific probability of death nqx: nqx = 1 − , is the empirical value, according to Reed–Merrell, = 0.008.
- (3)
Calculating age-specific number of survivors lx and deaths 5dx, assuming l0 = 100,000. 5dx = lx × 5qx, lx+5 = lx−5dx
- (4)
Calculating total person-years of survival Tx
The values of each group aged 10 years and above were calculated from the higher age group by the following formula: Tx = −0.20833lx – 5 + 2.5lx + 0.20833lx + 5 + 5
- (5)
Calculating person-years of survival 5 Lx: L0 = 0.276l0 + 0.724l1
L1 = 0.410l0 + 0.590l2
5 L5 = −0.003l0 + 2.242l5 + 2.761l10
5 Lx = Tx − Tx+5
- (6)
Calculating life expectancy ex: ex = Tx/lx
In this study, the Reed-Merrell method was used to form an abridged life table by Statistical Analysis System (SAS) and further to calculate life expectancy of Chinese cities in China in 2000 and 2010. Based on the average population and deaths of each age group, the life expectancy could be calculated [
46]. The Reed–Merrell method was first proposed in 1939 [
47], and it is widely used. The first life table published publicly in China is “Abridged life table of male and female population in Beijing city area in 1950 and 1953” by Li Guangyin in 1957 [
48]. Li found that the Reed–Merrell method was more in line with the characteristics of Chinese data [
48]. Therefore, it is necessary to use this method by SAS to compile an abridged life table.
3.2. Convergence Test of the Change in Life Expectancy
The essence of the convergence test of change in health distribution is to determine whether the areas with lower initial life expectancy levels have higher growth rates than those with higher life expectancy, so as to judge whether there is a so-called convergence trend of health level in different regions in the future. On the basis of the convergence test method in economic research [
23], the convergence test model of change in health distribution constructed in this study is shown in Equation (1), where
is the average life expectancy of the area
at the beginning of the study period
,
represents the average life expectancy of the area
at the end of the study period
T,
is the study period,
is the constant, and
is the convergence coefficient. If
is less than 0, it means that the growth rate of life expectancy in a region is negatively correlated with its initial level, indicating that the growth rate of life expectancy in areas with lower initial levels is faster than that in areas with higher levels, and the difference in life expectancy in different regions has a decreasing trend with time, that is, a convergence trend. If
is greater than or equal to 0, it means that there is no convergence trend in the change of life expectancy in different regions, but a divergent trend.
3.3. Geographically Weighted Regression Model
Many empirical studies have examined the influencing factors of life expectancy by using various methods including econometric model, principal component analysis, Granger causality test, and random forests [
49,
50,
51]. Despite the suitability of these methods for the research purposes of these quality works, they have commonly “averaged” the parameters. However, if spatial autocorrelation exists in the dependent and independent variables, the assumption of independence of the residuals in the traditional regression model is violated, and the ordinary least squares (OLS) method is no longer applicable. To solve this problem, the geographically weighted regression (GWR) model considers spatial non-stationarity for parameters estimating, so it performs local estimation not uniformly. Thus, it is generally used when assuming the relationship between independent variable and dependent variables variates with spatial position [
52]. Thus, this paper attempts to explore the spatially heterogeneous influencing factors of life expectancy extension by employing the geographically weighted regression (GWR) model.
Following is the regression model:
where
represents the spatial coordinate of
-th point, and
is estimated value of the function
at
-th point. Insignificant fluctuation of
value indicates spatial stationarity;
refers to the random error of
-th point.
Compared with the OLS model, the GWR model has the following advantages: (1) when dealing with spatial data, it can solve the spatial autocorrelation problem that cannot be solved by OLS model, and the parameter estimation and statistical test of the model are more reliable and have smaller residuals; (2) each sample spatial unit corresponds to a specific coefficient value, which makes the model results more reflective of the local situation and can restore the local characteristics of the relationship between variables that is ignored by the OLS model; (3) the parameter estimates of the model can be reflected on the map through using GIS software, which facilitates further construction of geographic models and exploration of spatial variation characteristics and spatial patterns.
Moreover, in the regression of each point, the GWR model considers the interrelations between local and surrounding points, which demands a spatial weight matrix among sample regions. Adaptive bandwidth of the quadratic kernel function and the modified AIC were employed for regression modeling in this study. The estimation results and coefficient distribution map were processed by MGWR 2.0. The impact direction and degree of each variable on the change in life expectancy of different regions could be reflected by the symbol and magnitude of estimated regional coefficients.
4. Results
4.1. Study Area
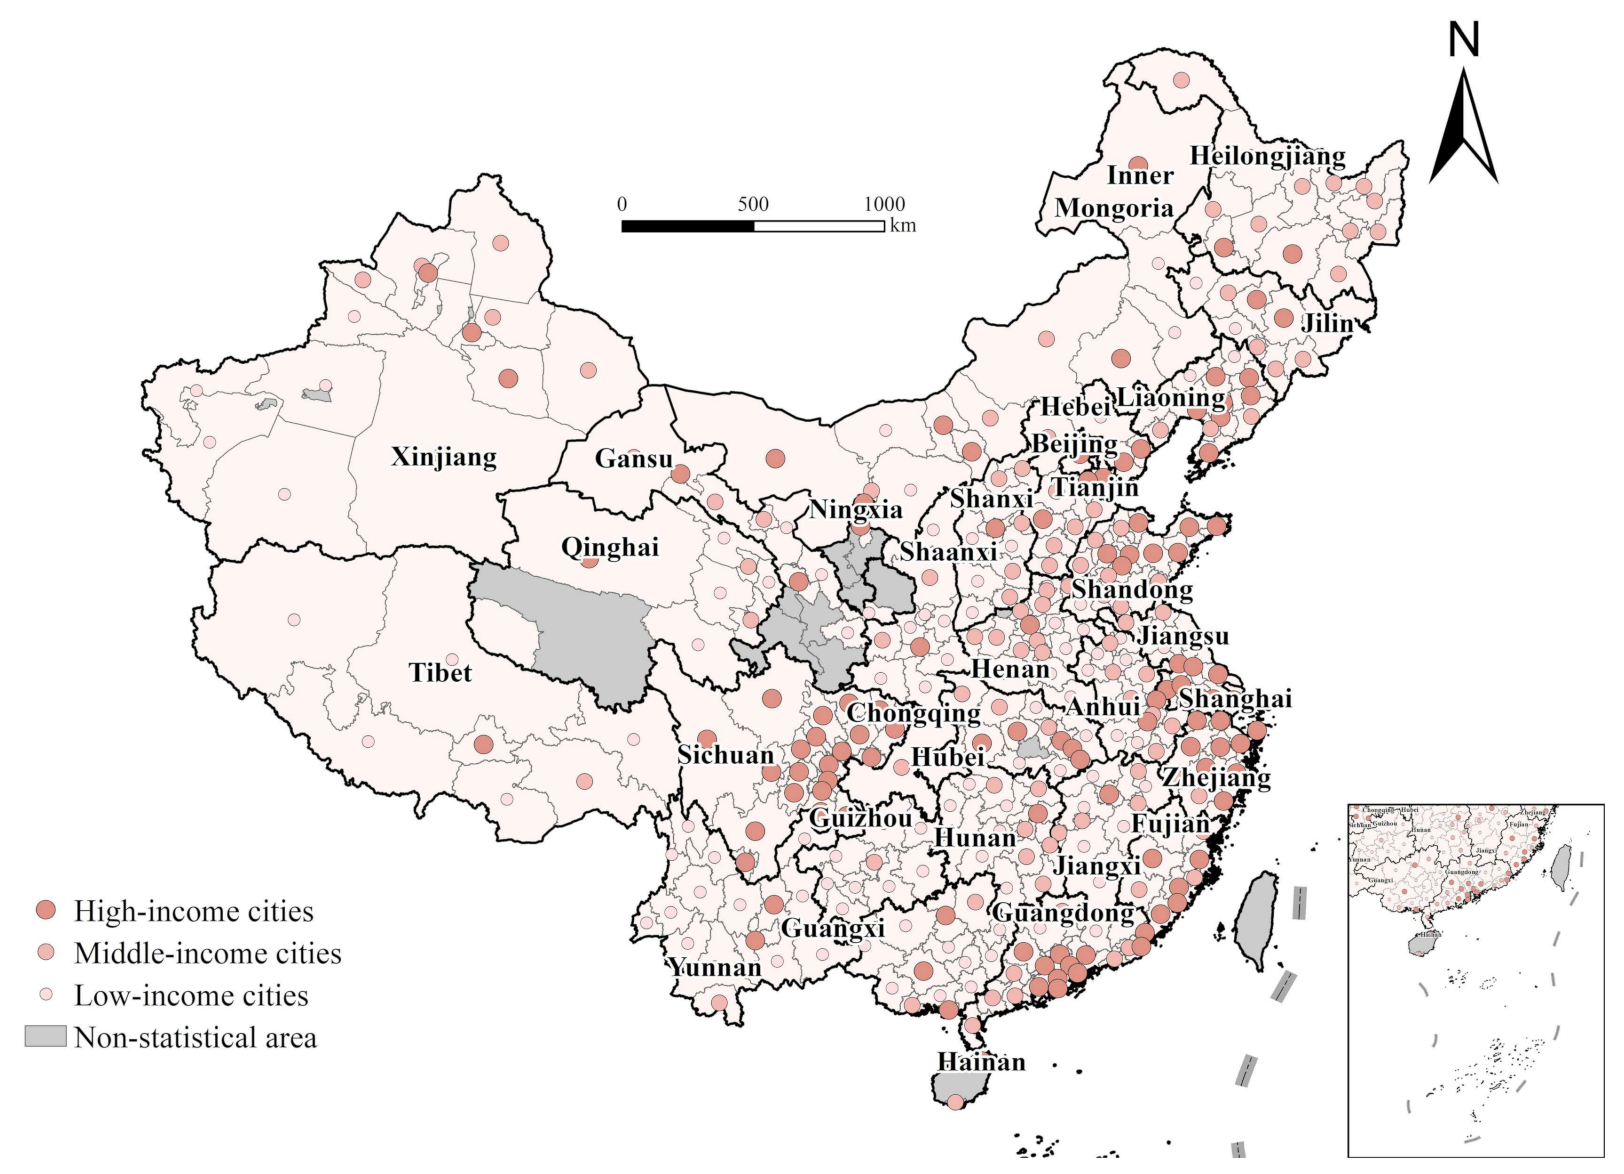
This study takes 327 cities at the prefecture level or above (including prefectures that are not termed as cities but play the same role in China’s administrative system) in 2010 in China as research subjects (
Figure 1). The lowest life expectancy in 2010 was 49.66 years located in Yushu of Qinghai, which might be related to the severe earthquake disaster occurred in 2010, which caused many deaths; therefore, it was excluded as a special case. At the same time, considering the availability of data and the adjustment of administrative divisions, nine other cities were also excluded, including Chaohu of Anhui; Qingyang, Linxia Hui Autonomous Prefecture, Dingxi, Gannan Tibetan Autonomous Prefecture, Longnan of Gansu; Wuzhong, Guyuan, and Zhongwei of Ningxia. Following these exclusions, 327 cities at the prefecture level or above were included in the study.
In order to further investigate and analyze the association between economic development and change in life expectancy in China, the 327 cities are divided into three categories—109 low-income cities (per capita GDP in 2000 ≤ 5000 yuan), 105 middle-income cities (per capita GDP in 2000 of 5000–8000 yuan), and 113 high-income cities (per capita GDP in 2000 ≥ 8000 yuan)—using the quantile method in ArcGIS 10.6, based on per capita GDP of cities in 2000.
4.2. Data
Combined with the average population and deaths of all ages from 327 cities in China based on the fifth and sixth censuses, life expectancy could be assessed. The calculation of life expectancy at city level needs detailed information on the total population, age structure, and age-specific death rate, of which census data are the only reliable source. The main objective of this paper is to explore the general factors that can facilitate health improvement and the general pattern of their spatial heterogeneity rather than to share the latest information of the health condition of Chinese people. In this sense, reliability and systematicity are more important than timeliness for this study. This is the main reason for our selection of 2000–2010, when the latest round of national census was conducted to do this city-level research on life expectancy. Other data used in this study are mainly from the fifth and sixth censuses, China City Statistical Yearbook for 2001 and 2011, China Statistical Yearbook for Regional Economy for 2001 and 2011, and statistical yearbook of each province for 2001 and 2011.
Variables Specification
The dependent variable in this paper is the change in life expectancy of cities in China from 2000 to 2010. Considering the aforementioned influencing mechanism and the data availability, 12 indicators from four aspects, i.e., the economic development, medical resources, demographic structure, and natural conditions, are selected as the independent variables.
Considering the difference in economic development level, the growth rate of per capita GDP of cities is used to reflect the local economic development level [
29,
35,
36,
37]. For medical resources, on account that the allocation of medical resources in China is conducted by relevant health authorities and these two indicators are highly collinear, thus the change in health technicians per thousand people is chosen in this study to measure the change in medical services [
23]. Due to the significant difference in road density in different regions and the improvement of traffic conditions in recent years, the change rate of road density is selected to be the proxy of improvement in the availability to medical resources, which is crucial for increasing life expectancy [
39]. For demographic factors, the change in average years of education is used to reflect the function of improvement of education [
22,
23,
24,
25]. The change in proportion of population aged over 65 years old is selected to reflect the change in aging level on account that the increasing aging level in recent years might also have some effects on the change of life expectancy [
19]. In the current situation, in which the mortality rate is generally reduced to a low level, the fluctuation of birth rate affects more on the variations in lifespan, so the change in birth rate is included in the model [
22]. Moreover, the gender ratio is also considered as a control variable in the models [
8]. Meanwhile, the family structure which has changed a lot over the last several decades in China might also be an important factor in life expectancy extension [
14,
22]. A larger family size means more resources the family could attain for its members, and more care and support the elderly and the sick could get from other family members, both of which indicate a longer life expectancy. Therefore, this study includes changes in family size, i.e., the changes in the household size in the econometric models [
22]. As for the natural environment, the logarithm of average altitude, the average annual PM2.5 concentrations and the mean temperature from 2000 to 2010 were included in the models [
40,
42,
43,
44]. The definitions of these factors and their descriptive statistics are shown in
Table 1.
4.3. Spatial Patterns of Life Expectancy of Chinese Cities
As can be seen from
Table 2 and
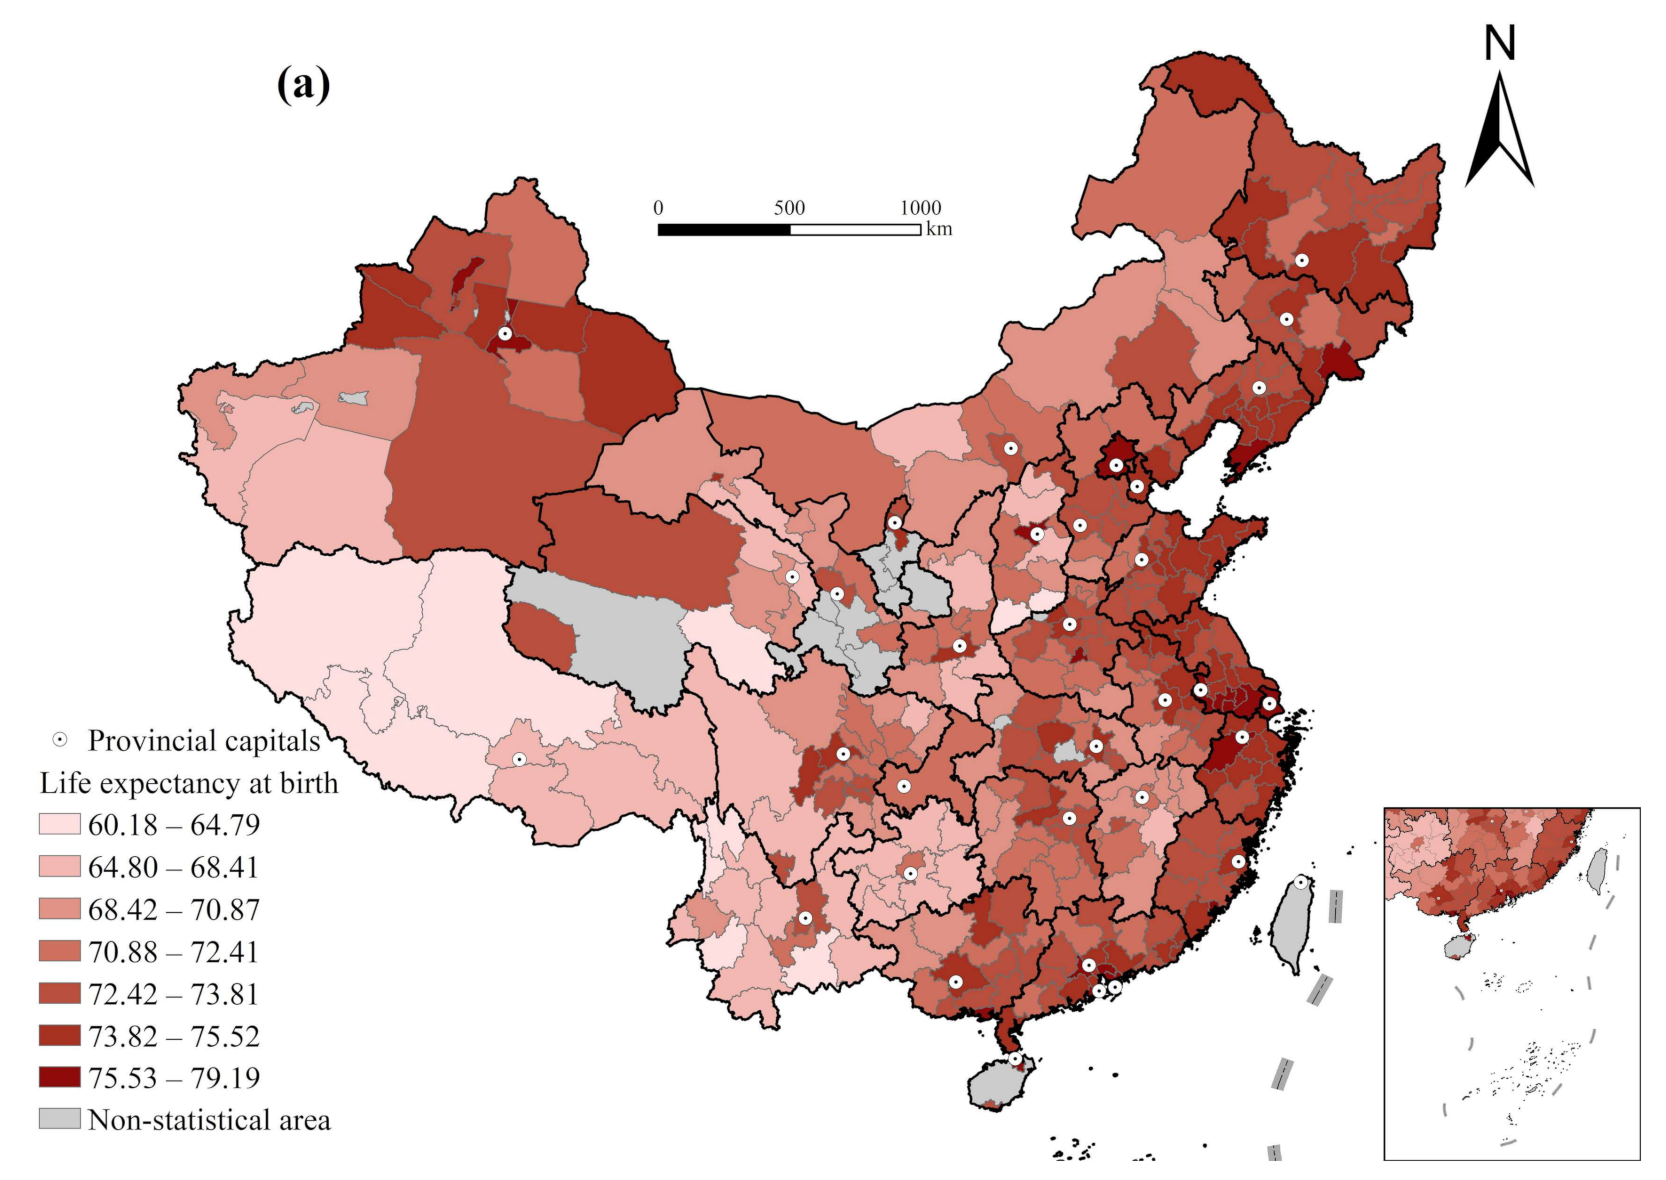
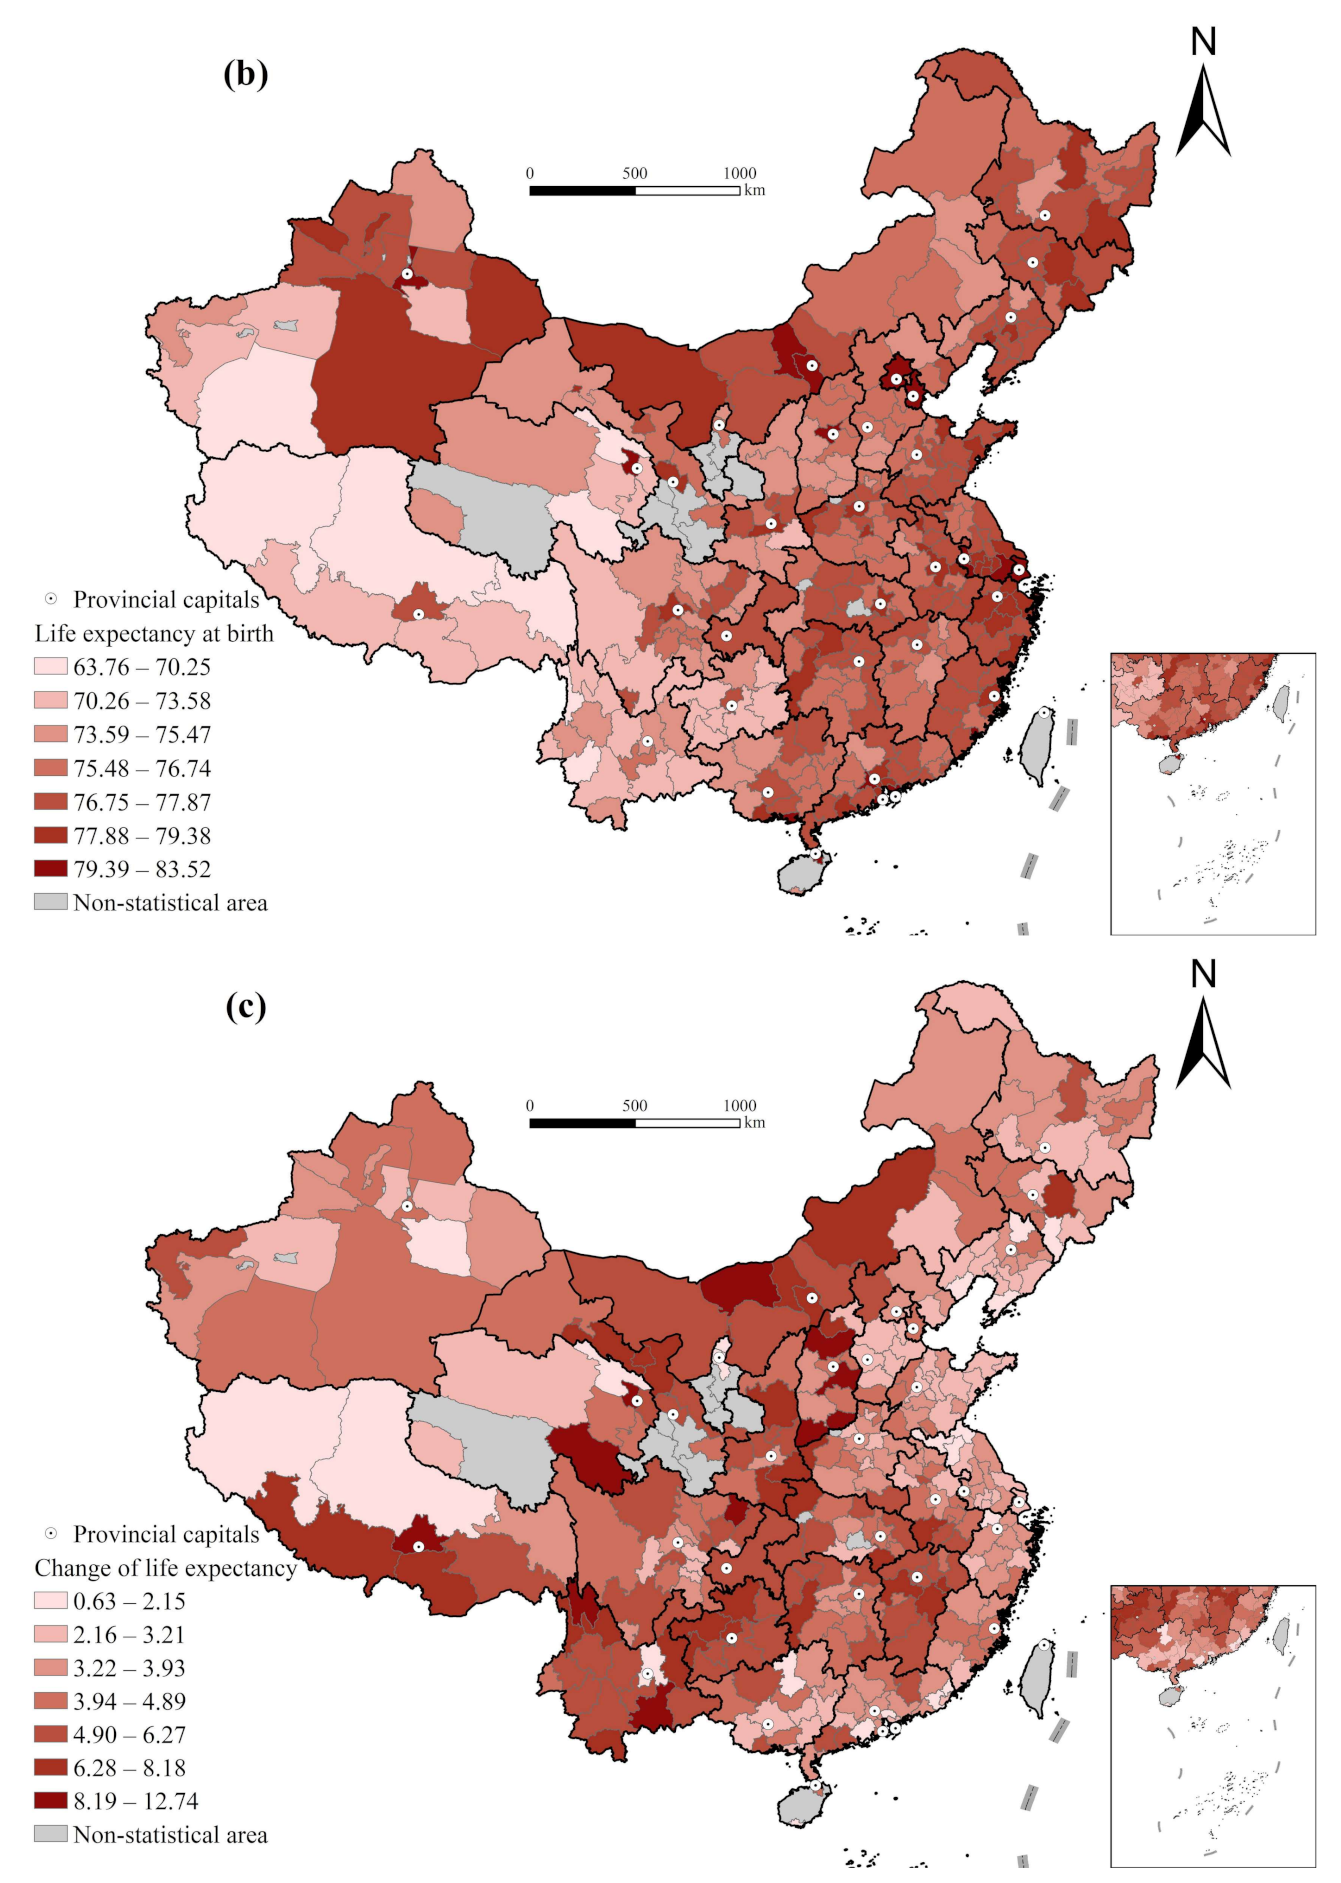
Figure 2, the average life expectancy of Chinese cities in 2000 was 72.01; the standard deviation was 3.07, and the coefficient of variation was 0.043. The maximum value was 79.19, which was in Shenzhen of Guangdong, and the minimum value was 60.18, which was in Nujiang Lisu Autonomous Prefecture of Yunnan, with a difference of 19.01 years from the maximum. Compared with 2000, the average life expectancy of cities in 2010 increased to 76.37; the standard deviation was 2.30 and the coefficient of variation was 0.030. The maximum value increased to 83.52, which was in Xining of Qinghai, and the minimum value decreased to 63.76, which was in Nagqu of Tibet, with a difference of 19.76 years. Moreover, in 2000, the Moran’s I index of life expectancy of cities in China was 0.581, dropping to 0.453 in 2010, and the Moran’s I index of the change in life expectancy was 0.281 (
Table 2).
The coefficient of variation is lower than that in 2000, which means that the gap in life expectancy of Chinese cities shows a narrowing trend. The growth rate of life expectancy in areas with higher life expectancy is lower than that in areas with lower life expectancy, that is, the initial level of life expectancy is negatively correlated with the increase in life expectancy (preliminary verification of convergence). Compared with 2000, Moran’s I index of life expectancy of cities in 2010 is decreased, but both are positive, indicating that although life expectancy of cities in 2000 and 2010 shows an obvious spatial agglomeration trend, the agglomeration in 2010 is lower than that in 2000, and the decentralization trend is relatively enhanced. The Moran’s I index of the change in life expectancy is also positive. Thus, a universal explanation model is not enough to interpret the spatially heterogenous pattern of change in life expectancy. The GWR model provides a reasonable method for solving this problem.
The convergence of the change in life expectancy from 2000 to 2010 was tested using formula (1), and the results are presented in
Table 3. From the national perspective, the F value of the test equation is 355.455, indicating that the equation is significant at the 1% confidence level; R
2 is 0.521, which indicates that 52.1% of the average annual growth in life expectancy can be explained by its initial level. The convergence coefficient
β is −0.723, less than 0, and passes the 1% significance test, which shows that the growth rate of life expectancy with a lower initial level is faster than that with a higher initial level, and vice versa. Thus, the difference in life expectancy between the two tends to decrease with time and will eventually converge or converge to a higher level, which is basically consistent with the conclusion drawn from the coefficient of variation (
Table 3).
Although the change in life expectancy of cities in China indicates a convergence trend from 2000 to 2010, the degree of convergence of cities with different economic development levels may be different. By comparing different regions, it is found that the convergence coefficients are all negative, indicating that the change in life expectancy of low-income, middle-income, and high-income cities from 2000 to 2010 are all significantly convergent. Among the three categories of areas, the life expectancy gap in middle-income cities has the strongest trend to narrow, that is, 80.1%, higher than the convergence rate at the national level; the second is low-income cities (66.7%); while the narrowing trend of life expectancy gap in high-income cities is weak (61.6%) (
Table 3).
It is evident that the growth of life expectancy in cities vary with economic development levels. The narrowing trend of the gap in life expectancy in middle-income cities is stronger than that in low-income cities and higher than that in high-income cities. Thus, Hypothesis 1 was verified. This result is consistent with the conclusion of Yang Zhen et al. (2017) that despite the general improvement in residents’ health status across China in recent years, the marginal effects of economic development, medical advances, and nutritional improvements on health improvement have begun to show a divergent trend, with a greater boosting effect on populations in low-lifespan areas and less in high-lifespan areas [
53]. By using newer data at the cost of spatial fineness, the paper drew a similar conclusion that China’s regional disparity in health condition measured by life expectancy has been decreasing. This common conclusion further demonstrates that regional convergence has been a clear trend of health condition in China which will not be affected significantly by the timeliness and spatial fineness of empirical data.
4.4. Influencing Factors of the Change in Life Expectancy
A global OLS regression analysis was conducted first, and the results are shown in
Table 4. Overall, the changes in average years of education, aging rate, and birth rate, which reflect the demographic structure, have clear impacts on the change in life expectancy. The positive coefficient of the change in average years of education indicates the association between education improvement and life expectancy extension [
7,
11,
14,
25]. The standardized regression coefficient of the change in aging rate is positive, indicating that in areas where the aging level has increased, life expectancy has also significantly improved. An increase in the aging rate signifies achievements in family planning policy, changes in beliefs, and progress in economic development, which is beneficial to the improvement of health conditions. As to the birth rate, generally speaking, a lower birth rate signifies that the level of economic development and educational level have improved, which leads to the improvement of health level in the region. Regarding the natural environment, positive coefficients of the logarithm of average altitude and temperature indicate that regions with higher altitude and temperature increase more in life expectancy.
In order to identify different effects of factors for regions at different economic development level, we divided all cities into three groups according to their per capita GDP and conducted OLS regression separately. Results show obvious heterogeneity in the effects of these factors. In low-income cities, it is more affected by demographic structure and natural conditions. These cities are economically depressed, with a generally high birth rate and a low level of aging. The promotion of family planning and the improvement of demographic structure are highly significant to the improvement of health conditions. For the middle-income cities, the improvement of educational level and the logarithm of average altitude have significant effects on the increase in life expectancy. For the high-income cities, the improvement in regional economic development level and educational level indeed extends the life expectancy significantly, followed by the change in aging rate. These results further illustrate the necessity of GWR model for micro-scale analysis.
Results of GWR model are shown in
Table 5. The increase of adjusted R-square of model from 0.243 (OLS) to 0.285 indicates improved explanation by employing GWR model. Effects of variables are spatially heterogeneously distributed.
Residuals of the GWR model are distributed randomly at 0.05 significance level, with only four cities failing to pass the residual test. The Moran’s I (0.042) indicates almost no spatial autocorrelation of the GWR results. Heterogenous effects of each variable are elaborated in the following parts, after which is a brief discussion of underlying mechanisms. Among them, the impact of economic development and gender ratio on the change in life expectancy is insignificant, thus, it is not included in the geographically weighted regression analysis and will not be discussed in detail.
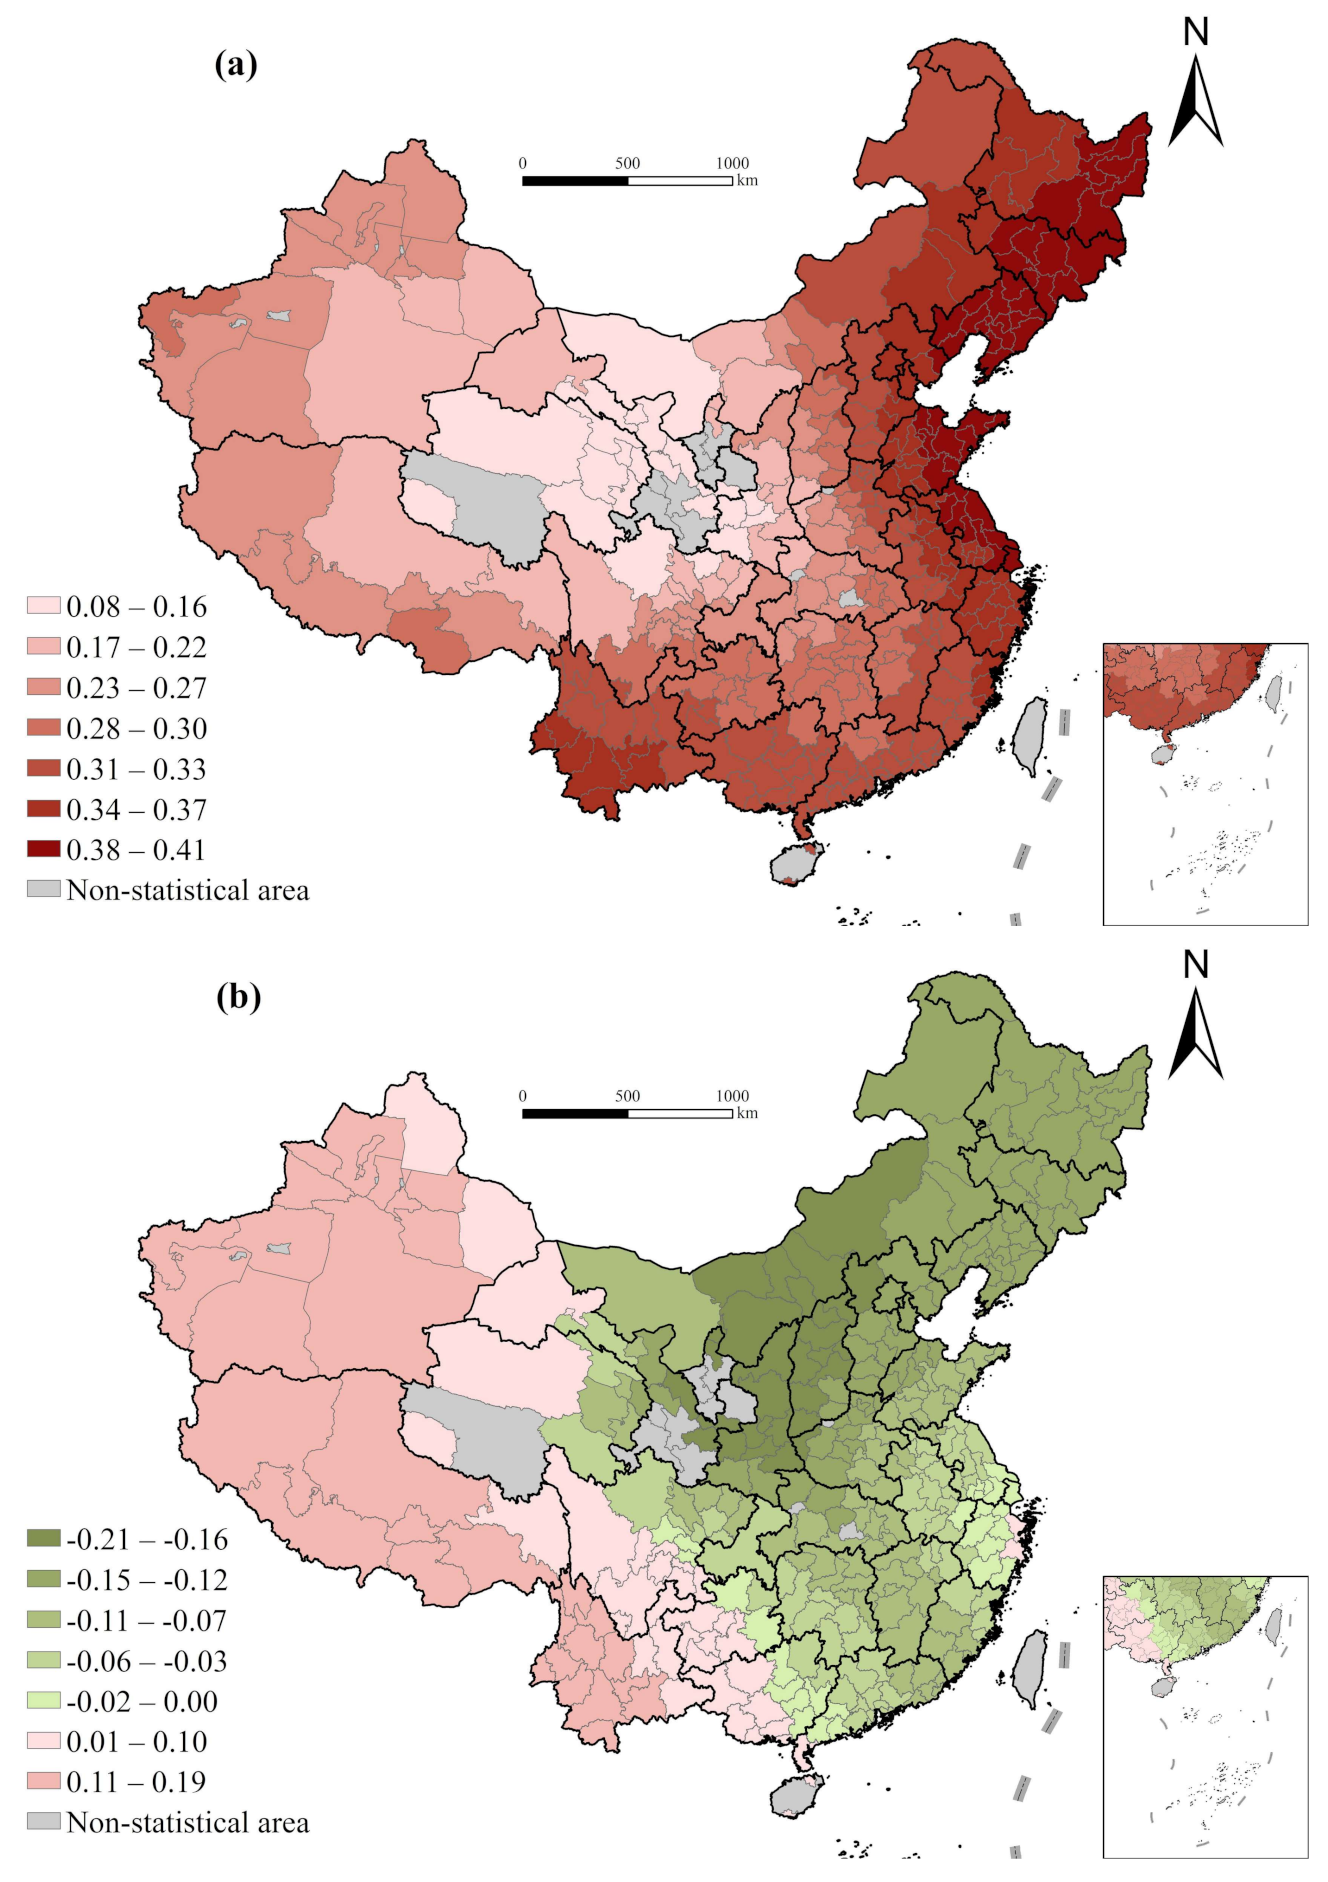
4.4.1. Improvement of Medical Conditions
The global OLS regression result indicates that the effects of change in health technical personnel per thousand people and the change in road density on the change in life expectancy are not significant, but there are obvious spatial differentiation characteristics. A significant positive correlation is observed between the change in health technical personnel per thousand and the change in life expectancy. The regression coefficient gradually increases from southeast to northwest, the maximum of which appearing in some cities in eastern Qinghai and Gansu, and the minimum in in Fujian and Guangdong. It can be inferred that the improvement of the quality of medical resources and the supply level of medical resources is extremely important to the improvement of health level in the western regions [
38]. Meanwhile, there is a weak positive correlation between the change in road density and the change in lifespan in a majority of cities, and the coefficient reaches the maximum value at the transition of the first and second steps of the terrain. These areas are mainly located in remote western China, with steep terrain, poor natural conditions, and inconvenient transportation. The improvement of traffic conditions promotes the accessibility of medical resources, helping residents to more easily obtain them when needed, thus contributing to the improvement of life expectancy [
8] (
Figure 3).
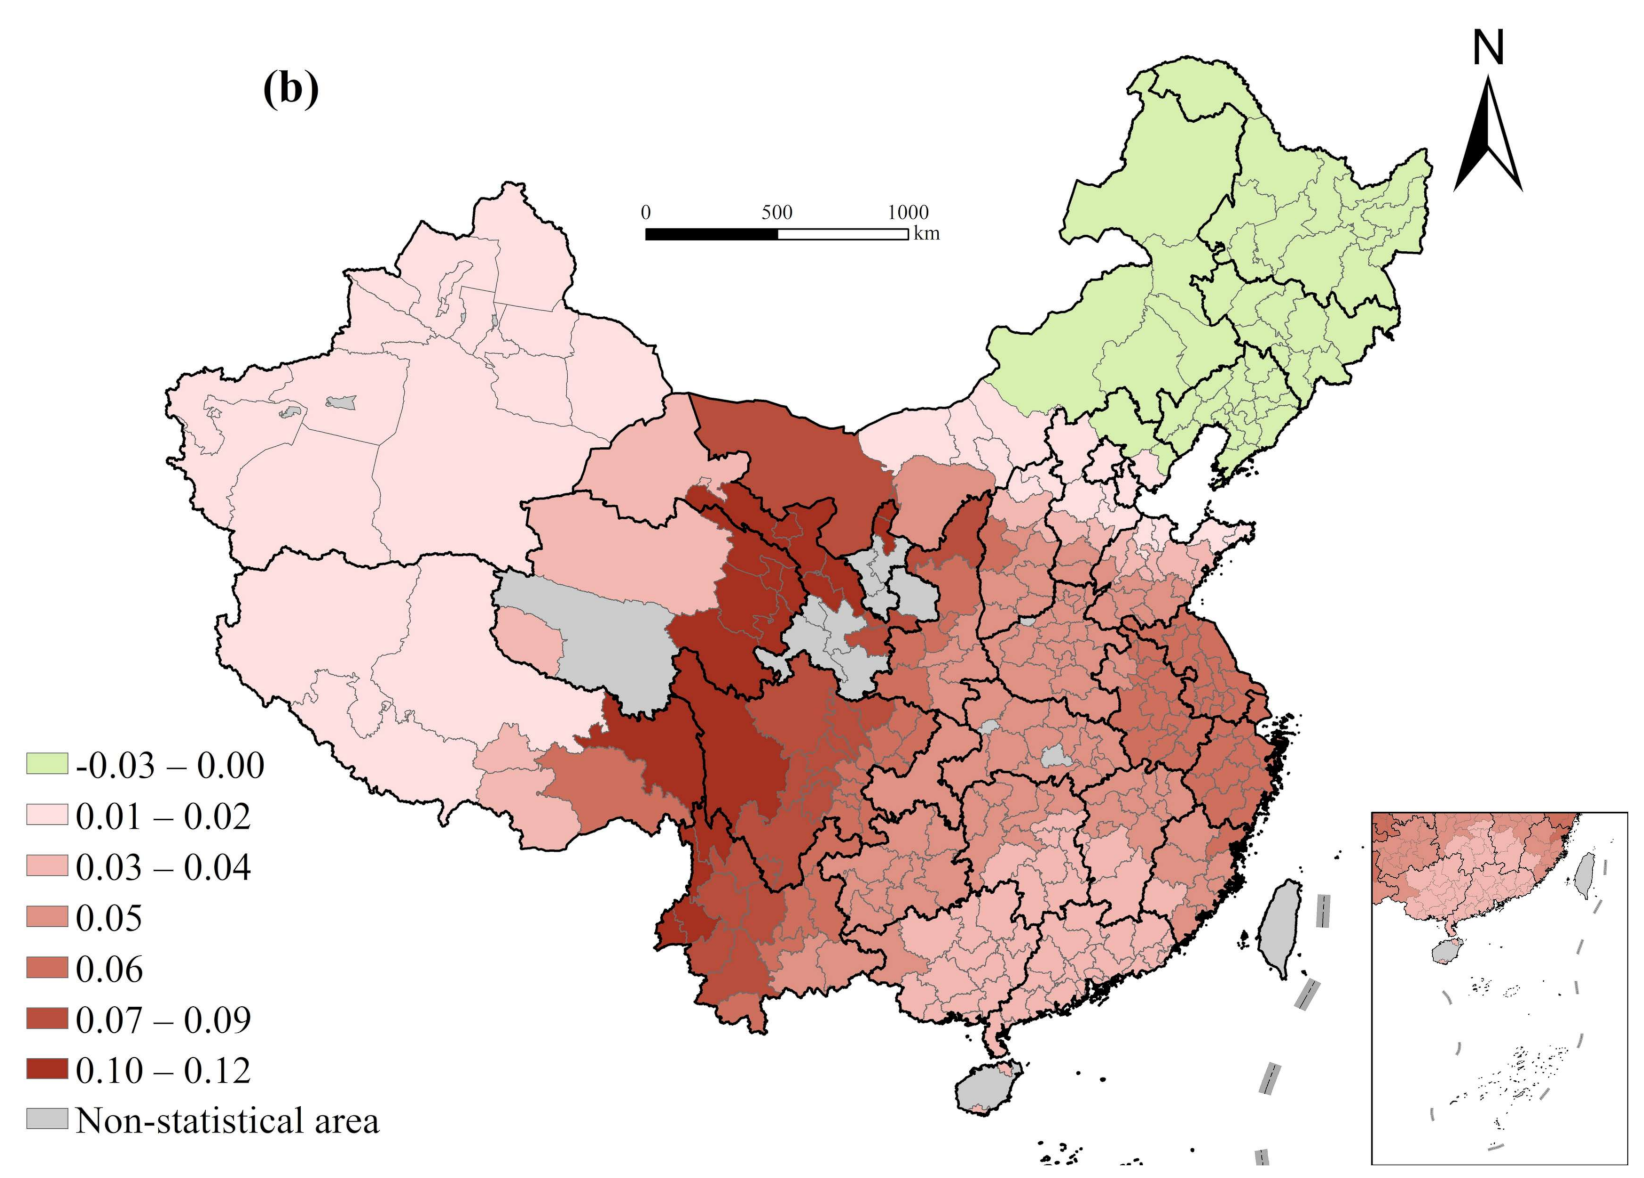
4.4.2. Changes in Demographic Structure
Significant positive correlation exists between education improvement and life expectancy extension in Chinese cities [
7,
11,
14,
25]. The regression coefficients increase gradually from east to west, with most cities in eastern Qinghai and eastern Tibet reaching the maximum value. This result indicates that improving educational situation especially basic education of such poorer areas in western regions is helpful to reduce the infant fatality and promote the health conditions (
Figure 4).
It is also demonstrated that a significant positive correlation exists between the change of aging and that of life expectancy of cities in China, with the regression coefficient reaching the maximum value in Tibet, Xinjiang, Qinghai, and other western regions, and reaching the minimum value in some cities in the Inner Mongolia Autonomous Region and Northeast China. In Western China, the aging rate is generally low and the birth rate is high. An increase in the aging rate means achievements in family planning, changes in beliefs, and progress in economic development, which is conducive to the improvement of health conditions. However, the change in the aging rate has little influence on the change in life expectancy of cities in Northeast China. A possible explanation is that the rapid increase in the aging rate in the region is greatly affected by the large population loss. The higher aging level leads to the rapid growth of the economic burden of disease and demand for medical and health services, continuously damaging the already weak regional economy and health conditions. Meanwhile, aging itself indicates an overall decline in health. These negative effects are offset by the positive ones between change in aging rate and change in life expectancy, which ultimately resulted in insignificant results.
Comparatively, a significant negative correlation is found between birth rate change and life expectancy change [
7,
11,
14,
25]. The regression coefficient of the change in birth rate decrease gradually from east to west, indicating that the decrease in birth rate in Western China has a greater influence on life expectancy. These areas generally experience high birth rates, depressed economic development, limited medical and other social resources, and poor conditions. The reduction of birth rates can significantly reduce the social burden, allowing for the elderly to utilize more medical insurance resources, which is conducive to the improvement of health level. Therefore, the level of implementation of the family planning policy could influence the regional life expectancy through changing the demographic structure [
22].
There is a weak positive correlation between the change in family size and that of life expectancy in most cities, with the regression coefficient reaching the maximum value in western Inner Mongolia, northern Gansu, and eastern Qinghai, while it is negative and insignificant in Northeast China and Eastern Inner Mongolia [
22]. On the one hand, as a symbol of regional development and reaching a level of modernization, the reduction in family size means improvement in economic development level and is conducive to the improvement of health status. On the other hand, as aforementioned, the reduction in family size results in fewer family resources and family care, which is averse to a longer life expectancy. The two hypotheses are relatively balanced in Northeast China, leading to insignificant final results.
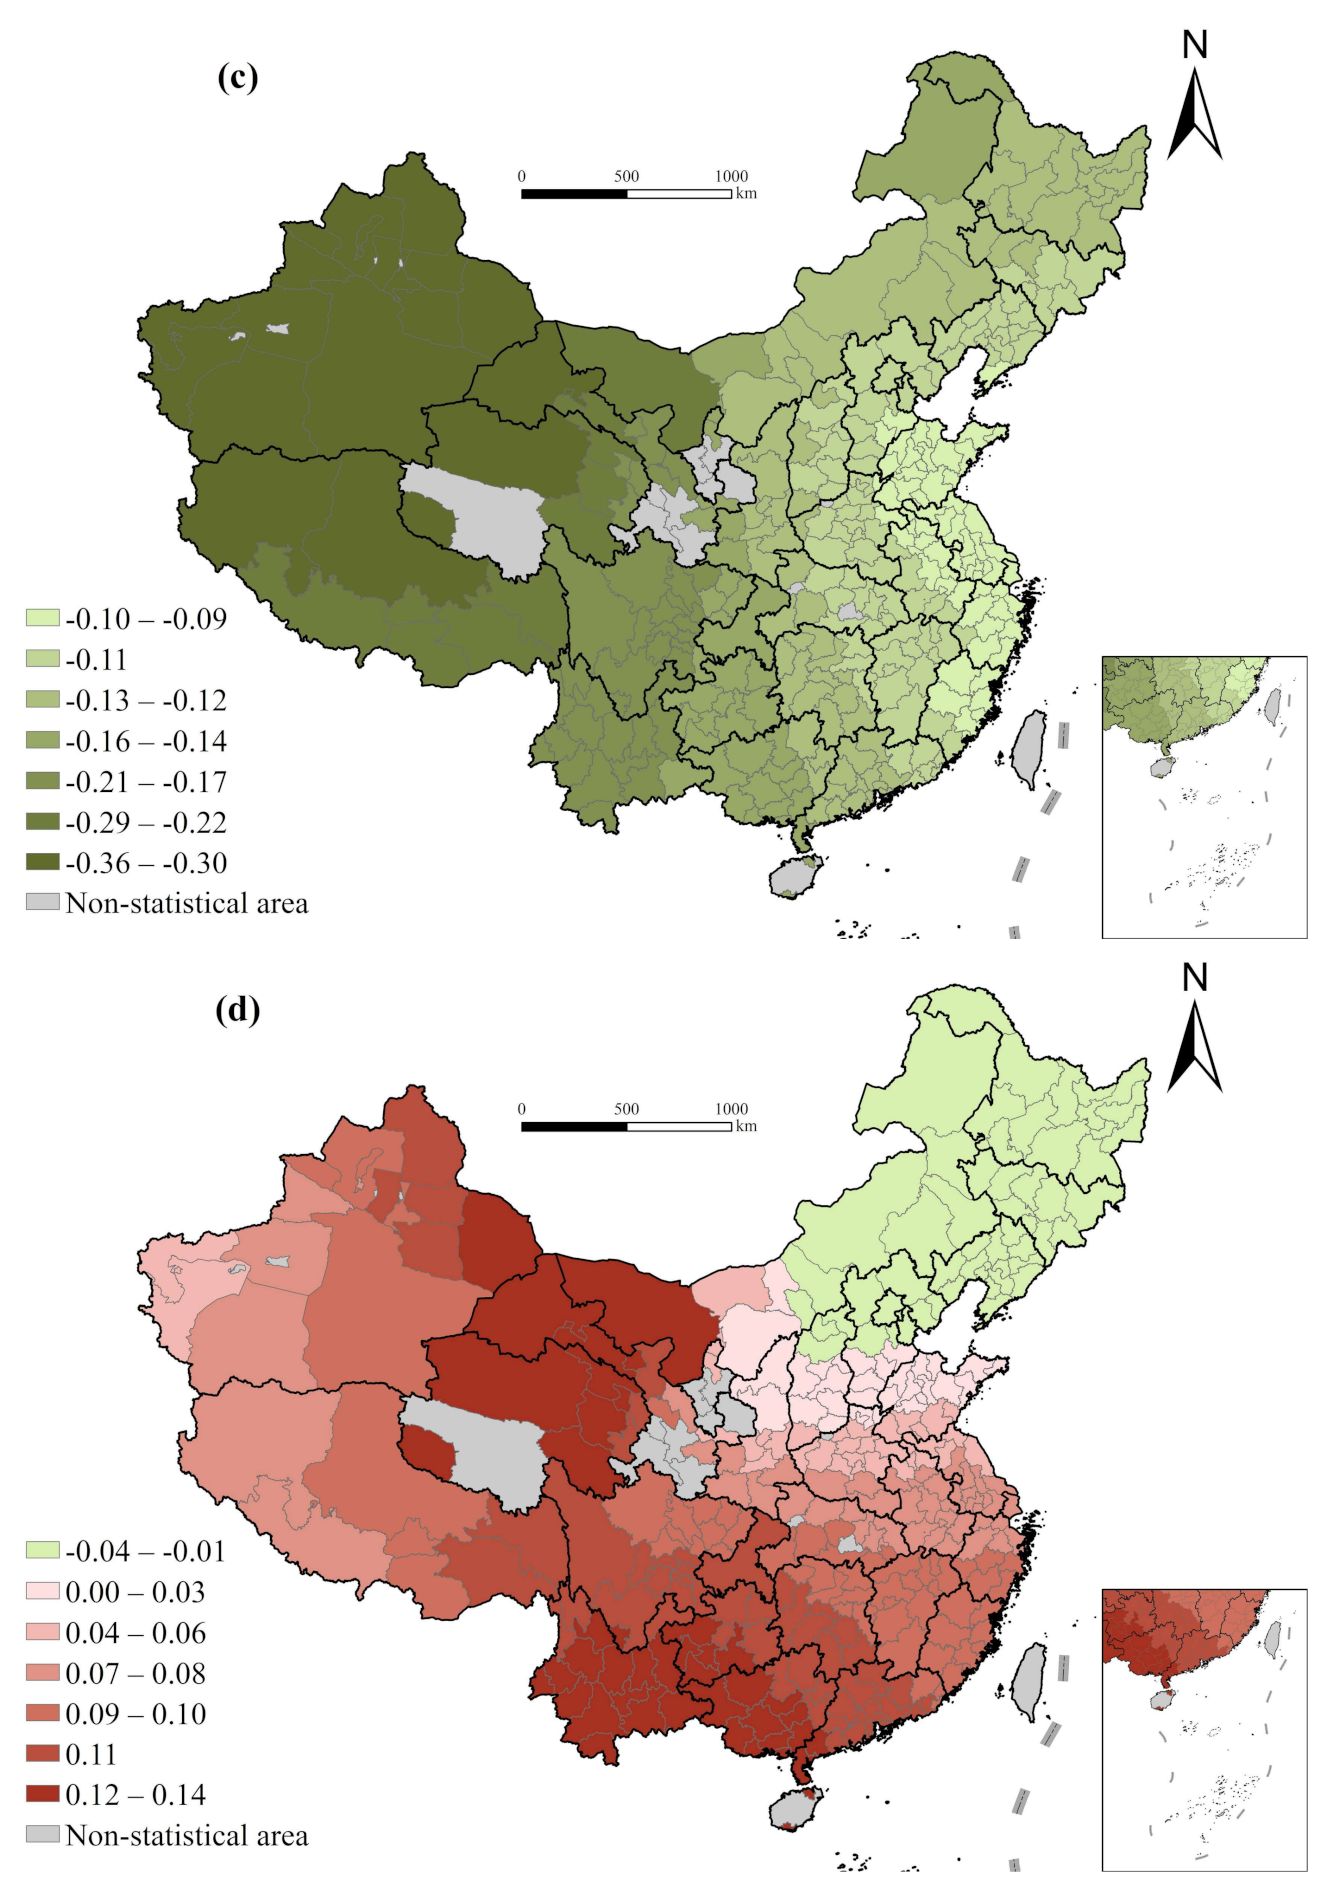
4.4.3. Natural Environment
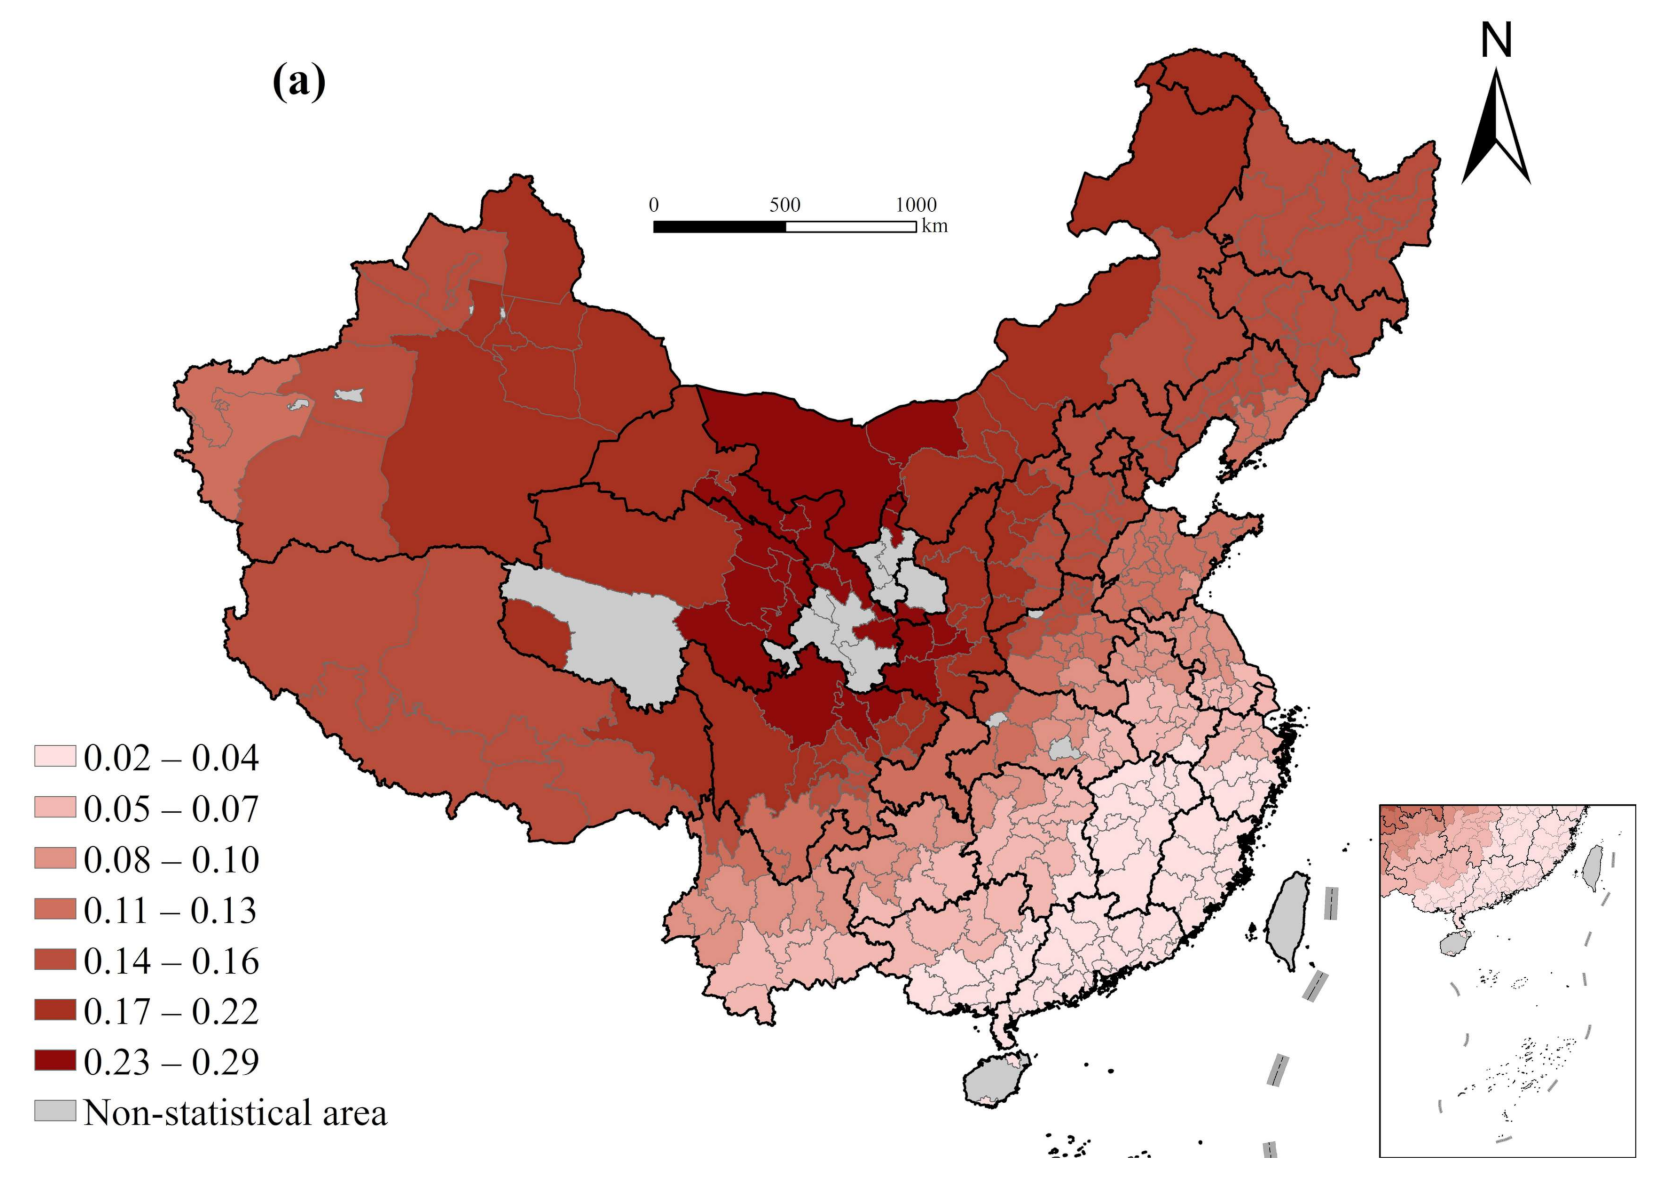
The average altitude is significantly positively related to the change in life expectancy overall. The higher the average altitude, the greater the growth of life expectancy because the areas with higher altitude are mostly mountainous areas with a lower initial level of life expectancy, so there is more room for growth. The regression coefficient decreases gradually from the eastern coast to the inland, indicating that for the same altitude, the increase in life expectancy in the east is greater than that in central and west China, indicating that economic development can compensate for the restriction of natural conditions on the improvement of life expectancy (accessibility of transportation and availability of medical facilities). This also reminds us that in order to narrow the gap in health development among regions and to realize Healthy China 2030, we need to focus on improving life expectancy and vigorously developing the economy in the western region, especially in the mountainous areas (
Figure 5).
The impact of air quality on the change in life expectancy illustrates a significant East–West difference, with a negative impact in the East and a positive impact in the West. The worse the air quality in the East, the smaller the increase in life expectancy, which is basically consistent with common sense [
40]. Rapid economic development in eastern China has had a significant negative impact on the environment; at the same time, a fast pace of life, increased psychological stress and anxiety driven by rapid economic development are also not conducive to health improvement. However, the economic development level in western China is relatively low. The positive effects of rapid urbanization on health may exceed the negative effects mentioned above, which is conducive to health improvement overall. This suggests that different measures for improvement of the health status should be taken in regions at different stages of economic development, such as paying more attention to people’s living environments and mental health in economically developed areas, while the key measure to improving overall life expectancy is to improve the level of economic development in underdeveloped areas.
The average slope is positively connected with the change in life expectancy except for the Northeast China. This is because the areas with higher slopes are mostly mountainous areas with lower initial levels of life expectancy, so there is more room for growth. The regression coefficient shows a gradual increase trend from east to west, indicating that for the same slope, the increase in life expectancy in the western region is greater. Since development of the western region in China began, investment in funds and preferential policies for this region have been strengthened. In addition, its urban and rural medical and health system has gradually been fully covered, health resources have been fully utilized, the health service level (maternal and child health care) has been significantly improved, considerable progress has been made in medical and health services, and people’s health conditions have continuously improved.
The impact of temperature on the change in life expectancy illustrates a significant south-north difference, indicating that the higher the temperature in the south, the smaller the increase in life expectancy; and the higher the temperature in the north, the greater the increase in life expectancy, especially in Northeast China. This may have a significant relationship with the initial temperature level. The perennial mean temperature in Northeast China is generally low, and with the increase in temperature, it is beneficial to health.
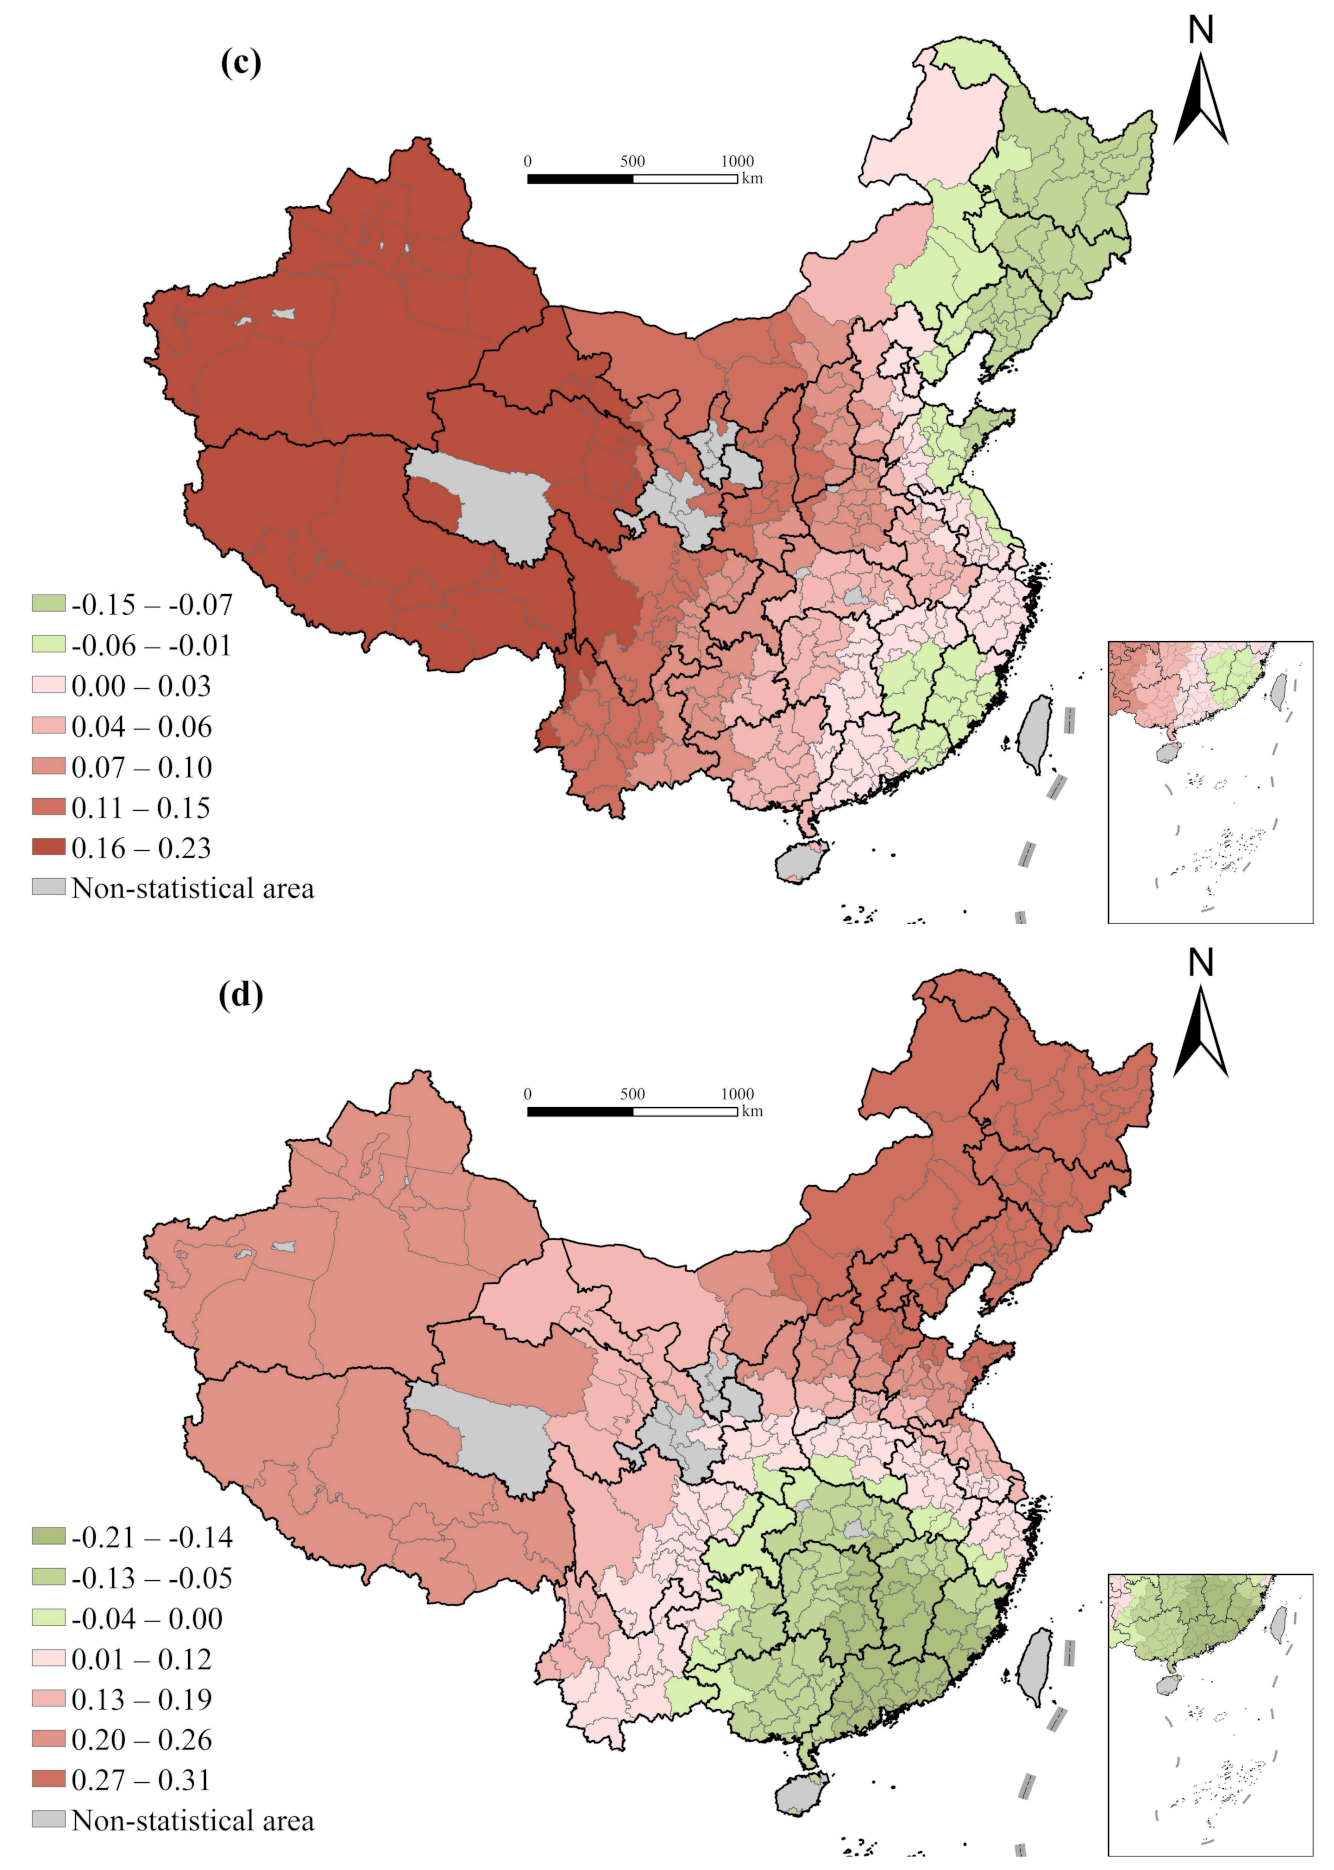
4.5. Spatial Variation of Dominant Factors
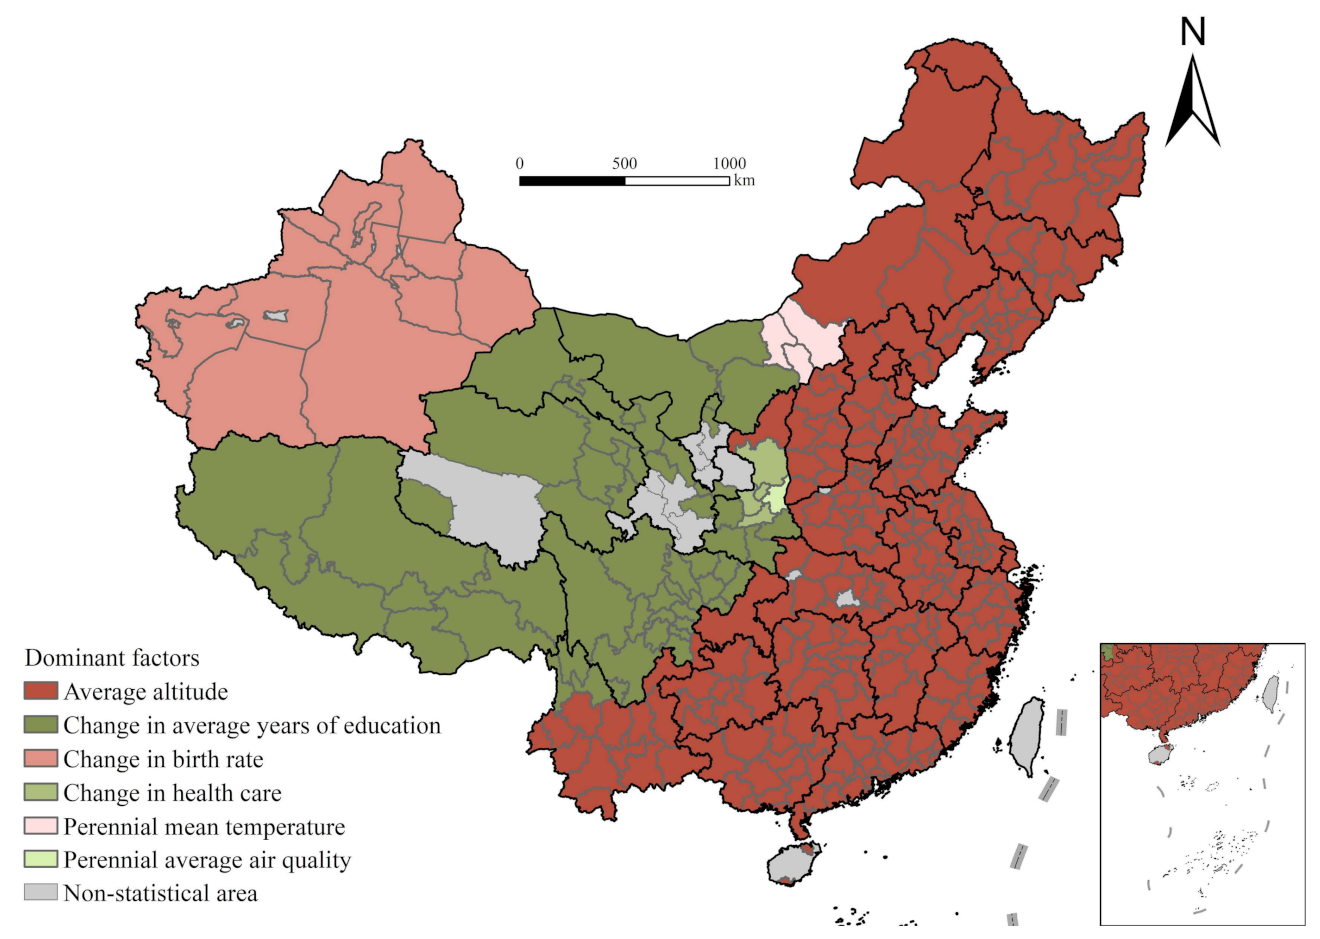
Dominant factors of the change in life expectancy of Chinese cities are presented in
Figure 6, from which two obvious characteristics could be identified. First, the leading factor of the change in life expectancy varies across regions conspicuously, confirming the spatially heterogenous impacts of factors and the necessity of employing GWR model. Second, there is a clear spatially continuous pattern of each dominant factor, which is attributed to the continuity of geographic conditions and cultural background and also demonstrating the rationality of the results (
Figure 6) [
46].
Specifically, topography and other natural conditions dictate the change in life expectancy in most cities in the middle eastern region of China. The leading influence of educational level is mainly reflected in the vast western regions such as Qinghai, Tibet, Gansu, Sichuan, Shaanxi, and Western Inner Mongolia. On account of the economic development and educational level of these areas is low and thereby leaving much room for development, the improvement of educational level is instrumental to increasing the life expectancy and health status of these areas. The change in birth rate mainly affects the change in life expectancy in Xinjiang.
5. Conclusions and Discussion
This paper analyzes the distributional pattern of the change in life expectancy of Chinese cities from 2000 to 2010 based on the fifth and sixth census data, and further explores the heterogenous effects of the independent factors in different regions. The GWR model employed in the empirical section helps clarify the spatial heterogeneity of the effects of influencing factors. In general, natural conditions such as topography dictate the change in life expectancy in most cities in the middle eastern region of China. The leading influence of educational level is mainly reflected in the vast western region; the change in birth rate primarily determines the change in life expectancy in Xinjiang. In other words, the leading factors of the gap change in life expectancy in different regions vary, which further verifies Hypothesis 2.
Economic development is usually acknowledged as an important factor influencing life expectancy [
35,
36]. However, at present, the economic development of most cities is at a high level; further economic growth has almost negligible impacts on life expectancy and health condition of local residents. The improvement of medical and health services is beneficial to the extension of life expectancy, especially for cities where medical resources are scarce; and advancements in the supply level of medical resources is crucially important for improvement of public health [
8]. At the same time, it is imperative to improve the transportation infrastructure and, thus, the accessibility of medical services in areas with poor natural conditions and inconvenient transportation. In terms of demographic structure, improving educational status -especially basic education and women’s education in relatively depressed areas, is helpful to reduce infant fatality and improve the overall health. At the same time, with the gradual improvement of the aging level, the health of the elderly and improvement of medical and health service levels for them should be concerned more. Regarding the natural environment, economic development, capital investment, and policy preference in the western region can compensate for restrictions placed on the improvement of life expectancy by natural conditions (accessibility of transportation and availability of medical facilities).
Therefore, to achieve goals about life expectancy set in the Healthy China 2030 Plan and the UN SDGs, more specific measures should be stipulated according to local conditions to better solve health problems, and more attention should be paid to improve health conditions in middle-income and low-income areas. In different stages of economic development, distinct measures should be taken to improve the health status; for example, more attention should be given to the living environments and mental health of people living in economically developed areas. Further, the key measure to improving life expectancy is to rapidly improve the level of economic development in underdeveloped areas. To further improve the life expectancy of the western regions and promote the overall high-quality development of the regions overall, we should consistently implement the new development concept, focus on economic construction, vigorously build and strengthen medical and health services while increasing the GDP, and simultaneously increase capital investment and policy preference for the western regions.
This paper also has some shortcomings to be overcome in future study. On the one hand, we chose the reliable and systemic census data to explore the city-level heterogeneity in the driving forces of health improvement. However, the cost is the timeliness of the research. Further studies are needed to investigate the most recent trend in health condition change in developing countries like China. The seventh national census conducted at the end of last year may provide the opportunity in near future. On the other hand, under the long-term urban-rural divide in China, the economic development in urban areas is generally better than that in rural areas, which inevitably results in health differences between urban and rural residents [
54]. Besides regional unevenness examined in this paper, more attention should also be paid on the urban-rural disparity in residents’ health condition and its improvement. This effort not only have great potential to alleviate urban-rural inequality in the health field but also provide a novel perspective for better understanding the regional disparity of public health, its changing geography, and spatially heterogeneous driving factors.


