Abstract
The compressor of closed Brayton cycle (CBC) plant operating with working fluid other than air is a vital element of the energy conversion unit. However, due to insufficient understanding of the influence of the physical properties of working fluids on the performance of the compressor, the actual working conditions and design conditions of the compressor’s performance deviate greatly. In this paper, the objective is to analyze the influence mechanism of the physical properties on the performance of the cascade of compressor (static pressure ratio and total pressure loss coefficient). Therefore, the impact of a specific heat ratio on the performance of the compressor cascade is studied utilizing carbon dioxide (γ = 1.29), air and carbon monoxide (γ = 1.4), argon and helium (γ = 1.667). Moreover, the relationships of static pressure ratio and total pressure loss coefficient with physical properties of the working fluids are analyzed in the compressor cascade. It is established that a higher specific heat ratio fluid gives a higher coefficient of total pressure loss and static pressure ratio in contrast to smaller specific heat ratio at matching inlet Reynolds number and Mach number.
1. Introduction
Nowadays, the issues of environmental pollution and energy shortage have become two key problems restricting the progress of human society [1]. The closed Brayton cycle system has an inherent characteristic of the diversity of heat source selection and the recyclability of discharged waste. It delivers a reasonable answer to above-mentioned glitches of environmental pollution and energy shortage [2,3]. Closed Brayton cycle system has the capability to use all available heat sources together with natural gas, oil and coal in addition to clean energy, such as nuclear energy, solar energy and metal fuel as heat sources [4]. As it is a closed cycle, heat source products do not have any effects on the cycle. Therefore, even if fossil fuel is used, its emissions can still reach a low level through centralized treatment [5,6]. In view of the above advantages, the closed Brayton cycle becomes an important option for future energy utilization [7,8,9].
In closed cycle systems, an alternate working fluid such as carbon dioxide and inert gases are common working fluids options, which have obvious advantages over the air in terms of corrosion resistance and power density. Certainly, the difference of working fluids will affect the performance of compressors. During initial research, it is considered that the physical properties of the working fluids such as Rg and heat capacity ratio γ can be part of corrected mass flow rate and corrected speed. Accordingly, the design criteria of the air compressor can be applied to carbon dioxide or inert gases compressor. However, based on the similarity criterion, one can observe that the heat capacity ratio is separate from the similarity condition. It has a visible influence on compressor characteristics. It is an essential factor that reflects physical property differences of different working fluids [10]. Thus, the performance curves of theair compressor cannot be used for other alternative fluids. The performance reduction of 50-MW EVO [11] German power plant is due to the wrong compressor performance analysis. The influence of this problem is also obvious in the research and development of carbon dioxide compressor. The experimental research on the CO2 compressor was conducted by Sandia laboratory in the United States [12] and Tokyo University of Technology [13,14] in Japan. The CO2 compressor did not achieve the expected efficiency due to the above-mentioned problem of the variation of physical properties of the working fluids.
After nearly a hundred years of development, a set of design criteria, design experience and reference data for air compressor design have been established through experiments. It is time-consuming and not an economical job to conduct a lot of experiments on alternate working fluid compressors, re-establish design criteria and gather design experience. Therefore, designing a special working fluid compressor with reference to the design criteria of air the compressor has become an important research topic. In order to create a compatible performance transfer method, Roberts highlighted that the compressor curve changes with dissimilar working fluid because of the disparity in specific heat ratio [15,16]. Zhu et al. similarity criteria were derived using non dimensionless differential equations and similarity comparisons [17,18]. He believes that the similarity standards of dissimilar working fluids may be Pr, Re, Sr, Eu, Pe, γ and Br. Air compressor characteristic charts are founded on empirical relationships based on similarity principles. Eu and Re are more accurate than the empirical relationship founded on universal similarity principles such as Ma and Re as specific heat ratio in Eu is self-contained. Chen and Jiang linked the stream features of air and helium at dissimilar Mach numbers [19]. They believe that air and helium specific heat ratios has an important effect in increasing Mach number. The flow variance increases as Mach number increases.
Changes in the turbomachine characteristic with the change in specific heat ratio were analyzed by many scientists; so far, the analysis of the working fluid influence on characteristics of the compressor has not been logical and the influence of working fluid characteristics on the compressor stall has not been reported in the literature. It is necessary to study the impact of physical properties on compressor cascade characteristics because most of the experiments on air compressors are conducted utilizing cascades. In this paper, the impact of working fluid physical properties on subsonic axial compressor cascade performance is investigated by means of theoretic analysis and computational validation. The objective is to analyze the relationships of coefficient of total pressure loss and static pressure ratio in the compressor cascade with the alternate working fluids.
2. Theoretical Analysis
The physical properties of working fluid are significant factors affecting the compressor performance. For subsonic compressor cascades, coefficient of total pressure loss and static pressure ratio are considered as important indexes in order to judge compressor cascades performance. To have further understanding of the influence of physical properties of working fluid on performances of the subsonic compressor cascade, the theoretical analysis method will be used in this section to establish the relationship of physical properties with the coefficient of total pressure loss and static pressure ratio in compressor cascade.
The flow in the compressor cascade may be considered as one-dimensional (1D) steady flow. For one-dimensional steady flow, the continuity equation can be written as follows:
The flow in compressor cascade can be almost adiabatic, so the Bernoulli equation becomes:
The energy equation becomes:
The logarithmic differential of the equation of state can be obtained as follows:
According to the definition of Mach number:
Equation (5) can also be written as:
And:
From Equations (1)–(4), (6) and (7), the Equations can be obtained as:
Static pressure ratio and coefficient of total pressure loss can be written as:
With the use of different working fluids in same cascade, the relationship of total pressure loss coefficient becomes:
The friction factor f is related to the Reynolds number and the roughness of the compressor cascade. Once Reynolds numbers of two working fluids are equal, Equation (12) can be written as:
From Equations (9)–(11), Equation (9) can be obtained as:
When different working fluids used in the same compressor cascade, the relationship between static pressure ratio becomes:
As shown in Equation (13), compressor cascade coefficient of total pressure loss with working fluid “A” can be acquired when the coefficient of total pressure loss in the compressor cascade with working fluid “B”, heat capacity ratio and Mach numbers of both fluids are already known. Working fluid “A” coefficient of total pressure loss will increase with the increased heat capacity ratio of working fluid “A”.
Static pressure ratio operating with working fluid “A” can be acquired when static pressure ratio and the coefficient of total pressure loss of working fluid “B”, heat capacity ratio of both working fluids and Mach number of both working fluids are already known, as per Equation (15). Static pressure ratio of a compressor operating on working fluid “A” increase with the increase of the heat capacity ratio of working fluid “A” and decrease with the increase in total pressure loss coefficient.
3. Computational Techniques
3.1. Computational Model
The numerical model selected for the analysis in this paper is generated through NACA65-K48 profile having uniform cross-section around the length of the blade. The details are itemized in Table 1.

Table 1.
NACA65-K48-Basic parameters [20].
3.2. Mesh Sensitivity Study
To avoid the effect of outlet and inlet boundary on flow field in cascade, the inlet boundary is fixed at 1.5 of chord length away from leading edge. The outlet boundary is situated at twice the chord length away from trailing edge. In order to save the calculation cost, half of the blade channel is selected, and symmetric boundary conditions are fixed at 50% blade height. The simulation of a blade channel is conducted with periodic interface in horizontal direction. The computational grid is generated using ANSYS ICEM CFD. Cell-centers next to the surfaces are set at y+ < 1. Figure 1 shows representative computational grids of this model.
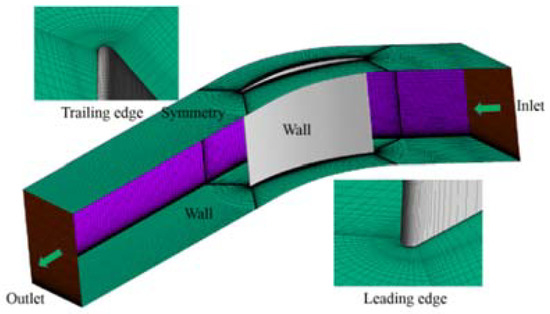
Figure 1.
The NACA65-K48 grid structure.
To avoid the influence of mesh size on the computation, the study of mesh independence is conducted on the numerical model. Four models are numerically simulated using the same outlet pressure with variation in grid points. As shown in Table 2, the change of mass flow and static pressure ratio with a grid number is not obvious within the selected grid number range. Total pressure loss coefficient distribution contours at various grid points, as presented in Figure 2. The variation in total pressure loss coefficient distribution is negligible with a rise in grid points above 1.78 million. As a result, rotor grid points are fixed at approximately 1.78 million.
Table 2.
Results for different grid points.
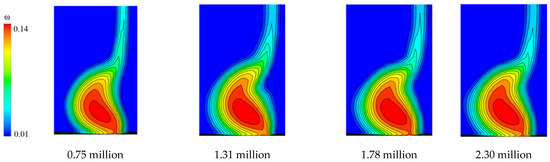
Figure 2.
Contour of total pressure loss coefficient at various grid points.
3.3. Computational Method Authentication
ANSYS-CFX19.2 is used in this paper. Results are obtained with the solution of 3D steady compressible RANS equation and discretizing equation with a finite-volume method. At outlet boundary static pressure is specified. Total pressure and total temperature are given with 5% inlet boundary turbulence intensity. Working fluids utilized for this analysis are fixed as ideal gases. Predicted and experimental static pressure on blade surfaces is shown in Figure 3. SST turbulence model with γ-Reθ turbulence transition model gives a precise calculation of static pressure on blade surfaces in comparison with the calculation results and experimental data [21] using various turbulence models.
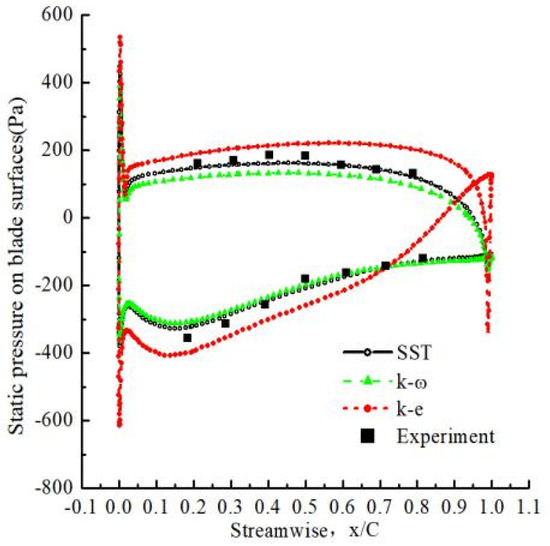
Figure 3.
Predicted and experimental static pressure on blade surfaces for different turbulence models.
4. Performance Analysis
To analyze the influence of physical properties of working fluid on compressor cascade performance, the identical values of Reynolds number and Mach number are set at inlet of compressor cascade using dissimilar fluids in numerical simulation. Figure 4 displays the distribution of total pressure loss coefficient along blade height at the compressor cascade outlet operating with dissimilar working fluids. When heat capacity ratio of working fluid is identical, total pressure loss coefficient after passing through compressor is also identical and when the heat capacity ratio of working fluid is different, working fluid total pressure loss coefficient changes with the change in a specific heat ratio. The results of the numerical simulation prove that the physical property that affects the coefficient of total pressure loss in a cascade is the heat capacity ratio once the Reynolds number and Mach number of different working fluids are identical.
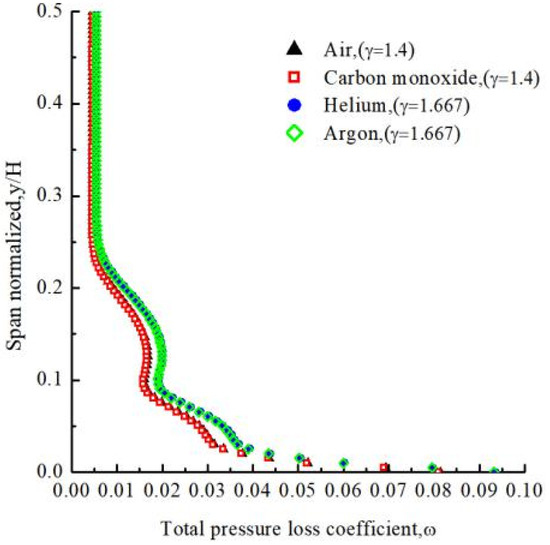
Figure 4.
Distribution of coefficient of total pressure loss with different working fluids.
Figure 5 indicates compressor cascade static pressure ratio using dissimilar working fluids. The difference of static pressure ratio of working fluid with same value of specific heat ratio is very small. Relative error is less than 1%. Then, a specific heat ratio of the working fluid is the main physical property that affects the static pressure ratio of compressor cascade when the Reynolds number and Mach number of working fluid are the same.
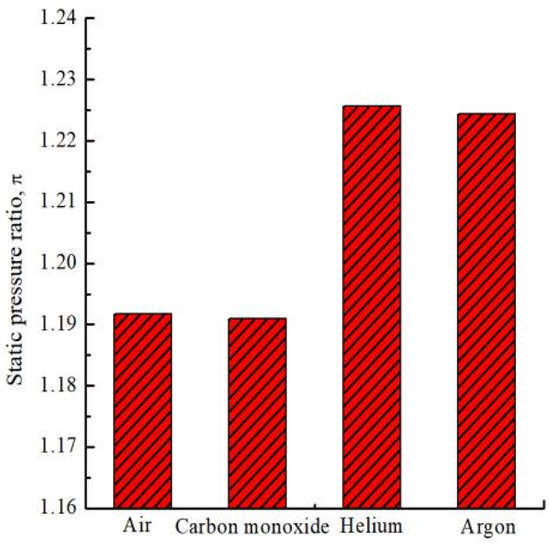
Figure 5.
Static pressure ratio using dissimilar fluids.
Figure 6 displays static pressure coefficient distribution of compressor cascade with air and carbon monoxide. The static pressure coefficient is as follows:
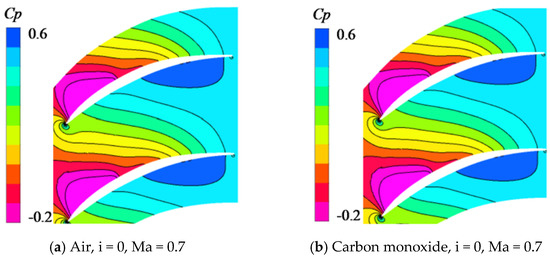
Figure 6.
Static pressure coefficient (Cp) distribution at 98% span.
As shown in Figure 6, if the specific heat ratio, Reynolds number and Mach number of compressor inlet are equal, the static pressure coefficient distribution of the two types of working fluid will be the same, which also proves the conclusion reflected in Figure 5.
4.1. Effect of Physical Properties on Coefficient of Total Pressure Loss
The correlation of the coefficient of total pressure loss and specific heat ratio at matching Reynolds number and Mach number is presented in Figure 7. Compressor cascade using higher heat ratio working fluid has a greater coefficient of total pressure loss. Helium’s coefficient of total pressure loss and carbon dioxide is calculated using Equation (13) as the coefficient of total pressure loss of air is known. Relative prediction error is less than 5%, which is enough to meet the engineering demand. Mach number and Reynolds number also have an important effect on compressor cascade total pressure loss. As presented in Figure 7, the coefficient of total pressure loss of compressor cascade increases significantly with the increase of Reynolds number and Mach number. As for the influence of attack angles on the coefficient of total pressure loss, the coefficient of total pressure loss of compressor cascade first decreases and then increases with the increase of attack angle and has minimum total pressure loss coefficient at −3°attack angles.
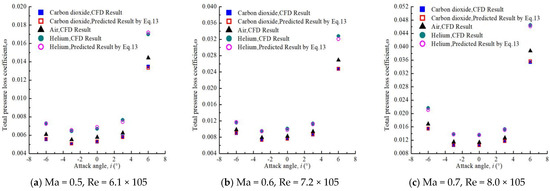
Figure 7.
The correlation among coefficient of total pressure loss and Reynolds number, Mach number, specific heat ratio.
The distribution of the coefficient of total pressure loss over blade height is presented in Figure 8. As shown in Figure 8, at a certain attack angle and Mach number, coefficient of total pressure loss of compressor cascade increases with the increase in specific heat ratio of working fluid in the whole blade height. At identical attack angle, the coefficient of total pressure loss in the compressor cascade increases obviously by Mach number. Moreover, at the same time, on the higher Mach number, the variance in the coefficient of total pressure loss in compressor cascade using dissimilar working fluid is clearly visible. At the range 0%–20% blade height, the energy dissipation is intensified due to the effect of corner separation, it leads to an increase in difference in the coefficient of total pressure loss with different working fluids. To a certain extent, it reflects that fluid specific heat ratio affects total pressure loss by effecting the energy dissipation of working fluid. When different working fluids are used in compressor cascades at similar Mach number, variance of total pressure loss coefficient along blade height increases with an increase in attack angle.
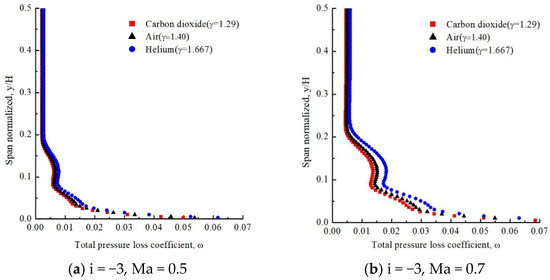
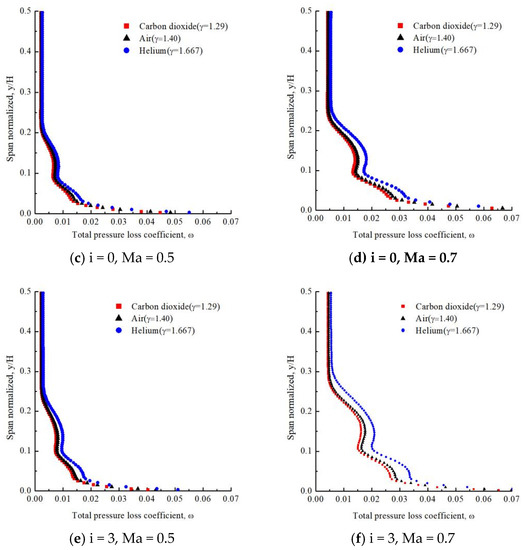
Figure 8.
Distribution of coefficient of total pressure loss over blade height.
Figure 9 shows the contour of coefficient of total pressure loss of compressor cascade with carbon dioxide and helium at a different plane. As shown in Figure 9, in all planes the size and strength of the separation vortices of compressor cascade with helium are higher than carbon dioxide. As a result, total pressure loss coefficient of compressor cascade with helium is significantly higher than carbon dioxide, and the larger the vortex separation scale and intensity are, the more obvious the difference of coefficient of total pressure loss.
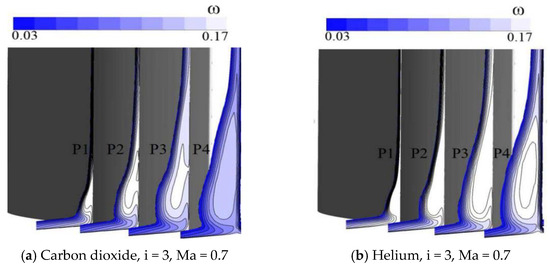
Figure 9.
Contour of coefficient of total pressure loss at different plane.
4.2. Effect of Physical Properties on Static Pressure Ratio
The relationship of specific heat ratio and static pressure ratio on matching Reynolds number and Mach number is presented in Figure 10. The compressor cascade using a higher heat ratio fluid has a higher static pressure ratio. Equation (15) accurately predicts the static pressure ratio of compressor cascade with helium and carbon dioxide. The prediction relative error is less than 8%, which is enough to meet the engineering demand. Mach number and attack angle also have a significant effect on total pressure loss of compressor cascade. Once the attack angle is fixed, compressor cascade static pressure ratio increase with the increase in Mach number. When Mach number is fixed, the static pressure ratio of compressor cascade increases initially and the former decreases with the increase in attack angle. Attack angle at maximum static pressure is 3°. When the attack angle increases to 6°, the decrease of the inlet area caused by the increase of the attack angle is smaller than that instigated by corner separation, which results in a decrease in compressor cascades static pressure ratio.
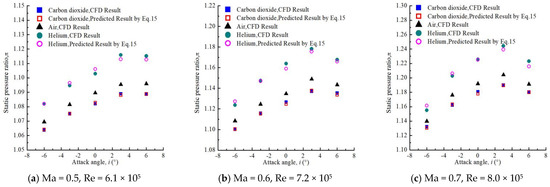
Figure 10.
Static pressure ratio at different attack angles.
The static pressure coefficient and static pressure ratio distribution at 98% span for dissimilar working fluids are presented in Figure 11. The difference of static pressure coefficients at 98% span with different working fluids is not obvious and the difference of static pressure ratio at 98% span with different working fluids is obvious, so it is established that the difference of specific heat ratio is cause of difference in the compressor cascade static pressure ratio with dissimilar fluids.
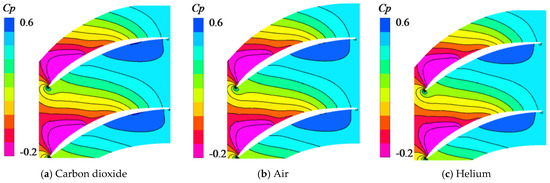
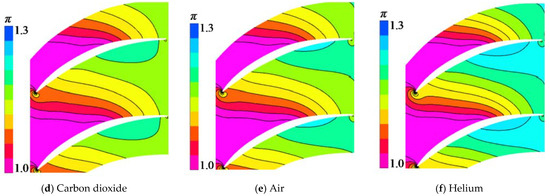
Figure 11.
Static pressure coefficient (Cp) and static pressure ratio (π) distribution at 98% span for dissimilar working fluids (i = 0, Ma = 0.7).
Figure 12 illustrates limiting streamlines of compressor cascade with carbon dioxide and helium on the suction surface. As shown in Figure 12, at the same attack angle, the separation of suction surface of a compressor with carbon dioxide is significantly smaller than that of helium. It happened because the static pressure ratio in the compressor cascade with helium is higher than carbon dioxide, and the larger reverse pressure gradient leads to the larger corner separation. The separation scale of the compressor cascade increases with the increase of attack angle for same working fluid. It happened due to increases in inverse pressure gradient with the increase of attack angle. In view of the above analysis, it can be concluded that physical properties of fluid affect the separation structure of the flow in the compressor cascade by affecting the static pressure ratio of the compressor cascade.
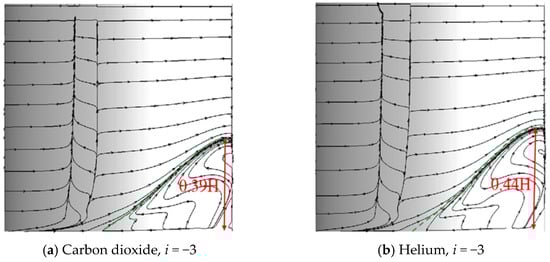
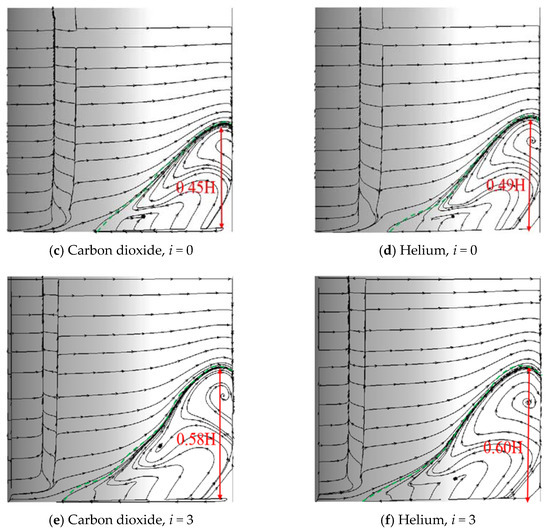
Figure 12.
Representations of suction surface skin-friction lines under different attack angle (Ma = 0.7).
Figure 13 shows the relative position of transition at matching Reynolds number and Mach number. As presented in figure, the transition of working fluid using large specific heat ratio occurs earlier at the same attack angle. Thus, specific heat ratio is also one of the factors inducing transition of working fluid. Therefore, for the same working fluid, the larger the attack angle, the earlier the transition will occur.
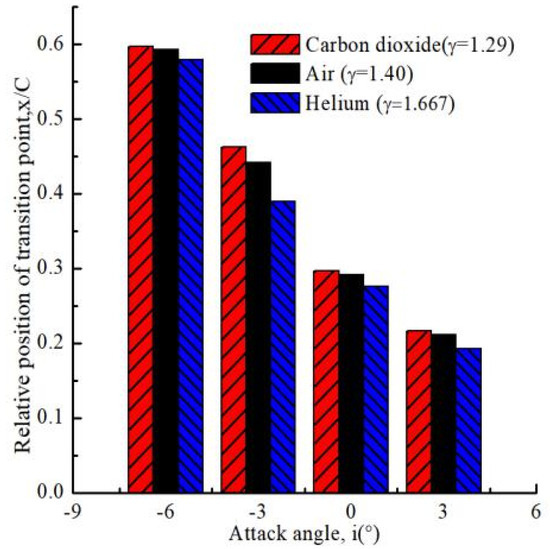
Figure 13.
Relative position of transition at different attack angles (Ma = 0.7, Re = 8.0 × 10⁵).
5. Conclusions
The effect of working fluid physical properties on the performance of a subsonic compressor cascade at a wide span of Mach number, i.e., 0.5–0.7, is studied considering coefficient of total pressure loss and static pressure ratio using theoretical analysis and numerical validation in this paper. The objective is to analyze the relationships of the coefficient of total pressure loss and static pressure ratio in subsonic-speed linear compressor cascade with the physical properties of the alternate working fluids. Successively, theoretic study is validated using comparison of computational and theoretic results. The following conclusions are presented:
- (1)
- Coefficient of total pressure loss is only linked to the specific heat ratio and Mach number of the working fluid at a matching Reynolds number. The greater specific heat ratio working fluid has a greater coefficient of total pressure loss.
- (2)
- Coefficient of total pressure loss increases by the increase of Mach number. Coefficient of total pressure loss of helium and carbon dioxide is calculated using Equation (13) and validated. The relative prediction error is less than 5%, which is enough to meet the engineering demand.
- (3)
- The relationship of compressor cascade static pressure ratio using dissimilar working fluid is governed by specific heat ratio and inlet relative Mach number. Higher specific heat ratio fluid has higher static pressure and variance rises with rise in Mach number.
- (4)
- Equation (15) accurately predicts the cascade static pressure ratio using other fluids. Predictive relative error is less than 8%, which is enough to meet the engineering demand.
- (5)
- When attack angle is fixed, flow separation in compressor cascade depends on adverse pressure gradient. Specific heat ratio and Mach number of working fluid affect flow separation in compressor cascade by influencing static pressure ratio in cascade.
Author Contributions
Conceptualization, Z.T. and Q.Z.; methodology, Z.T. and C.W.; software, Z.T. and Q.Z.; validation, Z.T.; formal analysis, Z.T.; investigation, Z.T.; resources, Z.T.; writing—original draft preparation, Z.T.; writing—review and editing, Q.Z. and C.W.; visualization, Q.Z.; project administration, C.W. All authors have read and agreed to the published version of the manuscript.
Funding
This research was funded by National Natural Science Foundation of China, grant number51476039 and 52006021.
Institutional Review Board Statement
Not applicable.
Informed Consent Statement
Not applicable.
Data Availability Statement
The data used to support the findings of this study are available from the corresponding author upon request.
Conflicts of Interest
The authors declare no conflict of interest.
Nomenclature
| D | Length, m |
| p | Pressure, Pa |
| γ | Specific heat ratio |
| Pr | Prandtl number |
| Br | Brinkman number |
| Pe | Peclet number |
| A | Area, m2 |
| Re | Reynolds number |
| f | Friction factor |
| ω | Total pressure loss coefficient |
| T | Temperature, k |
| π | Pressure ratio |
| ρ | Density, kg/m3 |
| Rg | gas constant, J/(kg*k) |
| V | Velocity, m/s |
| Ma | Mach number |
| Sr | Strouhal number |
| Eu | Euler number |
| Cp | Static pressure coefficient |
| Subscripts | |
| * | Stagnation |
| 1 | Inlet |
| 2 | Outlet |
| A | Working fluid |
| B | Working fluid |
References
- Energy Information Administration. International Energy Outlook 2017; Energy Information Administration: Washington, DC, USA, 2017; pp. 3–143. Available online: https://www.eia.gov/outlooks/ieo/pdf/0484(2017).pdf (accessed on 14 September 2017).
- Behar, O.; Khellaf, A.; Mohammedi, K. A review of studies on central receiver solar thermal power plants. Renew. Sustain. Energy Rev. 2013, 23, 12–39. [Google Scholar] [CrossRef]
- Lee, J.J.; Kang, D.W.; Kim, T.S. Development of a gas turbine performance analysis program and its application. Energy 2011, 36, 5274–5285. [Google Scholar] [CrossRef]
- Anheden, M. Analysis of Gas Turbine Systems for Sustainable Energy Conversion. Ph.D. Thesis, Royal Institute of Technology, Stockholm, Sweden, 2000. [Google Scholar]
- Al-Attab, K.A.; Zainal, Z.A. Externally fired gas turbine technology: A review. Appl. Energy 2015, 138, 474–487. [Google Scholar] [CrossRef]
- Kim, Y.M.; Kim, C.G.; Favrat, D. Transcritical or supercritical CO2 cycles using both low- and high-temperature heat sources. Energy 2012, 43, 402–415. [Google Scholar] [CrossRef]
- Mcdonald, C.F. Helium turbomachinery operating experience from gas turbine power plants and test facilities. Appl. Therm. Eng. 2012, 44, 108–142. [Google Scholar] [CrossRef]
- Wang, Z.G.; Wang, Y.; Zhang, J.Q.; Zhang, B.C. Overview of the key technologies of combined cycle engine precooling systems and the advanced applications of micro-channel heat transfer. Aerosp. Sci. Technol. 2014, 39, 31–39. [Google Scholar] [CrossRef]
- Ahn, Y.; Bae, S.J.; Kim, M.; Cho, S.K.; Baik, S.; Lee, J.I.; Cha, J.E. Review of supercritical CO2 power cycle technology and current status of research and development. Nucl. Eng. Technol. 2015, 47, 647–661. [Google Scholar] [CrossRef]
- Tian, Z.; Zheng, Q.; Malik, A.; Jia, X.; Jiang, B. Effect of the specific heat ratio on transonic axial compressor rotor performances. Appl. Therm. Eng. 2019, 148, 307–315. [Google Scholar] [CrossRef]
- Weisbrodt, I.A. Summary Report on Technical Experiences from High Temperature Helium Turbine Testing in Germany; IAEA-TECDOC-899; International Atomic Energy Agency (IAEA): Vienna, Austria, 1994. [Google Scholar]
- Iverson, B.D.; Conboy, T.M.; Pasch, J.J.; Kruizenga, A.M. Supercritical CO2, Brayton cycles for solar-thermal energy. Appl. Energy 2013, 111, 957–970. [Google Scholar] [CrossRef]
- Kato, Y.; Niktawaki, T.; Yoshizawa, Y. A carbon dioxide partial condensation direct cycle for advanced gas cooled fast and thermal reactors. In Proceedings of the Global 2001, Paris, France, 9–13 September 2001; pp. 1–8. [Google Scholar]
- Utamura, M.; Tamaura, Y. A Solar Gas Turbine Cycle with Super-Critical Carbon Dioxide as a Working Fluid. In ASME Turbo Expo 2006: Power for Land, Sea, and Air; ASME: New York, NY, USA, 2006; pp. 329–335. [Google Scholar]
- Stephen, K.R.; Steen, A.S. Effect of the specific heat ratio on the aerodynamic performance of turbomachinery. J. Eng. Gas Turbbines Power 2005, 127, 773–780. [Google Scholar]
- Stephen, K.R.; Steen, A.S. Semi-closed cycle O2/CO2 combustion gas turbines: Influence of fluid properties on the aerodynamic performance of the turbomachinery. In ASME Turbo Expo 2002: Power for Land, Sea, and Air; ASME: New York, NY, USA, 2002; pp. 663–673. [Google Scholar]
- Zhu, R.K.; Zhang, J.; Zheng, Q.; ZOU, J.G. A study of similarity problems concerning the working media helium and air in an axial-flow compressor. J. Eng. Therm. Energy Power 2008, 23, 595–600. [Google Scholar]
- Zhu, R.; Zheng, Q.; Yue, G.; Zou, J. Researches of similitude theory for axial flow helium compressor. In ASME Turbo Expo 2008: Power for Land, Sea, and Air; ASME: New York, NY, USA, 2008; pp. 247–254. [Google Scholar]
- Jiang, B.; Chen, Z.; Chen, H.; Zhang, H.; Zheng, Q. Similarity and cascade flow characteristics of a highly loaded helium compressor. Nucl. Eng. Des. 2015, 286, 286–296. [Google Scholar] [CrossRef]
- Lu, H.; Yang, Y.; Guo, S.; Pang, W.; Yang, F.; Zhong, J. Control of corner separation via dimpled surface for a highly loaded compressor cascade under different inlet Mach number. Aerosp. Sci. Technol. 2019, 85, 48–60. [Google Scholar] [CrossRef]
- Zhitao, T. Research on the Performance and Design Method of Helium Compressor. Ph.D. Thesis, Harbin Engineering University, Harbin, China, 2019. [Google Scholar]
Publisher’s Note: MDPI stays neutral with regard to jurisdictional claims in published maps and institutional affiliations. |
© 2021 by the authors. Licensee MDPI, Basel, Switzerland. This article is an open access article distributed under the terms and conditions of the Creative Commons Attribution (CC BY) license (http://creativecommons.org/licenses/by/4.0/).