Article

The Changes of Leaf Reflectance Spectrum and Leaf Functional Traits of Osmanthus fragrans Are Related to the Parasitism of Cuscuta japonica

1
Research Center for Urban Forestry, Key Laboratory for Forest Silviculture and Conservation of Ministry of Education, Key Laboratory for Silviculture and Forest Ecosystem Research in Arid- and Semi-arid Region of State Forestry Administration, Beijing Forestry University, Beijing 100083, China
2
College of Forestry, Guangxi University, Nanning 530005, China
*
Authors to whom correspondence should be addressed.
Appl. Sci. 2021, 11(4), 1937; https://doi.org/10.3390/app11041937
Submission received: 1 February 2021 / Revised: 14 February 2021 / Accepted: 15 February 2021 / Published: 23 February 2021

Abstract

:
Studies on the influence of parasitism on plants based on hyperspectral analysis have not been reported so far. To fully understand the variation characteristics and laws of leaf reflectance spectrum and functional traits after the urban plant parasitized by Cuscuta japonica Choisy. Osmanthus fragrans (Thunb.) Lour. was taken as the research object to analyze the spectral reflectance and functional traits characteristics at different parasitical stages. Results showed that the spectral reflectance was higher than those being parasitized in the visible and near-infrared range. The spectral reflectance in 750~1400 nm was the sensitive range of spectral response of host plant to parasitic infection, which is universal at different parasitic stages. We established a chlorophyll inversion model (y = −65913.323x + 9.783, R2 = 0.6888) based on the reflectance of red valley, which can be used for chlorophyll content of the parasitic Osmanthus fragrans. There was a significant correlation between spectral parameters and chlorophyll content index. Through the change of spectral parameters, we can predict the chlorophyll content of Osmanthus fragrans under different parasitic degrees. After being parasitized, the leaf functional traits of host plant were generally characterized by large leaf thickness, small leaf area, small specific leaf area, low relative chlorophyll content, high leaf dry matter content and high leaf tissue density. These findings indicate that the host plant have adopted a certain trade-off strategy to maintain their growth in the invasion environment of parasitic plants. Therefore, we suspect that the leaf economics spectrum may also exist in the parasitic environment, and there was a general trend toward the “slow investment-return” type in the global leaf economics spectrum.

1. Introduction

Parasitic plants are one of the special groups commonly existing in the global ecosystems [1,2,3]. The common parasitic plants include Taxillidae, Mistletoe and Cuscutaceae [4,5]. Among them, Cuscutaceae is one of the most common parasitic plant species in China, and Cuscuta japonica Choisy is widely distributed [6]. Cuscuta japonica Choisy is seriously short of chlorophyll and other important substances to maintain its photosynthesis due to the degradation of its roots and leaves [6,7]. It usually parasitizes the root and stem of the host plant through its special root absorption, and relies on absorbing carbohydrates, inorganic salts and water from the host to maintain its survival, growth and reproduction [8]. Studies have shown that the host range of Cuscuta Japonica Choisy is quite wide, and the vast majority of herbaceous dicotyledonous and monotyledonous plants may become parasitic objects of Cuscuta japonica Choisy. Cuscuta japonica Choisy usually grows in a winding way and spreads rapidly [9,10,11]. Moreover, when the damage is aggravated, the whole host plant is often covered with the stem strips of Cuscuta japonica Choisy, causing the host plant to grow poorly and even causing the whole host plant to die [11]. Therefore, parasitic plants are one of the important factors that harm urban greening plants and threaten the urban environment seriously. Research on Cuscuta japonica Choisy parasitism mainly focuses on its own biological and ecological characteristics and its effects on photosynthetic physiology and ecosystem of parasitic objects [11,12,13]. For example, Beifen Yang et al. study the effects of Cuscuta japonica Choisy parasitism on the growth and reproduction of Solidago canadensis L. Sumin Guo et al. study the growth trade-off mechanism of Alternanthera philoxeroides (Mart.) Griseb. on Cuscuta japonica Choisy parasitism [14,15]. All of these indicate that the host plants often change their growth defense strategies to maintain their own survival and reproduction after being subjected to Cuscuta japonica Choisy parasitism stress. Also, many studies have shown that there are many uncertainties in the impact of parasitic plants on the biomass of the community in which they live, which are often affected by the characteristics of the communities themselves, external environment and other factors [16,17,18]. Osmanthus fragrans Lour., one of the most common tree species in China, plays an important role in the city’s main ecological, cultural and landscape functions. However, the parasitism of Cuscuta japonica Choisy seriously hinders the normal growth of Osmanthus fragrans. Health diagnosis, monitoring and early warning of urban trees have always been a hot spot in international urban forestry research. Therefore, how to monitor and obtain the growth status and the infringed status of the damaged vegetation is the key to effectively prevent and control the infringement.
In recent years, with the rapid development of hyperspectral technology, it has been widely used in forestry monitoring. Hyperspectral data has the advantages of high resolution, abundant information and simple data acquisition [19,20]. Different plants have different reflection spectral characteristics, and the same plant has different reflection spectral characteristics under different growth stages conditions [21,22]. Such spectral characteristics vary depending on the type of plant, the growth stage, the chlorophyll content, and the health status (whether or not it is affected by diseases, insect pests or parasitic plants) [21,22,23,24]. Plant functional traits refer to a series of internal physiological functions and external morphological characteristics gradually formed during the long-term interaction between plants and environmental factors, thus avoiding and reducing the adverse effects of the environment on them to the greatest extent [25]. In 2004, Wright et al. put forward the concept of leaf economics spectrum (LES) for the first time by analyzing the correlation between leaf functional traits. LES is the general internal relationship among functional traits of leaves [26,27]. Leaf functional traits can objectively reflect the influence of environmental changes on plants and the adaptability of plants to the environment [27,28,29]. Therefore, we speculate that leaf functional traits can also be used to diagnose the relationship between biological interactions. At the same time, spectral remote sensing technology and the change information of plant spectral characteristics can provide a reliable basis for large-scale monitoring of pests and diseases. Related researches based on forestry hyperspectral mainly focuses on plant yield, crop seed vigor, plant diseases, plant feature extraction and so on [29,30,31,32,33,34]. However, there are few studies on the response of plant leaf functional traits and leaf spectral characteristics to parasitic plant invasion.
As plants are harmed by parasitic plants, they will grow badly or even die within a certain period time [31,35,36]. Therefore, how to monitor and acquire the growth status and the invasion of the damaged vegetation is the key to effectively control parasitic diseases. To fully understand the changing characteristics and laws of leaf reflectance and leaf functional traits of host plants after being parasitized, and further explore the response mechanism of leaf reflectance spectrum and plant traits to plant-parasitic stress. In this study, Osmanthus fragrans Lour., a typical greening tree species in China, was taken as the research object. Spectral reflectance characteristics and leaf functional traits of Osmanthus fragrans leaves before and after being parasitized by Cuscuta japonica Choisy and different parasitic areas were analyzed, and sensitive bands of Osmanthus fragrans response to parasitic stress were obtained. The results provide a reference for the monitoring and early warning of the parasitism of Cuscuta japonica Choisy. At the same time, it provides a new experimental basis for different measures to control Cuscuta japonica Choisy and provides a theoretical basis for an in-depth understanding of the parasitic damage mechanism of Cuscuta japonica Choisy and its control strategies.

2. Material and Methods

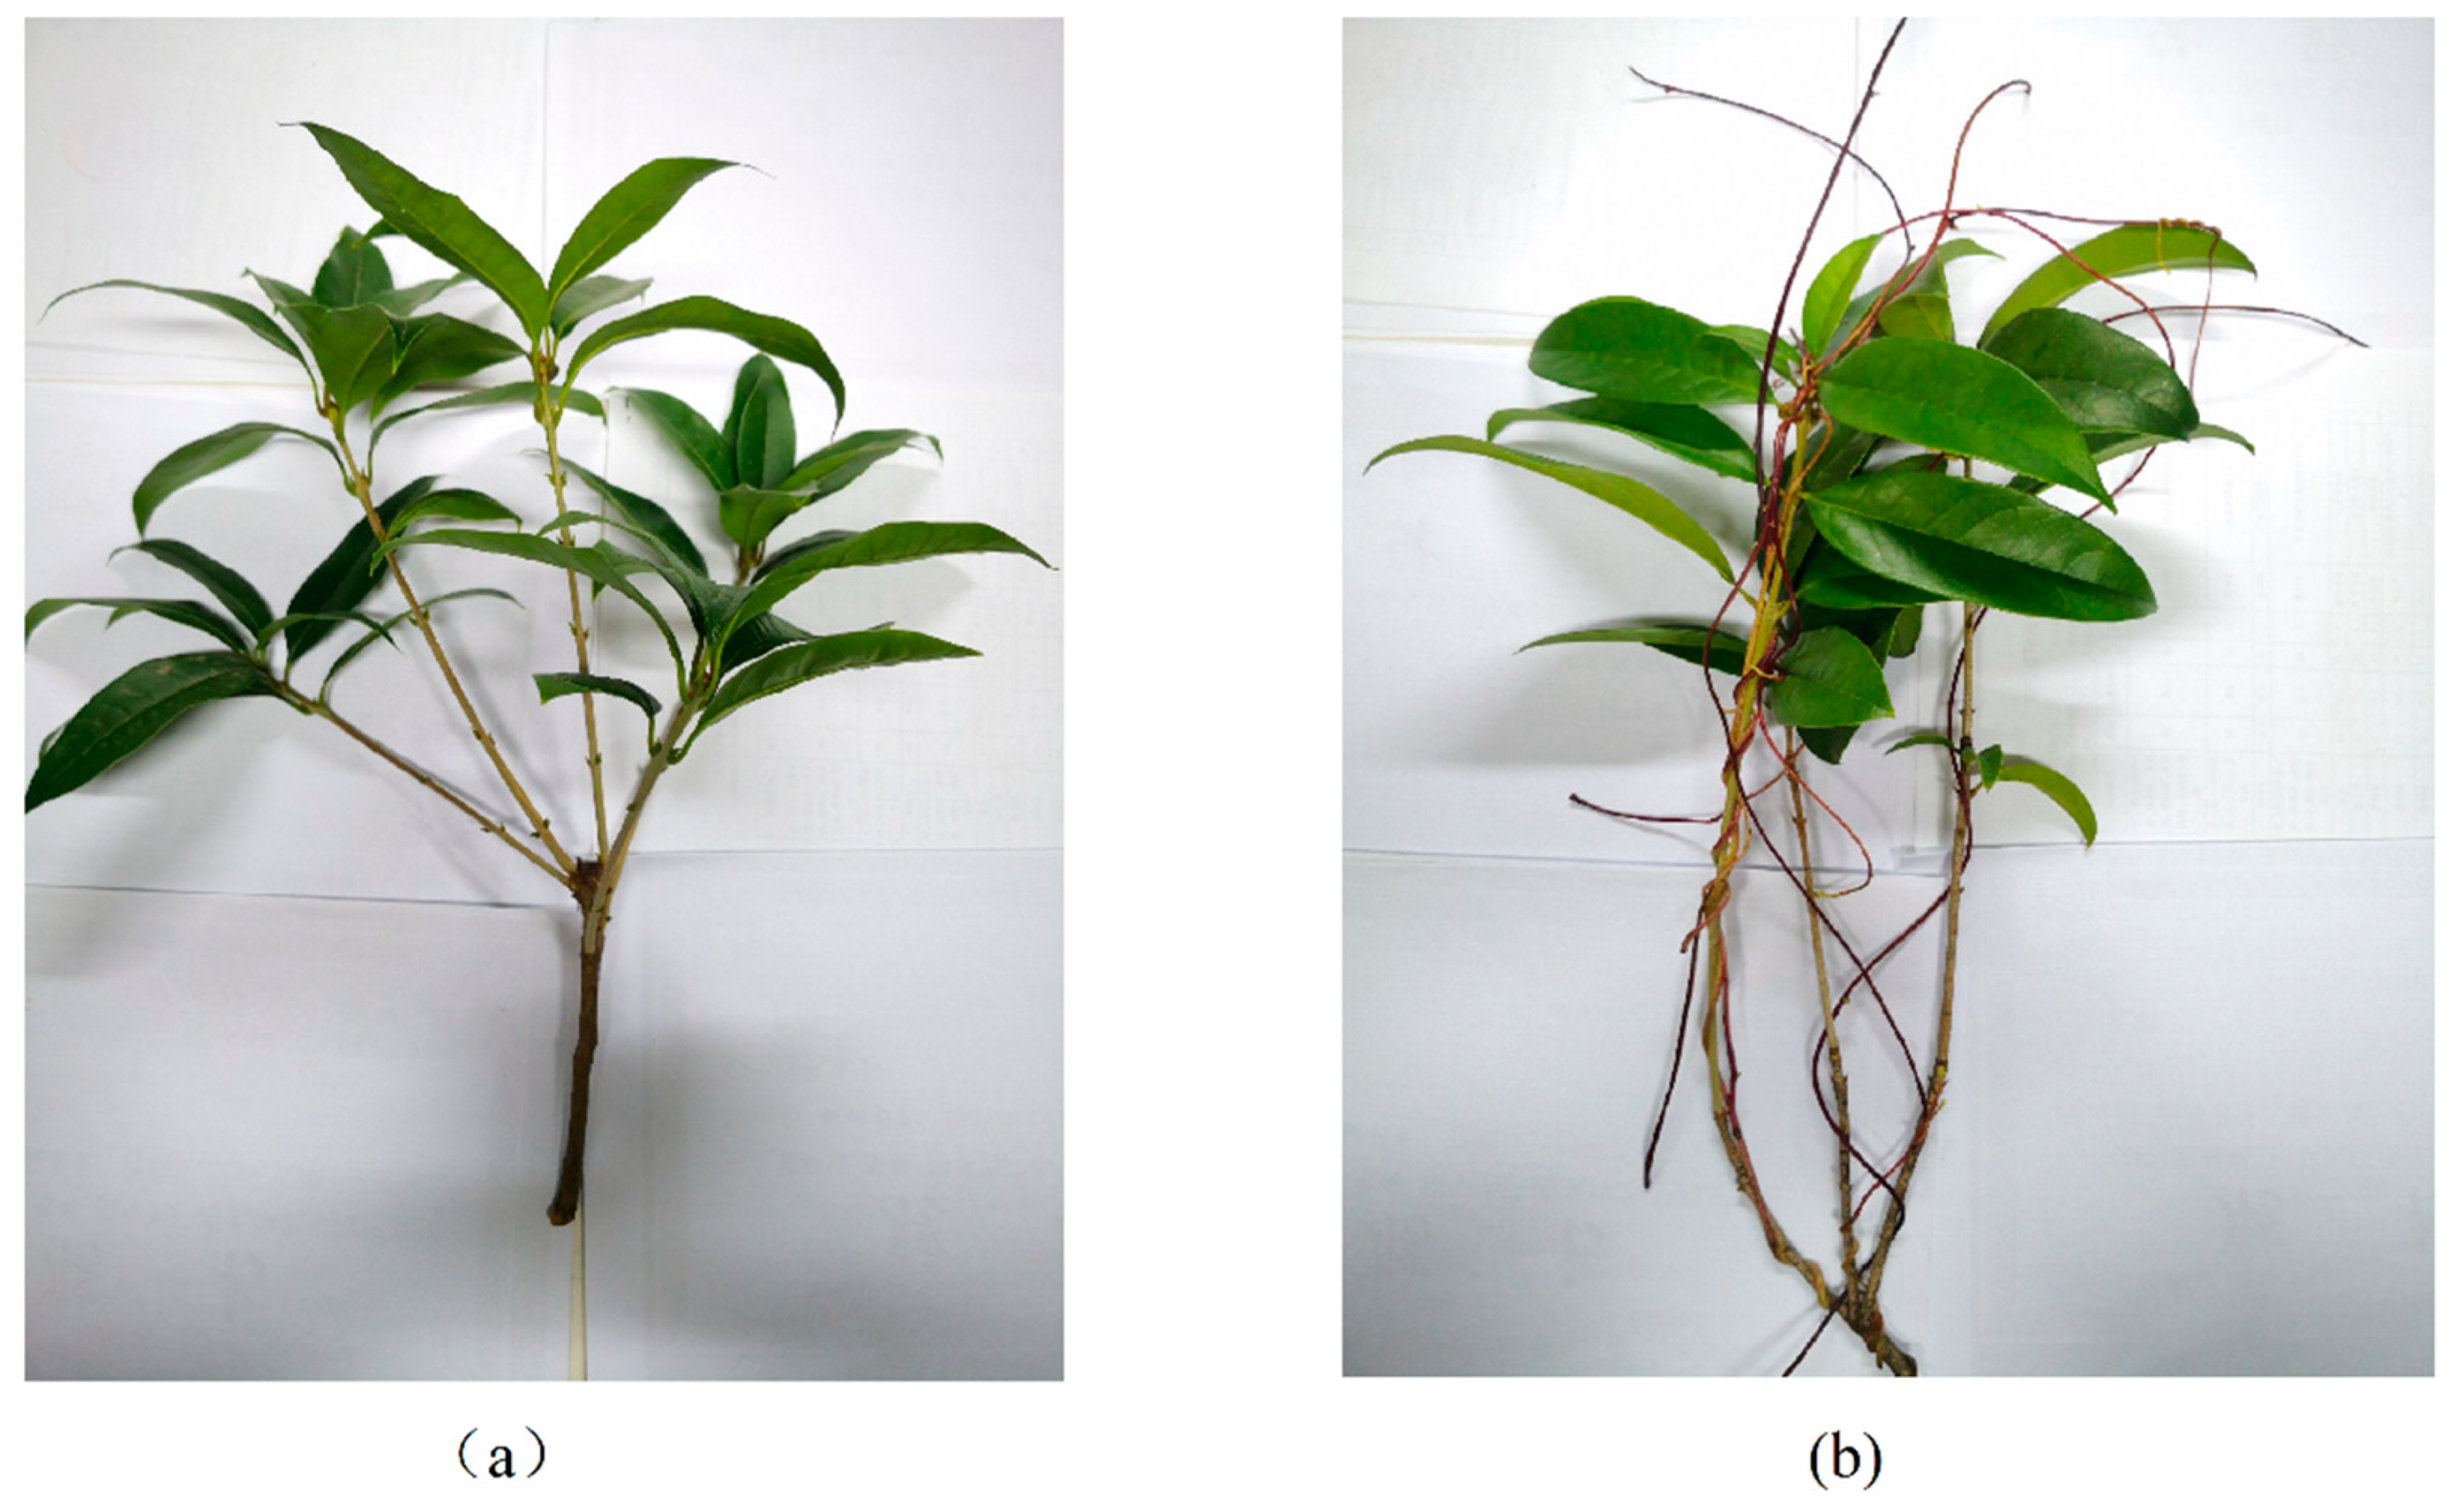
2.1. Research Area and Sample Collection

Nanning city is located in the southwest of Guangxi province, between 107°45′–108°51′ east longitude and 22°13′–23°32′ north latitude. It is a humid subtropical monsoon climate with abundant sunshine and rainfall all year round. The annual average temperature is about 21.6 °C, the annual average rainfall is 1304.2 mm, and the average relative humidity is 79% (Quoted from https://baike.baidu.com (accessed on 15 April 2020)). The sampling area are located on the campuses of Guangxi University, Guangxi Finance and Economics University, and Guangxi Nationalities University. The straight-line distance of the three sites are about 8 km, which belongs to community-based environment, ensuring the relative consistency of atmosphere, planting, maintenance and management conditions. According to the proportion of the parasitic area of Cuscuta japonica Choisy to the crown area of the host plant, it was divided into four parasitic degrees (CK—Without parasitic, T1—Initial parasitism: less than 50%, T2—Parasitic metaphase: 50%~80%, T3—Late parasitism: more than 80%). Healthy growing 30 Osmanthus fragrans of 15~20 years old were selected, and the planting location was away from the influence of tall buildings and tall trees. Leaf samples were collected from 10: 00 a.m. to 12: 00 a.m. on June 2019. Ten mature and healthy leaves were cut from each tree, placed in an icebox and immediately brought back to the laboratory for spectral determination. The time from leaf collection to spectral measurement was controlled within 15 min, thus ensuring the original growth activity of leaf samples. As shown in Figure 1, Figure 1a is a plant that is not parasitic and Figure 1b is a plant that is parasitic by Cuscuta japonica Choisy. Professor Wei Jiguang from Agricultural College of Guangxi University identified the plants and plant diseases involved in this study.

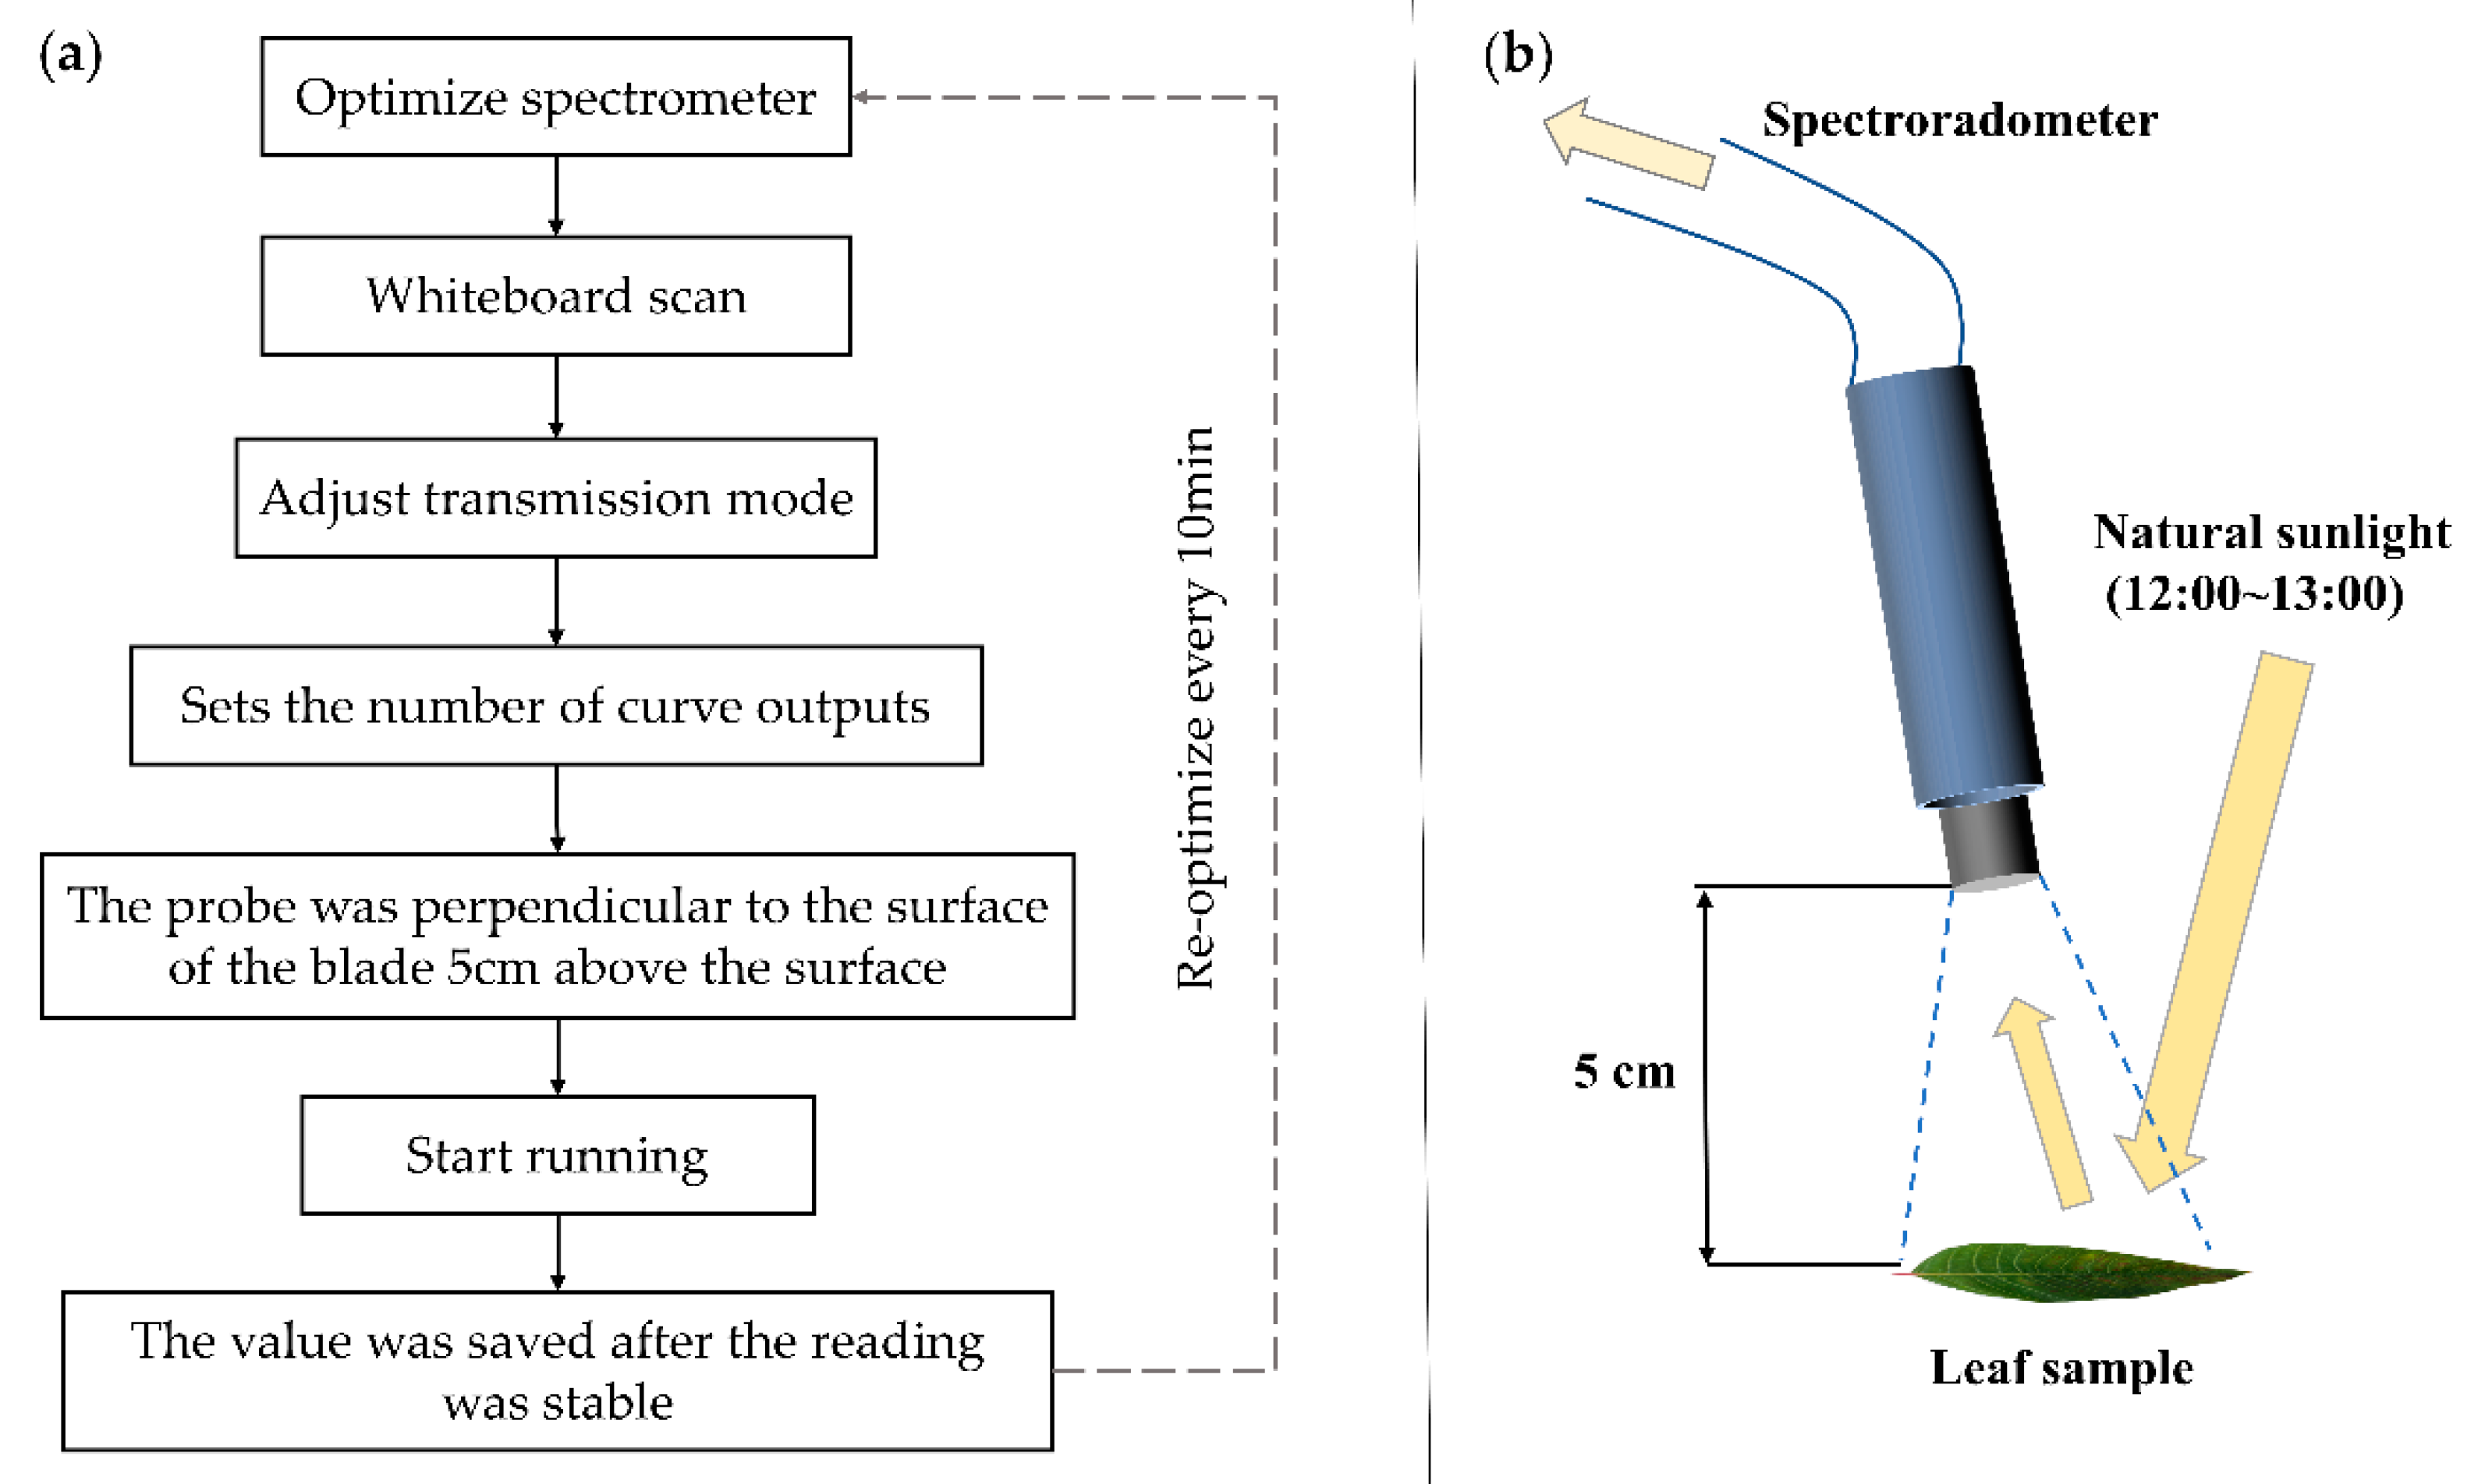
2.2. Leaf Reflectance Spectrum Collection and Calculation Method of Leaf Functional Traits

The FieldSpec3 near-infrared spectrometer (ASD, Almero, Netherlands, USA) was used to collect spectral data. The spectral band obtained by this instrument ranges from 300 nm to 2500 nm. The reflectivity curve of the final output spectrum is the average value of 10 repetitions. The flow chart of spectral measurement is shown in Figure 2. The light source is the solar light source at 12: 00–13: 00. Whiteboard is made of sintered polytetrafluoroethylene-based material. In order to reduce human interference, instrument operators wear cotton overalls.
In July, 2019, 30 Osmanthus fragrans with different degrees of damage were selected at each test site, and thirty mature and healthy leaves were randomly collected from each plant during 9:00–12:00 in fine weather. The relative chlorophyll content index (CCI) was measured by CCM-200 plus chlorophyll meter (OPTI-Science, Massachusetts, USA). The instrument is recalibrated once every 15 min. Use FA/JA electronic balance (Changzhou Xingyun Electronic Equipment Co., Ltd., Changzhou, China) to weigh the fresh weight of leaves (LFW, g). Leaf thickness (LT, mm) was measured by CD-15AX caliper rule (Mitutoyo, Shanghai, China). The leaf area (LA, cm2) was measured by a DS-310/360W scanner (Epson (China) co., ltd, Beijing, China), and then put into 9030A electric constant temperature air-blowing drying oven (Yiheng, Shanghai, China), the temperature was 60 °C, and the leaf dry weight (LDW, g) was weighed by FA/JA electronic balance.
Specific leaf area (SLA, m2/g) = LA/LDW
Leaf   volume   ( LV ,   cm 3 )   =   LT   ×   LA
Leaf tissue density (LTD, g/cm3) = LDW/LV
Leaf dry matter content (LDMC, g/g) = LDW/LFW
As shown in Table 1, we selected 8 typical spectral characteristic parameters of plants [37,38,39], including the slope of red edge (RES), the position of red edge (REP), the reflectance of red valley (RRV), the reflectance of green peak (RGP), the position of green peak (GPP), the reflectance of water stress band (RWSB), the slope of yellow edge (YES), the position of yellow edge (YEP).

2.3. Data Analysis

Analysis and processing of spectral data were based on ViewSpecPro 6.0 software. We use ViewSpecPro software to analyze the original spectral data and the first-order differential spectral data. Leaf functional traits data processing was based on origin2019b software and Excel 2020 software.

3. Results and Discussion

3.1. Changes in Leaf Functional Traits of Osmanthus Fragrans Leaves Parasitized by Cuscuta japonica Choisy

In this study, six plant functional traits that are sensitive to environmental changes and external stress were selected, including chlorophyll content, leaf area, leaf thickness, specific leaf area, leaf dry matter content and leaf tissue density. As shown in Figure 3, there were significant differences in leaf functional traits of Osmanthus fragrans between healthy leaves and the leaves being parasitic by Cuscuta japonica Choisy. The chlorophyll content index, leaf area and specific leaf area of Osmanthus fragrans were significantly lower than those after parasitism, and these indexes gradually decreased (CK > T1 > T2 > T3) with the increase of parasitism intensity. There were significant differences between healthy leaves and parasitic leaves (chlorophyll content index, leaf area and specific leaf area) (Figure 3a,b,e). The reason for the poor growth of Osmanthus fragrans was that Cuscuta japonica plundered water and nutrients of Osmanthus fragrans [40,41,42,43,44]. In addition, due to the overgrowth of the parasitic plant Cuscuta japonica, the host plant lacks sufficient light. It is also an important reason for the decrease of chlorophyll content index, leaf area and specific leaf area in plants. Leaf thickness, dry matter content and leaf tissue density of Osmanthus fragrans were significantly higher than those after parasitism, and these indexes gradually increased with the increase of parasitism intensity (CK < T1 < T2 < T3) (Figure 3c,d,f). In this study, the increase of leaf dry matter content and leaf tissue density was the adjustment of Osmanthus fragrans resources after being parasitized by Cuscuta japonica. This was an ecological strategy for plants to cope with external disturbances, which aims to improve the nutrient preservation and defense ability of leaves by increasing the leaf dry matter content and leaf tissue density.

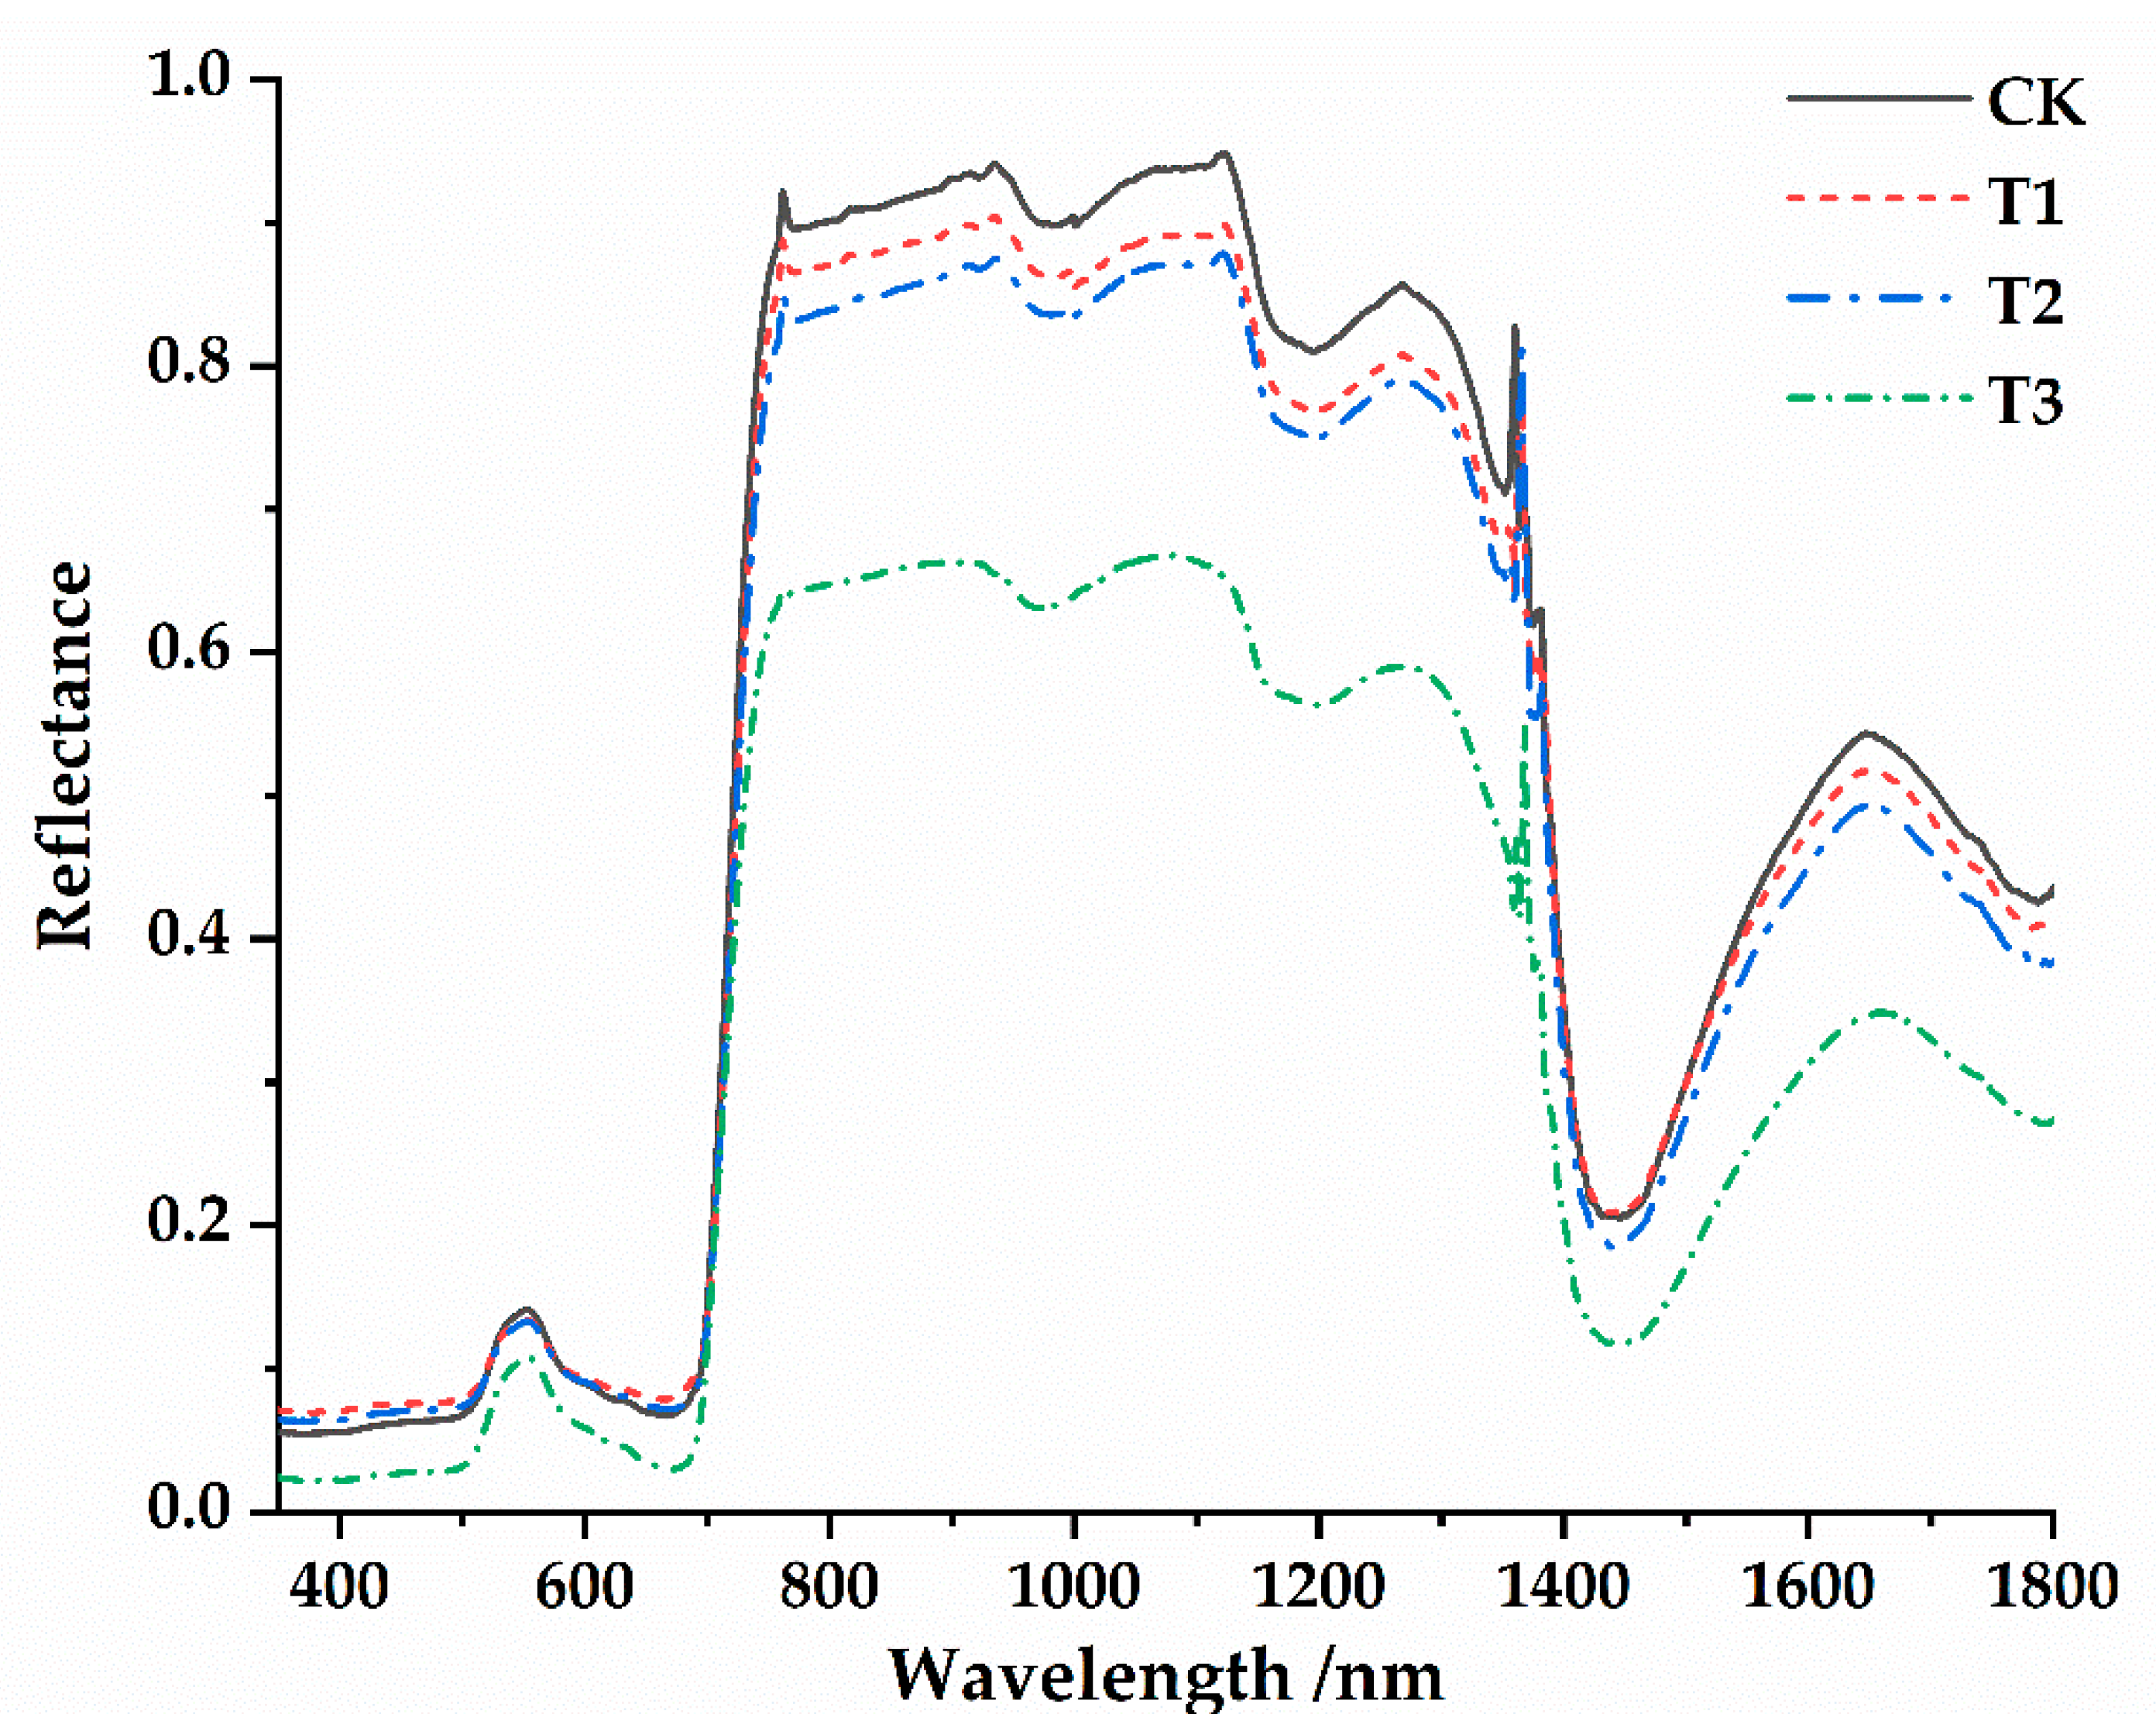
3.2. Spectral Characteristics of Osmanthus Fragrans Leaves under the Different Parasitic Intensity of Cuscuta japonica Choisy

Under different parasitic intensities of Cuscuta japonica Choisy, the leaf surface spectral reflectance curves of Osmanthus fragrans were basically the same, but the spectral reflectance values were significantly different (Figure 4). Spectral reflectance values generally decreasing with the deepening of parasitic intensity, and the reflectance values were CK > T1 > T2 > T3. In the visible light to near-infrared 350~1800 nm band, the spectral reflectance of Osmanthus fragrans leaves under different parasitic intensities was the most easily distinguished in the range of 750~1400 nm, which indicate that this band was the sensitive range of host plants’ spectral response to parasitic infection. At the same time, this change characteristic was common under different parasitic conditions. In addition, the spectral reflectance curve slope of Osmanthus fragrans leaves has a sharp increasing trend in the range of 700~780 nm. In the range of 350~1800 nm, the spectral reflection curves of Osmanthus fragrans leaves for all treatments have four main reflection peaks and five main absorption valleys, and the positions were basically the same. The reflection peaks were located at 560 nm, 1150 nm, 1300 nm and 1650 nm, and the absorption valleys were located at 350–560 nm, 600–700 nm, 950–1050 nm, 1150~1250 nm, and 1400~1500 nm, respectively.
Chlorophyll content index of Osmanthus fragrans gradually decreased with the deepening of parasitism (Figure 3). Previous studies show that chlorophyll content index can better characterize the light reflection curve of plant leaves [31,45]. Therefore, the spectral reflectance curve of the parasitized Osmanthus fragrans leaves was higher than that of the non-parasitized healthy Osmanthus fragrans leaves, which may be related to the decrease of chlorophyll content index. With the deepening of parasitism, the chlorophyll content index gradually decreases, so the absorption of sunlight decreases and the reflectivity increases [46]. Studies have shown that the phenomenon of plants increasing suddenly in this waveband belongs to the typical “red edge effect” characteristic of plants [46]. At the same time, the spectral reflectance of the leaves of the host plant (Osmanthus fragrans) with different relative chlorophyll contents has a higher reflection platform in the range of 750~1400 nm, which was wavy and may be affected by the cell structure of the leaves [46,47]. Among them, the sample with the lowest reflection coefficient was the sample with the lowest chlorophyll content index (the highest parasitic intensity). The reflectance of the sample with the highest chlorophyll content (without parasitism) was the highest at 1150 nm, which was 0.958. There was a significant valley at 1350~1800 nm, which may be closely related to light absorption by water [48,49,50,51].

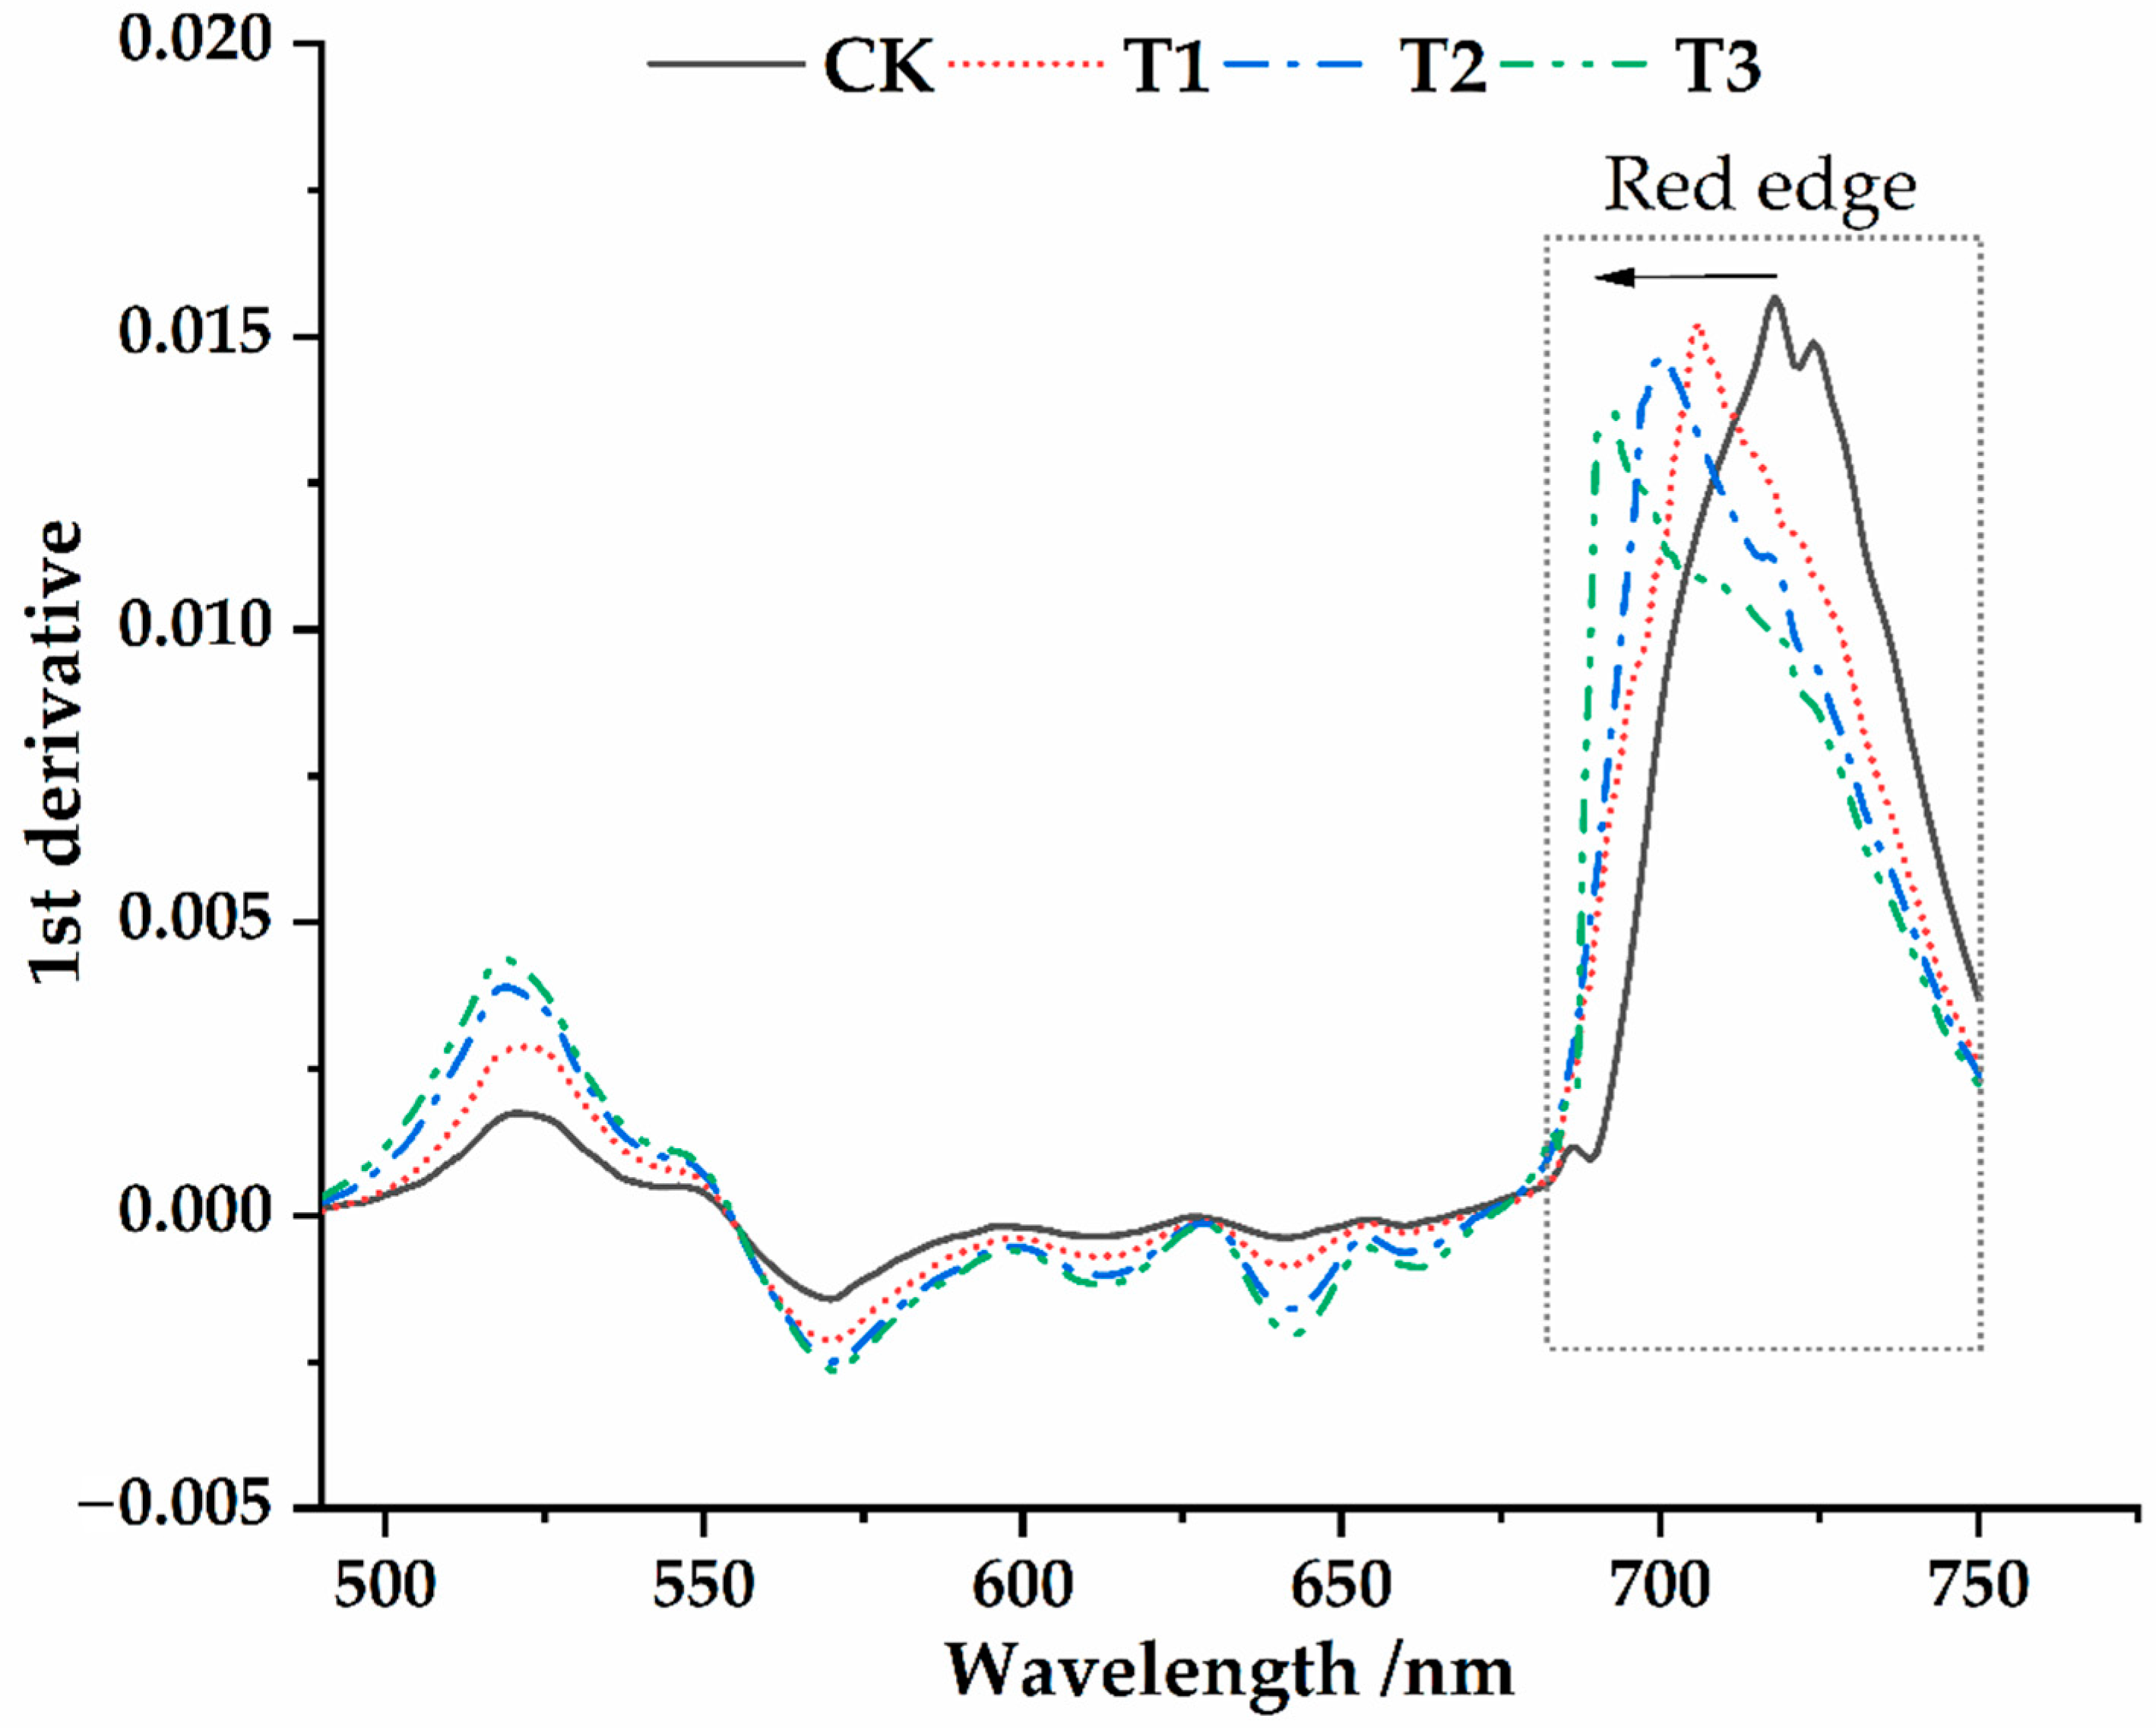
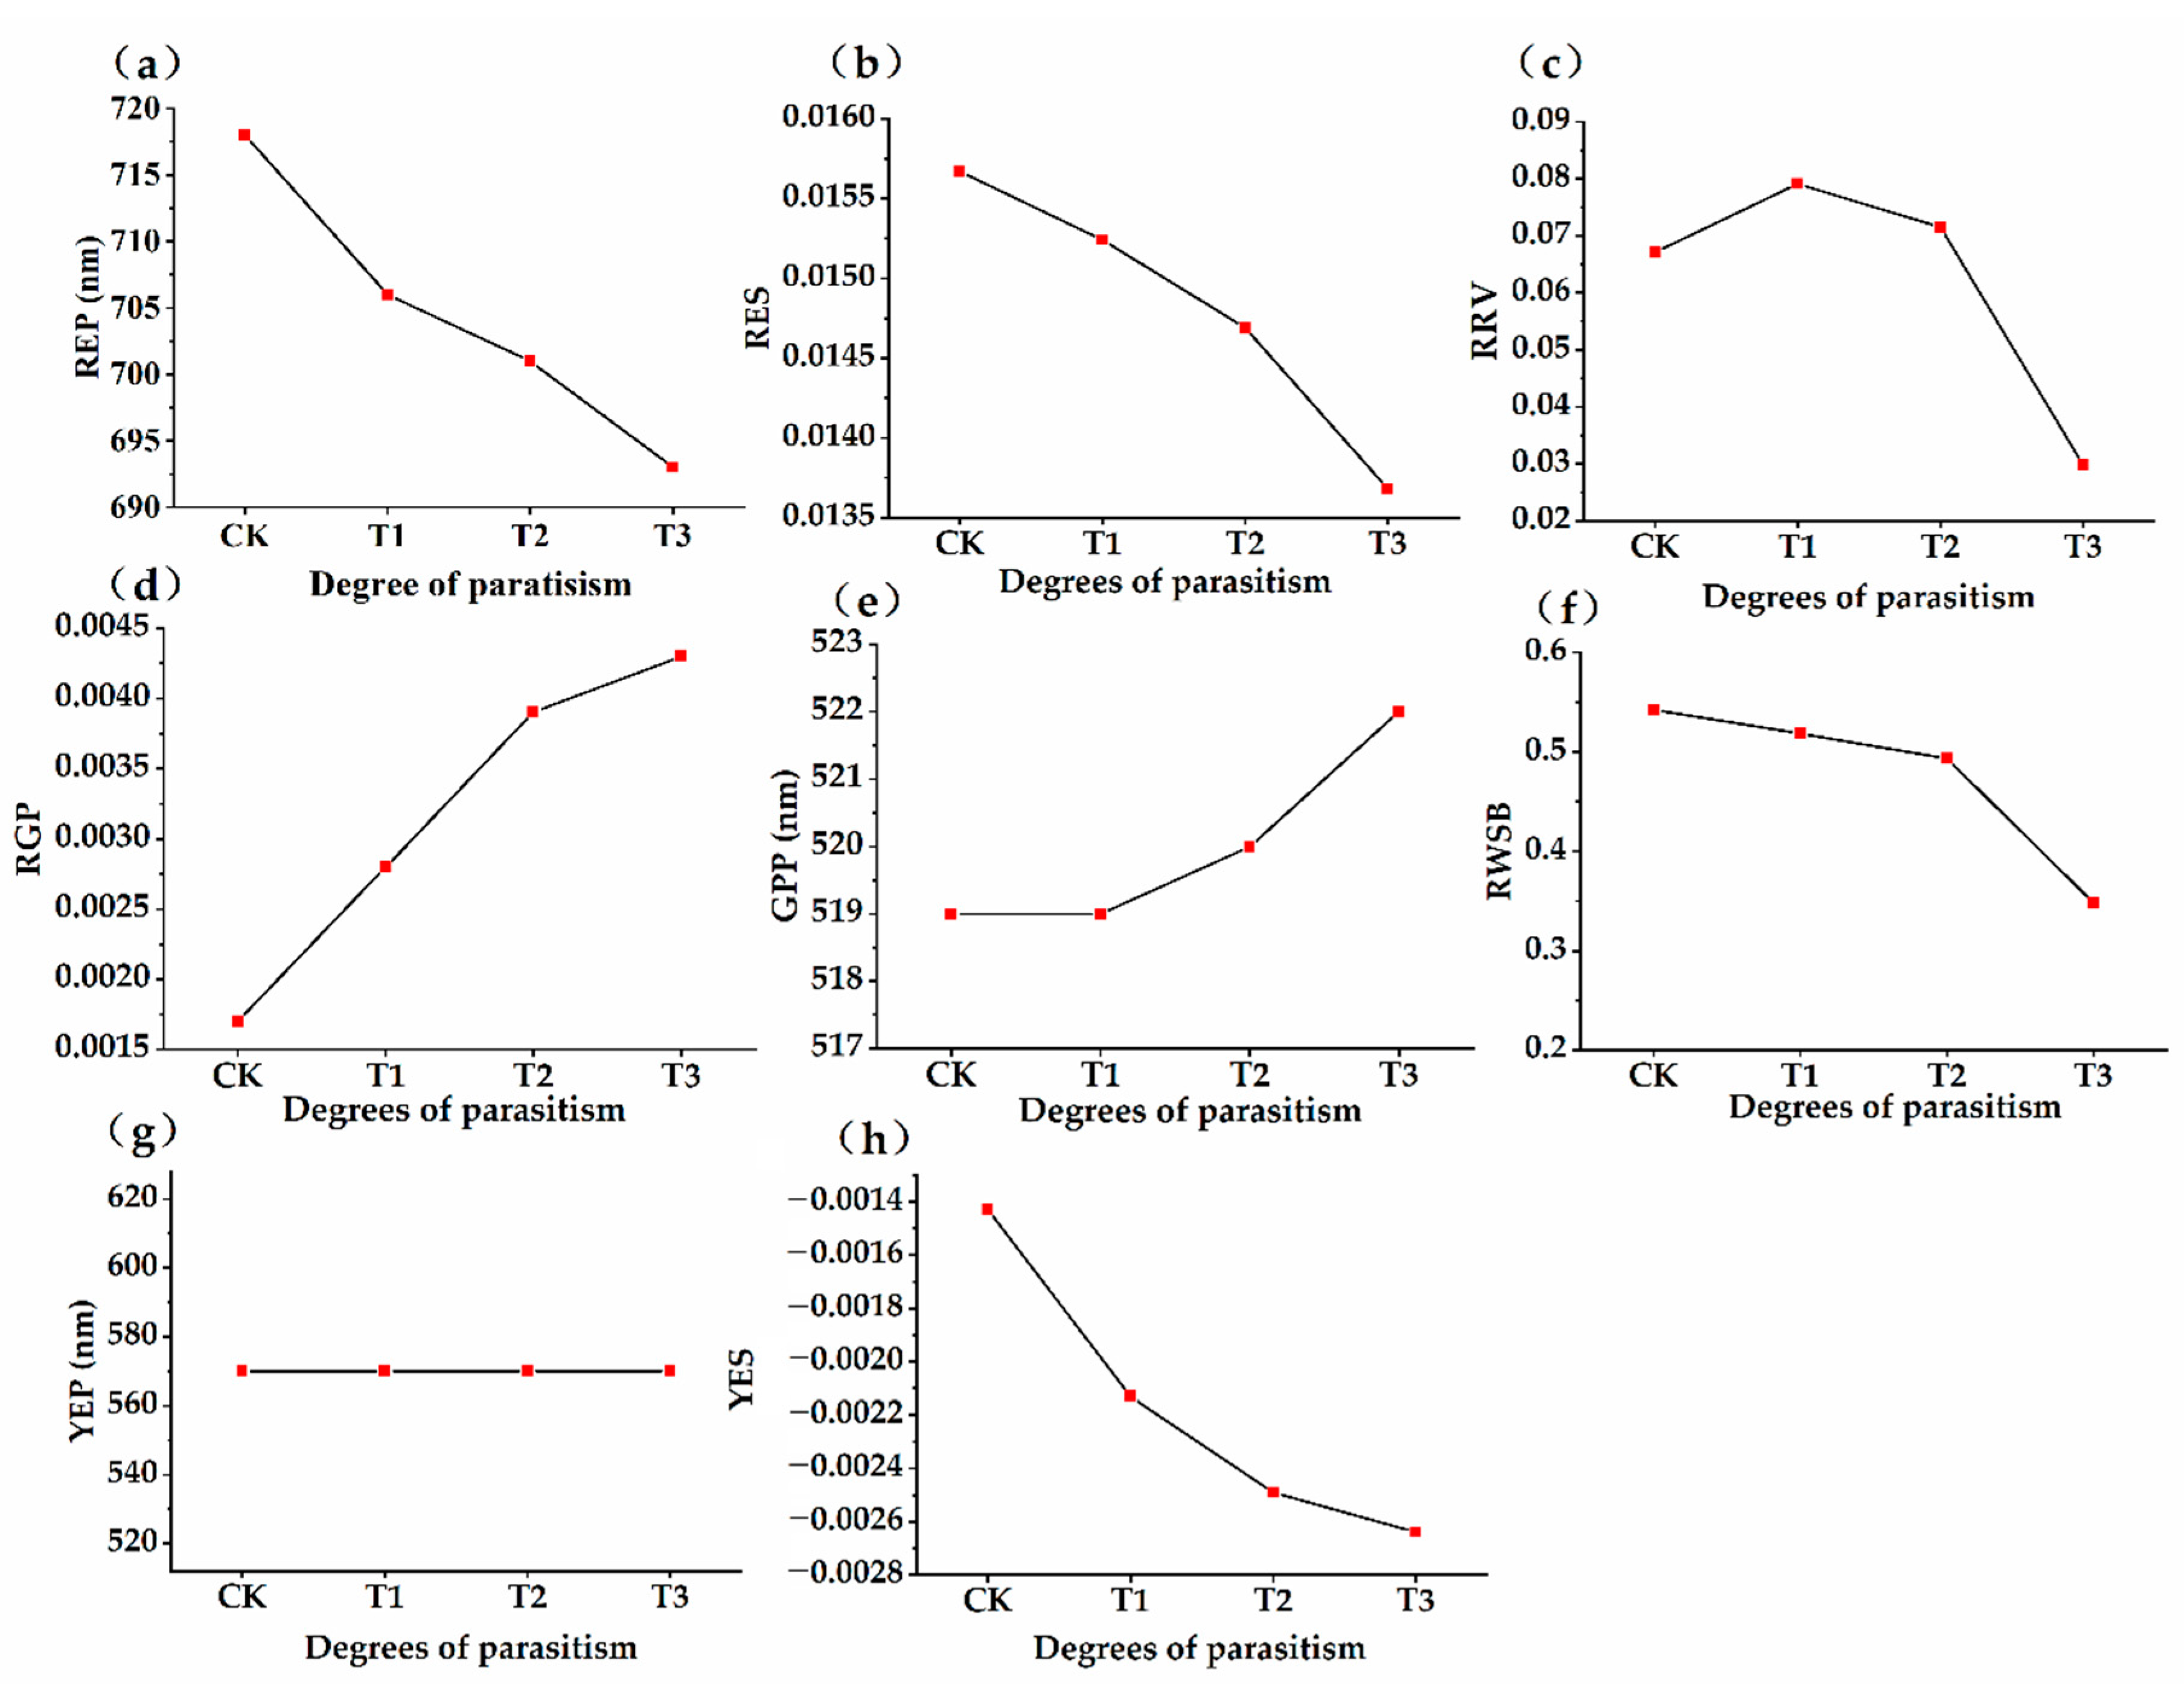
3.3. Dynamic Changes of Spectral Characteristic Parameters of Osmanthus fragrans in Different Parasitic Stages

After first-order differentiation of the reflectance original spectral curve, the first-order differential reflection coefficients under different parasitic intensities were obtained (Figure 5). We calculated eight typical spectral parameters under different parasitic intensities (Figure 6), and the parameter description was shown in Table 1. After Osmanthus fragrans was parasitized by Cuscuta japonica Choisy, there was an obvious “blue shift” in the red edge of its leaf surface spectral curve (Figure 5 and Figure 6a). With the deepening of parasitic intensity, the degree of “blue shift” also increased, indicating that with the increase of parasitic intensity, the influence on the red edge of the leaf surface became more severe. In addition, the slope of the red edge of the host plant decreased obviously after parasitization with CK (0.01557) > T1 (0.01524) > T2 (0.01469) > T3 (0.01368) (Figure 5 and Figure 6b). Many studies show that the red edge slope has a good indication of chlorophyll content [52]. Combined with Figure 3, with the deepening of parasitic intensity, chlorophyll content index is decreasing. Therefore, we suspect that the cause of this phenomenon was related to the influence of Cuscuta japonica Choisy on the photosynthesis of host plants. As can be seen from Figure 5 and Figure 6c, with the deepening of parasitic intensity, the spectral red valley reflectance of host plants Table 1 shows a trend of increasing at first and then decreasing (T1 (0.07912) > T2 (0.07153) > CK (0.0672) > T3 (0.0298)). In the initial stage of parasitism, due to the shielding of parasitic plants, the sun burns the leaves of host plants less, and the spectral reflectance tends to increase. However, in the middle and late stage of parasitism, the nutrient deficiency of the host plant leaves led to the weakening of sunlight reflection in this band [51,52]. Under different parasitic conditions, the position of the yellow edge is not affected, and it is all at 570 nm (Figure 5 and Figure 6g). With the deepening of parasitic intensity, the slope of the yellow edge (CK (−0.00143) > T1 (−0.00213) > T2 (−0.00249) >T3 (−0.00264)) and the reflectivity of the green peak (CK (0.0017), T1 (0.0028), T2 (0.0039) and T3 (0.0043)) gradually decreases (Figure 5 and Figure 6h,d). The position of the green peak presents shifts to long wave direction (CK (519), T1(519), T2(520), T3(522)) (Figure 5 and Figure 6e). At this time, the reflectivity of the water stress wave band (Figure 4 and Figure 6f) decreases gradually with CK (0.5425) > T1 (0.5182) > T2 (0.4938) > T3 (0.3483). Studies have shown that the spectral reflectance of vegetation in the range of 1550~1750 nm is usually closely related to the cell structure and water content of plants, which indicate the water absorption characteristics [53]. Therefore, with the deepening of the invasion degree of Cuscuta japonica Choisy, the cell structure of the leaves suffers certain damage. This is basically consistent with the research results of Xu et al. on pine wood nematode infecting Pinus needles [54].

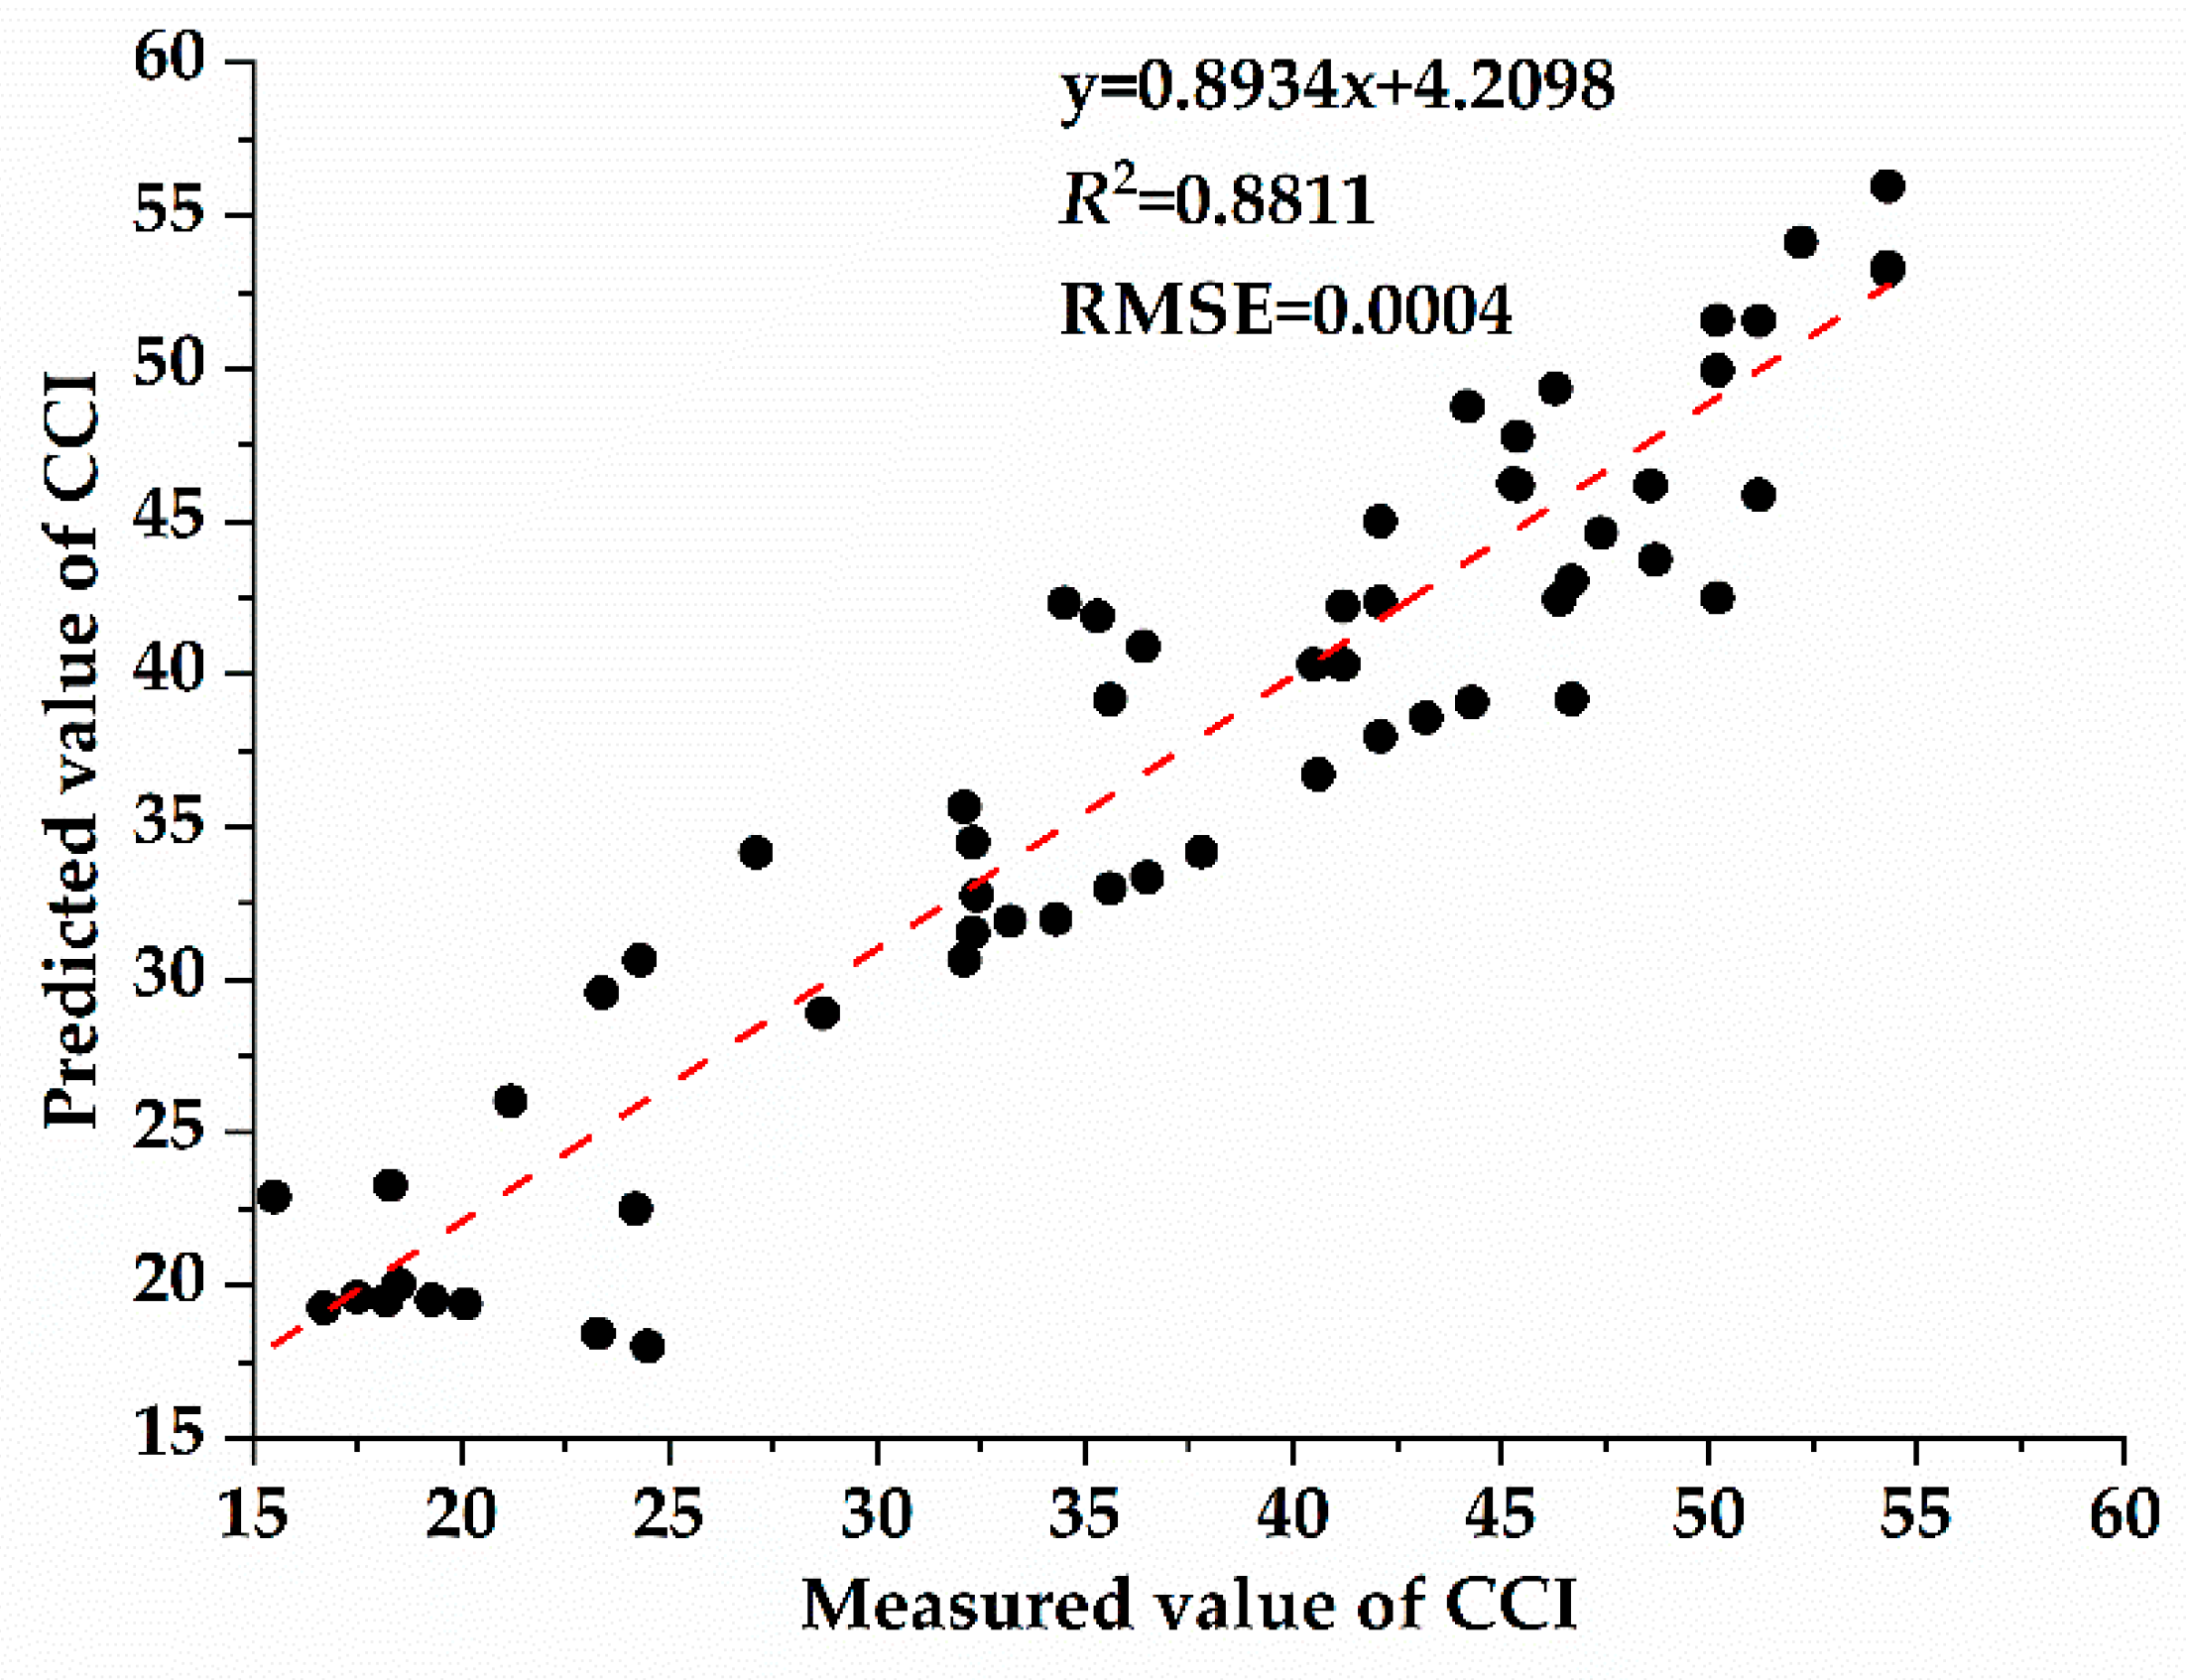
3.4. Correlation between Chlorophyll Content and Spectral Characteristic Parameters of Host Plants with Different Parasitic Degree of Cuscuta japonica Choisy

As shown in Figure 3, CCI of the host plant (Osmanthus fragrans) gradually decreased with the deepening of the parasitic intensity of Cuscuta japonica Choisy. Previous studies generally believed that chlorophyll was an important parameter to determine the characteristics of spectral reflectance curve of plant [55]. When the vegetation is in a healthy growth state and the chlorophyll content is high, the position of the red edge moves towards the long wave direction [55,56]. However, when vegetation is stressed by external environmental, such as drought stress, high temperature stress or insert damage, the red edge position tends to the short-wave direction [57]. Pearson correlation analysis was used to analyze the correlation between spectral parameters and plant functional traits (Table 2), and the correlation analysis in Table 2 was based on all the collected sample data, including four parasitic samples. It can be seen that there was an extremely significant correlation between spectral parameters and CCI. There was a significant correlation between RES and LT. RRV, RGP, RES, RWSB and CCI were have high correlation. In order to further explore the correlation between spectral parameters and plant functional traits, according to the correlation results in Table 2, the linear correlation analysis was carried out on the indicators that achieved significant correlation (Figure 7). Figure 7 showed the correlation between different spectral parameters with CCI and LT. The results of correlation analysis between plant functional traits and spectral parameters show that they show different correlations. The reflectance of red valley has the greatest correlation with chlorophyll content (y = −65913.323x + 9.783, R2 = 0.6888), which indicate that red edge characteristics were very sensitive to parasitic infestation and can be used to characterize changes in chlorophyll content of Osmanthus fragrans under different parasitic degrees. According to the results in Figure 7, the spectral parameter model with the highest accuracy was selected. Then, a prediction model is established with the most sensitive spectral parameters as independent variables and chlorophyll content as dependent variable. Finally, the accuracy of the model was further verified by analyzing the predicted and measured values calculated by the linear regression model (Figure 8). As shown in Figure 8, the chlorophyll inversion model of red valley reflectance was tested, and it was found that the prediction accuracy of this model was high and stable (R2 = 0.8811, RMSE = 0.0004).

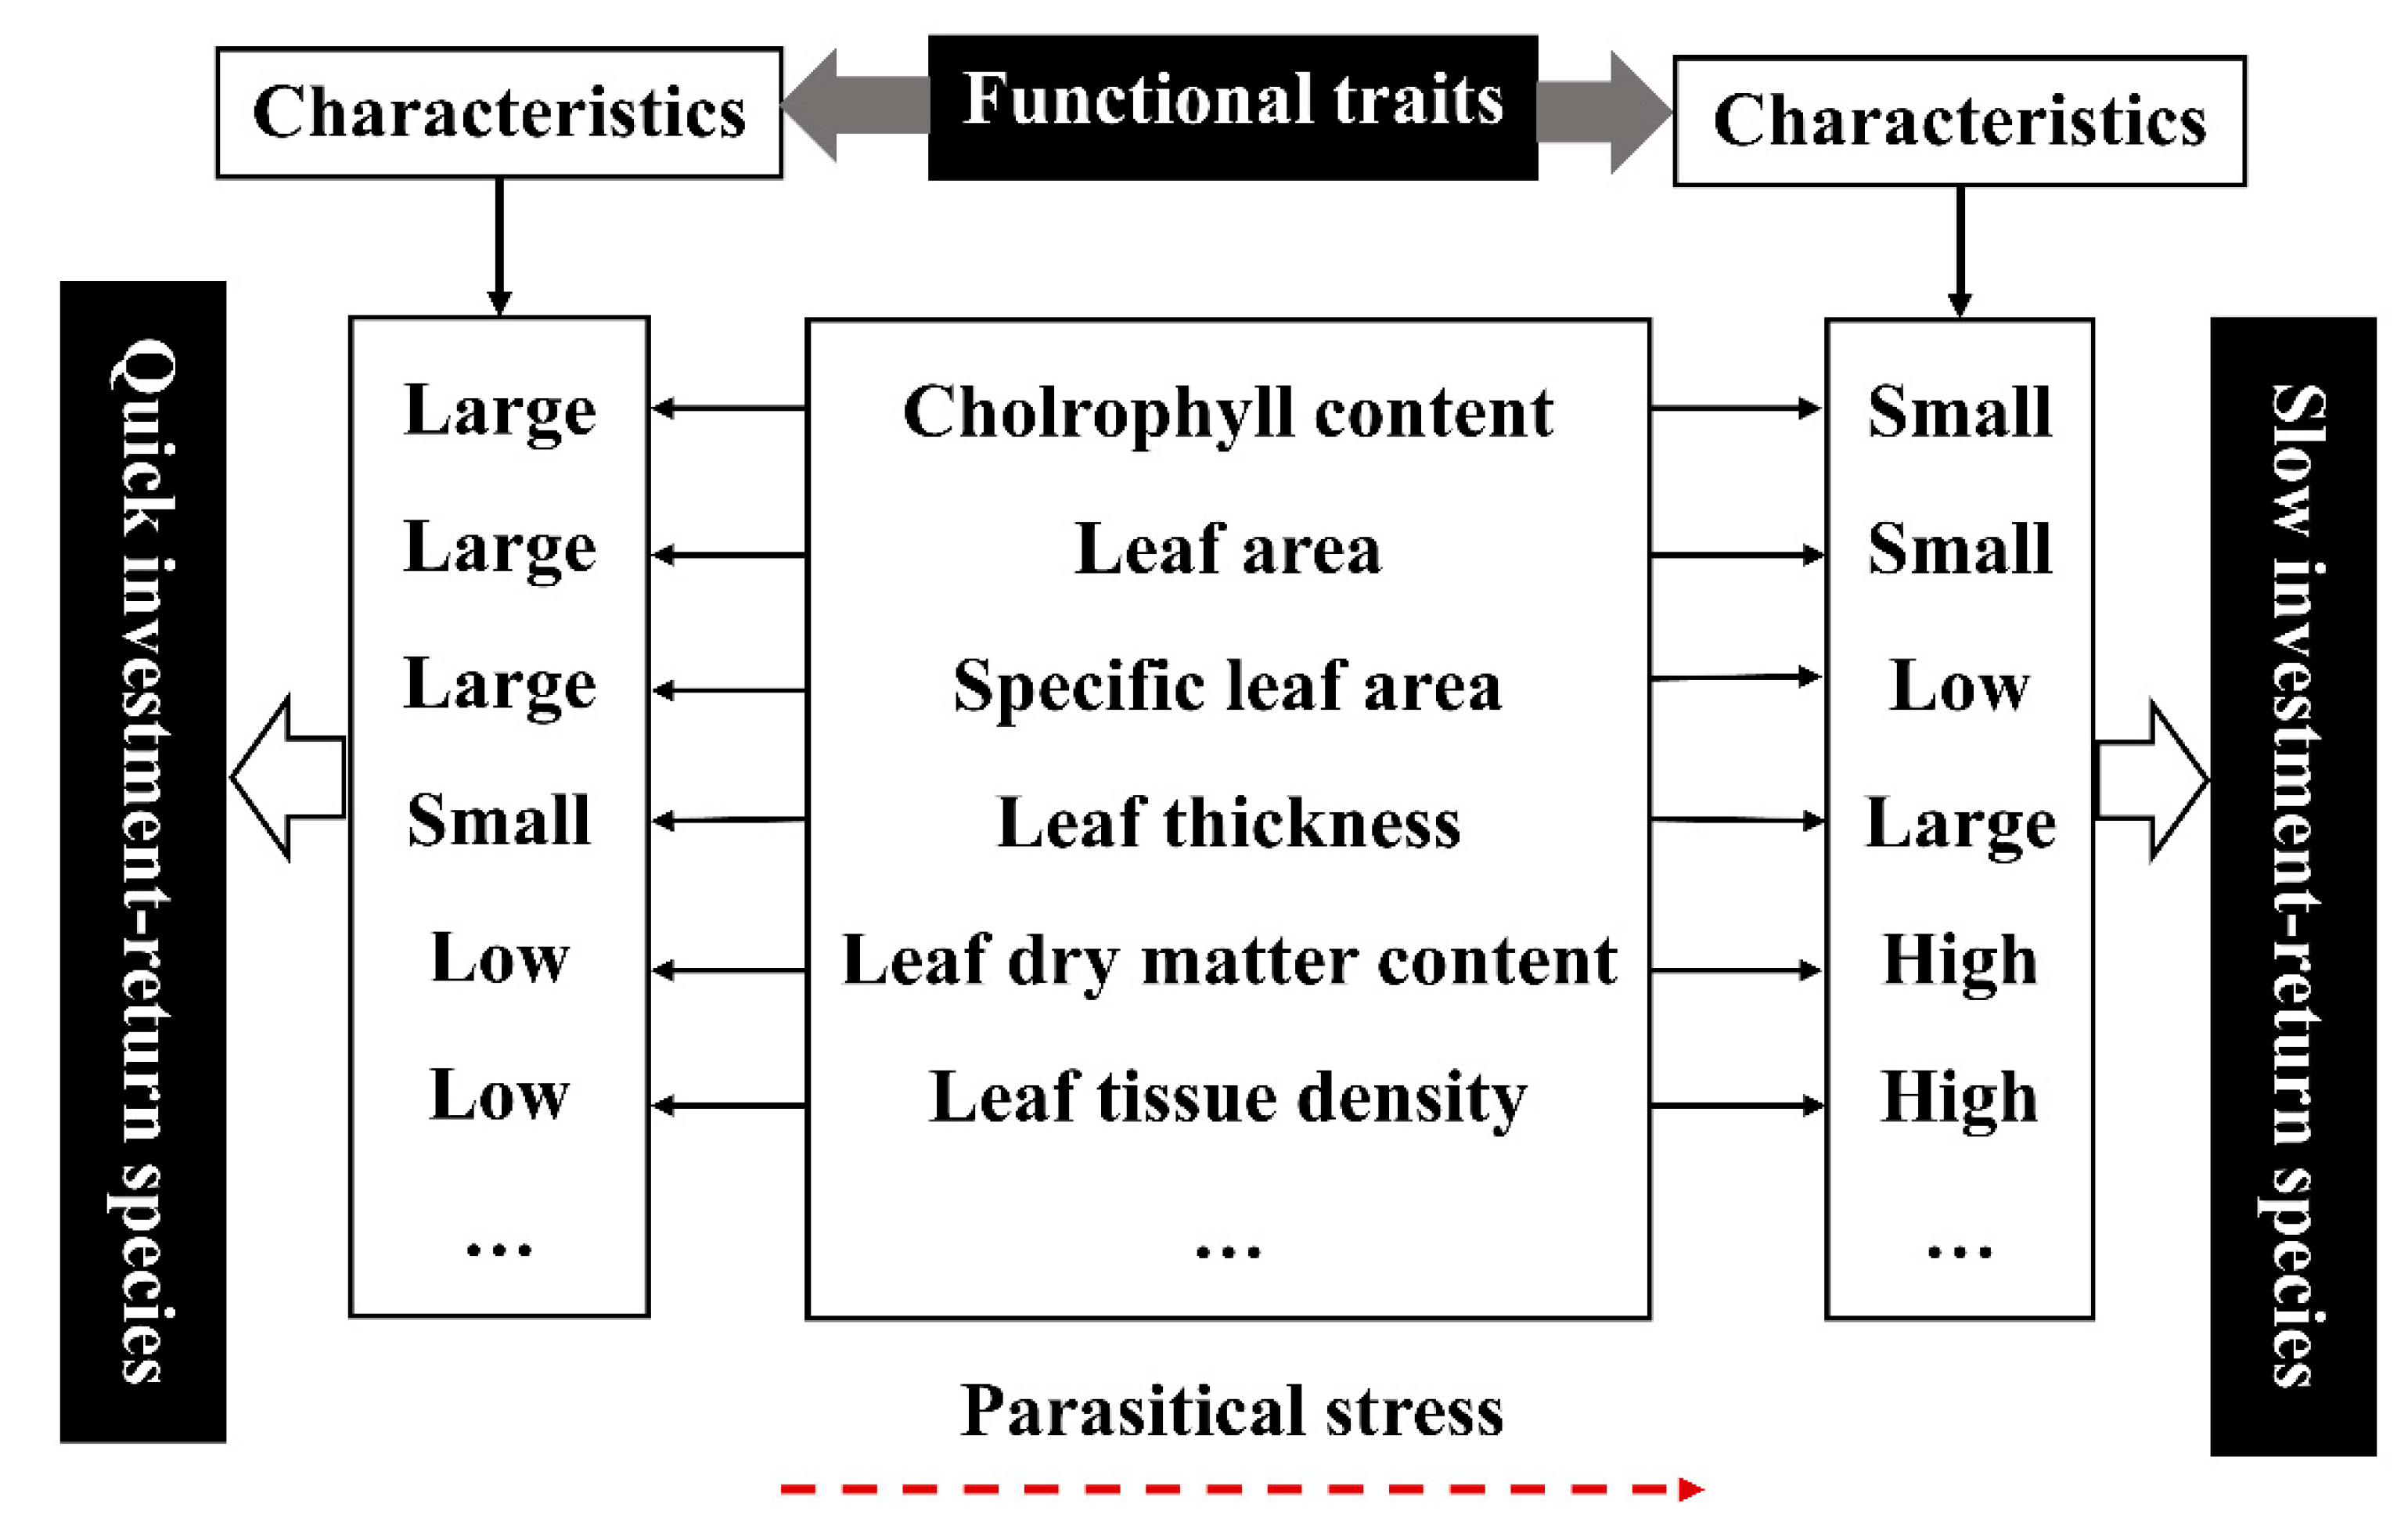
3.5. Effects of Parasitic Plants on the Correlation of Functional Traits of Osmanthus fragrans and Analysis of Leaf Economics Spectrum

There was an interdependent relationship between the functional traits of the leaves (Table 3). There was a significant positive correlation between LA and SLA. There was a significant negative correlation between SLA and LDMC and LTD. LA was significantly negatively correlated with LDMC and LTD. There was a significant negative correlation between LT and LTD. There was a very significant positive correlation between LDMC and LTD. There was a significant positive correlation between CCI and SLA. At the same time, LT has a negative correlation with SLA and LA, but the correlation has not reached a significant level.
Studies have shown that leaf functional traits can reflect the adaptability of plants to the environment, but compared with a single leaf functional trait, continuous leaf economics spectrum can better reflect the growth strategy and adaptation mechanism of plants [54,55]. In this study, there was an obvious trade-off relationship between the functional traits of plant leaves, which indicate that when plants are harmed by parasitic plants, host plants show certain ecological trade-off strategies in terms of functional traits for survival. SLA is closely related to the growth and survival strategy of plants, which can represent the adaptability of plants to the environment and the ability to obtain resources [58]. In this study, after being invaded by parasitic plants, the reduction of SLA of the host plants makes the plants adapt to resource-poor environment. LDMC represents the plants to maintain water and nutrients (cellulose, protein and Nitrogen content, etc), while LTD reflects the bearing capacity and defense ability of plant leaves, which is closely related to the turnover growth rate of leaves [59,60,61]. In this study, LDMC and LTD gradually increased with the increase of parasitic intensity, and showed a very significant positive correlation. This indicated that the host plant can improve the nutrient retention ability of leaves under the adverse environment of parasitic stress, and thus making more effective use of limited resources [58,60]. The increase of LTD was beneficial to strengthen the defense ability of plant against biological factors [61]. To sum up, after being parasitized, the leaf functional traits of the host plant were generally characterized by large leaf thickness, small leaf area, small specific leaf area, low chlorophyll content index, high dry matter content and high leaf tissue density. Therefore, we suspect that the leaf economics spectrum may also exist in the parasitic environment, and there was a general trend toward “slow investment-return” type in the global leaf economics spectrum (Figure 9).

4. Conclusions

In this paper, we studied the spectral characteristics and leaf functional traits of Osmanthus fragrans in different parasitic periods after Cuscuta japonica Choisy infection, revealing the relationship between the spectral characteristic changes and invasive processes after host susceptibility. In addition, by establishing a correlation between spectral characteristic parameters and chlorophyll content, the research results can provide theoretical support for the prediction of plant diseases in the early stage. At the same time, it can provide a reference for monitoring and early warning of infringement, and a new experimental basis for different measures to control Cuscuta japonica Choisy. Main conclusions are as follows.
(1)
The spectral reflectance was generally higher before parasitism than after parasitism. There were four main reflection peaks and five main absorption valleys in the spectral reflection curve (350~1800 nm). The near-infrared band (750~1400 nm) was the sensitive range of spectral response of host plants to parasitic infection. At the same time, such variation characteristics were universal under different parasitic degree conditions.
(2)
The position of red edge, slope of red edge, reflectance of a green peak, and reflectance of water stress band can well reflect the invasion status in different parasitic stages. After parasitism, the red edge position of the host plant spectrum shifted to shortwave direction. With the deepening of parasitic intensity, the moving distance of the red edge position to the short-wave direction increases.
(3)
With the increase of parasitic intensity, the relative content of chlorophyll in host plants gradually decreases, and the spectral characteristic parameters were significantly correlated with them. Chlorophyll inversion model based on red valley reflectance has the highest accuracy (y = −65913.323x + 9.783, R2 = 0.6888).
(4)
After parasitism, the leaf functional traits of host plant were characterized by large leaf thickness, small leaf area, small specific leaf area, low relative chlorophyll content, high leaf dry matter content, and high leaf tissue density. We suspect that there may be leaf economics spectrum (“slow investment-return”) in the parasitic environment.

Author Contributions

J.Z. conceived and designed the study. J.Z. and X.Z. contributed to materials and tools. J.Z., J.Y. and Q.X. performed the experiments. Q.X., J.Y., X.Z. and C.X. contributed to literature collection. J.Z. contributed to data analysis. J.Z. contributed to paper preparation, writing and revision. All the authors read and approved it for publication. All authors have read and agreed to the published version of the manuscript.

Funding

This study was funded by “the Fundamental Research Funds for the Central Universities (NO. BLX201704)”, “National Natural Science Foundation of China (NSFC project NO. 31901277)” and “Integration and Demonstration of Key Technologies for Oriented Tending of Plain Ecological Forest in Chaoyang District (CYSF-1904)”.

Institutional Review Board Statement

Not applicable.

Informed Consent Statement

Not applicable.

Data Availability Statement

The data involved in the article were all shown in the figures and tables. However, there are still available from the first author on reasonable request.

Acknowledgments

Research was conducted in Guangxi University. We thank the Forestry College of Guangxi University and the Agricultural College of Guangxi University for providing us with necessary experimental platforms and instruments. The English in this document has been checked by at least two professional editors; both were native speakers of English. We thank Jiguang Wei from the College of Agriculture of Guangxi University for identifying the plant species used in this study (Identification information refers to Flora of China).

Conflicts of Interest

The authors declare that they have no competing interest.

Ethics Approval and Consent to Participate

This experiment does not involve human experiments and animal experiments. The field trial experiments in the current study were permitted by the local government in China (Guangxi University and Guangxi Finance and Economics University), including the collection of leaf samples.

Abbreviations

SLA-Specific leaf area, LDMC-Leaf dry matter content, CCI-Chlorophyll content index, LTD-Leaf tissue density, LT-Leaf thickness, LSFW-Leaf saturated fresh weight, LV-Leaf volume, LDW- Leaf dry weight, REP-Position of red edge, RES-Slope of red edge, RRV-Reflectance of red valley, RGP-Reflectance of green peak, GPP-Position of green peak, RWSB-Reflectance of water stress band, YES-Slope of yellow edge, YEP-Position of yellow edge.

References

  1. Mahlein, A.K.; Oerke, E.C.; Steiner, U.; Dehne, H.W. Recent advances in sensing plant diseases for precision crop protection. Eur. J. Plant. Pathol. 2012, 133, 197–209. [Google Scholar] [CrossRef]
  2. Press, M.C.; Phoenix, G.K. Impacts of parasitic plants on natural communities. New Phytolog. 2010, 166, 737–751. [Google Scholar] [CrossRef]
  3. Bouwmeester, H.J.; Roux, C.; Lopezraez, J.A.; Bécard, G. Rhizosphere communication of plants, parasitic plants and am fungi. Trends Plant Sci. 2007, 12, 224–230. [Google Scholar] [CrossRef] [PubMed]
  4. Runyon, J.B.; Mescher, M.C.; Moraes, C.M.D. Volatile chemical cues guide host location and host selection by parasitic plants. Science 2006, 313, 1964–1967. [Google Scholar] [CrossRef] [PubMed] [Green Version]
  5. Yoneyama, K.; Xie, X.; Sekimoto, H.; Takeuchi, Y.; Ogasawara, S.; Akiyama, K.; Hayashi, H.; Yoneyama, K. Strigolactones, host recognition signals for root parasitic plants and arbuscular mycorrhizal fungi, from Fabaceae plants. New Phytol. 2008, 179, 484–494. [Google Scholar] [CrossRef]
  6. Yoneyama, K. Studies on the host recognition mechanism of root parasitic plants. J. Pestic. Sci. 2010, 35, 348–350. [Google Scholar] [CrossRef] [Green Version]
  7. Smith, J.L.; De Moraes, C.M.; Mescher, M.C. Jasmonate- and salicylate-mediated plant defense responses to insect herbivores, pathogens and parasitic plants. Pest. Manag. Sci. 2010, 65, 497–503. [Google Scholar] [CrossRef] [PubMed]
  8. Bardgett, R.D.; Smith, R.S.; Shiel, R.S.; Peacock, S.; Simkin, J.M.; Quirk, H.; Hobbs, P.J. Parasitic plants indirectly regulate below–ground properties in grassland ecosystems. Nature 2009, 439, 969–972. [Google Scholar] [CrossRef] [PubMed]
  9. Mower, J.P.; Stefanovi, S.; Young, G.J.; Palmer, J.D. Plant genetics, gene transfer from parasitic to host plants. Nature 2004, 432, 165–166. [Google Scholar] [CrossRef]
  10. Matvienko, M.; Wojtowicz, A.; Wrobel, R.; Jamison, D.; Goldwasser, Y.; Yoder, J.I. Quinone oxidoreductase message levels are differentially regulated in parasitic and non-parasitic plants exposed to allelopathic quinones. Plant J. 2010, 25, 375–387. [Google Scholar] [CrossRef] [Green Version]
  11. Pickett, J.A.; Hamilton, M.L.; Hooper, A.M.; Khan, Z.R.; Midega, C.A.O. Companion cropping to manage parasitic plants. Annu. Rev. Phytopathol. 2010, 48, 161–177. [Google Scholar] [CrossRef] [PubMed] [Green Version]
  12. Rubiales, D. Parasitic plants, wild relatives and the nature of resistance. New Phytol. 2010, 160, 459–461. [Google Scholar] [CrossRef]
  13. Mahlein, A.-K.; Kuska, M.T.; Behmann, J.; Polder, G.; Walter, A. Hyperspectral Sensors and Imaging Technologies in Phytopathology: State of the Art. Annu. Rev. Phytopathol. 2018, 56, 535–558. [Google Scholar] [CrossRef]
  14. Yang, B.F.; Du, L.S.; Li, J.M. Effects of Cuscuta australis parasitism on the growth, reproduction and defense of Solidago canadensis. Chin. J. Appl. Ecol. 2015, 26, 3309–3314. [Google Scholar]
  15. Guo, S.M.; Li, J.M.; Li, Y.H.; Yan, M. The trade-off between growth and defense in Alternanthera philoxeroides parasitized by Cuscuta australis. Acta Ecol. Sin. 2014, 34, 4866–4873. [Google Scholar]
  16. Conn, C.E.; Bythell–Douglas, R.; Neumann, D.; Yoshida, S.; Whittington, B.; Westwood, J.H.; Shirasu, K.; Bond, C.S.; Dyer, K.A.; Nelson, D.C. Plant evolution convergent evolution of strigolactone perception enabled host detection in parasitic plants. Science 2015, 349, 540–543. [Google Scholar] [CrossRef] [Green Version]
  17. Press, M.C. Carbon acquisition and assimilation in parasitic plants. Funct. Ecol. 2015, 5, 278. [Google Scholar] [CrossRef]
  18. Roney, J.K.; Khatibi, P.A.; Westwood, J.H. Cross-species translocation of mRNA from host plants into the parasitic plant dodder. Plant Physiol. 2007, 143, 1037–1043. [Google Scholar] [CrossRef] [PubMed] [Green Version]
  19. Hautier, Y.; Hector, A.; Vojtech, E.; Purves, D.; Turnbull, L.A. Modelling the growth of parasitic plants. J. Ecol. 2010, 98, 857–866. [Google Scholar] [CrossRef] [Green Version]
  20. Chin, J.A.; Wang, E.C.; Kibbe, M.R. Evaluation of hyperspectral technology for assessing the presence and severity of peripheral artery disease. J. Vasc. Surg. 2001, 54, 1679–1688. [Google Scholar] [CrossRef] [Green Version]
  21. Xie, X.; Ying, X.L.; Li, R.; Zhang, Y.; Huo, Y.; Bao, Y.; Shen, S. Hyperspectral characteristics and growth monitoring of rice Oryza sativa under asymmetric warming. Int. J. Remote Sens. 2013, 34, 8449–8462. [Google Scholar] [CrossRef]
  22. Cuevas, P. Effects of generalist and specialist parasitic plants (Loranthaceae) on the fluctuating asymmetry patterns of ruprestrian host plants. Basic Appl. Ecol. 2011, 12, 449–455. [Google Scholar] [CrossRef]
  23. Barnes, M.L.; Breshears, D.D.; Law, D.J.; Van Leeuwen, W.J.D.; Monson, R.K.; Fojtik, A.C.; Barron Gafford, G.A.; Moore, D.J.P. Beyond greenness: Detecting temporal changes in photosynthetic capacity with hyperspectral reflectance data. PLoS ONE 2017, 12, 1–17. [Google Scholar] [CrossRef] [PubMed] [Green Version]
  24. Thenkabail, P.S.; Smith, R.B.; Pauw, E.D. Hyperspectral vegetation indices and their relationships with agricultural crop characteristics. Remote Sens. Environ. 2000, 71, 158–182. [Google Scholar] [CrossRef]
  25. Ge, S.; Everitt, J.; Carruthers, R.; Gong, P.; Anderson, G. Hyperspectral characteristics of canopy components and structure for phenological assessment of an invasive weed. Environ. Monit. Assess. 2006, 120, 109–126. [Google Scholar] [CrossRef] [PubMed]
  26. Diaz, S.; Cabido, M.; Zak, M.; Martinez, C.E.; Aranibar, J. Plant functional traits, ecosystem structure and land–use history along a climatic gradient in central–western Argentina. J. Veg. Sci. 2010, 10, 651–660. [Google Scholar] [CrossRef]
  27. Wright, I.J.; Reich, P.B.; Westoby, M.; Ackerly, D.D.; Baruch, Z.; Bongers, F.; Cavender–Bares, J.; Chapin, T.; Cornelissen, J.H.C.; Diemer, M.; et al. The worldwide leaf economics spectrum. Nature 2004, 428, 821–827. [Google Scholar] [CrossRef]
  28. Vendramini, F.; Diaz, S.; Gurvich, D.E.; Wilson, P.J.; Thompson, K.; Hodgson, J.G. Leaf traits as indicators of resource–use strategy in floras with succulent species. New Phytol. 2002, 154, 147–157. [Google Scholar] [CrossRef]
  29. Cornwell, W.K.; Cornelissen, J.H. Plant species traits are the predominant control on litter decomposition rates within biomes worldwide. Ecol. Lett. 2008, 11, 1065–1071. [Google Scholar] [CrossRef]
  30. Matusova, R. The strigolactone germination stimulants of the plant-parasitic striga and orobanche spp are derived from the carotenoid pathway. Plant Physiol. 2005, 139, 920–934. [Google Scholar] [CrossRef] [Green Version]
  31. Cheng, G.F.; Zhang, J.H.; Li, B.B.; Zhang, J.H.; Yang, S.B.; Xie, X.J. Hyper–Spectral and Red Edge Characteristics for Rice Under Different Temperature Stress Levels. Jiangsu J. Agric. Sci. 2008, 5, 573–580. (In Chinese) [Google Scholar]
  32. Huang, X.Y.; Xu, Z.H.; Lin, L.; Shi, W.C.; Yu, K.Y.; Liu, J.; Chen, C.C.; Zhou, H.K. Pantana Phyllostachysae Chao damage detection based on physical and chemical parameters of Moso Bamboo leaves. Spectrosc. Spect. Anal. 2019, 39, 857–864. [Google Scholar]
  33. Kim, S.R.; Lee, W.K.; Lim, C.H.; Kim, M.; Kafatos, M.C.; Lee, S.H.; Lee, S.S. Hyperspectral analysis of pine wilt disease to determine an optimal detection Index. Forests 2018, 9, 115. [Google Scholar] [CrossRef] [Green Version]
  34. Zhang, S.L.; Qin, J.; Tang, X.D.; Wang, Y.J.; Huang, J.L.; Song, Q.L.; Min, J.Y. Spectral characteristics and evaluation model of Pinus Massoniana suffering from Bursaphelenchus Xylophilus disease. Spectrosc. Spect. Anal. 2019, 39, 865–872. [Google Scholar]
  35. Everitt, J.H.; Escobar, D.E.; Appel, D.N.; Riggs, W.G.; Davis, M.R. Using airborne digital imagery for detecting Oak wilt disease. Plant Dis. 1999, 83, 502–505. [Google Scholar] [CrossRef] [Green Version]
  36. Wright, S.J. Leaf functional traits of tropical forest plants in telation to growth form. Funct. Ecol. 2010, 21, 19–27. [Google Scholar]
  37. Wickett, N.J.; Honaas, L.A.; Wafula, E.K.; Das, M.; Huang, K.; Wu, B.; Landherr, L.; Timko, M.P.; Yoder John Westwood, J.H.; de Pamphilis, C.W. Transcriptomes of the parasitic plant family Orobanchaceae reveal surprising conservation of chlorophyll synthesis. Curr. Biol. 2011, 21, 2098–2104. [Google Scholar] [CrossRef] [Green Version]
  38. Gitelson, A.A.; Merzlyak, M.N.; Lichtenthaler, H.K. Detection of red edge position and chlorophyll content by reflectance measurements near 700 nm. J. Plant. Physiol. 1996, 148, 501–508. [Google Scholar] [CrossRef]
  39. Cho, M.A.; Skidmore, A.K. A new technique for extracting the red edge position from hyperspectral data, the linear extrapolation method. Remote Sens. Environ. 2006, 101, 181–193. [Google Scholar] [CrossRef]
  40. Zhu, J.; Yu, Q.; Zhu, H.; He, W.; Xu, C.; Liao, J.; Qiu, Y.; Su, K. Response of dust particle pollution and construction of a leaf dust deposition prediction model based on leaf reflection spectrum characteristics. Environ. Sci. Pollut. Res. 2019, 26, 36764–36775. [Google Scholar] [CrossRef]
  41. Corney, H.J.; Sasse, J.M.; Ades, P.K. Assessment of salt tolerance in eucalypts using chlorophyll fluorescence attributes. New For. 2003, 26, 233–246. [Google Scholar] [CrossRef]
  42. Dodds, K.J.; Cooke, R.R.; Hanavan, R.P. The effects of silvicultural treatment on sirex noctilio attacks and tree health in northeastern United States. Forests 2014, 5, 2810–2824. [Google Scholar] [CrossRef]
  43. Lu, N.; Zhou, X.; Cui, M.; Yu, M.; Zhou, J.X.; Qin, Y.S.; Li, Y. Colonization with arbuscular mycorrhizal fungi promotes the growth of Morus alba L. seedlings under greenhouse conditions. Forests 2015, 6, 734–747. [Google Scholar] [CrossRef] [Green Version]
  44. Hegenauer, V.; Körner, M.; Albert, M. Plants under stress by parasitic plants. Curr. Opin. Plant. Biol. 2017, 38, 34. [Google Scholar] [CrossRef]
  45. Zhao, X.J.; Pan, Y.J.; Chen, H.F.; Tang, Z.H. Influence of holoparasitic plant Cuscuta japonica on growth and alkaloid content of its host shrub Catharanthus roseus, a field experiment. Arab. J. Sci. Eng. 2018, 43, 1–8. [Google Scholar] [CrossRef]
  46. Reynolds, G.J.; Gordon, T.R.; McRoberts, N. Quantifying the impacts of systemic acquired resistance to pitch canker on Monterey pine growth rate and hyperspectral reflectance. Forests 2016, 7, 20. [Google Scholar] [CrossRef] [Green Version]
  47. Westwood, J.H.; Bouwmeester, H. Parasitic plants tap into the main stream. New Phytol. 2010, 184, 284–287. [Google Scholar] [CrossRef]
  48. Johnson, B.I.; De Moraes, C.M.; Mescher, M.C. Manipulation of light spectral quality disrupts host location and attachment by parasitic plants in the genus Cuscuta. J. Appl. Ecol. 2016, 53, 794–803. [Google Scholar] [CrossRef]
  49. Kuijt, J. Botanical enigmas. (book reviews, the biology of parasitic flowering plants). Science 1970, 168, 1081–1082. [Google Scholar]
  50. Filella, I.; Penuelas, J. The red edge position and shape as indicators of plant chlorophyll content, biomass and hydric status. Int. J. Remote Sens. 1994, 15, 1459–1470. [Google Scholar] [CrossRef]
  51. Zahn, L.M. Even Parasitic Plants Need Plastids. Science 2011, 331, 1243. [Google Scholar] [CrossRef] [Green Version]
  52. Yoneyama, K.; Awad, A.A.; Xie, X.; Takeuchi, Y. Strigolactones as germination stimulants for root parasitic plants. Plant Cell Physiol. 2010, 51, 1095–1103. [Google Scholar] [CrossRef] [PubMed] [Green Version]
  53. Han, L. Estimating chlorophyll-a concentration using first-derivative spectra in coastal water. Int. J. Remote Sens. 2005, 26, 5235–5244. [Google Scholar] [CrossRef]
  54. Jiang, J.; Steven, M.D.; He, R.; Chen, Y.; Du, P.; Guo, H. Identifying the spectral responses of several plant species under Co2 leakage and waterlogging stresses. Int J. Greenh. Gas. Con. 2015, 37, 1–11. [Google Scholar] [CrossRef]
  55. Xu, H.C.; Luo, Y.Q.; Zhang, T.T.; Shi, Y.J. Changes of Reflectance Spectra of Pine Needles in Different Stage after Being Infected by Pine Wood Nematode. Spectrosc. Spect. Anal. 2011, 31, 1352–1356. [Google Scholar]
  56. Liu, W.; Chang, Q.R.; Guo, M.; Xing, D.X.; Yuan, Y.S. Extraction of first derivative spectrum features of soil organic matter via wavelet denoising. Spectrosc. Spect. Anal. 2011, 31, 100–104. [Google Scholar]
  57. Liu, L.; Wang, J.; Huang, W.; Zhao, C.; Zhang, B.; Tong, Q. Estimating winter wheat plant water content using red edge parameters. Int. J. Remote Sens. 2003, 25, 1688–1691. [Google Scholar] [CrossRef]
  58. Wang, Z.H.; Ding, L.X. Tree species discrimination based on leaf-level hyperspectral characteristic analysis. Spectrosc. Spect. Anal. 2010, 30, 1825–1829. [Google Scholar]
  59. Atkinson, L.J.; Campbell, C.D.; Zaragoza-Castells, J.; Hurry, V.; Atkin, O.K. Impact of growth temperature on scaling relationships linking photosynthetic metabolism to leaf functional traits. Funct. Ecol. 2010, 24, 1181–1191. [Google Scholar] [CrossRef]
  60. Ülo, N. Leaf age dependent changes in within–canopy variation in leaf functional traits, a meta-analysis. J. Plant Res. 2016, 129, 313–338. [Google Scholar]
  61. Lemoine, N.P.; Shue, J.; Verrico, B.; Erickson, D.; Kress, W.J.; Parker, J.D. Phylogenetic relatedness and leaf functional traits, not introduced status, influence community assembly. Ecology 2016, 96, 2605–2612. [Google Scholar] [CrossRef] [PubMed]
  62. Lópezsampson, A.; Cernusak, L.A.; Page, T. Relationship between leaf functional traits and productivity in Aquilaria crassna (Thymelaeaceae) plantations, a tool to aid in the early selection of high–yielding trees. Tree Physiol. 2017, 37, 1–9. [Google Scholar]
Figure 1. (a) Osmanthus fragrans without parasitism of Cuscuta japonica Choisy (healthy plant). (b) Osmanthus fragrans with parasitism of Cuscuta japonica Choisy.
Applsci 11 01937 g001
Figure 2. The operation flow of ASD spectrometer for measuring leaf surface spectrum. (a) is the operation flow of ASD spectrometer. (b) is a schematic diagram of the operation of the spectrometry of the blade.
Applsci 11 01937 g002
Figure 3. Changes in leaf functional traits under different parasitic intensities. Different lowercase letters indicate significant differences in parameters at the p < 0.05 level. (a) Chlorophyll content index, (b) leaf area, (c) leaf dry matter content, (d) leaf tissue density, (e) specific leaf area, (f) leaf thickness.
Applsci 11 01937 g003
Figure 4. Spectral reflectance of healthy Osmanthus fragrans leaves and spectral reflectance of Osmanthus fragrans with different parasitic degrees.
Applsci 11 01937 g004
Figure 5. The first derivative spectral curves of the Osmanthus fragrans leaves.
Applsci 11 01937 g005
Figure 6. Dynamic trend of spectral parameters in different parasitism period. (ah) respectively represents the position of red edge (REP), the slope of red edge (RES), the reflectance of red valley (RRV), the reflectance of green peak (RGP), the position of green peak (GPP), the reflection of water stress band (RWSB), the position of yellow edge (YEP), and the slope yellow edge (YES) under different parasitic intensities.
Applsci 11 01937 g006
Figure 7. Linear correlation between functional traits and spectral parameters. (a) the reflection of red valley (RRV) and CCI, (b) the reflectance of green peak (RGP) and CCI, (c) the slope of red edge (RES) and CCI, (d) the reflection of water stress band (RWSB) and CCI, (e) the reflectance of green peak (RGP) and LT.
Applsci 11 01937 g007
Figure 8. Test of chlorophyll inversion model based on red valley reflectance.
Applsci 11 01937 g008
Figure 9. Conceptual illustration of leaf economics spectrum [36,62].
Applsci 11 01937 g009
Table 1. Spectral parameters and their description.
Spectral ParameterDescription
RESThe maximum 1st derivative of reflectance in the red band (680~750 nm).
REPThe wavelength position corresponding to the maximum reflectance in the wavelength band 680~750 nm.
RRVThe minimum band reflectance in the range of 640~700 nm.
RGPThe maximum band reflectance in the range of 510~580 nm.
GPPThe wavelength position corresponding to the green peak reflectance in the wavelength band 510~580 nm.
RWSBThe maximum band reflectance in the range of wavelengths from 1550~1750 nm.
YESThe maximum 1st derivative of reflectance in the yellow band (550–582 nm).
YEPThe wavelength position corresponding to the maximum reflectance in the wavelength band 550~582 nm.
Table 2. Pearson correlation analysis between plant traits and spectral parameters. * indicates that the correlation reaches a significant level at the level of p < 0.05. and ** indicates a significant correlation reaches a significant level at the level of p < 0.01.
RRVRGPRESRWSB
LT0.25218−0.1787−0.28318 *0.09577
LA−0.016510.18462−0.142920.0353
LDMC0.01136−0.005230.030480.09512
SLA0.20281−0.24112−0.064070.0641
LTD−0.195530.171240.13662−0.01367
CCI−0.82993 **0.72953 **0.65295 **−0.56967 **
Table 3. Correlation between plant functional traits indicators. * indicates a significant correlation between functional traits at the level of p < 0.05, and ** indicates a significant correlation between functional traits at the level of p < 0.01.
LTLASLALDMCLTDCCI
LT1
LA−0.16961
SLA−0.15020.3581 *1
LDMC−0.1293−0.4246 *−0.6991 **1
LTD−0.5436 **−0.4218 *−0.5950 **0.7517 **1
CCI0.25660.26230.4993 *−0.2201−0.4456 *1
Publisher’s Note: MDPI stays neutral with regard to jurisdictional claims in published maps and institutional affiliations.

