Article

Service Quality Assessment of App-Based Demand-Responsive Public Transit Services in Lahore, Pakistan

by
Muhammad Abdullah
1,
Nazam Ali
1,
Syed Arif Hussain Shah
2,3,
Muhammad Ashraf Javid
4 and
Tiziana Campisi
5,*
1
Department of Civil Engineering, School of Engineering, University of Management and Technology, Lahore 54782, Pakistan
2
Department of City and Regional Planning, University of Engineering and Technology, Lahore 54890, Pakistan
3
Graduate School of Science and Engineering, Saitama University, Saitama 338-0825, Japan
4
Department of Civil and Environmental Engineering, University of Nizwa, Birkat-al-Mouz, Nizwa 616, Oman
5
Faculty of Engineering and Architecture, University of Enna KORE, Cittadella Universitaria, 94100 Enna, Italy
*
Author to whom correspondence should be addressed.
Appl. Sci. 2021, 11(4), 1911; https://doi.org/10.3390/app11041911
Submission received: 29 January 2021 / Revised: 17 February 2021 / Accepted: 18 February 2021 / Published: 22 February 2021
(This article belongs to the Special Issue Urban Transport Systems Efficiency, Network Planning and Safety)

Abstract

:
App-based demand-responsive transit (DRT) services are emerging where conventional public transport is unable to meet the demand. SWVL (choice A) and Airlift (choice B) are two such DRT bus services operating in Lahore, Pakistan. It is important for the policy makers and operators to evaluate the satisfaction levels of the passengers using these services. This study evaluated passengers’ satisfaction regarding choice A and choice B through a questionnaire survey. A total of 440 responses were collected from the users of the DRT services through personal interviews and a web-based approach. Factor analysis on the collected data produced two underlying factors, namely service-attributes and bus ambiance. Ordinal regression showed that the service-attributes and ambiance were significant predictors of overall satisfaction levels about choice A. Service-attributes indicated a larger positive impact on overall satisfaction with choice A as compared to ambiance. Although the ordinal model for choice B fitted the data well, the predictors were found to be insignificant. The results offer an insight into which predictors affect the overall satisfaction and how it can be improved.

1. Introduction

Traditional public transport is facing growing challenges to meet the mobility needs, especially in the developing countries. Deteriorating quality of public transport creates space for alternative transport services. One such alternative transport service is demand-responsive transport (DRT). It is a flexible transport service where operation is determined by the demand generated by the users. Typically, users register their demand through a calling service, which helps in planning the routes for pick and drop. Its usage is higher at places where public transport is either not available [1] or in developing countries where public transport is not able to meet the demand ([2]. The DRT service is useful for areas with a low demand for transport (such as suburbs), but recently, due to the COVID-19 pandemic in some countries, this service has become of paramount importance as severe restrictions have been placed on the number of passengers on board public and private transport to avoid possible contagion in addition to the declined use of public transport [3,4,5,6]. Several studies have supported the potential of DRT services to provide sustainable local public transport. Some of the DRT schemes in use worldwide meet social needs, such as access to commercial facilities or hospitals, but face cost problems. Furthermore, institutional barriers for new DRT schemes have to be overcome in order to develop a sustainable local public transport system [7]. Recent advances in technology have made it possible for the passengers to register their demand through Smartphone apps using an internet connection. Such app-based DRT services are operating in several countries and are more accessible, comfortable, and affordable for the passengers [8]. It is important for the operators to know if the DRT services can attract existing and future users. User satisfaction levels can provide valuable information to the operators about what aspect of the service needs to be improved. Reliability, frequency, comfort, on-time performance, travel speed, and service frequency are important factors of user satisfaction [9,10]. A common technique to measure user satisfaction levels is through user satisfaction surveys.
App-based DRT services are gradually emerging in Lahore because of deteriorating quality of public transport. SWVL (choice A) and Airlift (choice B) bus services are two popular examples of such service in Lahore. Both choice A and choice B are operating along several routes across Lahore. Users have the option to suggest new routes through the apps. The services then prioritize the launch of new routes after proper planning and analysis. There is a need to determine the satisfaction levels of the users of these app-based DRT services as well as the elements of these services that are most valued by the users. Earlier studies did not put much emphasis on perceptions about spatial coverage and easiness in booking ride through an App, driver’s behavior, and ambiance of the vehicles. In addition, it is essential to assess the overall satisfaction with these App-based DRT services since they are likely to affect already deteriorating public transport ridership. The current study addresses this gap and is among the first of its kind in the context of app-based DRT services in Lahore.
The primary objective of this study was to explore passengers’ satisfaction with app-based DRT services in Lahore, namely SWVL and Airlift. A questionnaire was developed to collect the required data. Exploratory factor analysis was then conducted to explore the factors affecting passengers’ satisfaction levels. Factor scores were calculated, and further statistical analysis was carried out. Finally, ordinal regression models were developed to model the relationship between overall satisfaction level and the explanatory variables.
The rest of this paper is organized as follows: the next section will discuss the relevant literature on determining passenger satisfaction levels regarding public transport through user satisfaction surveys. Section 3 discusses the method employed to collect the necessary data. Section 4 presents the results obtained through exploratory factor analysis and ordinal regression models. This is followed by discussion. Finally, conclusions are drawn, and recommendations are made for further studies. The flow chart in Figure 1 shows the research approach adopted for this study.

2. Literature Review

In general, how well a service meets the expectations of the customers can be referred to as service quality. [11] defined the service quality as: “the degree and direction of discrepancy between customers’ service perceptions and expectations.” However, there is no consensus on the definition of service quality. A summary of the concept of service quality can be found in [12]. Although the concept of service quality may seem difficult to define, its importance for organizations, institutions, and companies is beyond doubt. Similarly, the concept of customer satisfaction is not straightforward. In general, customer satisfaction can be referred to the assessment of the perceptions of customers about their expectations of the quality of a particular service and the actual quality that the service offers. In general, the basis of the customer satisfaction is perceived by its value, which specific products or services are able to offer. A summary of the literature of the concept of customer satisfaction can be found in [13]. A user satisfaction survey is a common way of determining passengers’ satisfaction regarding the quality of a transport service. The key factors affecting passengers’ satisfaction of the service quality can be determined and subsequent improvements can be made to increase the passengers’ satisfaction levels [14]. There are numerous studies that have attempted to study customer satisfaction in Public Transportation.
Public transport is often characterized by different users, so it is necessary to analyze a number of variables in order to optimize the service. These include socio-demographic variables, which show gender inequality in some countries [15], social exclusion [16] considering for example age distribution, but also variables related to travel habits [17,18] and travel distance [19]. The exploration of public opinion is also of great importance for the implementation of planning strategies by local authorities and can, therefore, also help service companies in the optimal definition of transport, reducing the use of private transport and thus promoting decarbonization [20,21,22].
The efficiency of DRT services and the optimization of the transport offer can be defined by analytical models developed and applied to real cases by identifying critical demand thresholds for alternative modes. They can highlight the trade-offs between cost and service level that a transport operator or mobility provider has to consider in order to implement a successful service [23].
A study conducted in Agartala, India, concluded that comfort and flexibility are the key factors affecting passengers’ mode choice behavior [24,25] found that public transport users valued waiting time, cleanliness, and comfort the most. A study conducted in Scotland found three underlying factors affecting passenger’s perception of quality of service in public transport. The underlying factors were identified as convenience, cabin environment, and ease of use. Females were found to show relatively negative opinions about cabin environment [26,27] employed factor analysis to explore the underlying factors affecting the transit ridership and the levels of satisfaction when using transport services. They found that comfort, safety, and information are the factors that residents value the most, whereas the tourists were found to place more focus on service production, reflecting route frequencies and reliability of service. [28] found that cleanliness and ventilation in the vehicle are likely to increase user satisfaction of the quality of service of public transport system. A study conducted in three different cities of Indonesia on passengers’ perceptions about para-transit found that security was the first and foremost concern for passengers in all the three cities [29,30] found three factors, namely comfort, performance, and assurance, affecting perceived service quality of public transport among young passengers. A study conducted in Phnom Penh, Cambodia, found that the commuters perceive comfort and availability of public transport to be more important [31]. The implications of a study conducted in Calgary, Canada, were that increasing transit service reliability and convenience can significantly improve transit ridership [32,33] investigated the valuation of time in public transport compared with car travel time, walk time, wait time, and headway time and recommended that frequent, more accessible, and faster bus service is imperative to reduce and compensate for the high value of time attached to British bus system. Another study by [34] suggested that necessity, time saving, and low-cost transport services can be used as a behavioral change strategy in modal shift from personalized vehicles to public transport in neighborhoods where most travelers are students. [35] argued that on-time performance and security are important latent variables for female travelers of public transport in Indonesia. In a study conducted in Dhaka city, [36] claimed that punctuality, reliability, and service features are an important dimension for the success of public transport in the developing countries. [37] reported that safety, comfort, capacity, responsiveness, reliability, and tangible are six important dimensions of concern for public transport users in Bali, Indonesia. [38] found waiting time at a stop, trip purpose, profession, income, and vehicle ownership to be significant predictors of users’ attitudes and preferences with app-based DRT services in Lahore, Pakistan. A study conducted on 100 bus lines in Beijing referred that the lowest satisfactory scores are pertinent to timeliness, which might be influenced by travel purpose and travel time. A study conducted by [39] in Lahore, Pakistan, highlighted that symbolic information, time, and cost are important variables for Daewoo public bus service riders. In another study, conducted on acceptance of metro-bus service in Lahore, [40] proposed that reliability, friendliness, and instrumental dimensions of service quality played an important role for passenger’s positive preference towards this particular public transport service.
As it is evident from the literature mentioned above, user satisfaction surveys are an important and commonly used tool for evaluating passenger satisfaction levels regarding transport services. Reliability, frequency, comfort, on-time performance, travel speed, cleanliness, and service frequency are the key elements affecting passenger satisfaction levels. Most of the studies conducted so far discussed the performance of traditional bus and DRT services. As per authors’ best knowledge, there are no past studies on user satisfaction about app-based DRT in Pakistan. The current study addresses this gap in the body of literature.

3. Methods

3.1. Questionnaire Survey

In order to explore the underlying factors affecting user’s satisfaction levels regarding app-based DRT services, a questionnaire consisting of four different sections was designed. The first section included questions on demographic features such as gender, age group, education, car ownership, etc. The second section contained basic questions such as travelling frequency, purpose of travelling, preferred mode of travel, etc. The third section consisted of questions about convenience and scheduling, while the fourth section contained the items designed to measure the satisfaction level with the services provided by choice A and choice B. All these sections contained closed-type questions unless specified otherwise. The respondents were instructed to answer the items using a 5-point Likert scale in the third and fourth sections. Five-point Likert scales were chosen seeking the reliability of the anticipated data and easiness of the target respondents. The service quality attributes in part 4 were selected considering the offered service level and social aspects of choice A and choice B.
Two common methods of administering a questionnaire are personal approach and self-administered approach. In the former approach, questions are asked directly to the correspondents, whereas in the latter approach, participants are given access to the questionnaire. Both approaches were adopted in this study considering the easiness and convenience of the respondents. Students from University of Engineering and Technology, Lahore, conducted the survey. They were properly briefed about the study before the commencement of the survey.
Face-to-face surveys carried out with anonymous distribution allow interviews to be carried out with unknown people (e.g., customers of a service) or simply residents or passers-by in a certain area. Usually, at the beginning of the interview (or at the end), some socio-demographic data of the respondent are requested. This procedure allows us to build up a list of respondents for future surveys or marketing actions.
The face-to-face interview method is very useful for planning interventions related to the development of a product/service, concerning:
(a)
Customer Satisfaction and Experience;
(b)
Label and Concept Test;
(c)
Brand awareness;
(d)
Pre-Post Advertising Test;
(e)
Promotion Test.
In general, critical issues related to face-to-face interviews include
(a)
Interviewer bias;
(b)
High cost per participant;
(c)
Geographical limitations;
(d)
Time pressure on respondents.
These were overcome by a reasonable length of the questionnaire, which took no more than 15 min.
A further disadvantage is the monitoring of the interviewer, who may not have developed a perfect method of asking the questions, and who may, therefore, risk undermining the goodness and neutrality of the interview. This was overcome by the participation of the well-trained university students who interviewed the users.

3.2. Sample Size and Survey Locations

This research study was conducted in Lahore, Pakistan. It is the second-largest city of Pakistan with a population of about 11.13 million people and an area of approximately 1772 sq. km. It is a business and education hub besides its unique cultural and socio-economic importance in the region. The growing demand for public transport was an important consideration for conducting this research study in Lahore. Both SWVL and Airlift decide the launch of their new routes after proper planning and analysis upon receiving route suggestions from their prospective users. The travelers book their ride by providing origin-destination information using the respective mobile apps and access the buses at the closest bus stop locations designated by both services. The fare structure of choice B is based on distance travelled and routes, and ranges from Rs. 20 to 200, whereas, choice B operates on flat fare basis. Both services use air-conditioned vehicles with choice B offering a live tracking feature as well. Figure 2 shows some routes of both choice A and B.
The respondents of this research study are the residents of Lahore who have used these app-based DRT services. The survey locations were chosen based on the locations of bus stops for choice A and choice B. The main routes along which these services operate were effective locations where appropriate responses could be measured. The real-time positions of the respondents were recorded using GPS devices. A total of 440 samples were collected from respondents, out of which 392 (89.09%) were collected at the bus stop locations and 48 (10.9%) using the web-based questionnaire. The number of people using a bus stop was a factor in determining the frequency of the surveys to be collected at that location. The routes and stop locations are shown in Figure 2. As can be seen in Figure 2, the routes of these services overlapped at some bus stop locations. Therefore, the responses were collected at the overlapping locations depending on the demand for each service at that location. Students from University of Engineering and Technology, Lahore, conducted the survey. They were properly briefed about the study before the commencement of the survey. Two types of respondents were targeted in this study: people who were traveling in these services and people who were waiting at the bus stops for these services. The data were collected between November and December of 2019. The responses were totally anonymous in order to maintain the confidentiality of any personal details.

3.3. Data Analysis Methods

Exploratory factor analysis (EFA) [41] was conducted on the items in section D of the questionnaire in order to explore the underlying factors affecting users’ satisfaction regarding the choice A and choice B. This formal measurement model is useful when both observed and latent variables are assumed to be measured at the interval level. A characteristic of EFA is that the observed variables are first standardized (mean of zero and standard deviation of 1). EFA is executed on the correlation matrix between the items. In EFA, a latent variable is called a factor and the correlations between latent and observed variables are called factor loadings. Factor loadings are standardized regression weights.
Principal axis factoring was used as the factor extraction method because maximum likelihood and principal axis factoring are found to provide better results depending on the normality of the data [42]. Orthogonal Varimax rotation was used to obtain interpretable underlying factors.
For further statistical analyses, a numerical value, known as factor score, is required for each participant to represent its relative standing on the extracted underlying factors. There are two common methods of computing factors scores: non-refined and refined methods. In this study, a non-refined factor computation method, average sum scores, was used to compute the factor scores because they are simpler and easier to interpret [43]. The factor scores were not normally distributed. Therefore, the effect of the demographic variables on the factor scores was evaluated using non-parametric tests such as Mann–Whitney U test and Kruskal Wallis test, Spearman’s correlation. Ordinal regression was conducted to model the relationship between overall satisfaction and the explanatory variables. The statistical software package SPSS v. 20 was used for all the statistical analyses.

4. Results

4.1. Descriptive Analysis

Demographics of the respondents are shown in Table 1. Two hundred ninety-three (293) participants completed the questionnaire for choice A. Out of these 293 participants, 232 were men (79%) and 61 were women (21%). Most of the participants belonged to the youngest age group, aged < 30 (79.2%), followed by middle-aged group, aged 30–50 (19.5%). Only 1.4% belonged to the oldest age group, aged > 50. The major purpose of travelling was reported to be education and work, with 58% and 34%, respectively.
On the other hand, two hundred (200) participants completed the questionnaire for choice B. Out of the 200 participants, 146 were men (73%) and 54 were women (27%). Most of the participants belonged to the youngest age group, aged < 30 (79%), followed by middle-aged group, aged 30–50 (20%). Only 1% belonged to the oldest age group, aged > 50. Again, the major purpose of travelling was reported to be education and work, with 54% and 40%, respectively. The distribution of responses to satisfaction levels (section D of the questionnaire) is shown in Table 2.
It can be seen that most of the respondents were young males, which could be explained by the fact that younger people are more likely to be familiar with new technologies since these DRT services employ smart-phone apps for booking rides, and a relatively smaller proportion of females work in Pakistan as compared to their counterparts.

4.2. Factor Analysis

SWVL (Choice A)
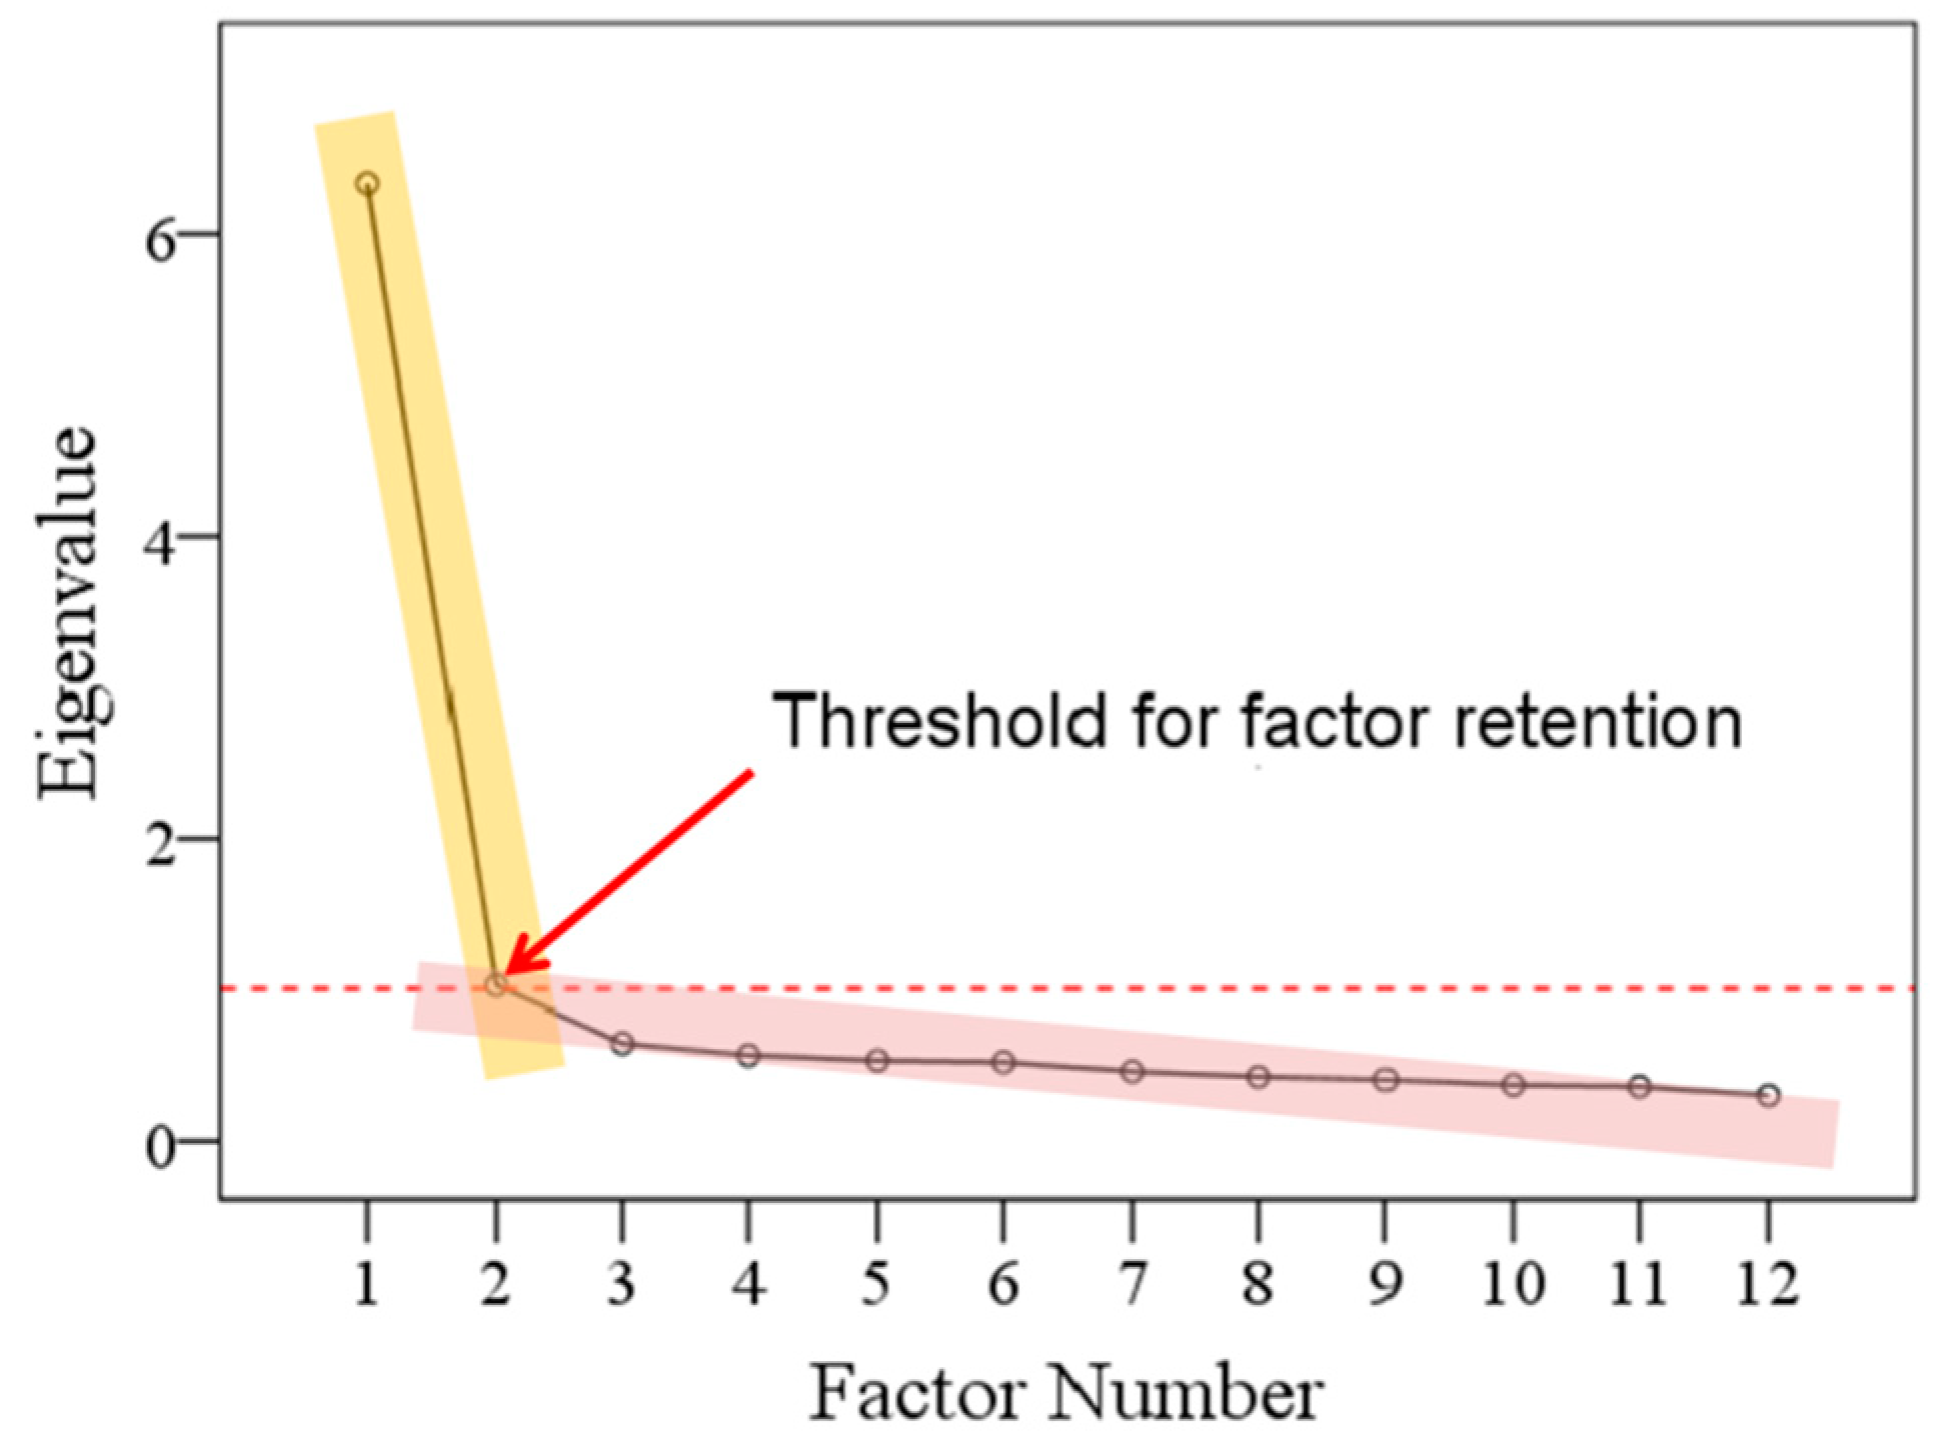
A two-factor solution was obtained based on eigenvalues >1 criterion, which explained about 53.84% of the total variance. However, this criterion has the tendency to produce incorrect results [44]. Hence, a better approach is needed to determine the number of factors to retain from a scree plot [42]. The kink in the scree plot, shown in Figure 3, showed that it is adequate to choose a two-factor solution. Heavily cross loaded items were removed. A very high value of Cronbach’s alpha for factor 1 indicated that several items loaded on this factor were essentially measuring the same thing. Hence, highly similar items were removed.
The factor loadings are presented in Table 3. A cut-off value of 0.5 was used for item loadings, i.e., the items with loadings below this value were removed. The sampling adequacy was satisfactory (Kaiser–Meyer–Olkin measure = 0.944), Bartlett’s test of sphericity was significant (0.000), and the determinant of the matrix was 0.002.
The first axis explained 27.457% of the total variance. The six items loaded on this factor were travel time savings, accessibility, equity, speed, incentive system, and information system. Therefore, this factor can be referred to as “service-attributes.” The second axis explained 26.383% of the total variance. The six items loaded on this axis were safety, security, cleanliness, affordability, environmental impacts, and comfort. Therefore, this factor may be referred to as the “ambience” of the bus. Cronbach’s alpha was adequate for both factors, i.e., 0.870 and 0.872, respectively, suggesting that the items have high internal consistency.
Factor scores were not normally distributed; thus, nonparametric tests such as Spearman’s correlation, Mann–Whitney U test, and Kruskal Wallis test were used for further statistical analyses. The effects of demographical attributes on the underlying factors are presented below.
Satisfaction with service-attributes (factor 1) was not statistically significantly between men and women (ZU = −0.216, p = 0.829), younger and older age groups (ZU = −0.042, p = 0.966), single and married (ZU = −0.495, p = 0.620), those with a driving license and those without (ZU = −0.100, p = 0.921), car owners and non-car owners (ZU= −0.133, p = 0.894), and motorcycle owners and non-motorcycle owners (ZU = −1.766, p = 0.077). Similarly, satisfaction with ambience (factor 2) was not statistically different between genders (ZU = −0.429, p = 0.668), younger and older age groups (ZU = −1.328, p = 0.184), single and married (ZU = −1.657, p = 0.098), those with a driving license and those without (ZU = −0.055, p = 0.956), car owners and non-car owners (ZU = −0.301, p = 0.763), and motorcycle and non-motorcycle owners (ZU = −0.525, p = 0.600).
No statistically significant correlation was found between income and satisfaction with service-attributes (rho = 0.032, p = 0.591), family members and satisfaction with service-attributes (rho = −0.035, p = 0.548), and education level and satisfaction with service-attributes (rho = −0.032. p = 0.580). Similarly, no statistically significant correlation was found between income and satisfaction with ambience (rho = 0.063, p = 0.282), family members and satisfaction ambience (rho = 0.072, p = 0.216), and education level and satisfaction with ambience (rho = −0.109, p = 0.061).
Airlift (Choice B)
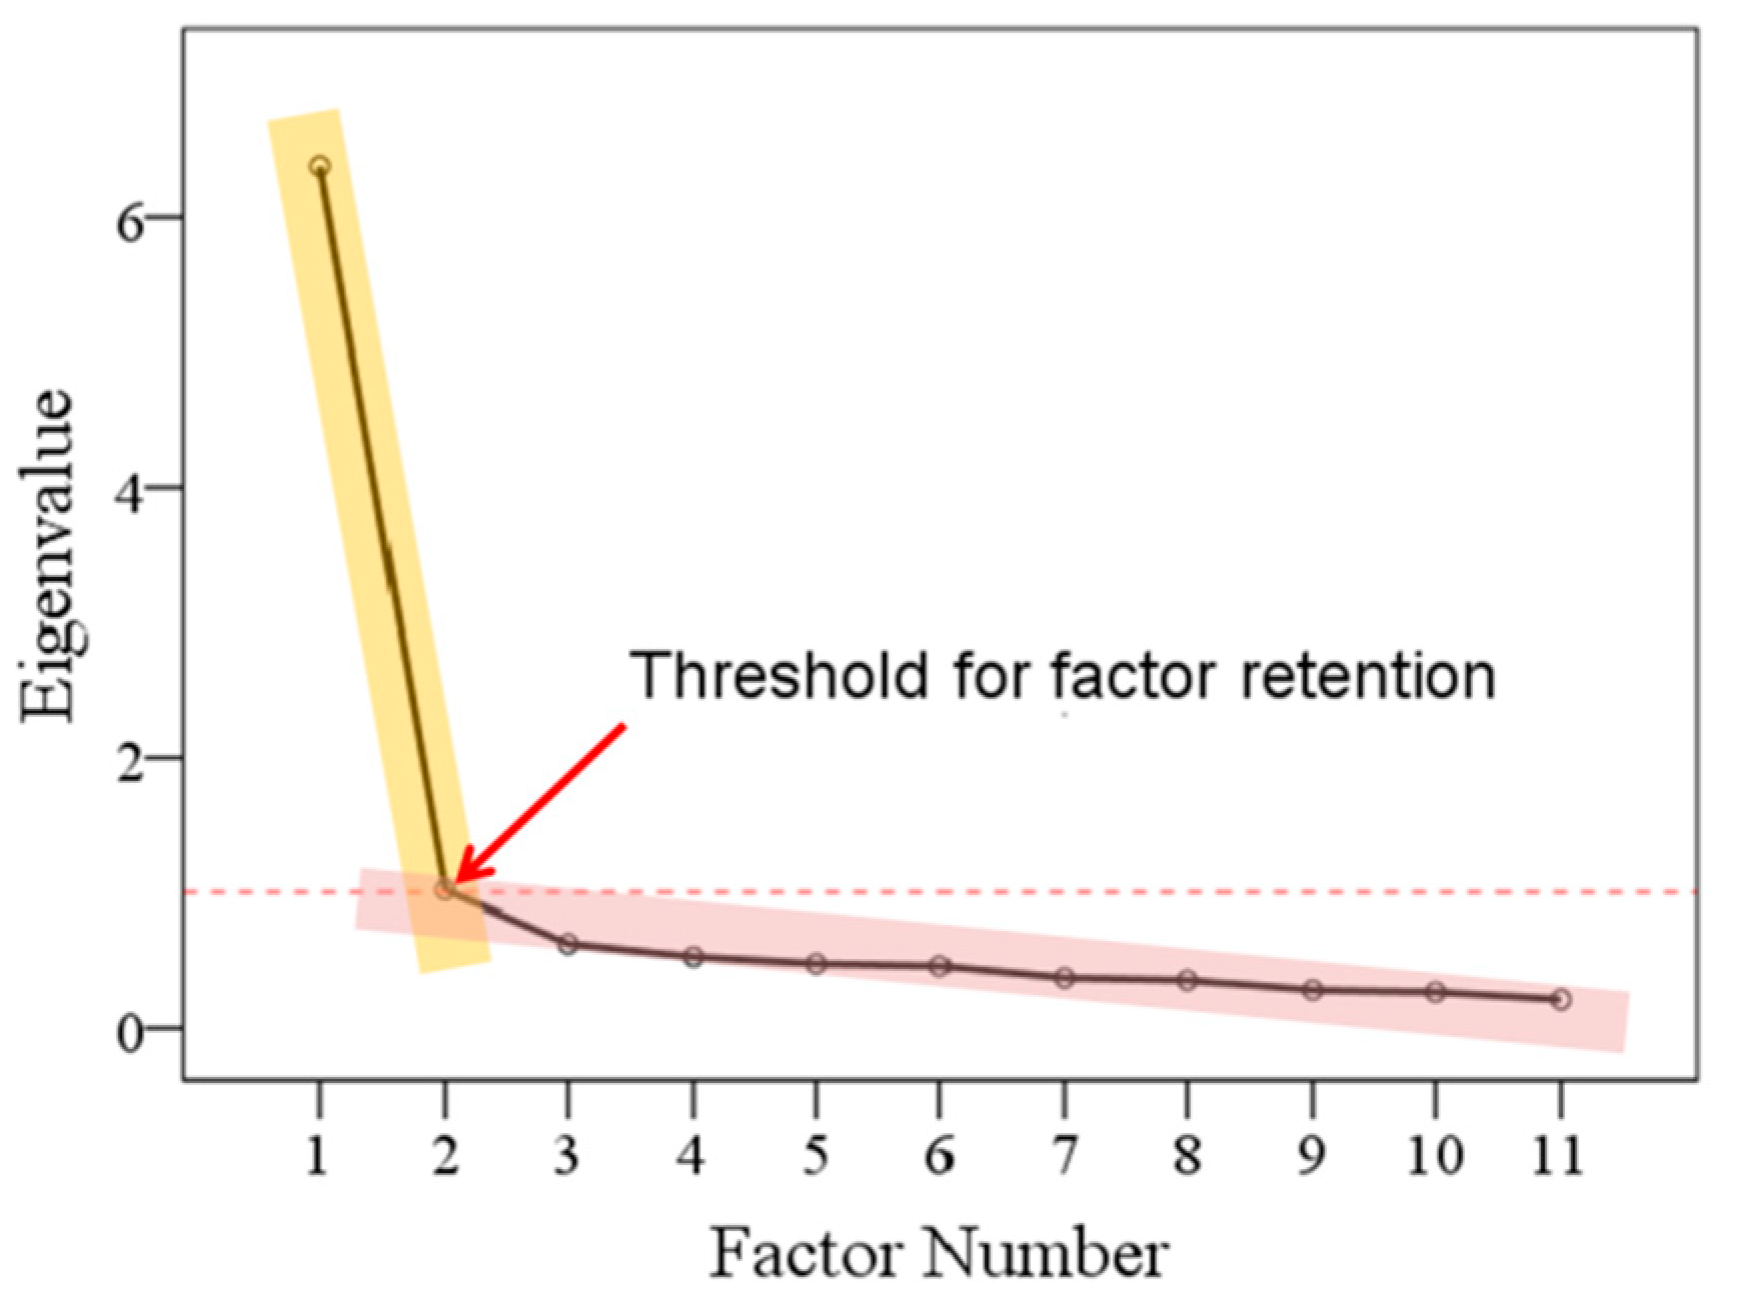
A two-factor solution was obtained based on eigenvalues >1 criterion, which explained about 59.86% of the total variance. In addition, the kink in the scree plot (Figure 4) shows that it is adequate to choose a two-factor solution. Heavily cross loaded items were removed. The factor loadings are presented in Table 4. The items with loadings below 0.5 were removed. The sampling adequacy was satisfactory (Kaiser–Meyer–Olkin measure = 0.924), Bartlett’s test of sphericity was significant (0.000), and the determinant of the matrix was 0.001.
The first axis explained 31.281%of the total variance. The six items loaded on this factor were travel time savings, complaint handling, fare collection system, route alignment or coverage, speed, and incentive system. Therefore, this factor can be referred to as “service-attributes.” The Cronbach’s alpha for these six items was 0.892, suggesting that the items have high internal consistency. The second axis explained 28.583% of the total variance. The five items loaded on this axis were safety, security, cleanliness, affordability, and environmental impacts. Therefore, this factor may be referred to as the “ambience” of the bus. Cronbach’s alpha was adequate for these items, i.e., >0.7.
Again, factor scores were not normally distributed; therefore, nonparametric tests such as Spearman’s correlation, Mann–Whitney U test, and Kruskal Wallis test were used for further statistical analyses. The effects of demographical attributes on the underlying factors are presented below.
Satisfaction with service-attributes (factor 1) was not statistically significantly between men and women (ZU = −1.806, p = 0.071), younger and older age groups (ZU = −0.732, p = 0.464), single and married (ZU = −1.095, p = 0.273), those with a driving license and those without (ZU = −0.260, p = 0.795), car owners and non-car owners (ZU= −0.133, p = 0.894), and motorcycle owners and non-motorcycle owners (ZU = −3.330, p = 0.001). Similarly, satisfaction with ambience (factor 2) was not statistically different between genders (ZU = −1.499, p = 0.134), younger and older age groups (ZU = −1.170, p = 0.242), single and married (ZU = −1.514, p = 0.130), those with a driving license and those without (ZU = −0.374, p = 0.709), and car owners and non-car owners (ZU = −1.306, p = 0.191). Satisfaction with ambience was statistically significant different between motorcycle owners and non-motorcycle owners (ZU = −2.052, p = 0.040).
No statistically significant correlation was found between income and satisfaction with service-attributes attributes (rho = 0.013, p = 0.856), and family members and satisfaction with service-attributes (rho = −0.001, p = 0.986). There was a very weak significant correlation between education level and satisfaction with service-attributes (rho = −0.174. p = 0.013). No statistically significant correlation was found between income and satisfaction with ambience (rho = 0.082, p = 0.248), and family members and satisfaction ambience (rho = −0.018, p = 0.798). However, there was a very weak significant correlation between education level and satisfaction with ambience (rho = −0.169. p = 0.017).

4.3. Ordinal Regression

Finally, the relationship between an outcome variable and the explanatory variables was modeled. The outcome variable was the last ordinal item in section D of the questionnaire, i.e., different levels of respondents’ satisfaction with overall performance of choice A and choice B. The explanatory variables included demographic features (section A), the items in section C of the questionnaire, and the factor scores computed in Section 3.2. Since the outcome variable was an ordinal variable, it does not make sense to assume normality and equality of variances. Hence, ordinal regression was used to model the relationship between the ordinal outcome variable and the explanatory variables. Logit function was used as the link function.
SWVL (Choice A)
Before going into the model details, it is necessary to check if the model is capable of providing suitable predictions. The significant chi-square statistic in Table 5 shows that the model is a significant improvement over the intercept-only model. The goodness-of-fit can be determined using the Pearson statistic and Deviance statistic. The non-significant test results for Pearson statistic (χ2 = 629.324, df = 711, p = 0.987) and Deviance statistic (χ2 = 356.739, df = 711, p = 1.000) indicate that the model is a good fit to the data and the model predictions are similar [45].
Cox and Snell, Nagelkerke, and McFadden pseudo R square measures indicate how well the model explains the variations in the data and were 0.415, 0.481, and 0.270, respectively. A pseudo R square value of 0.27 for McFadden showed an excellent fit [46]. The non-significant chi-square statistic (χ2 = 18.057, df= 18, p = 0.452) indicated that the test of parallel lines was satisfied.
Parameter estimates for ordinal regression are shown in Table 6. The sign of the coefficients for covariates indicates direct or inverse relationships between continuous predictors and the ordinal outcome variable. The relative values of the coefficients for factor levels can help explain the effects of the categorical predictors in the model. The sign of a coefficient for a factor level indicates the effect of a particular-factor level relative to the reference category.
For a one unit increase in satisfaction with service-attributes (factor 1), ordered log odds of being in a higher level of overall satisfaction are expected to increase by 1.714 such that all other variables in the model are kept constant. Similarly, one unit increase in satisfaction with ambience (factor 2) is expected to increase the ordered log odds of being in a higher level of overall satisfaction by 0.871. The regression coefficients for income show that passengers in the lower income groups are expected to be more satisfied with overall service of choice A. Passengers in the younger age groups and those traveling more often are likely to be less satisfied with overall service of choice A.
Airlift (Choice B)
The significant chi-square statistic in Table 7 shows that the model is a significant improvement over the intercept-only model. The pseudo R square values for Cox and Snell, Nagelkerke, and McFadden were 0.078, 0.092, and 0.042, respectively, indicating that the model does not do a good job at explaining the variations in the data. Nevertheless, the model is significant and does explain the variance in the data to some extent. The non-significant test results for Pearson statistic (χ2 = 291.328, df = 294, p = 0.533) and Deviance statistic (χ2 = 270.682, df = 294, p = 0.832) indicate that the model predictions are similar. In addition, the non-significant chi-square statistic (χ2 = 8.460, df= 6, p = 0.206) indicated that the test of parallel lines was satisfied.
However, as shown in Table 8, none of the predictors are found to be significant except level of income, which shows that the passengers in the middle-income category are expected to be more satisfied with the overall service provided by choice B as compared to those in the higher income category.

5. Discussion

The primary purpose of this study was to explore passengers’ satisfaction with Demand-Responsive transport (DRT) in Lahore, Pakistan. Two DRT services are currently operating in Lahore, namely SWVL (choice A) and Airlift (choice B). A questionnaire was prepared for both services and data were collected using personal interview and a web-based approach. A total of 440 samples were collected. It is to be noted that there is no universal consensus among the research community on the threshold for minimum sample size. Correct factor structure can be obtained for sample sizes even less than 50 given that communalities are high, number of variables per factor are high, and the number of extracted factors is small [47]. The descriptive analysis indicated that most of the DRT users are young, single, and students.
Factor analysis was performed on the collected data, which yielded two underlying factors, namely service-attributes and ambience for both choice A and choice B. [48] also found similar underlying constructs. Overall, demographic factors except motorcycle ownership and education level were found to have no effect on the underlying constructs obtained through factor analysis. Those who owned a motorcycle reported to be more satisfied with service-attributes and ambiance of choice B bus service. A possible explanation for this is the amount of safety risk involved with riding a motorcycle in a big city of Pakistan [49]. Also, a weak negative correlation was found between education level and service-attributes as well as between education and ambience of choice B service. [50] also found education to be negatively correlated with the perceived quality of public transport. Other studies have also found education level to affect passengers’ travel choices [26,51]. In addition, the fact that this study did not find a difference between male and female passengers’ satisfaction levels is in line with the results reported by [52].
Ordinal regression was performed to model the relationship between overall satisfaction and the continuous and binary predictors. The model fitted the data well for choice A. Factors underlying the service quality were found to be significant predictors for overall satisfaction. The coefficients indicated that an increase in satisfaction with service-attributes and ambience of the bus service is likely to increase overall satisfaction with the services. Furthermore, improvement in service-attributes is likely to bring more of an increase in overall satisfaction than improvement in ambience of these services. It implies that the items loading on service-attributes such as travel time saving, accessibility, equity, speed, incentive system, and information system can be improved to obtain a positive change in overall satisfaction. Passengers in the lower income groups were found to be more satisfied with choice A. It could be attributed to the fact that the low-income passengers are likely to be captive users as they might not be able to afford their own private vehicles for travelling, whereas, those in the higher income category can afford to use their own private vehicles and, therefore, appear to be less satisfied with choice A. The passengers in the younger age groups have a lower likelihood of overall satisfaction with choice A. This is in line with the results reported by [53]. Ref. [54] also reported that frequent users’ satisfaction may be lower because they are more exposed to negative incidents. The ordinal model for choice B fitted the data well; however, predictors were found to be insignificant except that the middle-income group is more likely to be satisfied with overall service as compared to the high-income group, possibly indicating that those in the middle-income category may not be able to afford private vehicles, which is supported by existing literature [55]. Nonetheless, an improvement in service-attributes was again found to have an increase in overall satisfaction with choice B, although it was non-significant.

6. Conclusions

The transport sector today mainly uses fossil fuels and contributes significantly to emissions of pollutant gases and greenhouse gases, which are harmful to health and responsible for altering the environment. Hence, there is a need to move toward more sustainable modes of transport by offering alternative modes of transport (collective, shared, etc.), and designing and marketing vehicles that are more energy efficient and less dependent on fossil fuels. The optimization of public transport services can facilitate a reduction in the use of private vehicles without penalizing the mobility of individuals. The introduction of app-based DRT services can fulfill the travel needs in low-demand areas around the world. The widespread use of apps can also help to disseminate the concept of mobility as a service (Maas). Furthermore, the direct participation of users in the formulation and improvement of public transport services including DRT services must be strongly encouraged if companies want to optimize services and encourage the spread of multimodality.
This paper evaluated the passengers’ satisfaction with services offered by demand-responsive transport (DRT) services in Lahore, namely SWVL (choice A) and Airlift (choice B). The results offer an insight into which predictors affect the overall satisfaction and how it can be improved. This study is a first of its kind in the context of Lahore. Data were collected using a personal and web-based approach.
Factor analysis was conducted on the data, which yielded two underlying factors for both DRT services and were labeled as service-attributes and ambiance. Users with motorcycle ownership were found to be more satisfied with service-attributes and ambiance of choice B. Education had a negative weak correlation with the underlying factors implying that users with higher education levels are less satisfied with choice B service. Previous studies have also found a negative correlation between users’ education levels and public transport satisfaction.
Ordinal regression showed that underlying factors were significant predictors of overall user satisfaction with choice A. Service-attributes had a larger positive impact on overall satisfaction with choice A as compared to ambiance. Hence, more investment can be geared towards the items loading on service-attributes to improve the overall satisfaction regarding choice A. Passengers in the lower income categories and older age group showed more overall satisfaction with choice A. The ordinal model for choice B fitted the data well; however, predictors were broadly found to be insignificant.
Certain policy implications can be drawn based on the results of this study. Frequent travelers, which are mainly students, can be given special discounts and memberships in order to retain them. Similarly, focusing more on service-attributes such as travel time saving, spatial coverage, and speed can increase overall satisfaction especially with choice A. A more open procedure about adding new routes should be defined. In addition, outlining a clear mechanism regarding fare collection procedures is likely to improve overall satisfaction. Since most of the users are students, the frequency, timing, and routes can be aligned with the timings of the educational institutions along the routes to attract more users.
This study had some limitations. The responses were collected from current users of DRT services only, whereas, there is a need to collect responses from non-users too in order to understand the reasons why they avoid using DRT. In addition, there are other factors such as personal traits and social and cultural constraints that might affect the overall satisfaction with these transport services. Hence, future research in this area should take into account these factors. Nonetheless, the findings of this study provide important insights into the prospects of DRT services in Lahore and would help in developing appropriate policies for demand responsive transit. The findings also have significant implications for other developing countries with similar socio-economic and -demographic attributes.

Author Contributions

Conceptualization, M.A., N.A., S.A.H.S. and M.A.J.; methodology, M.A.; data collection, N.A., S.A.H.S., and M.A.J.; data analysis, M.A.; writing— original draft preparation, M.A., N.A., S.A.H.S., M.A.J. and T.C.; writing—review and editing, M.A., N.A., S.A.H.S., M.A.J. and T.C.; funding, T.C. All authors have read and agreed to the published version of the manuscript.

Funding

The authors acknowledge financial support from the MIUR (Ministry of Education, Universities and Research [Italy]) through a project entitled WEAKI TRANSIT: WEAK-demand areas Innovative TRANsport Shared services for Italian Towns (Project code: 20174ARRHT /CUP Code: J74I19000320008), financed with the PRIN 2017 (Research Projects of National Relevance) program. We authorize the MIUR to reproduce and distribute reprints for Governmental purposes, notwithstanding any copyright notations thereon. Any opinions, findings, and conclusions or recommendations expressed in this material are those of the authors and do not necessarily reflect the views of the MIUR.

Institutional Review Board Statement

Not applicable.

Informed Consent Statement

Informed consent was obtained from all subjects involved in the study.

Data Availability Statement

The data presented in this study are available on request from the corresponding authors. The data are not publicly available because certain measures are still need to be used in other studies.

Conflicts of Interest

The authors declare no conflict of interest.

References

  1. Anspacher, D.; Khattak, A.J.; Yim, Y. Demand-Responsive Transit Shuttles: Who Will Use Them? California PATH: Berkely, CA, USA, 2004. [Google Scholar]
  2. Cervero, R.; Golub, A. Informal transport: A global perspective. Transp. Policy 2007, 14, 445–457. [Google Scholar] [CrossRef]
  3. Lakatos, A.; Tóth, J.; Mándoki, P. Demand Responsive Transport Service of ‘Dead-End Villages’ in Interurban Traffic. Sustainability 2020, 12, 3820. [Google Scholar] [CrossRef]
  4. Ahangari, S.; Chavis, C.; Jeihani, M. Public Transit Ridership Analysis during the COVID-19 Pandemic. medRxiv 2020. [Google Scholar] [CrossRef]
  5. Giuffrida, N.; Le Pira, M.; Inturri, G.; Ignaccolo, M. Addressing the public transport ridership/coverage dilemma in small cities: A spatial approach. Case Stud. Transp. Policy 2020. [Google Scholar] [CrossRef]
  6. Abdullah, M.; Dias, C.; Muley, D.; Shahin, M. Exploring the impacts of COVID-19 on travel behavior and mode preferences. Transp. Res. Interdiscip. Perspect. 2020, 8, 100255. [Google Scholar] [CrossRef]
  7. Ryley, T.J.; Stanley, P.A.; Enoch, M.P.; Zanni, A.M.; Quddus, M.A. Investigating the contribution of Demand Responsive Transport to a sustainable local public transport system. Res. Transp. Econ. 2014, 48, 364–372. [Google Scholar] [CrossRef] [Green Version]
  8. Yasin, I.; Awan, M.A.N. Digitization of Transport Service in Pakistan: A Consumer Perspective. Int. J. Bus. Manag. 2018, 2, 17–22. [Google Scholar]
  9. Beirão, G.; Cabral, J.S. Understanding attitudes towards public transport and private car: A qualitative study. Transp. Policy 2007, 14, 478–489. [Google Scholar] [CrossRef]
  10. Mouwen, A. Drivers of customer satisfaction with public transport services. Transp. Res. Part A: Policy Pr. 2015, 78, 1–20. [Google Scholar] [CrossRef]
  11. Parasuraman, A.; Zeithaml, V.A.; Berry, L.L. SERVQUAL: A multiple-item scale for measuring con- sumer perceptions of service quality. J. Retail. 1988, 64, 12–40. [Google Scholar]
  12. Fonseca, F.; Pinto, S.; Brito, C. Service Quality and Customer Satisfaction in Public Transports; Universidade do Porto: Porto, Portugal, 2010. [Google Scholar]
  13. Biesok, F. Customers are the key factor of the existence and company development on the market. Mark. Logist. Probl. Manag. Organ. 2011, 6, 23–41. [Google Scholar]
  14. De Oña, J.; De Oña, R. Quality of Service in Public Transport Based on Customer Satisfaction Surveys: A Review and Assessment of Methodological Approaches. Transp. Sci. 2015, 49, 605–622. [Google Scholar] [CrossRef]
  15. Al-Rashid, M.A.; Nahiduzzaman, K.M.; Ahmed, S.; Campisi, T.; Akgün, N. Gender-Responsive Public Transportation in the Dammam Metropolitan Region, Saudi Arabia. Sustainability 2020, 12, 9068. [Google Scholar] [CrossRef]
  16. Al-Rashid, M.A.; Goh, H.C.; Harumain, Y.A.S.; Ali, Z.; Campisi, T.; Mahmood, T. Psychosocial barriers of public transport use and social exclusion among older adults: Empirical evidence from Lahore, Pakistan. Int. J. Environ. Res. Public Health 2021, 18, 185. [Google Scholar] [CrossRef]
  17. Ahmed, F.; Catchpole, J.; Edirisinghe, T. Understanding Young Commuters’ Mode Choice Decision to Use Private Car or Public Transport from an Extended Theory of Planned Behavior. Transp. Res. Rec. 2020, 0361198120967936. [Google Scholar] [CrossRef]
  18. Bonera, M.; Maternini, G.; Parkhurst, G.; Paddeu, D.; Clayton, W.; Vetturi, D. Travel experience on board urban buses: A comparison between Bristol and Brescia. Eur. Transp. Transp. Eur. 2020, 76, 1–12. [Google Scholar]
  19. Dėdelė, A.; Miškinytė, A.; Andrušaitytė, S.; Nemaniūtė-Gužienė, J. Dependence between travel distance, individual socioeconomic and health-related characteristics, and the choice of the travel mode: A cross-sectional study for Kaunas, Lithuania. J. Transp. Geogr. 2020, 86, 102762. [Google Scholar] [CrossRef]
  20. Campisi, T.; Akgün, N.; Ticali, D.; Tesoriere, G. Exploring Public Opinion on Personal Mobility Vehicle Use: A Case Study in Palermo, Italy. Sustainability 2020, 12, 5460. [Google Scholar] [CrossRef]
  21. Campisi, T.; Ignaccolo, M.; Tesoriere, G.; Inturri, G.; Torrisi, V. The Evaluation of Car-Sharing to Raise Acceptance of Electric Vehicles: Evidences from an Italian Survey among University Students (No. 2020-24-0021). SAE Techn. Paper Ser. 2020. [Google Scholar] [CrossRef]
  22. Tesoriere, G.; Campisi, T. The Benefit of Engage the “Crowd” Encouraging a Bottom-up Approach for Shared Mobility Rating. In Proceedings of the Computational Science and Its Applications—ICCSA 2020, Lecture Notes in Computer Science, Cagliari, Italy, 1–4 July 2020. [Google Scholar] [CrossRef]
  23. Papanikolaou, A.; Basbas, S. Analytical models for comparing Demand Responsive Transport with bus services in low demand interurban areas. Transp. Lett. 2020, 8, 1–8. [Google Scholar] [CrossRef]
  24. Sarkar, P.P.; Mallikarjuna, C. Effect of perception and attitudinal variables on mode choice behavior: A case study of Indian city, Agartala. Travel Behav. Soc. 2018, 12, 108–114. [Google Scholar] [CrossRef]
  25. Dell’Olio, L.; Ibeas, A.; Cecin, P. The quality of service desired by public transport users. Transp. Policy 2011, 18, 217–227. [Google Scholar] [CrossRef]
  26. Morton, C.; Caulfield, B.; Anable, J. Customer perceptions of quality of service in public transport: Evidence for bus transit in Scotland. Case Stud. Transp. Policy 2016, 4, 199–207. [Google Scholar] [CrossRef]
  27. Antoniou, C.; Tyrinopoulos, Y. Factors Affecting Public Transport Use in Touristic Areas. Int. J. Transp. 2013, 1, 91–112. [Google Scholar] [CrossRef]
  28. Grujičić, D.; Ivanović, I.; Jović, J.; Đorić, V. Customer Perception of Service Quality in Public Transport. Transport 2014, 29, 285–295. [Google Scholar] [CrossRef] [Green Version]
  29. Joewono, T.B.; Santoso, D.S.; Susilo, Y. Paratransit Transport in Indonesia: Characteristics and User Perceptions. J. East. Asia Soc. Transp. Stud. 2015, 11, 1346–1361. [Google Scholar] [CrossRef]
  30. Yarmen, M.; Sumaedi, S. Perceived Service Quality of Youth Public Transport Passengers. Transp. Probl. 2016, 11, 99–111. [Google Scholar] [CrossRef]
  31. Eung, N.; Choocharukul, K. Modeling Frequency of Using Informal Public Transport and Public Bus: A Case Study in Phnom Penh, Cambodia. Eng. J. 2018, 22, 109–122. [Google Scholar] [CrossRef]
  32. Habib, K.M.N.; Kattan, L.; Islam, T. Model of personal attitudes towards transit service quality. J. Adv. Transp. 2010, 45, 271–285. [Google Scholar] [CrossRef]
  33. Wardman, M. Public transport values of time. Transp. Policy 2004, 11, 363–377. [Google Scholar] [CrossRef] [Green Version]
  34. Pronello, C.; Camusso, C. Travellers’ profiles definition using statistical multivariate analysis of attitudinal variables. J. Transp. Geogr. 2011, 19, 1294–1308. [Google Scholar] [CrossRef]
  35. Tarigan, A.K.; Susilo, Y.O.; Joewono, T.B. Segmentation of paratransit users based on service quality and travel behaviour in Bandung, Indonesia. Transp. Plan. Technol. 2013, 37, 200–218. [Google Scholar] [CrossRef]
  36. Rahman, F.; Das, T.; Hadiuzzaman, M.; Hossain, S. Perceived service quality of paratransit in developing countries: A structural equation approach. Transp. Res. Part A Policy Pr. 2016, 93, 23–38. [Google Scholar] [CrossRef]
  37. Susilawati, M.; E Nilakusmawati, D.P. Study on the factors affecting the quality of public bus transportation service in Bali Province using factor analysis. J. Phys. Conf. Ser. 2017, 855, 12051. [Google Scholar] [CrossRef] [Green Version]
  38. Javid, M.A.; Ali, N.; Hussain Shah, S.A.; Abdullah, M. Travelers’ Attitudes toward Mobile Application–Based Public Transport Services in Lahore. SAGE Open 2021, 11, 2158244020988709. [Google Scholar] [CrossRef]
  39. Javid, M.A.; Okamura, T.; Nakamura, F. Public Satisfaction with Service Quality of Daewoo Urban Bus Service in Lahore. J. East. Asia Soc. Transp. Stud. 2015, 11, 1097–1108. [Google Scholar]
  40. Javid, M.A.; Abdullah, S.; Hashmi, A.I.; Akbar, M.U.; Ullah, M.G. Passengers’ Attitudes and Preference Towards Metro-Bus Service in Lahore. J. Urban Environ. Eng. 2018, 12, 201–209. [Google Scholar] [CrossRef]
  41. Fabrigar, L.R.; Wegener, D.T. Exploratory Factor Analysis; Oxford University Press (OUP): Oxford, UK, 2011. [Google Scholar]
  42. Costello, A.B.; Osborne, J. Best practices in exploratory factor analysis: Four recommendations for getting the most from your analysis. Pract. Assess. Res. Eval. 2005, 10, 7. [Google Scholar]
  43. DiStefano, C.; Zhu, M.; Mindrila, D. Understanding and using factor scores: Considerations for the applied researcher. Pract. Assess. Res. Eval. 2009, 14, 1–11. [Google Scholar]
  44. Velicer, W.F.; Jackson, D.N. Component Analysis versus Common Factor Analysis: Some Further Observations. Multivar. Behav. Res. 1990, 25, 97–114. [Google Scholar] [CrossRef]
  45. Field, A. Discovering Statistics Using IBM SPSS Statistics, 5th ed.; Sage: Los Angeles, CA, USA, 2018. [Google Scholar]
  46. McFadden, D. Quantitative Methods for Analyzing Travel Behavior of Individuals: Some Recent Developments; Institute of Transportation Studies; University of California: Berkeley, CA, USA, 1977. [Google Scholar]
  47. MacCallum, R.C.; Widaman, K.F.; Zhang, S.; Hong, S. Sample size in factor analysis. Psychol. Meth. 1999, 4, 84. [Google Scholar] [CrossRef]
  48. Budiono, O.A. Customer satisfaction in public bus transport: A study of travelers’ perception in Indonesia. Master’s Thesis, Karlstads Universitet, Karlstad, Sweden, 2009. [Google Scholar]
  49. Ali, A.; Mehraj, J.; Mahmood, S.; Mirza, Z.; Tahir, M. Frequency of risk factors associated with road traffic accidents of motorbike in a big city of a developing country. Ed. Board 2010, 68–72. [Google Scholar]
  50. Yaya, L.H.P.; Fortià, M.F.; Canals, C.S.; Marimon, F. Service quality assessment of public transport and the implication role of demographic characteristics. Public Transp. 2015, 7, 409–428. [Google Scholar] [CrossRef]
  51. Sharaby, N.; Shiftan, Y. The impact of fare integration on travel behavior and transit ridership. Transp. Policy 2012, 21, 63–70. [Google Scholar] [CrossRef]
  52. Avermann, N.; Schlüter, J. Determinants of customer satisfaction with a true door-to-door DRT service in rural Germany. Res. Transp. Bus. Manag. 2019, 32, 100420. [Google Scholar] [CrossRef]
  53. Woldeamanuel, M.G.; Cyganski, R. Factors Affecting Traveller’s Satisfaction with Accessibility to Public Transportation; Association for European Transport and Contributors: Henley-in-Arden, UK, 2011. [Google Scholar]
  54. Van’t Hart, J. Increasing Customer Satisfaction with Public Transport. Master’s Thesis, Delft University of Technology, Delft, The Netherlands, 2012. [Google Scholar]
  55. Ali, N.; Javid, M.A.; Rahim, A. Predicting Transit Mode Choice Behavior from Parents’ Perspectives: A Case Study in Lahore, Pakistan. Jordan J. Civil Eng. 2020, 14, 4. [Google Scholar]
Figure 1. Research methodology adopted for the study.
Applsci 11 01911 g001
Figure 2. Survey locations and route network of app-based demand-responsive transit services in Lahore.
Applsci 11 01911 g002
Figure 3. Scree plot for the Exploratory factor analysis (principal axis factoring with Varimax rotation)—SWVL.
Applsci 11 01911 g003
Figure 4. Scree plot for the EFA (principal axis factoring with Varimax rotation)—Airlift.
Applsci 11 01911 g004
Table 1. Descriptive statistics of respondents’ socio-economic demographics.
AirliftSWVL
N%N%
GenderMale14673.023279.2
Female5427.06120.8
Age<3015879.023279.2
30–504020.05719.5
>5021.041.4
Income<30,0003316.54114.0
30,000–60,00010552.516656.7
>60,0006231.08629.4
Marital StatusSingle16582.523078.5
Married3517.56321.5
ProfessionStudent12160.518563.1
Businessman73.5227.5
Private Employee5628.06421.8
Govt. Employee147.0186.1
Other21.041.4
EducationPrimary1.510.3
Middle1.551.7
High School3718.54314.7
Bachelors12462.019967.9
Master’s and Higher3718.54515.4
Driving LicenseYes7336.512442.3
No12763.516957.7
Family Members1–231.593.1
3–512361.519466.2
5–76934.58529.0
>752.551.7
Car OwnershipYes8140.514047.8
No11959.515352.2
Motorcycle OwnershipYes13366.522877.8
No6532.56522.2
Table 2. Questionnaire items: means, standard deviations (SD), and distribution of responses.
Item.MeanSDDistribution of Responses (%)
12345
Airlift
Service Reliability4.100.993.04.512.540.040.0
Fare Collection System3.960.903.52.015.553.525.5
Safety4.000.933.04.511.651.029.8
Route Alignment or Coverage3.821.014.53.025.140.227.1
Comfort4.070.903.03.09.552.831.7
Security3.950.913.52.016.552.026.0
Complaint-handling3.841.075.63.522.737.930.3
Affordability3.991.034.54.014.043.034.5
Accessibility3.971.003.55.514.044.532.5
Cleanliness4.070.954.02.011.149.033.8
Travel Time Saving3.830.943.03.525.144.224.1
Environmental Impacts3.920.994.04.515.647.228.6
Equity (for impaired or disabled people)3.780.923.54.521.053.018.0
Speed3.950.913.53.014.553.525.5
Attractiveness3.940.883.52.513.557.523.0
Information System3.880.872.54.515.656.820.6
Incentive System3.930.941.54.525.537.031.5
Privacy Concerns3.930.921.57.514.649.227.1
Service Schedule3.841.033.56.023.537.030.0
Pick-up / Drop-off location3.910.964.04.015.051.525.5
Behavior of Drivers4.000.873.52.010.559.524.5
SWVL
Service Reliability4.140.792.01.77.558.030.7
Fare Collection System4.050.771.42.411.958.425.9
Safety4.070.862.42.711.352.431.2
Route Alignment or Coverage3.890.911.45.522.244.426.6
Comfort4.160.811.71.710.351.434.9
Security4.100.831.42.713.749.133.1
Complaint-handling3.870.982.46.222.340.828.4
Affordability4.200.831.43.19.247.139.2
Accessibility4.040.861.44.114.049.830.7
Cleanliness4.110.851.72.413.747.434.8
Travel Time Saving3.930.912.43.420.546.227.4
Environmental Impacts4.090.811.72.411.354.829.8
Equity (for impaired or disabled people)3.940.891.74.419.147.827.0
Speed4.040.851.71.718.247.430.9
Attractiveness4.000.791.42.415.755.624.9
Information System3.840.851.73.424.948.821.2
Incentive System3.900.881.72.725.344.525.7
Privacy Concerns3.890.902.46.213.156.721.6
Service Schedule3.900.882.13.421.248.624.7
Pick-up / Drop-off location3.930.821.42.122.350.324.0
Behavior of Drivers3.960.771.42.116.858.621.2
Note: 1: strongly dissatisfied, 2: dissatisfied, 3: neutral, 4: satisfied, 5: strongly satisfied.
Table 3. SWVL—Principal axis factor analysis of the questionnaire items (Varimax rotation).
ItemsService AttributesAmbiance of the Bus
Travel Time Saving0.715
Accessibility0.659
Equity0.649
Speed0.638
Incentive System0.619
Information System0.578
Affordability 0.765
Comfort 0.651
Security 0.609
Cleanliness 0.605
Environmental Impacts 0.602
Safety 0.590
% of variance explained27.45726.383
Cronbach’s alpha0.8700.872
Table 4. Airlift—Principal axis factor analysis of the questionnaire items (Varimax rotation).
ItemsService AttributesAmbiance of the Bus
Complaint-handling0.698
Fare Collection System0.688
Route Alignment or Coverage0.682
Speed0.672
Travel Time Saving0.668
Incentive System0.651
Affordability 0.712
Safety 0.709
Security 0.704
Environmental Impacts 0.684
Cleanliness 0.616
% of variance explained31.28128.583
Cronbach’s alpha0.8920.882
Table 5. SWVL—Model Fitting Information.
Model−2 Log LikelihoodChi-SquareDfSig.
Intercept Only488.726
Final356.739131.98890.000
Link function: Logit.
Table 6. SWVL—Parameter estimates for ordinal regression.
Item NameRegression CoefficientSig.
[Overall satisfaction = 2.00]2.1120.340
[Overall satisfaction = 3.00]7.0520.001 **
[Overall satisfaction = 4.00]11.1040.000 ***
Service Attributes1.7140.000 ***
Ambiance of the Bus0.8710.033 *
How often do you travel in a week?−0.7310.000 ***
Do you have a plan to travel with Airlift bus service?1.2150.000 ***
Do you have a plan to travel with SWVL bus service?0.5240.047 *
[age < 30 years]−2.8590.027 *
[age = 30–50 years]−2.5680.050 *
[age > 50 years]0a
[monthly income < 30,000 PKR]2.2010.000 ***
[monthly income = 30,000–60,000 PKR]1.4490.000 ***
[income > 60,000 PKR]0a
* significant at p < 0.05; ** significant at p < 0.01; *** significant at p < 0.001.
Table 7. Airlift—Model Fitting Information.
Model−2 Log LikelihoodChi-SquareDfSig.
Intercept Only298.340
Final285.01613.32460.038
Link function: Logit.
Table 8. Airlift—Parameter Estimates for Ordinal Regression.
Item NameRegression CoefficientSig.
[Overall satisfaction = 3.00]0.8880.599
[Overall satisfaction = 4.00]3.7660.028 *
Service Attributes0.1290.684
Ambiance of the Bus0.0680.838
[age < 30 years]1.4650.303
[age = 30–50 years]1.980.177
[age > 50 years]0a
[monthly income < 30,000 PKR]0.3360.52
[monthly income = 30,000–60,000 PKR]0.8030.035 *
[income > 60,000 PKR]0a
* significant at p < 0.05.
Publisher’s Note: MDPI stays neutral with regard to jurisdictional claims in published maps and institutional affiliations.

