
Shake Table Testing of Standard Cold-Formed Steel Storage Rack


Abstract
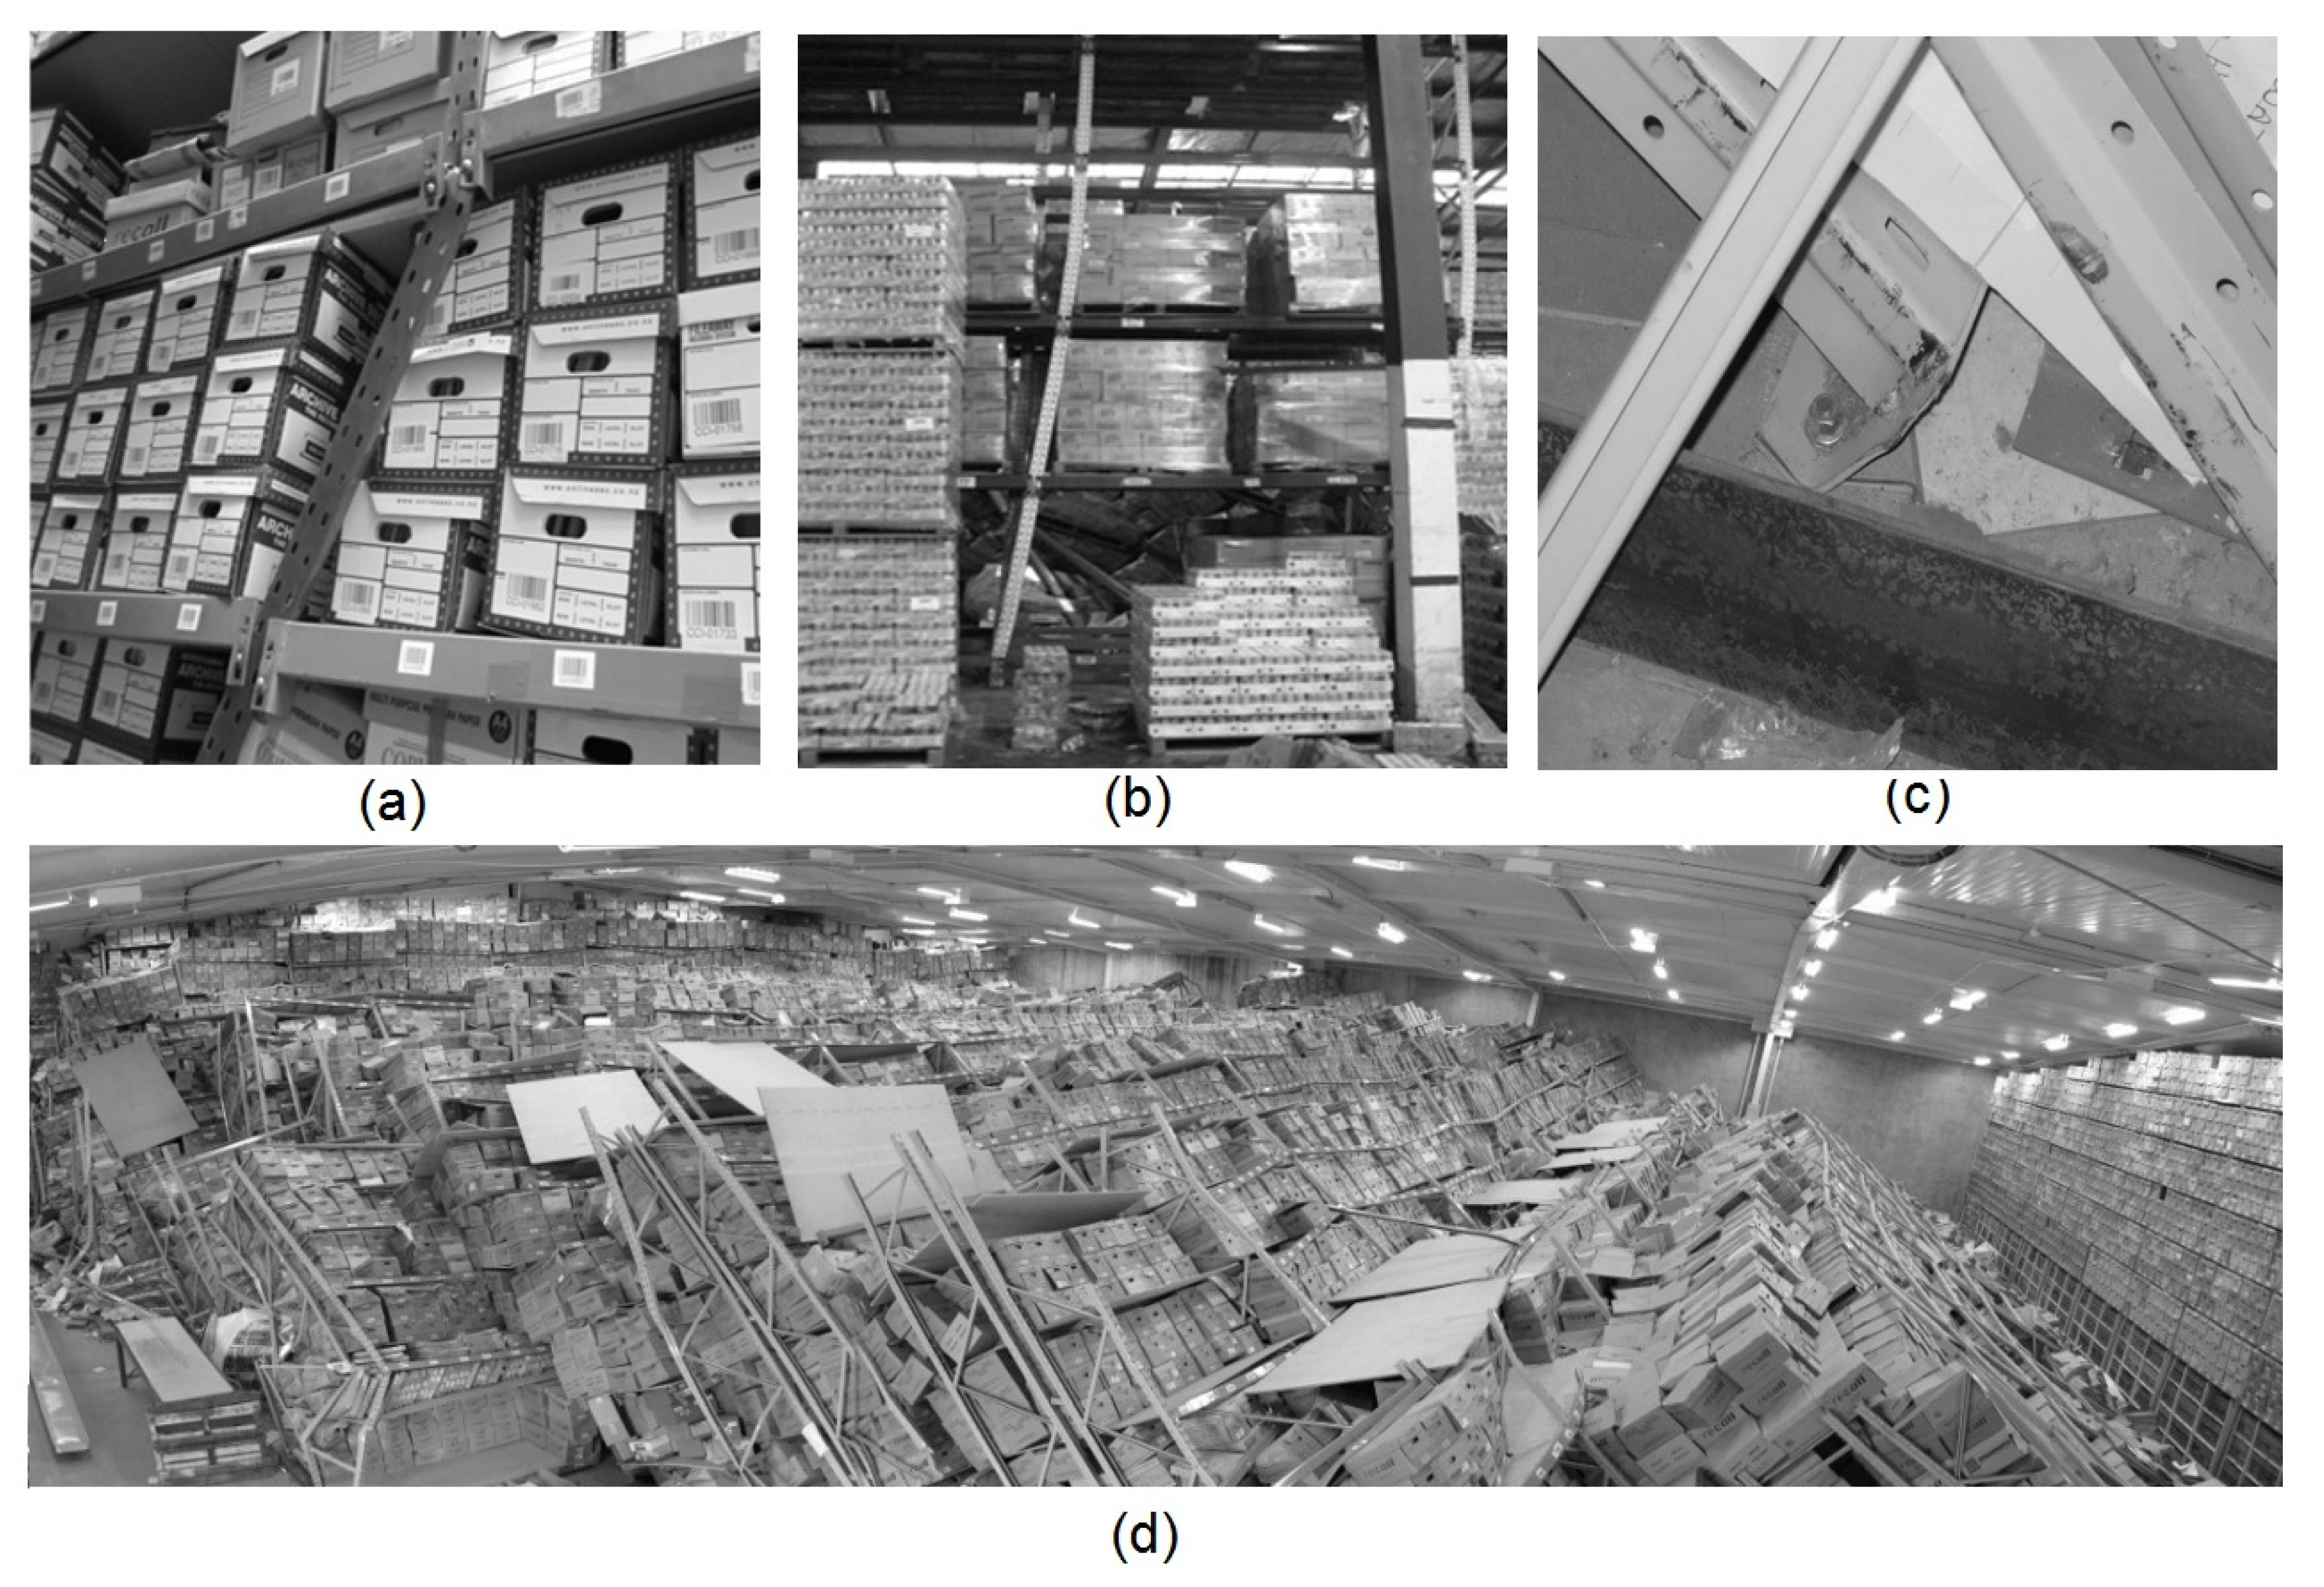
1. Introduction
2. Experimental Program
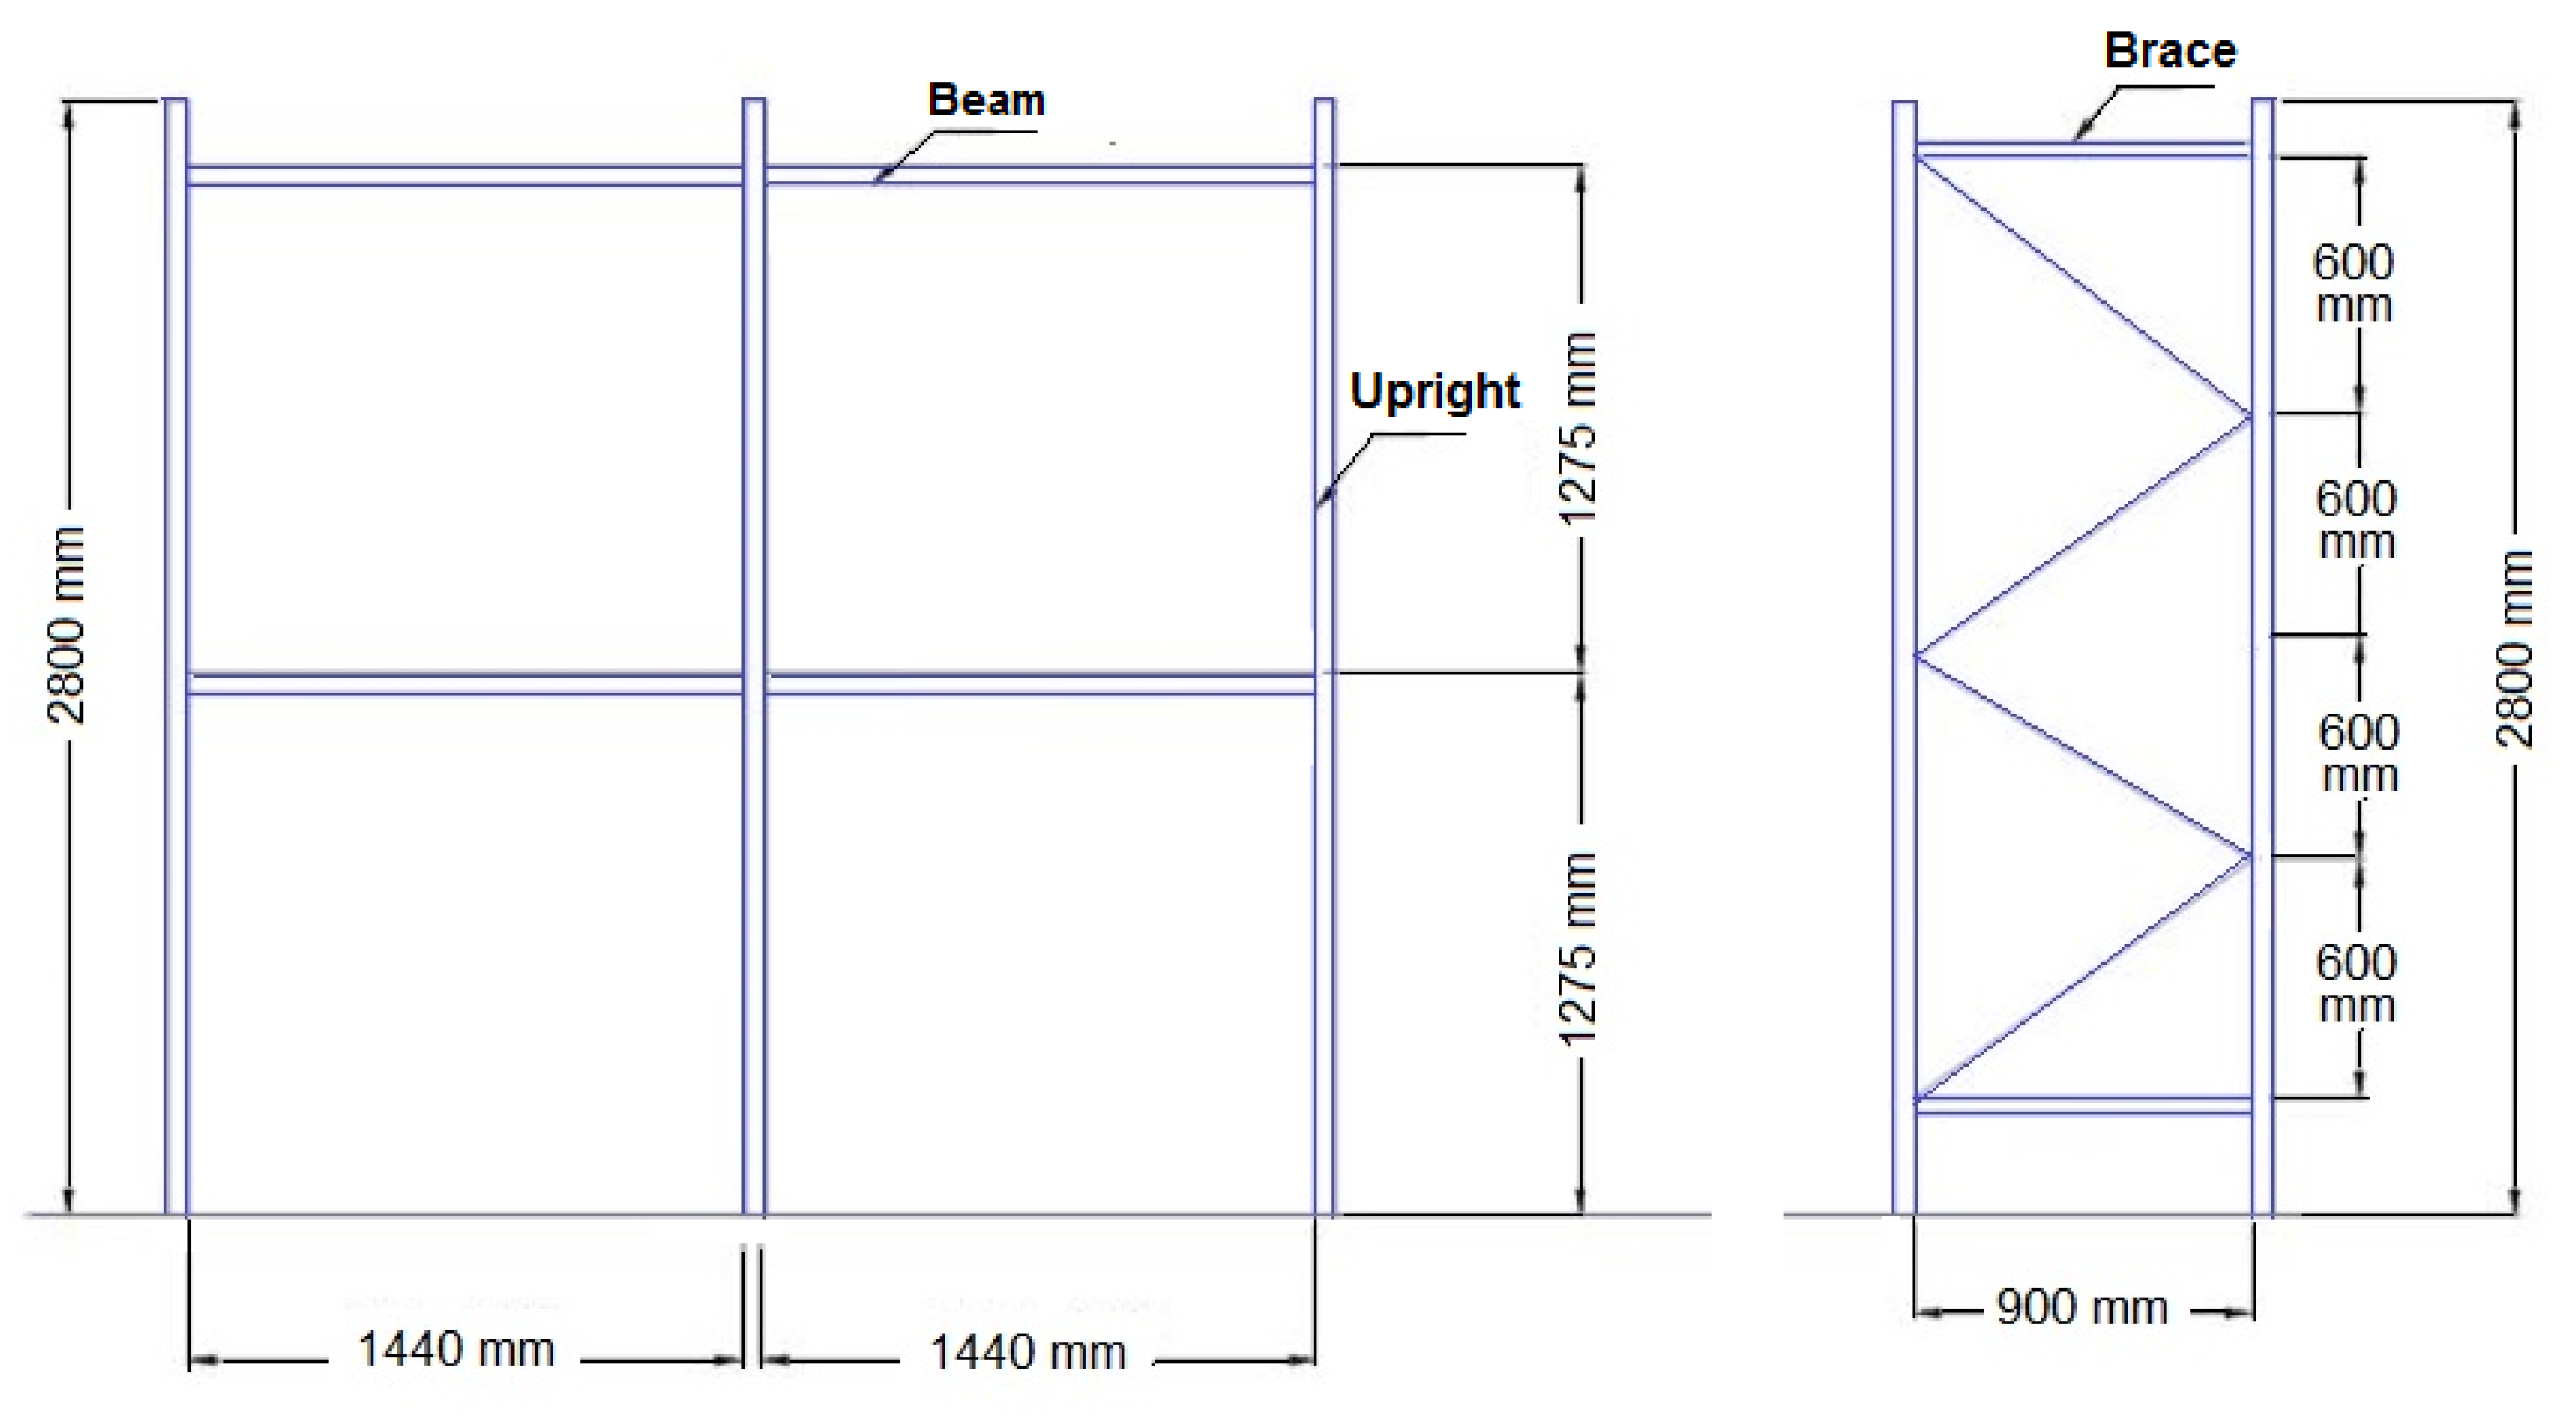
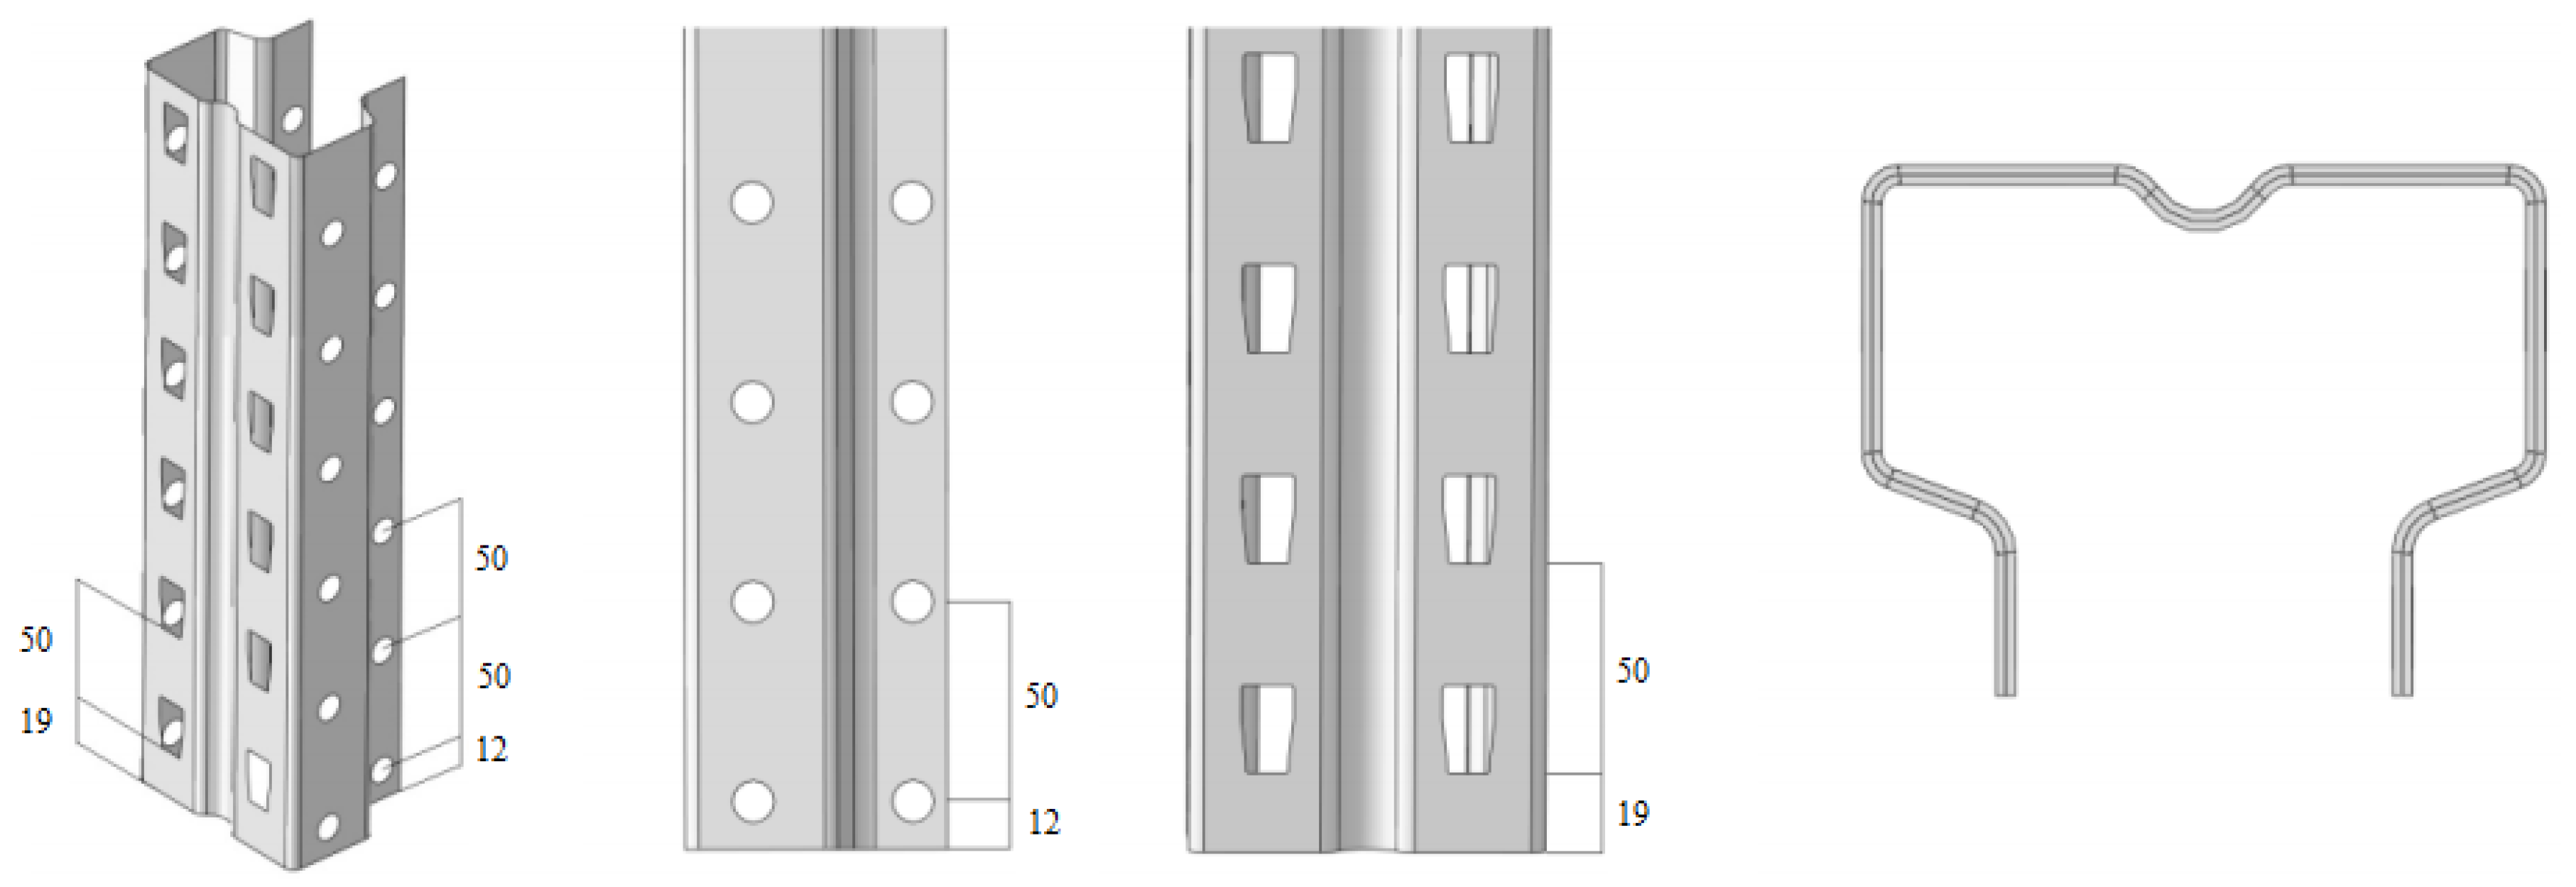
2.1. Rack Geometries
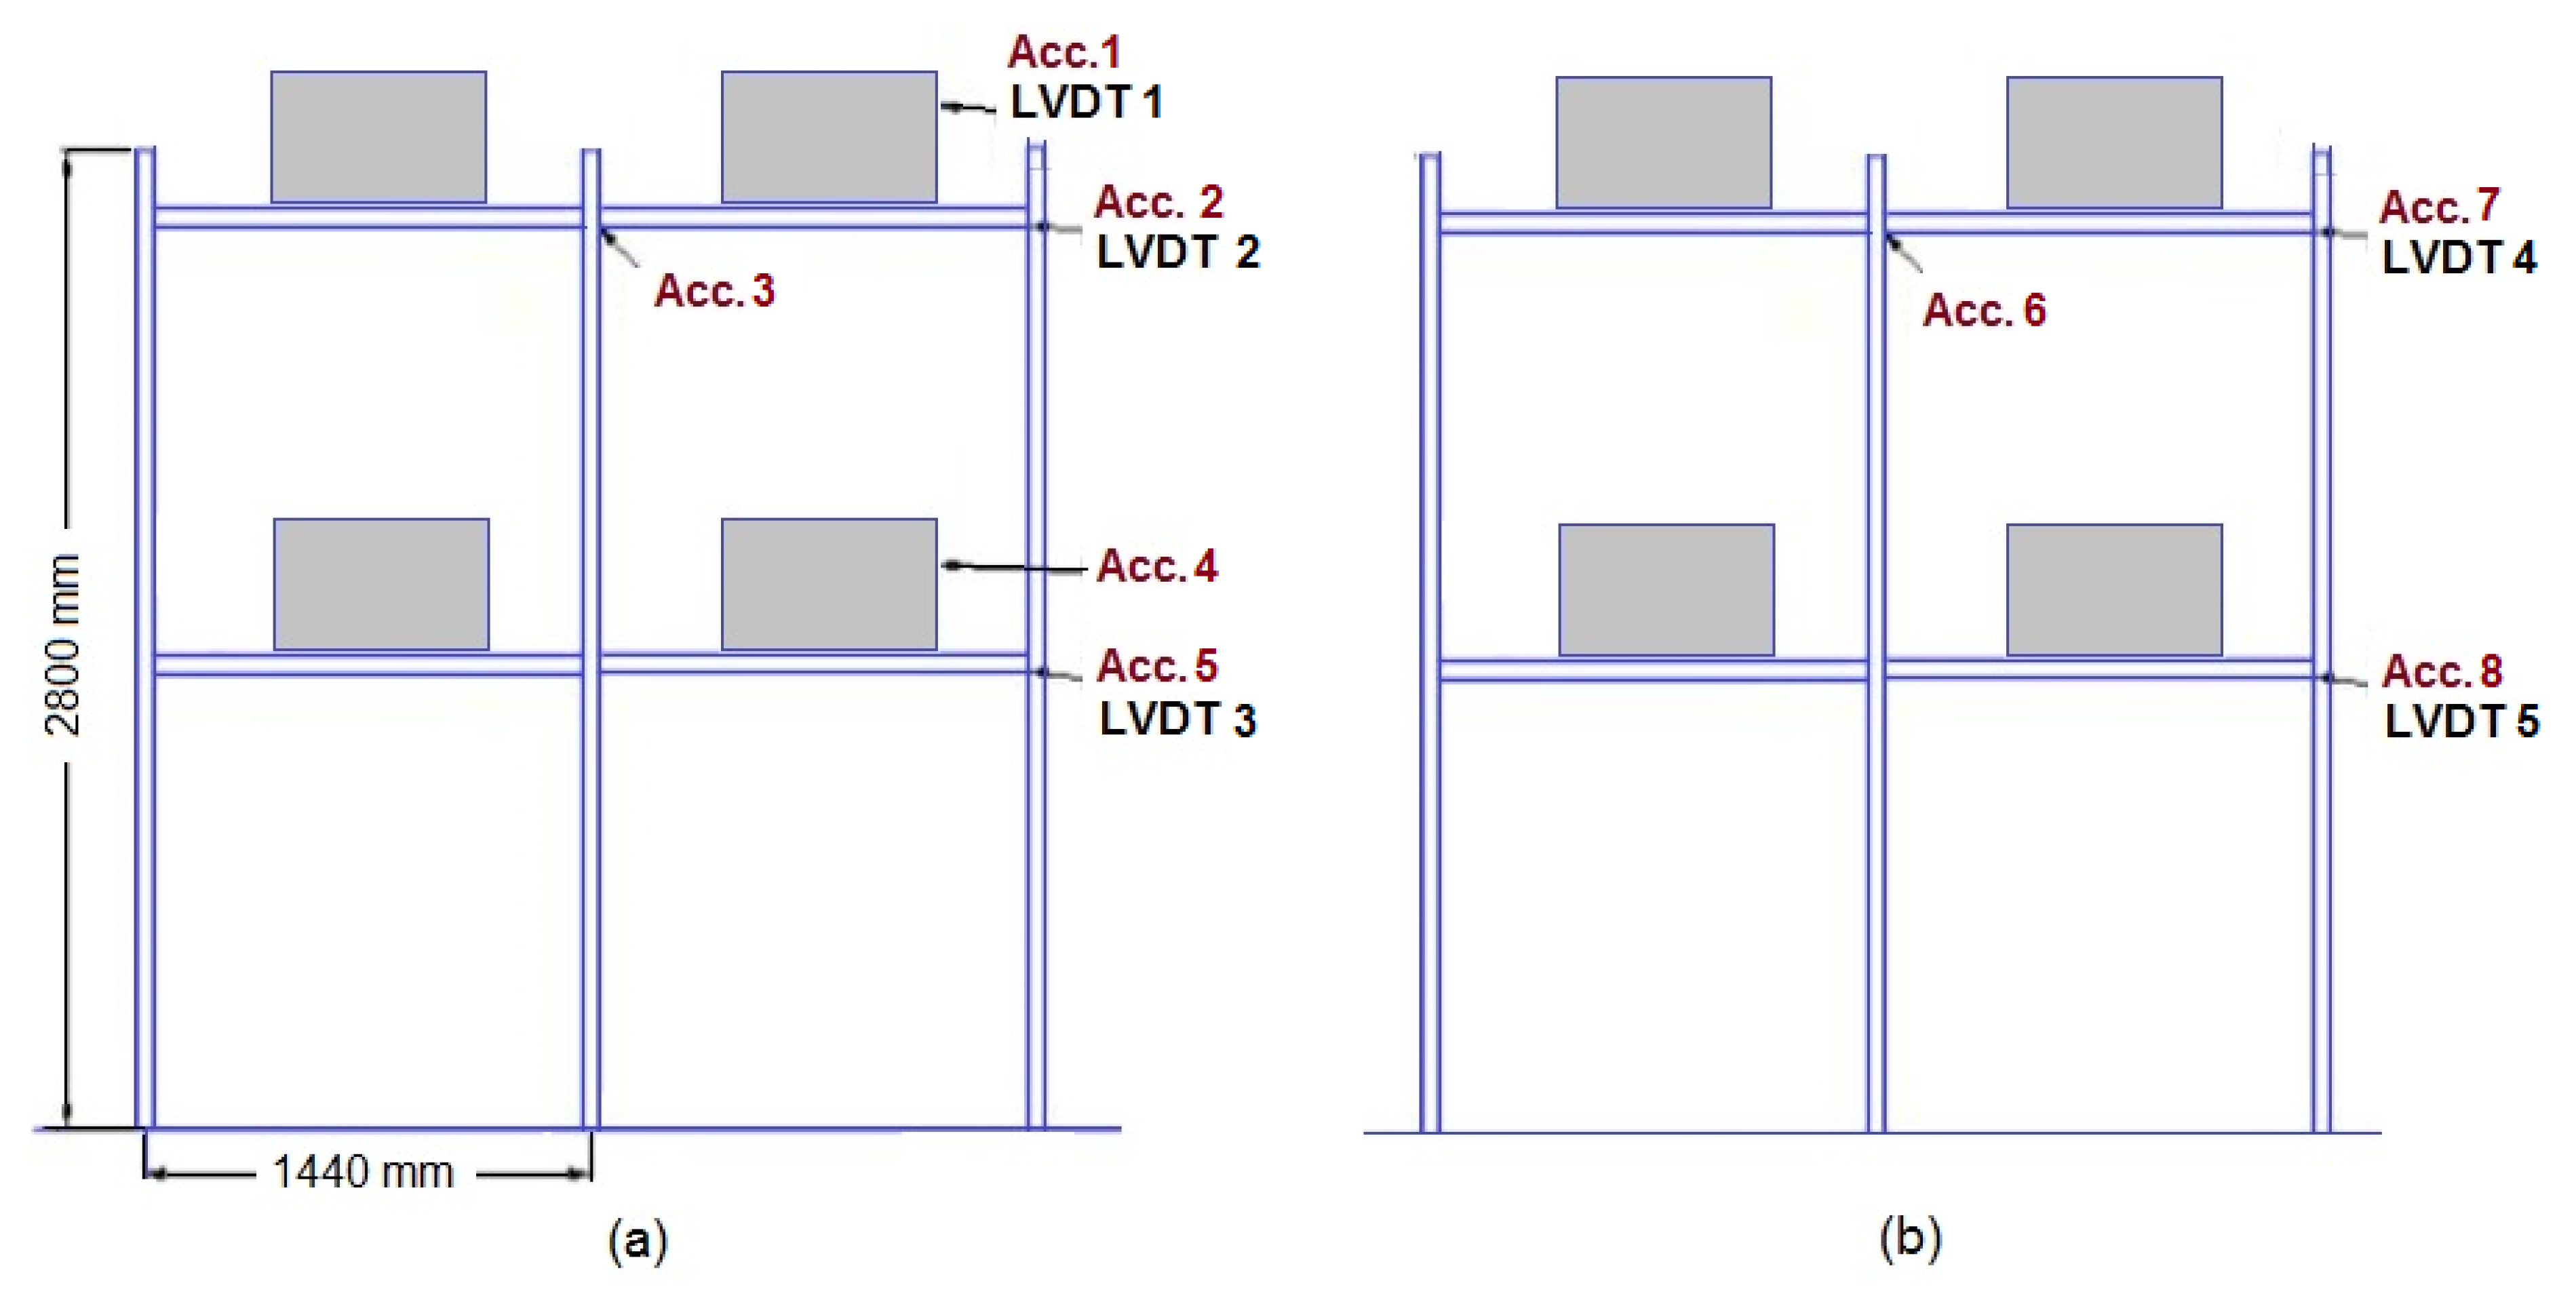
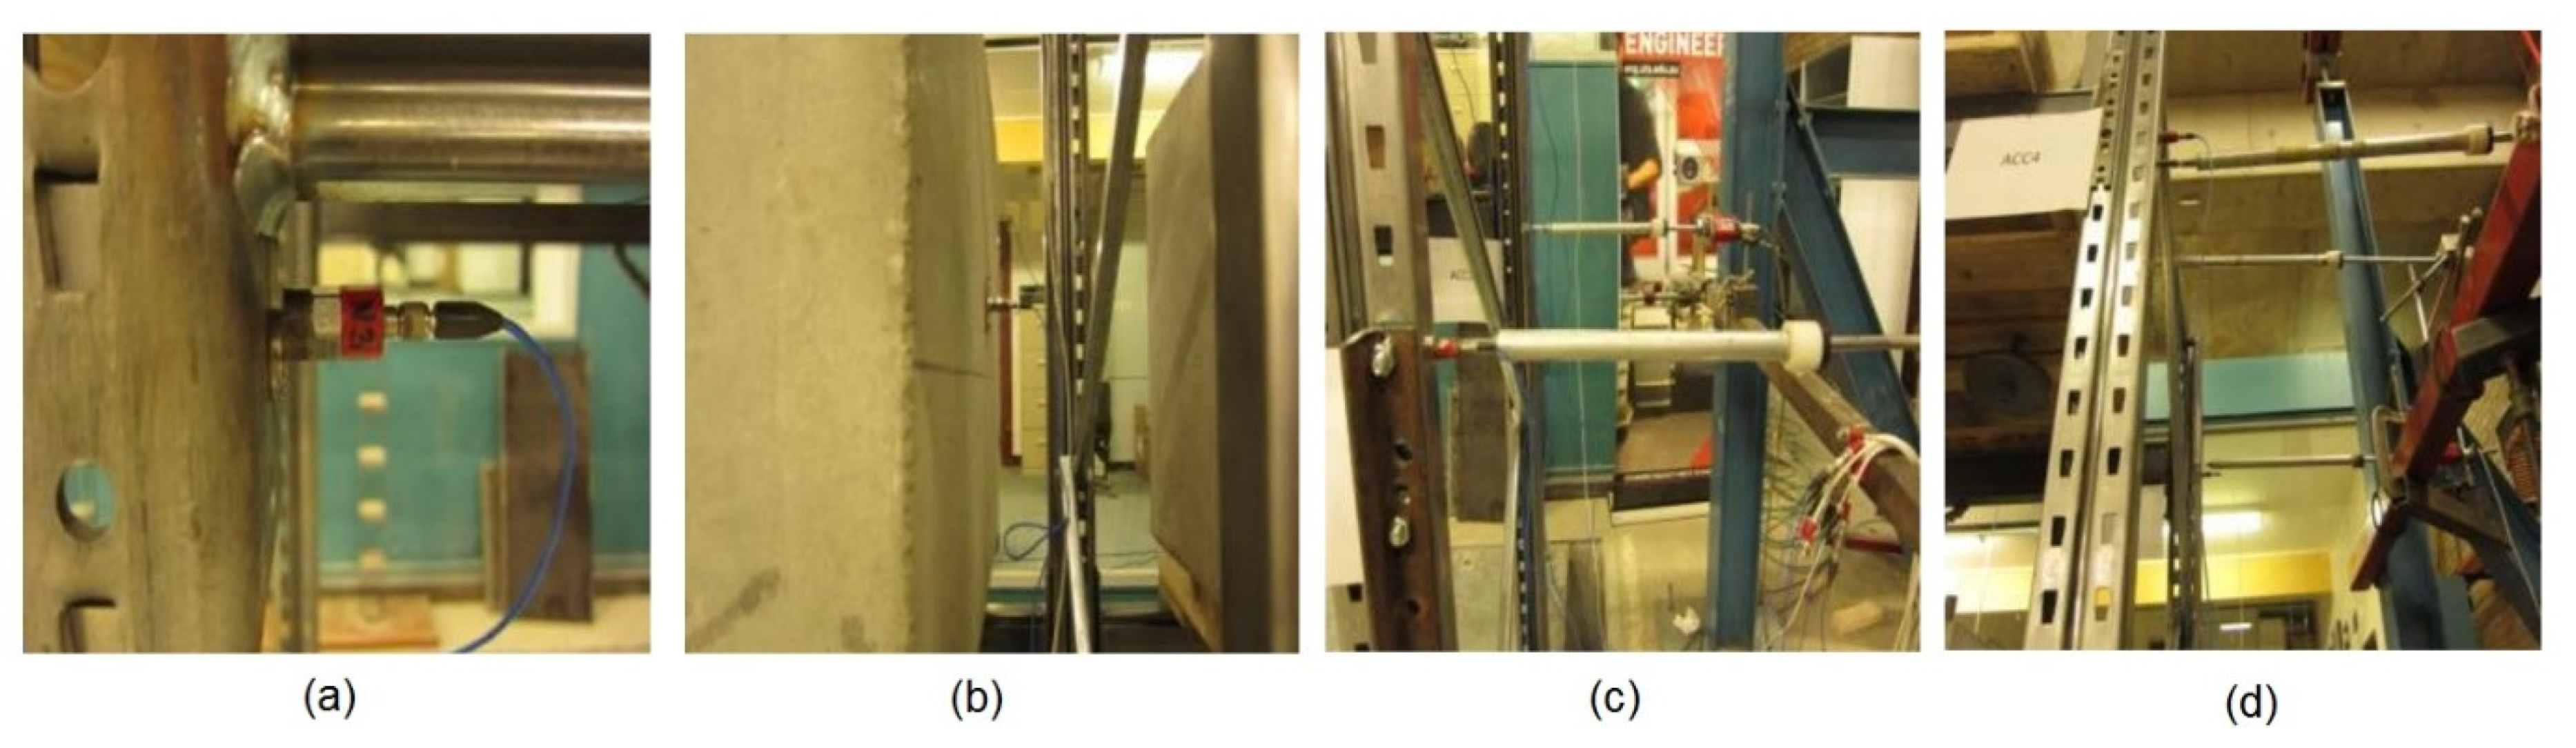
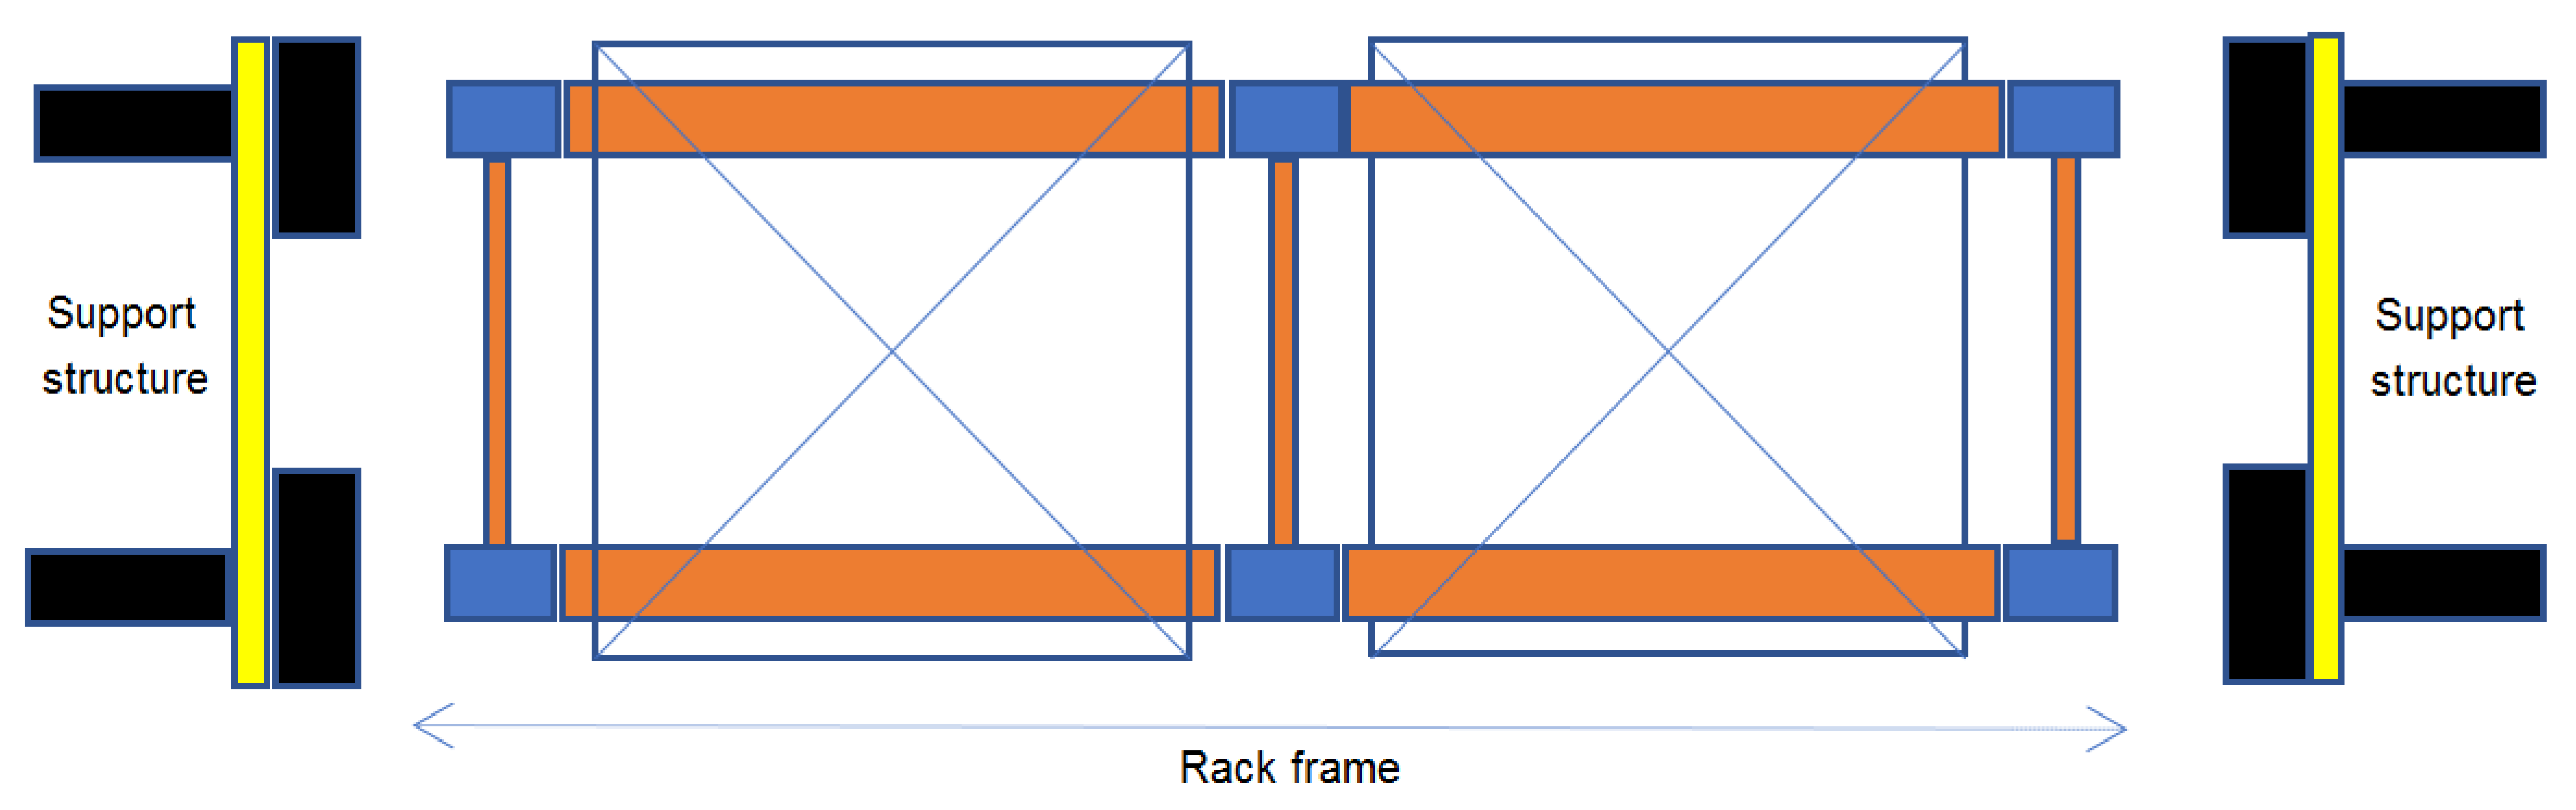
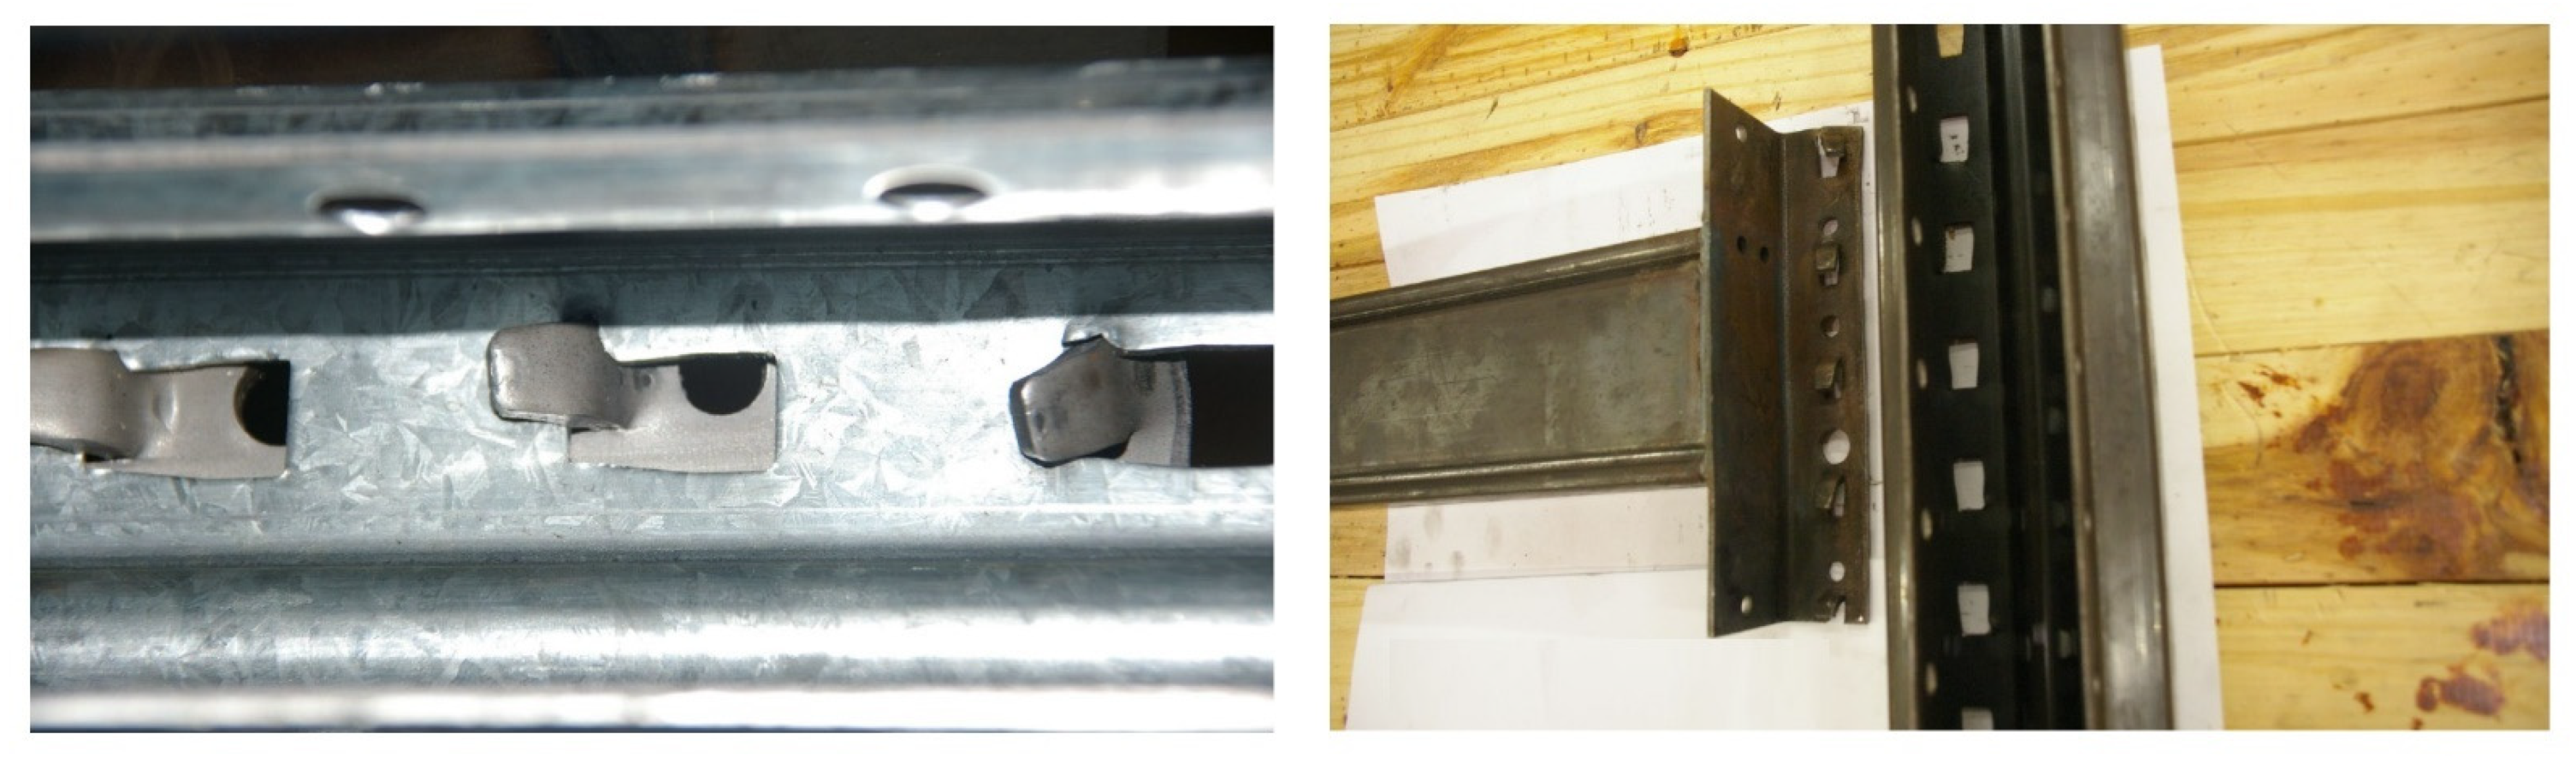
2.2. Test Setup and Instrumentation
2.3. Testing Protocol
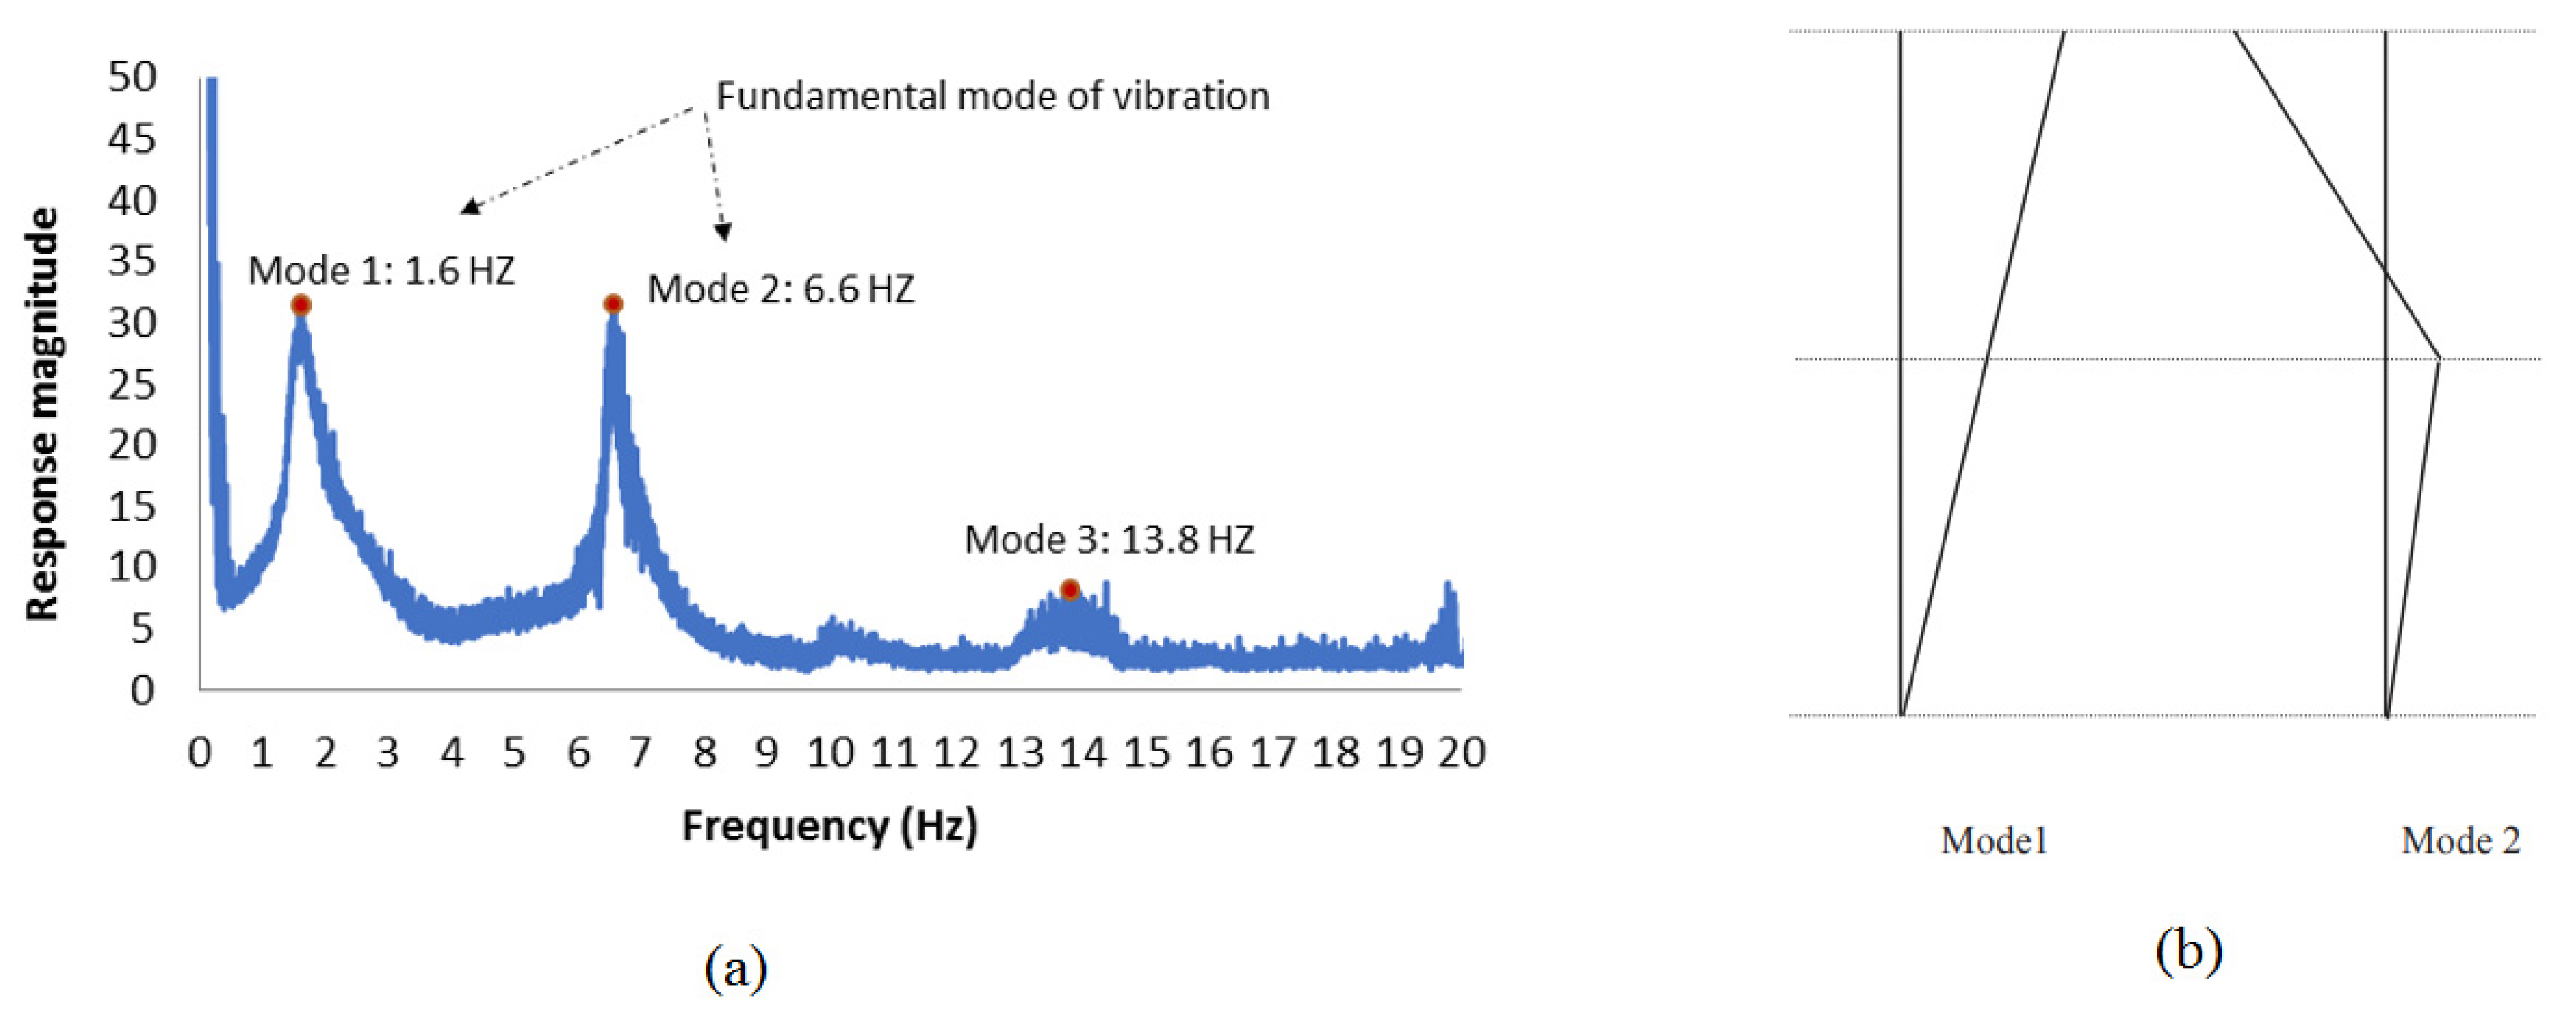
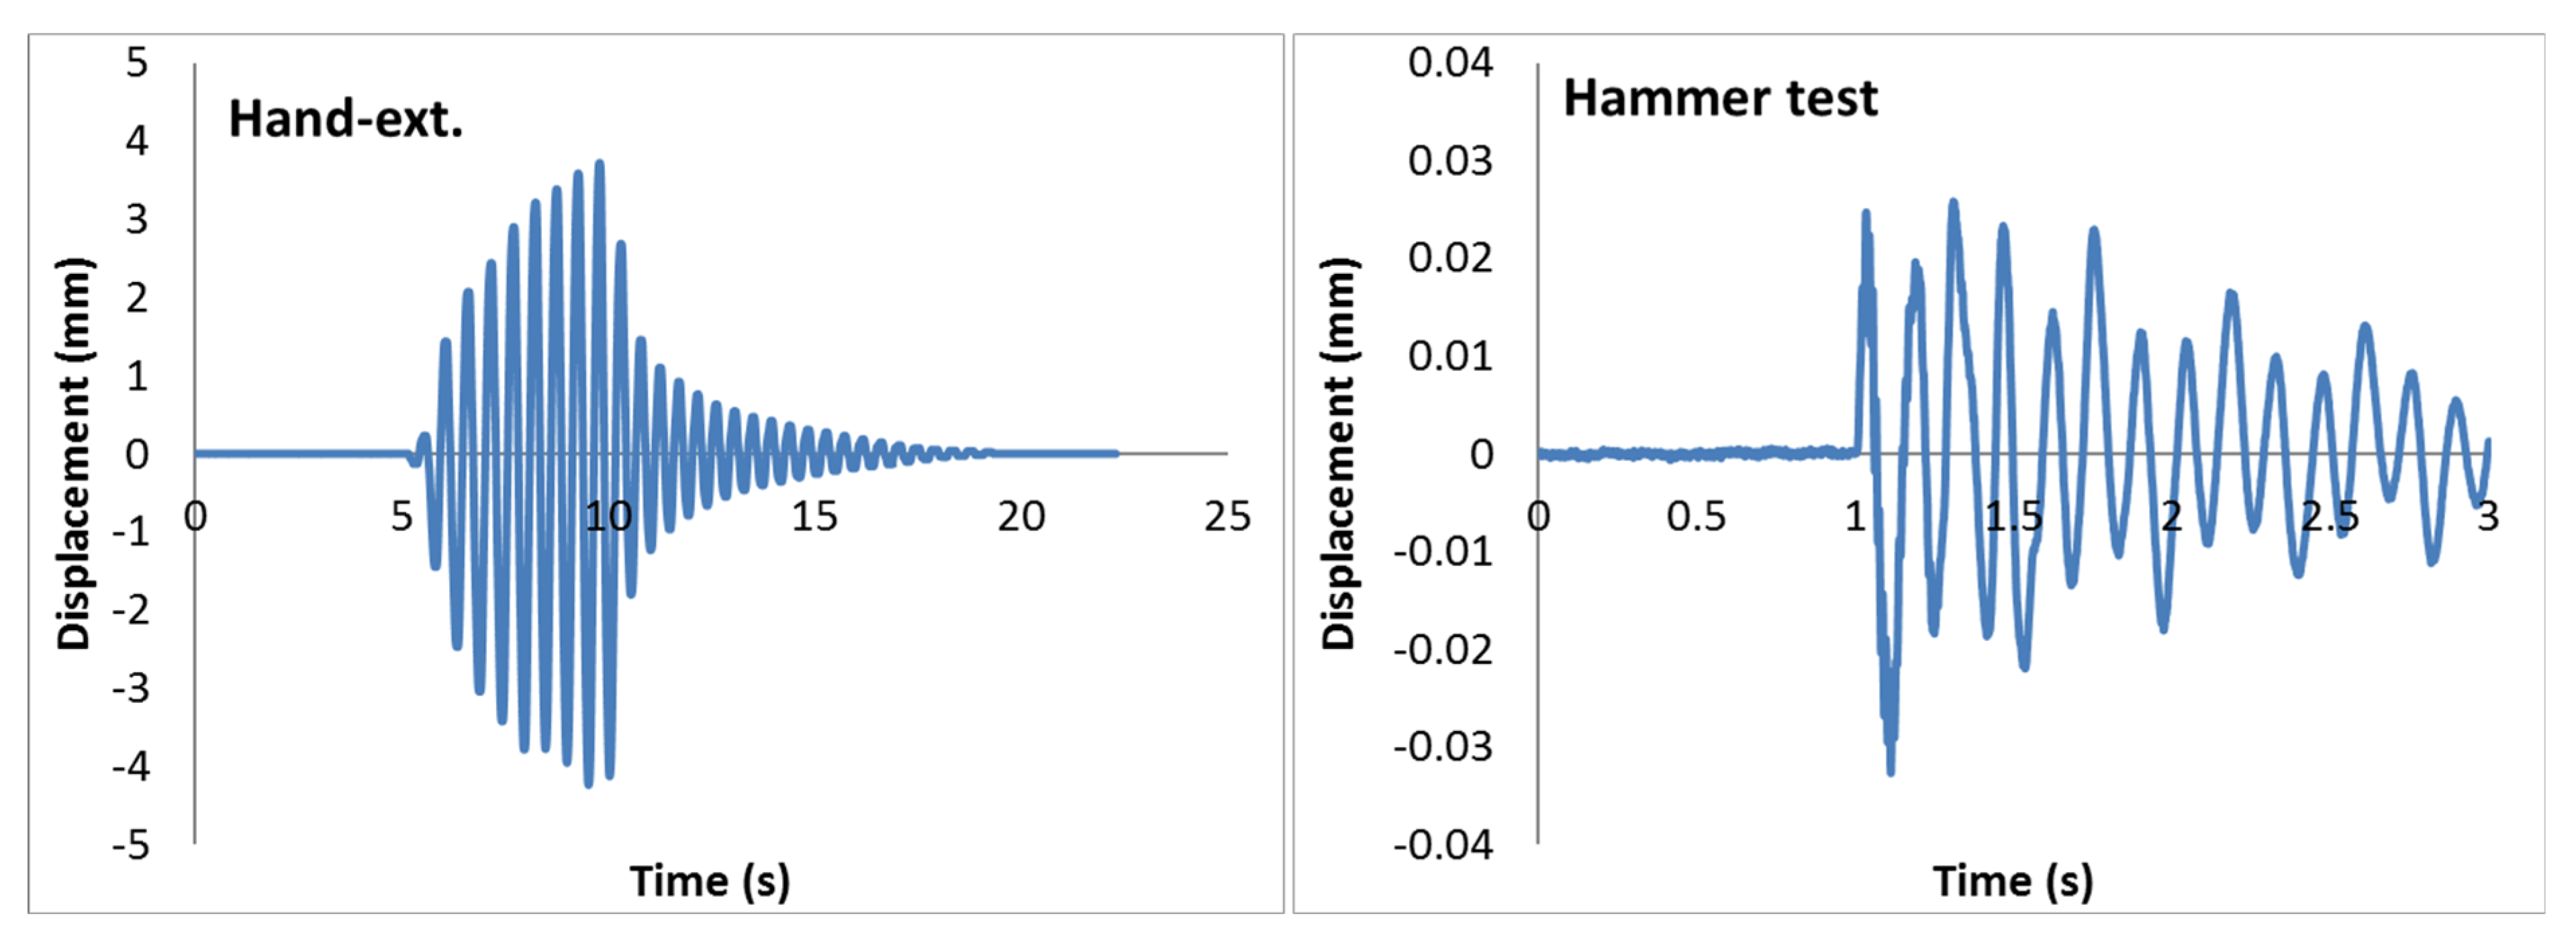
2.3.1. Phase One: System Identification Tests
2.3.2. Phase Two and Three: Shake Table Tests
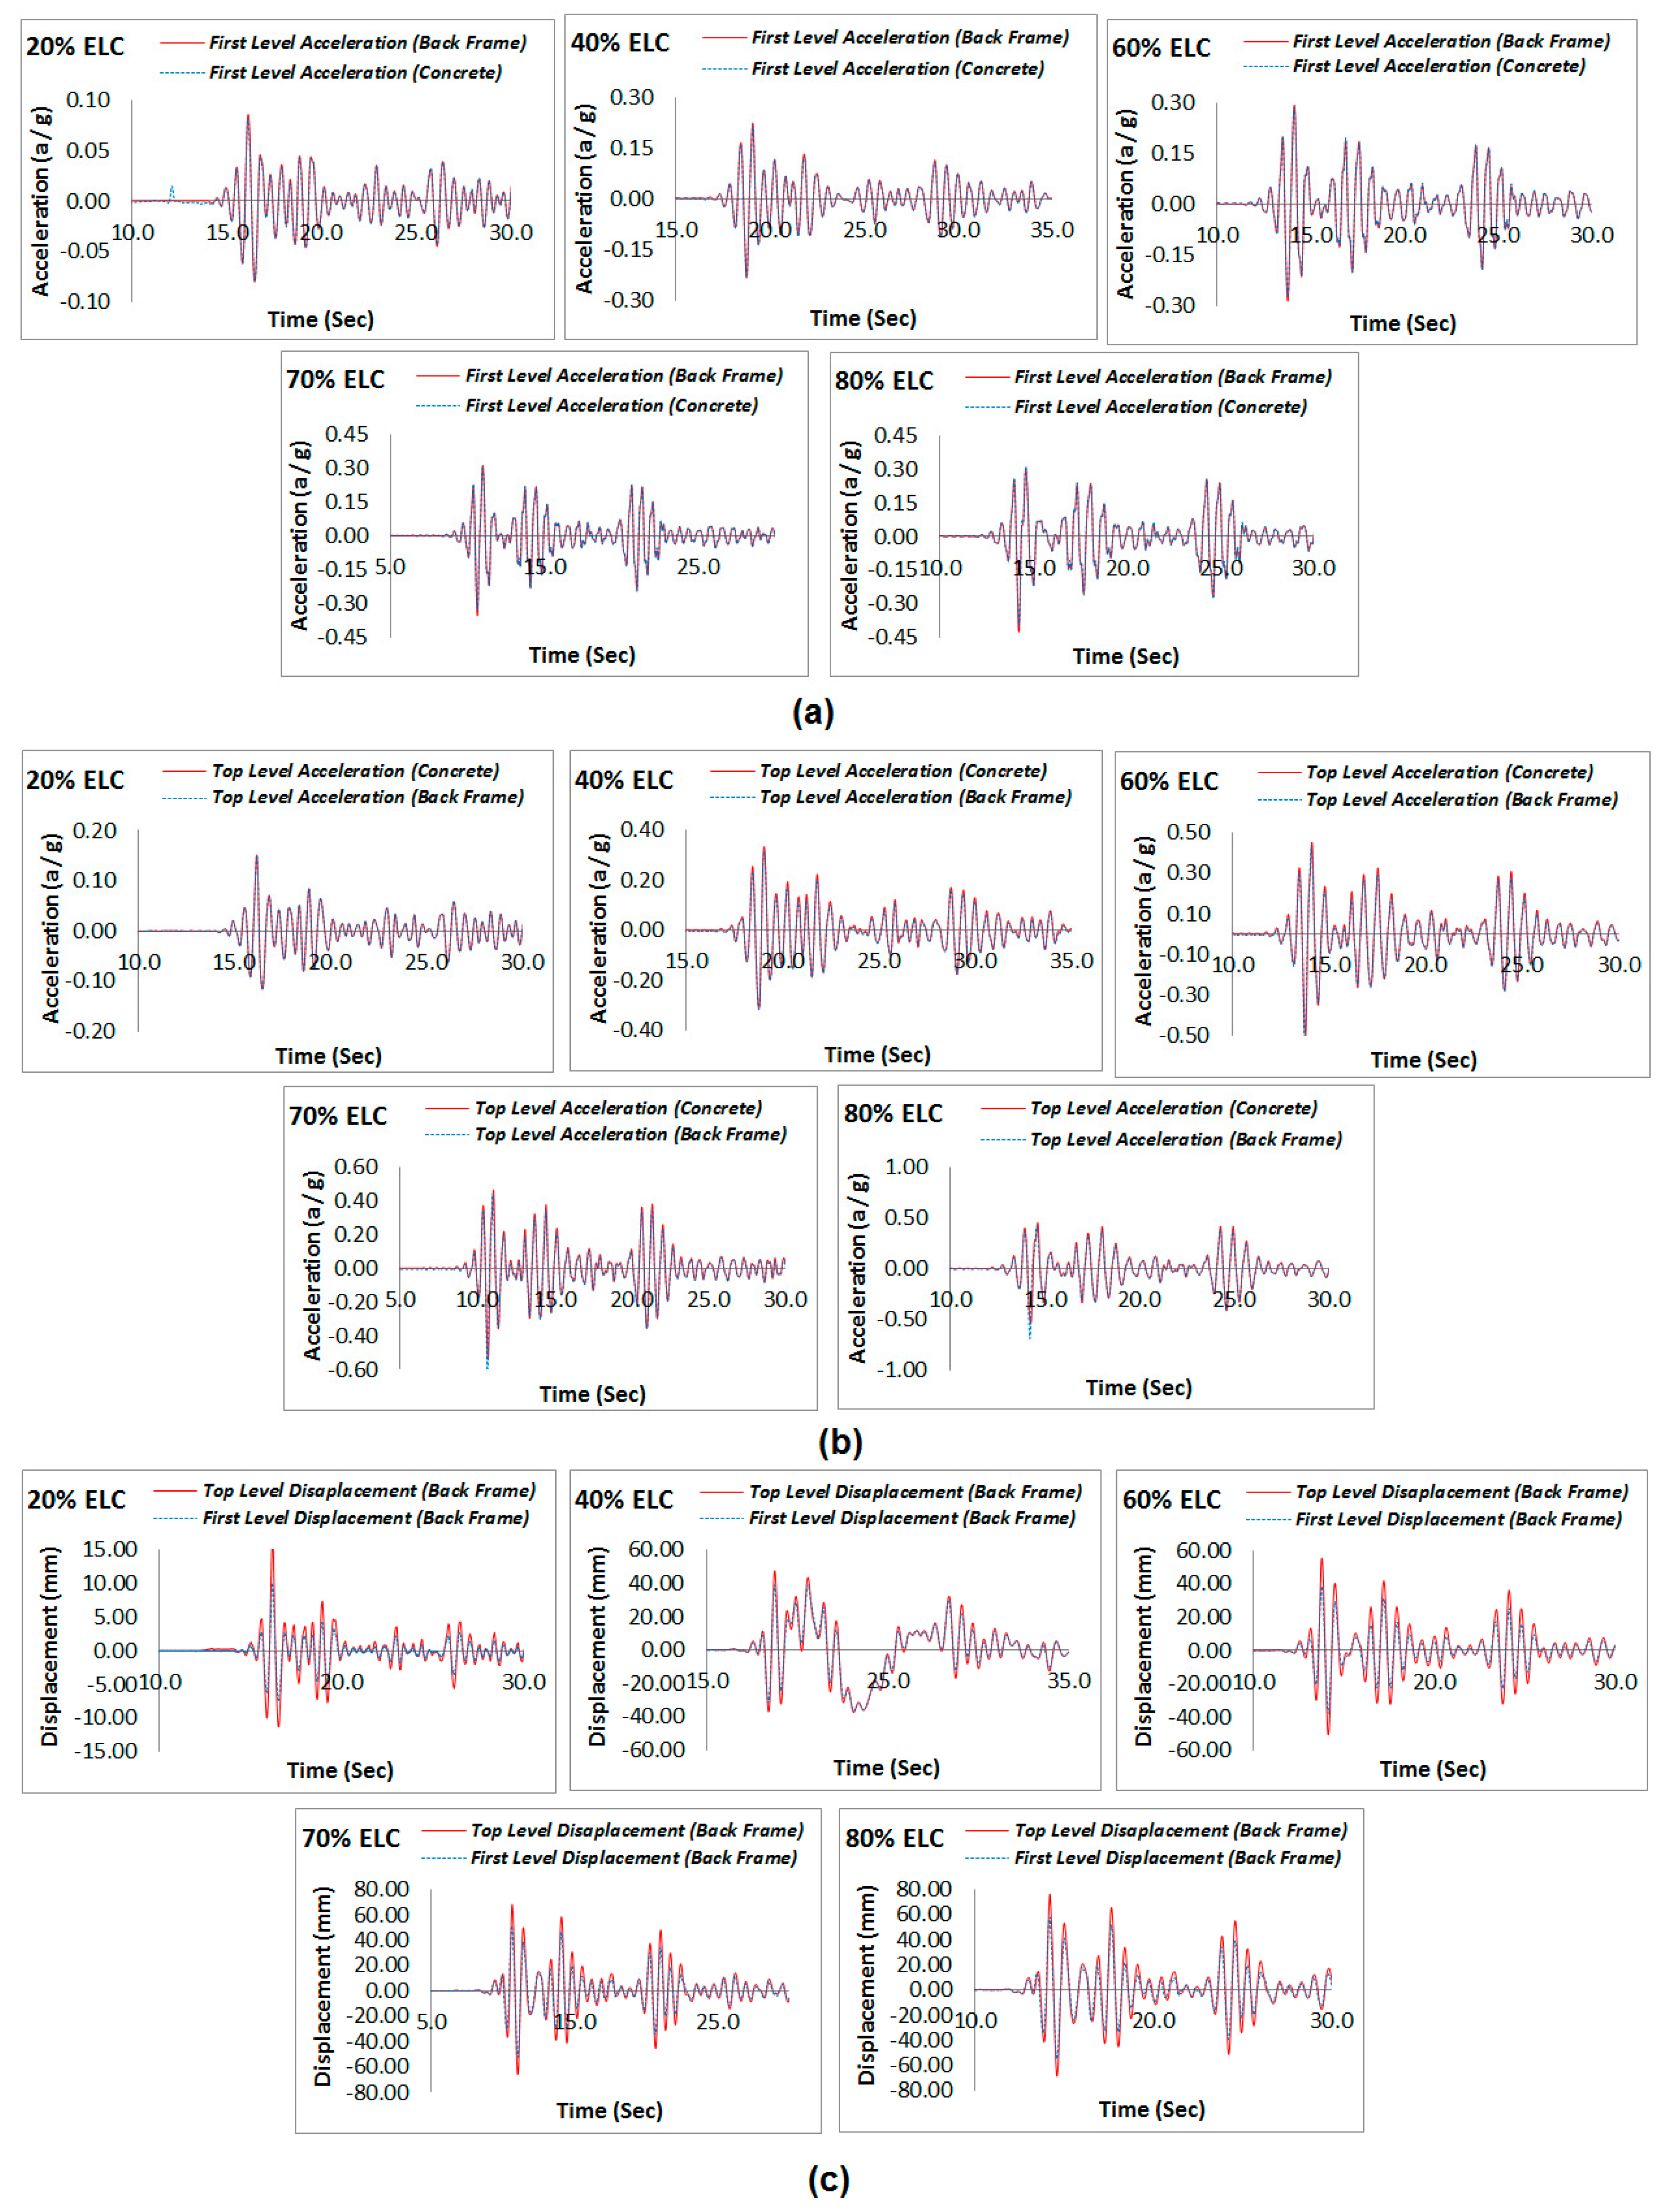
- In phase two, the tests started at a Peak Ground Acceleration (PGA) of 20% of the 1940 El-Centro earthquake record, and then the earthquake record was increased by steps of 10% or 20% (increasing 10–20% of the PGA for shake table excitation in each step) up to 80% intensity of the El-Centro earthquake. The shake table tests were conducted without scaling time domain.
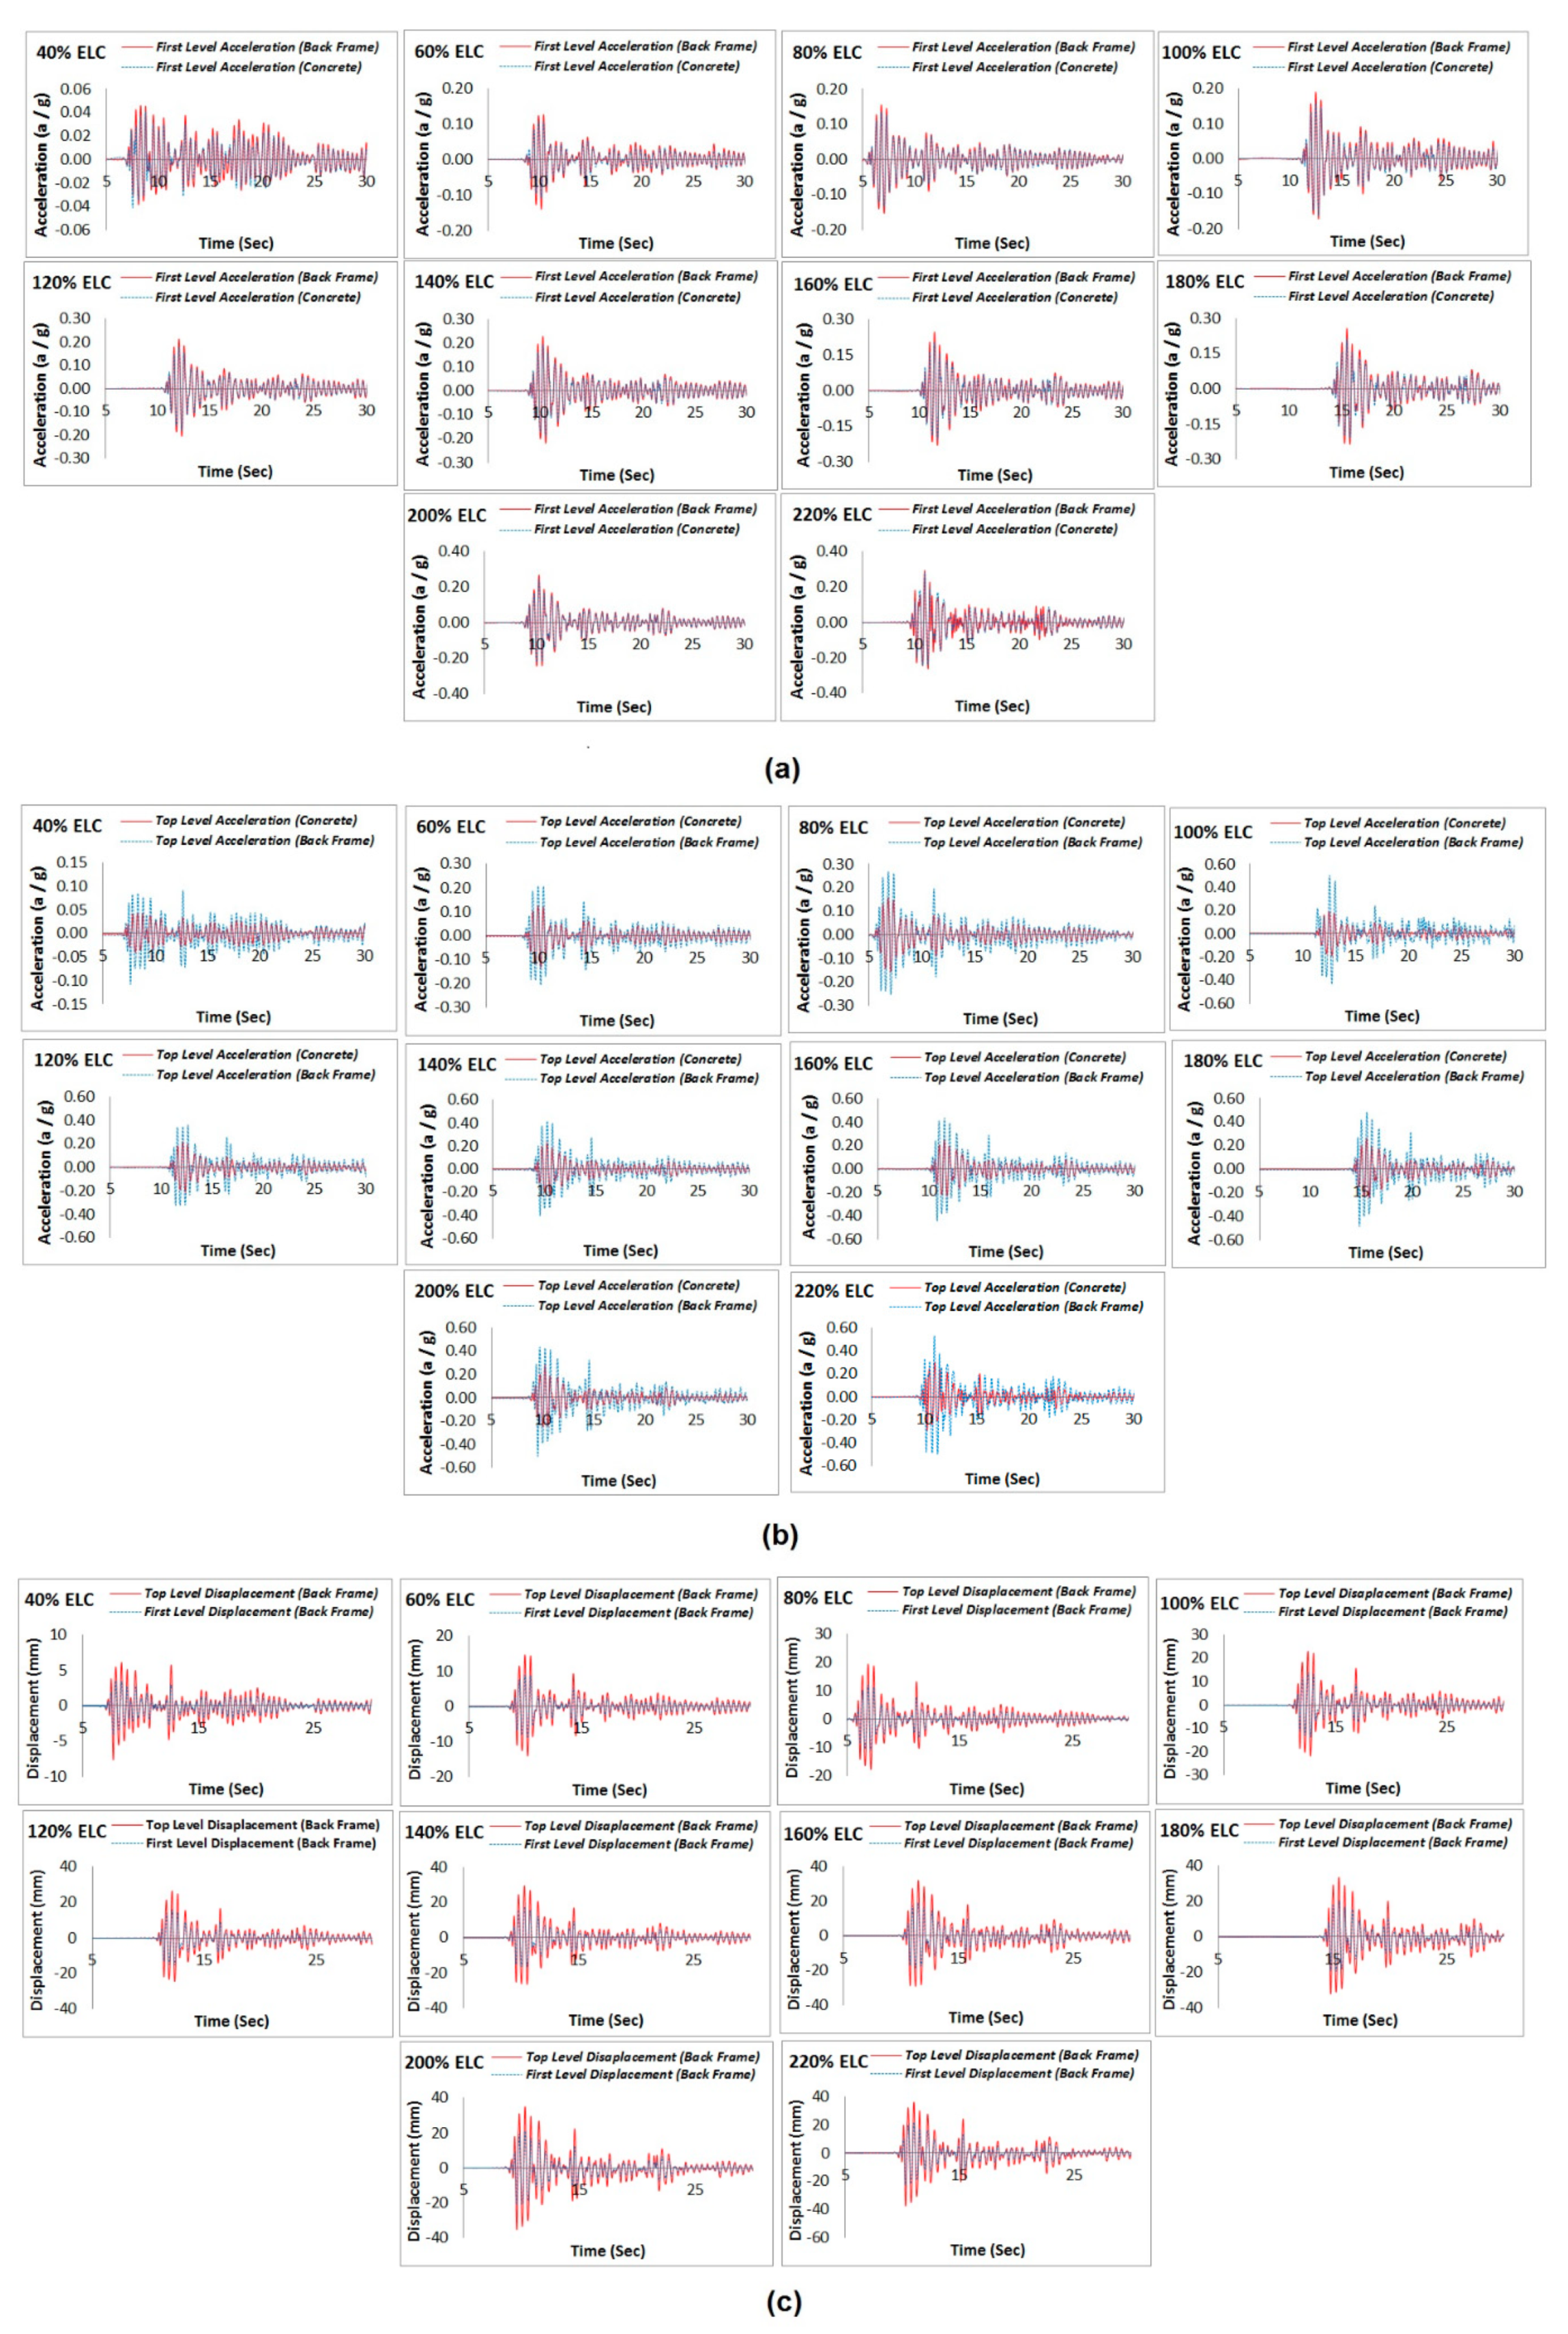
- In phase three, the shake table testing program was carried out to subject the rack frame under a range of intensities between 40% and 220% of the El-Centro earthquake record. The increment increase was continued until a significant drop in the fundamental period of the system was observed, which indicates the formation of local plastic deformation in the structure. In this phase, the time domain was scaled down by a factor of 2 to better simulate the sensitivity of taller racks with elongated periods.
3. Test Results
3.1. Results of Phase One: System Identification Tests
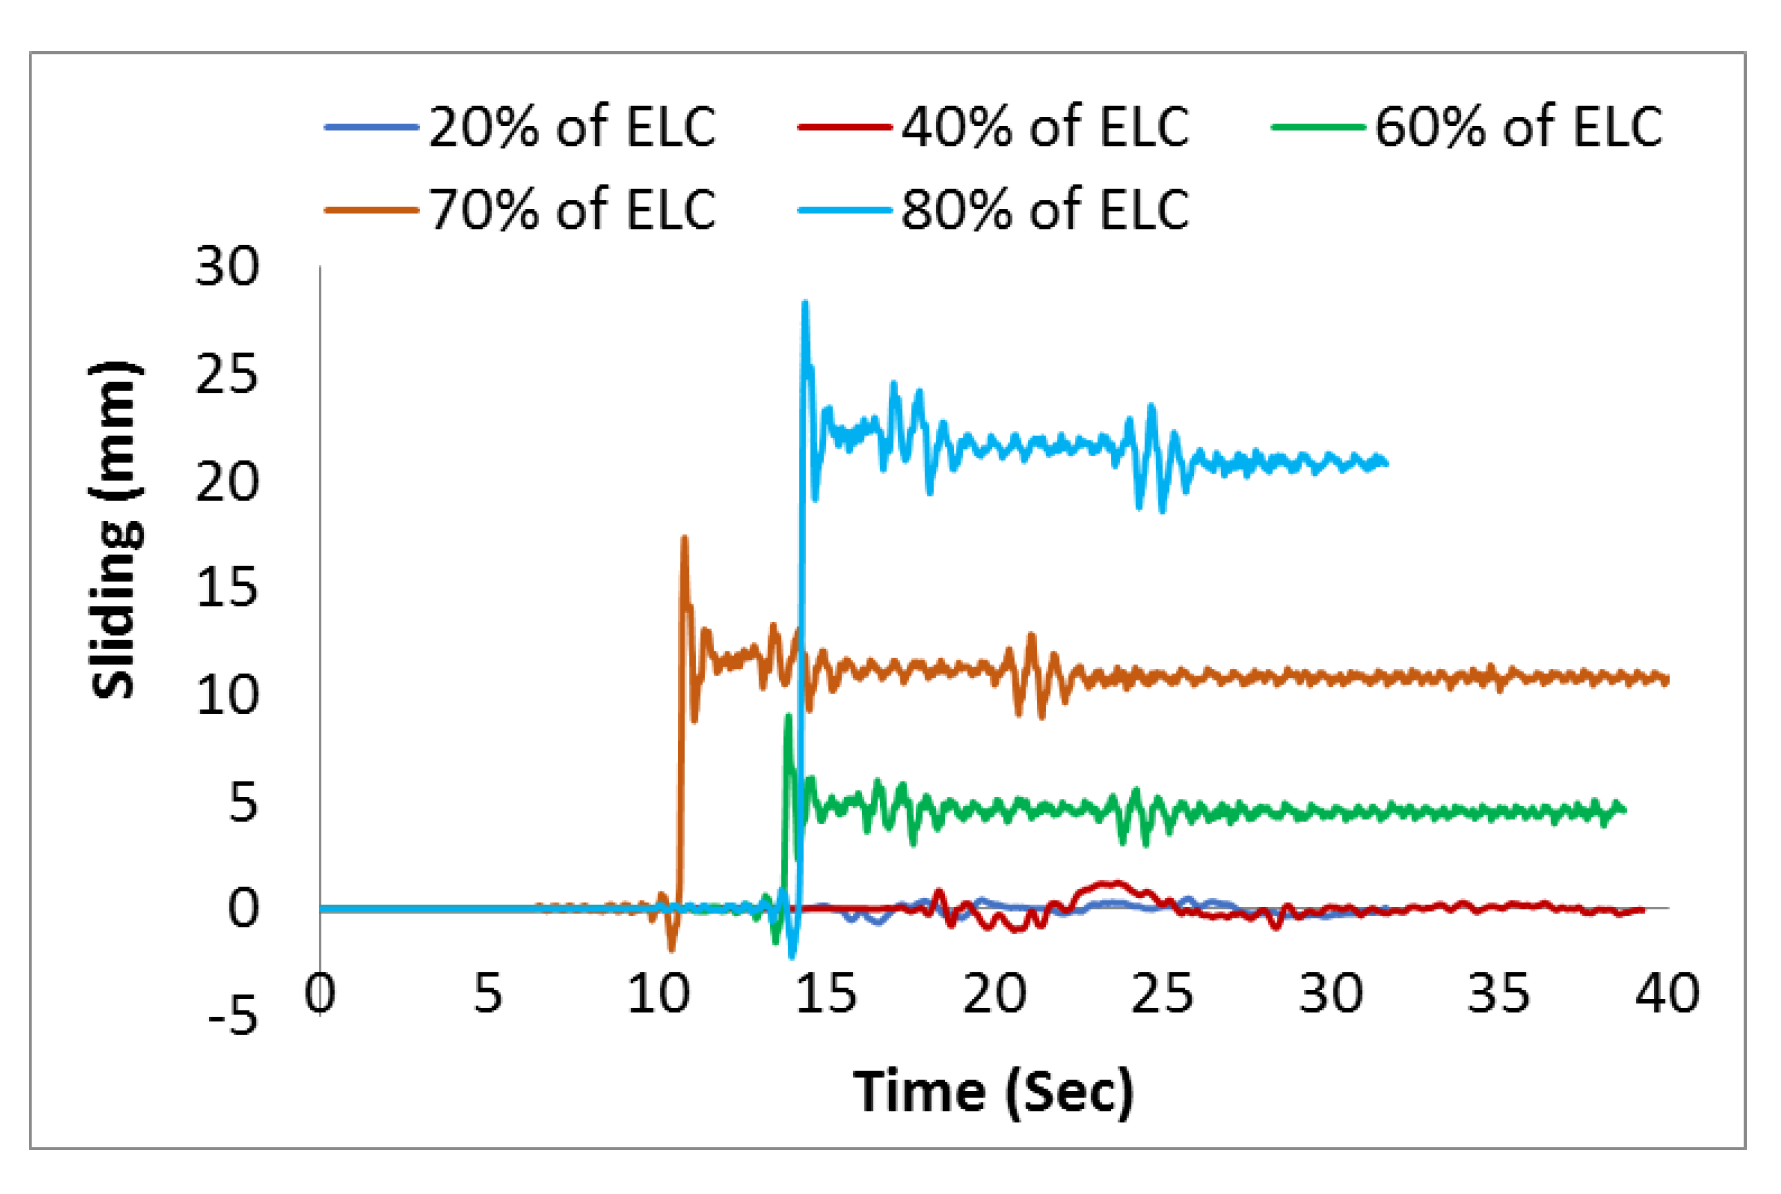
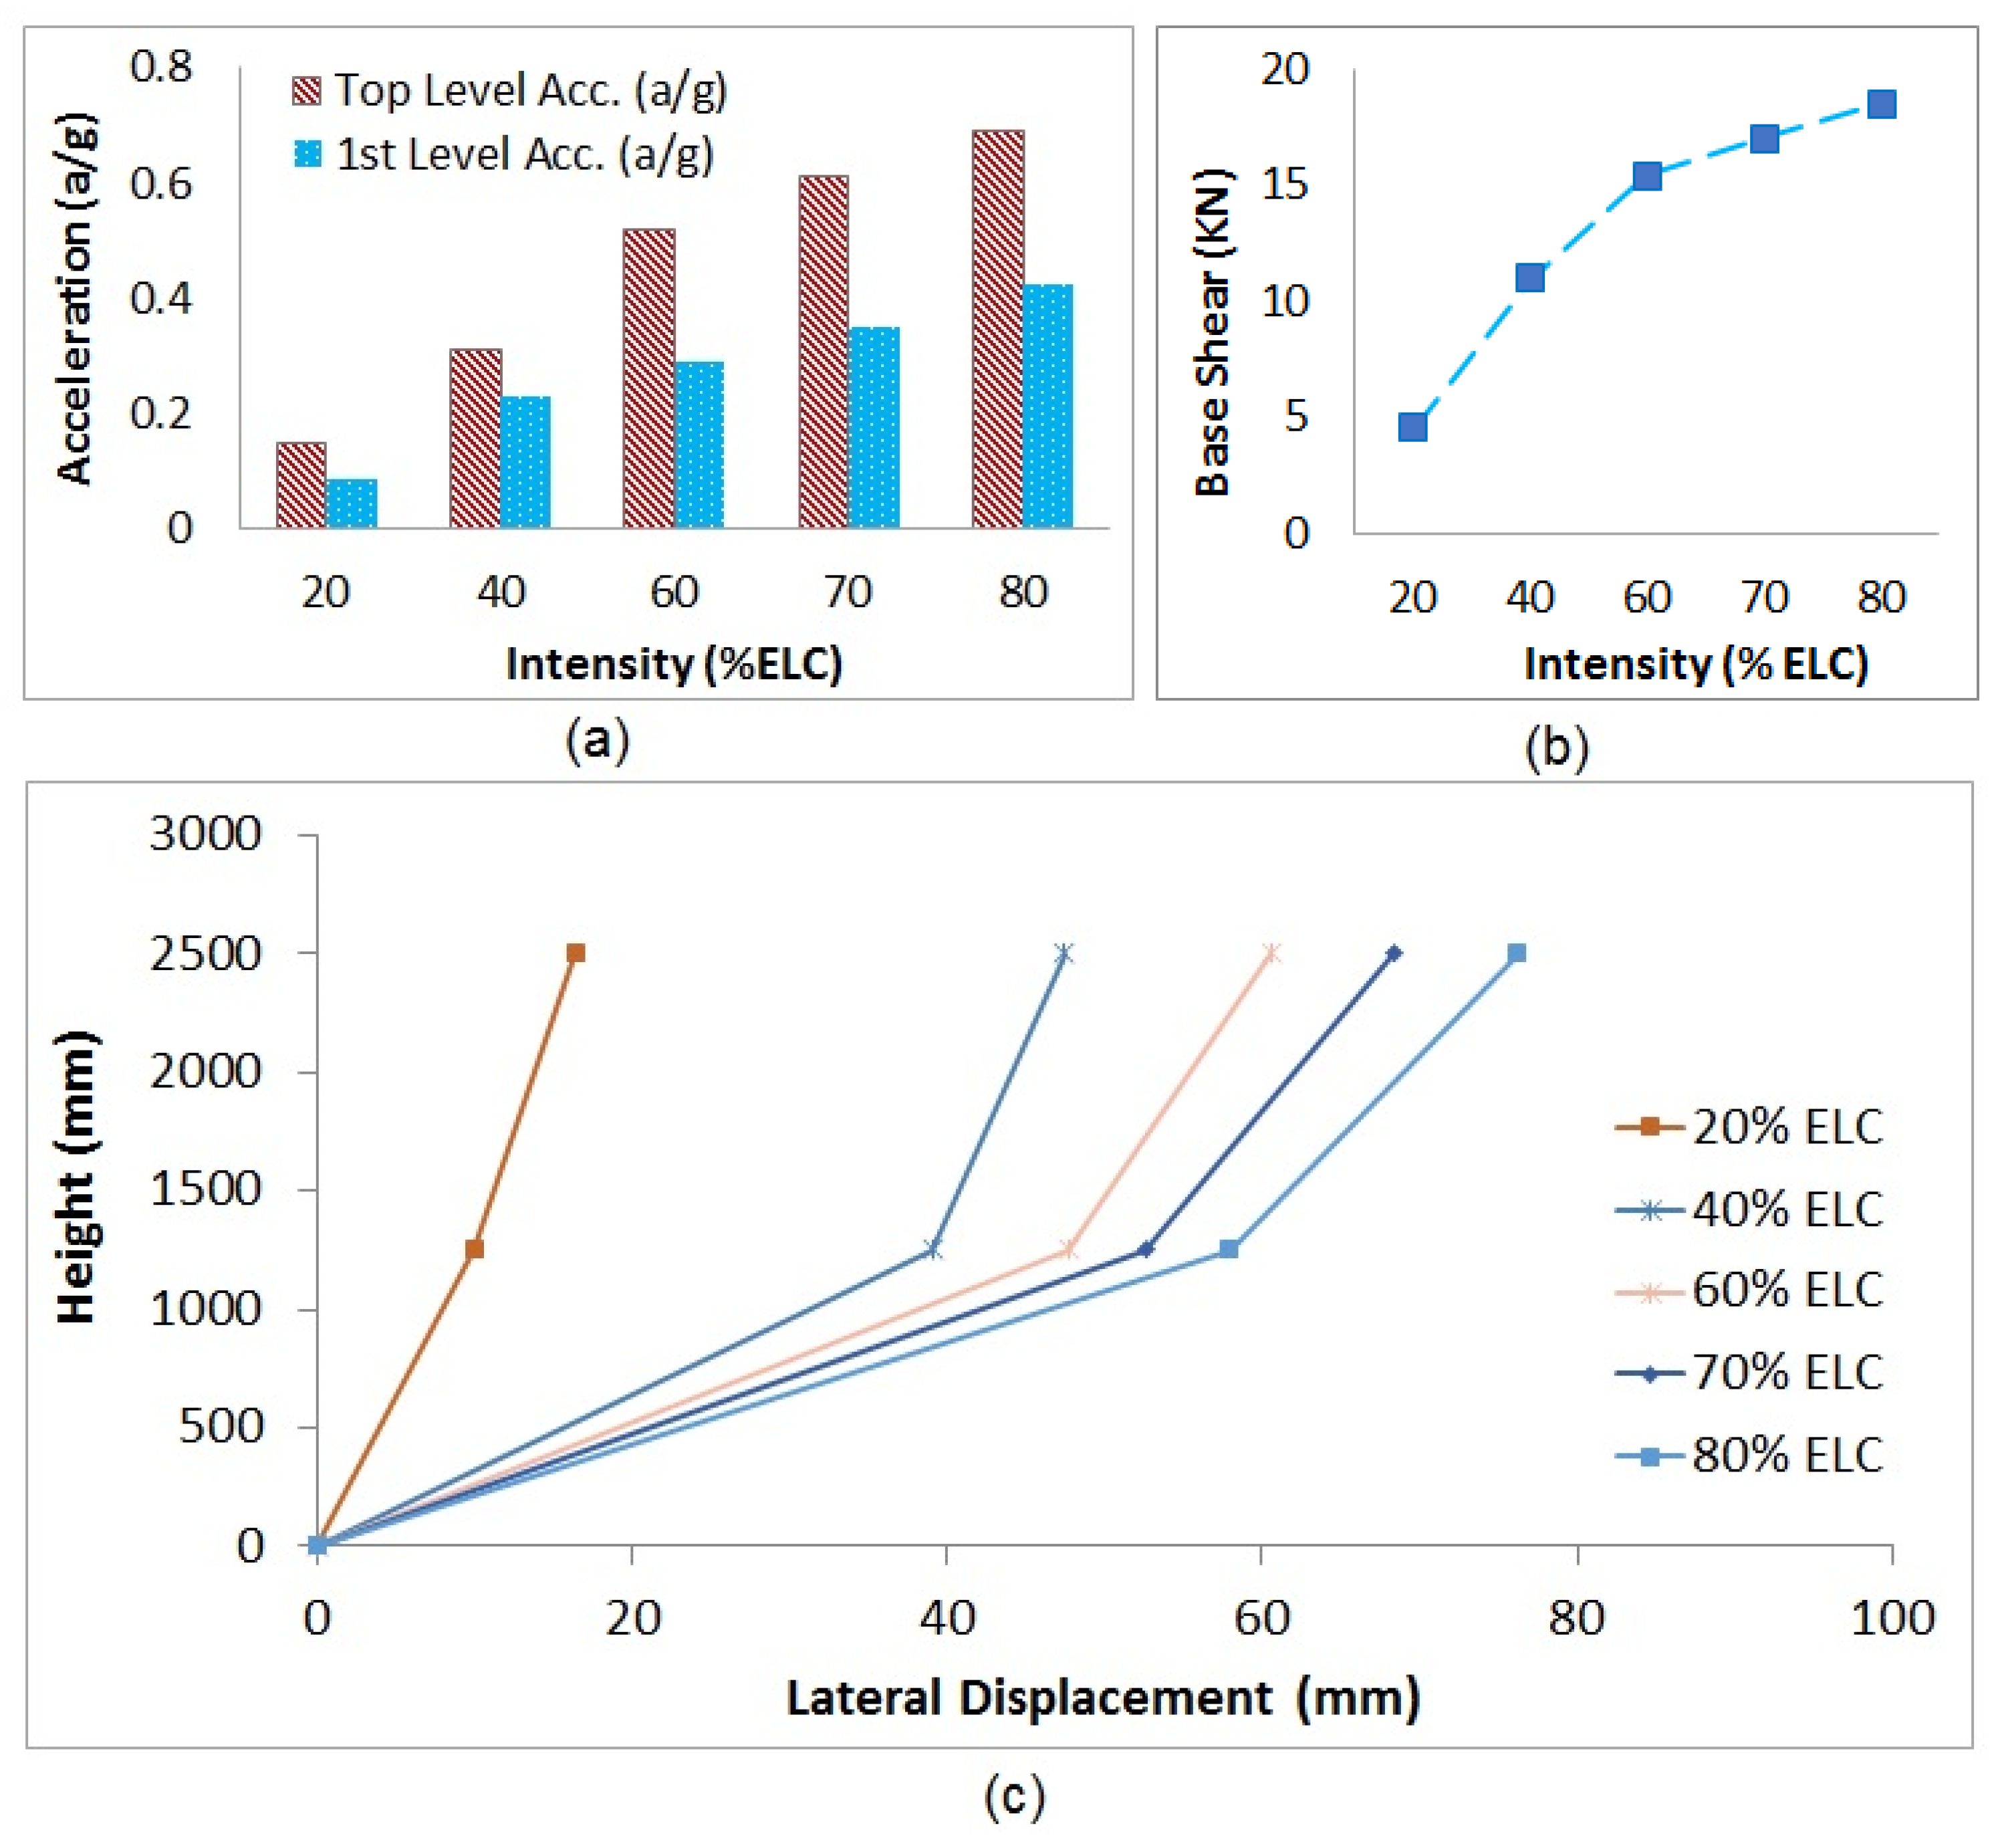
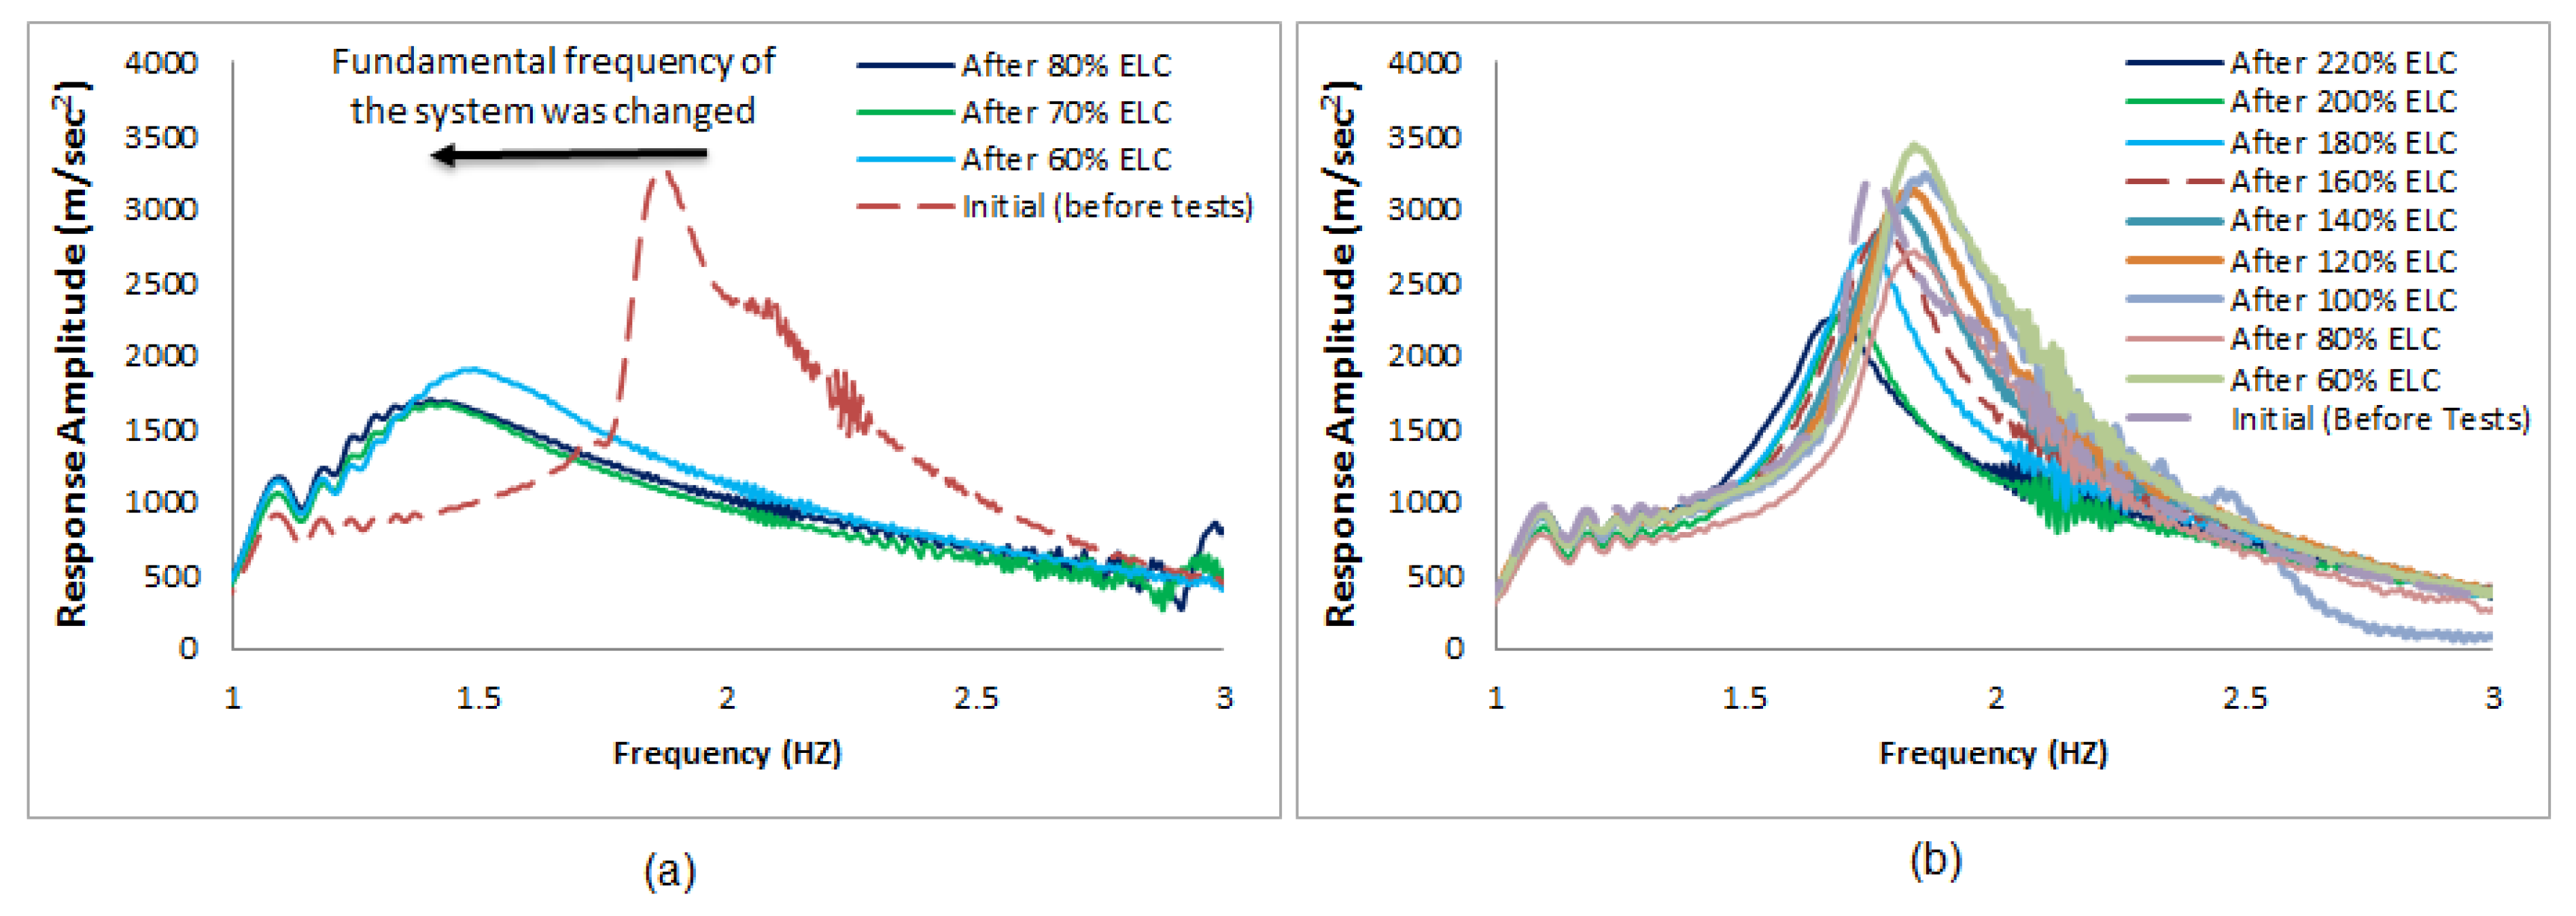
3.2. Results of Phase Two: Shake Table Tests (Non-Scaled in The Time Domain)
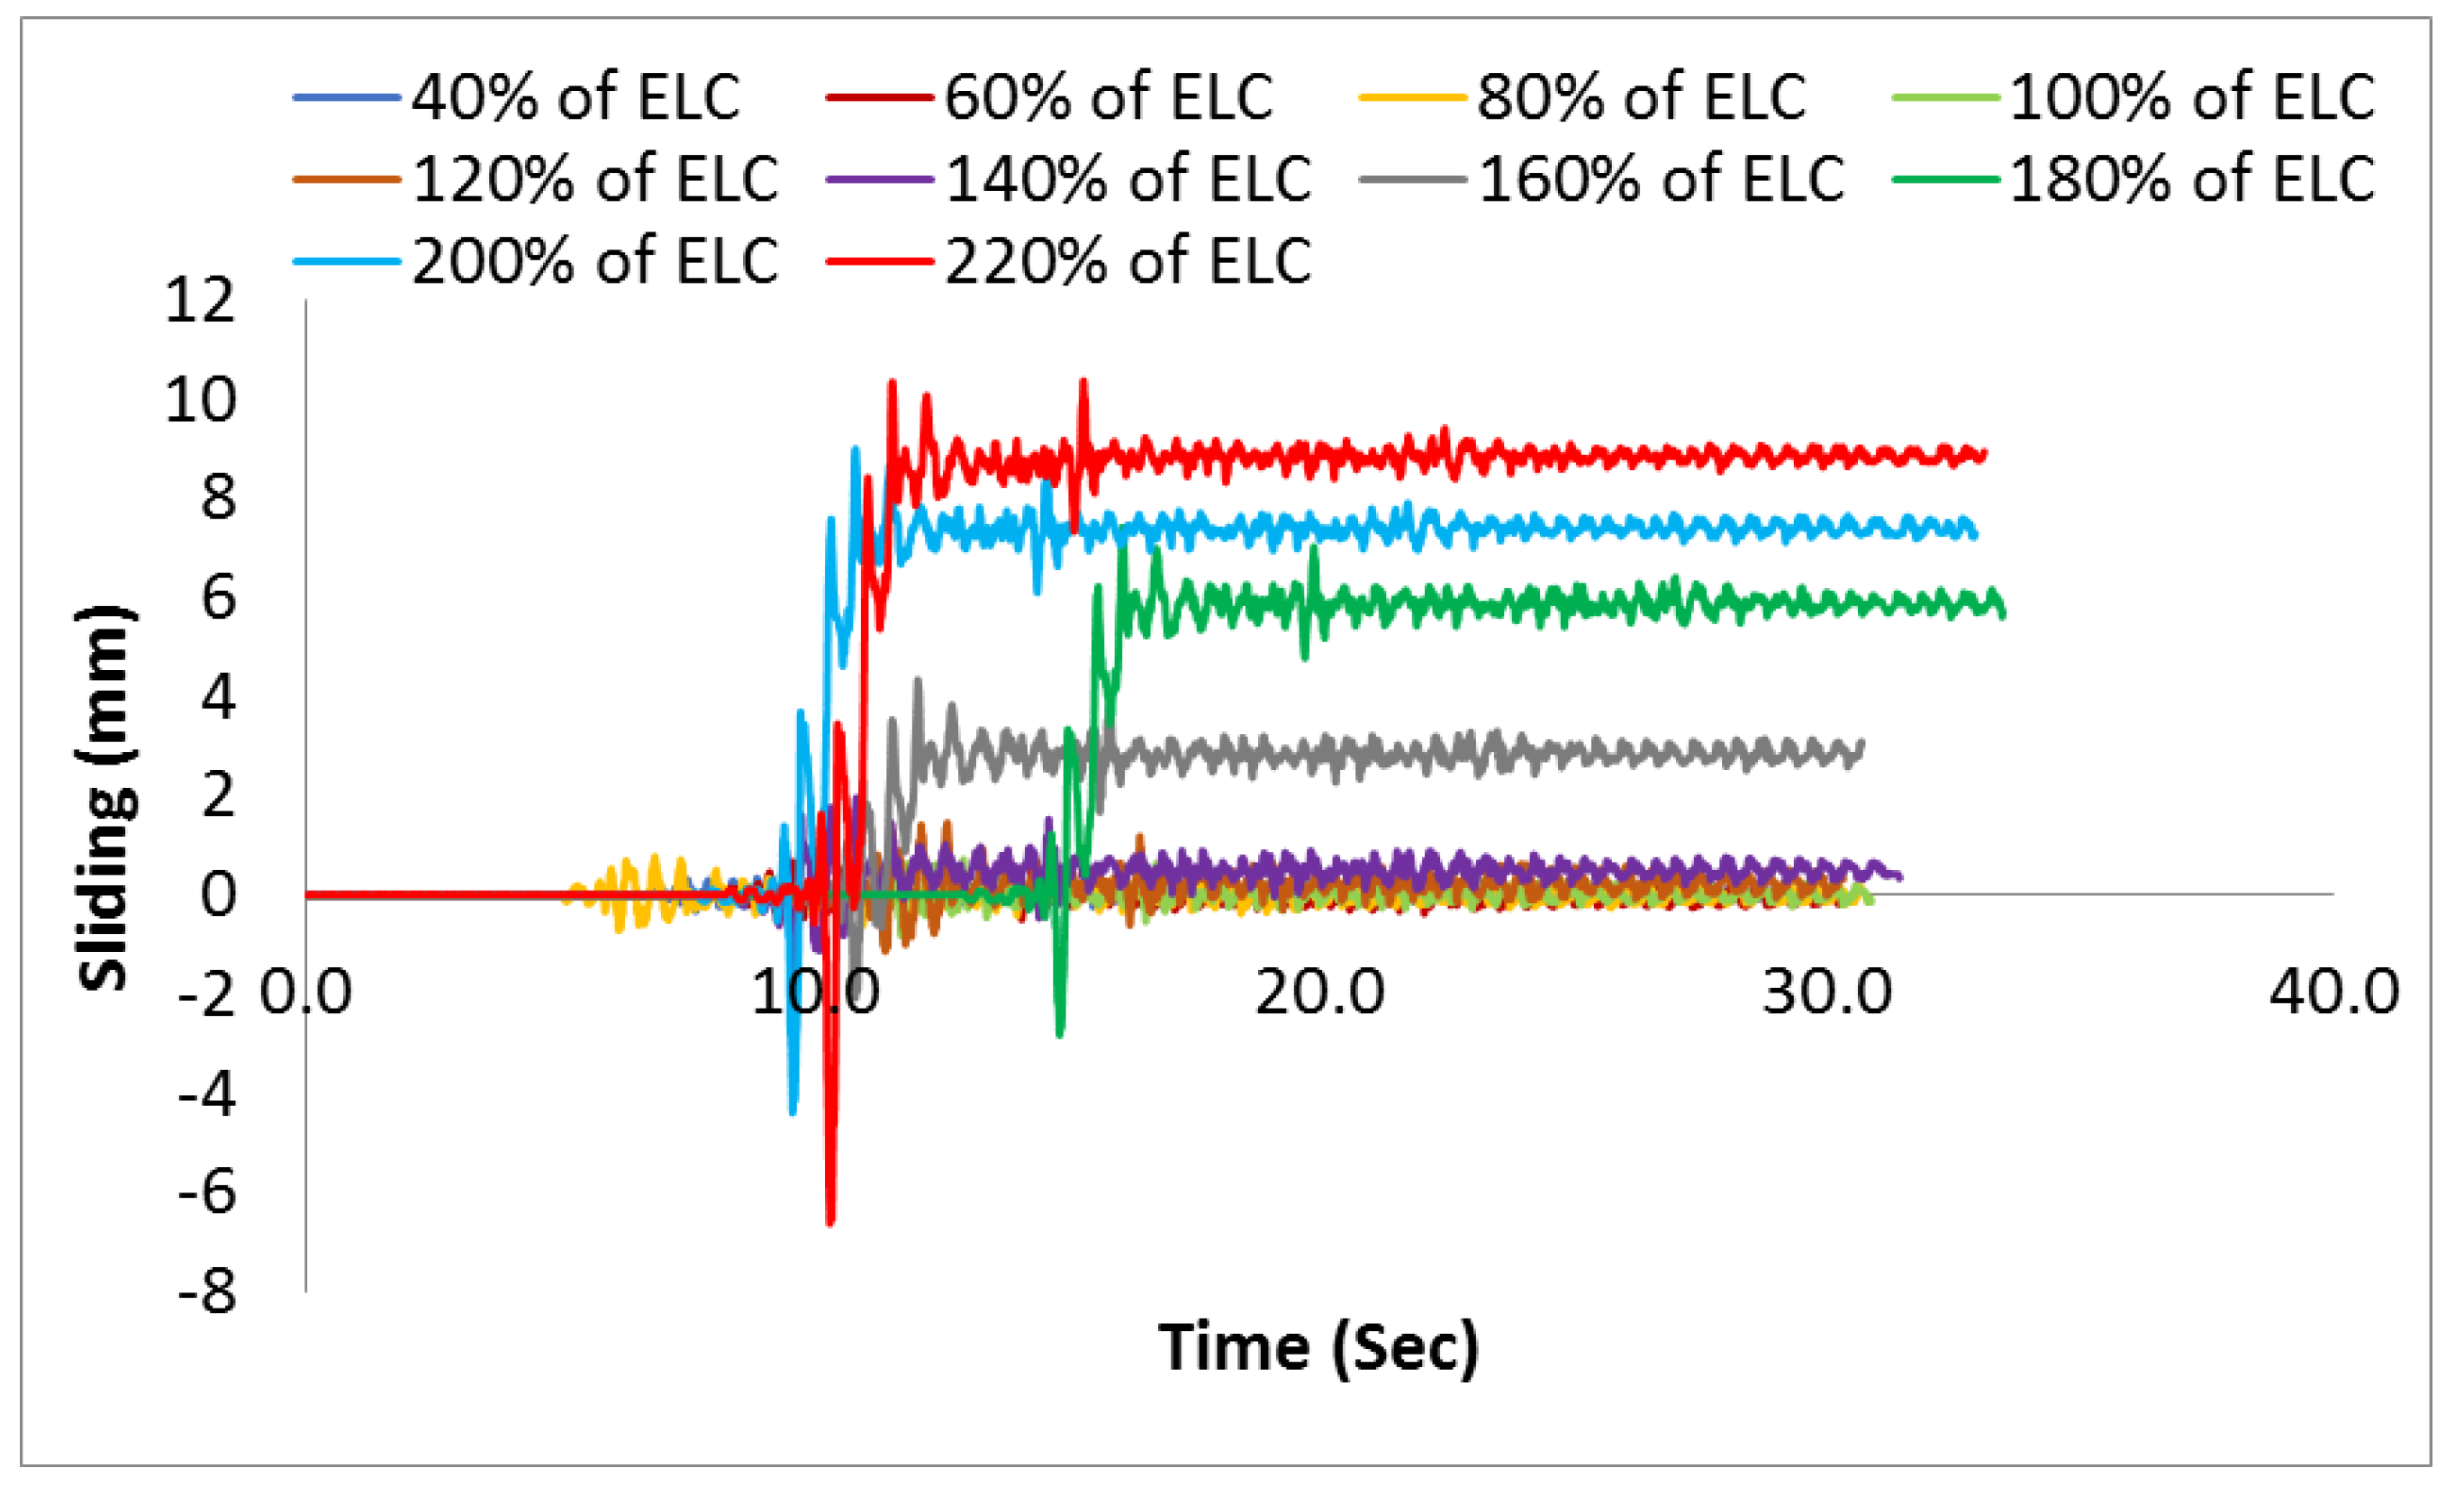
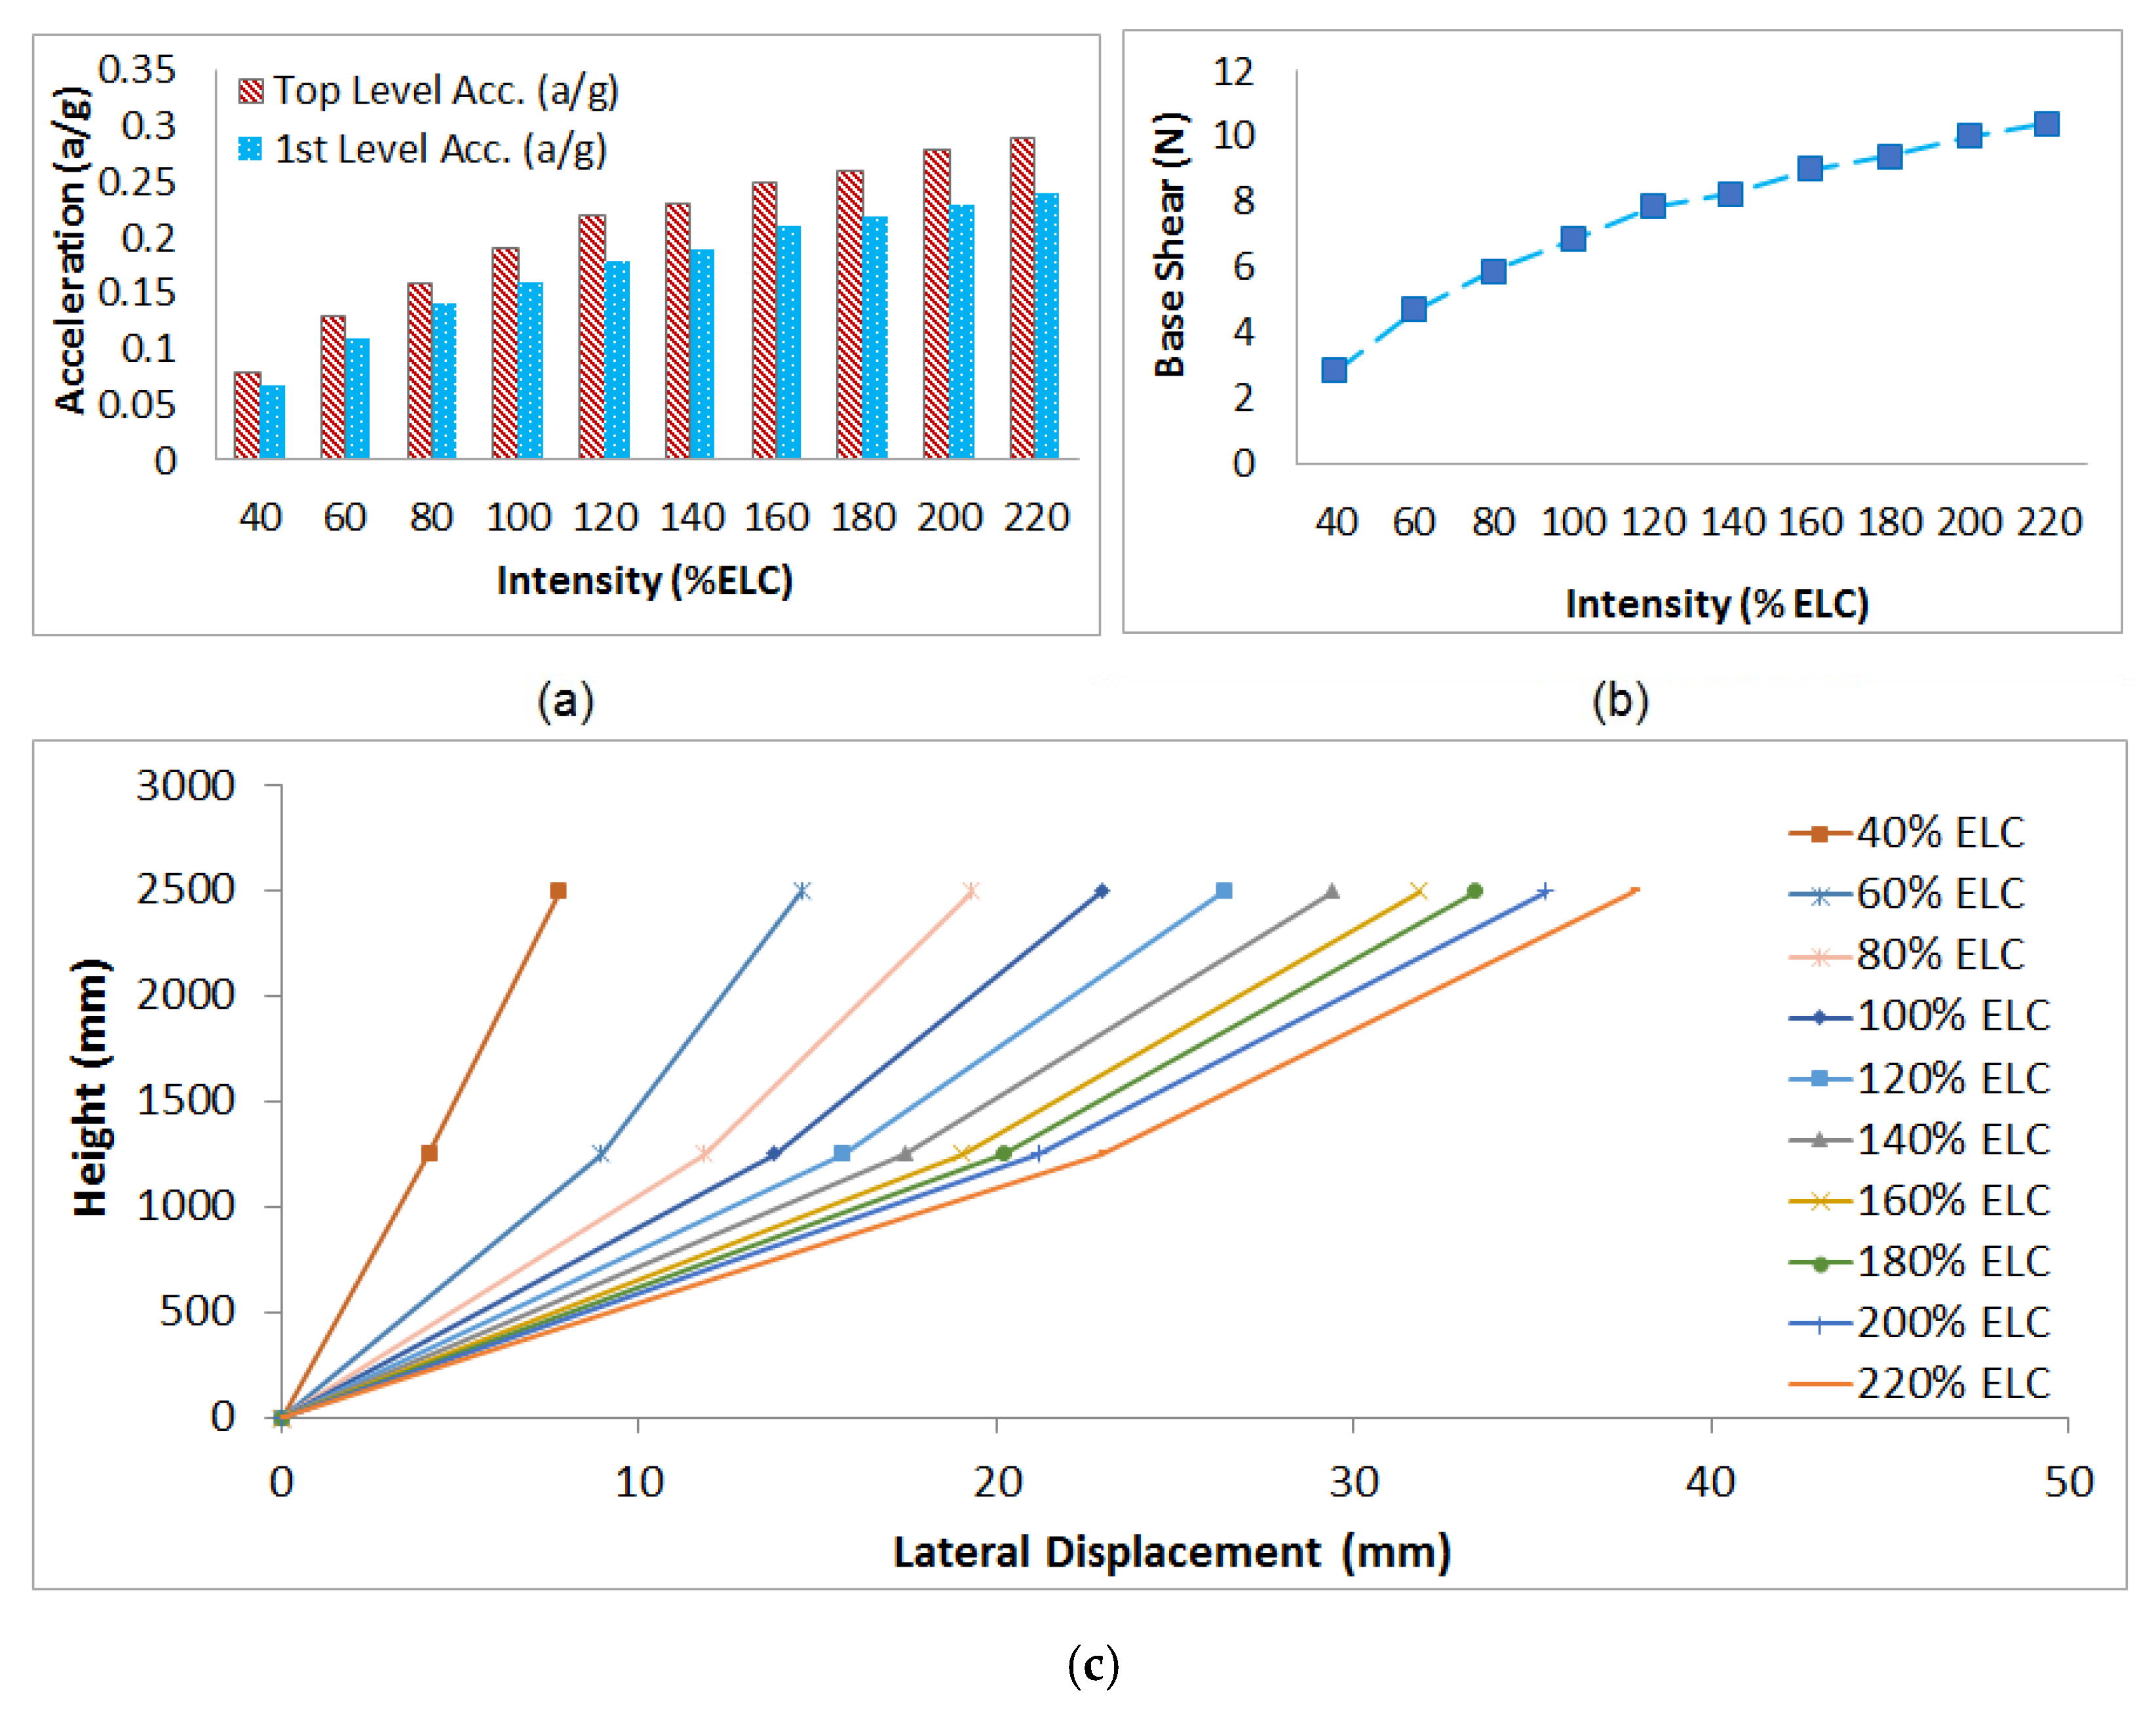
3.3. Results of Phase Three: Shake Table Tests (Scaled Down in Time Domain)
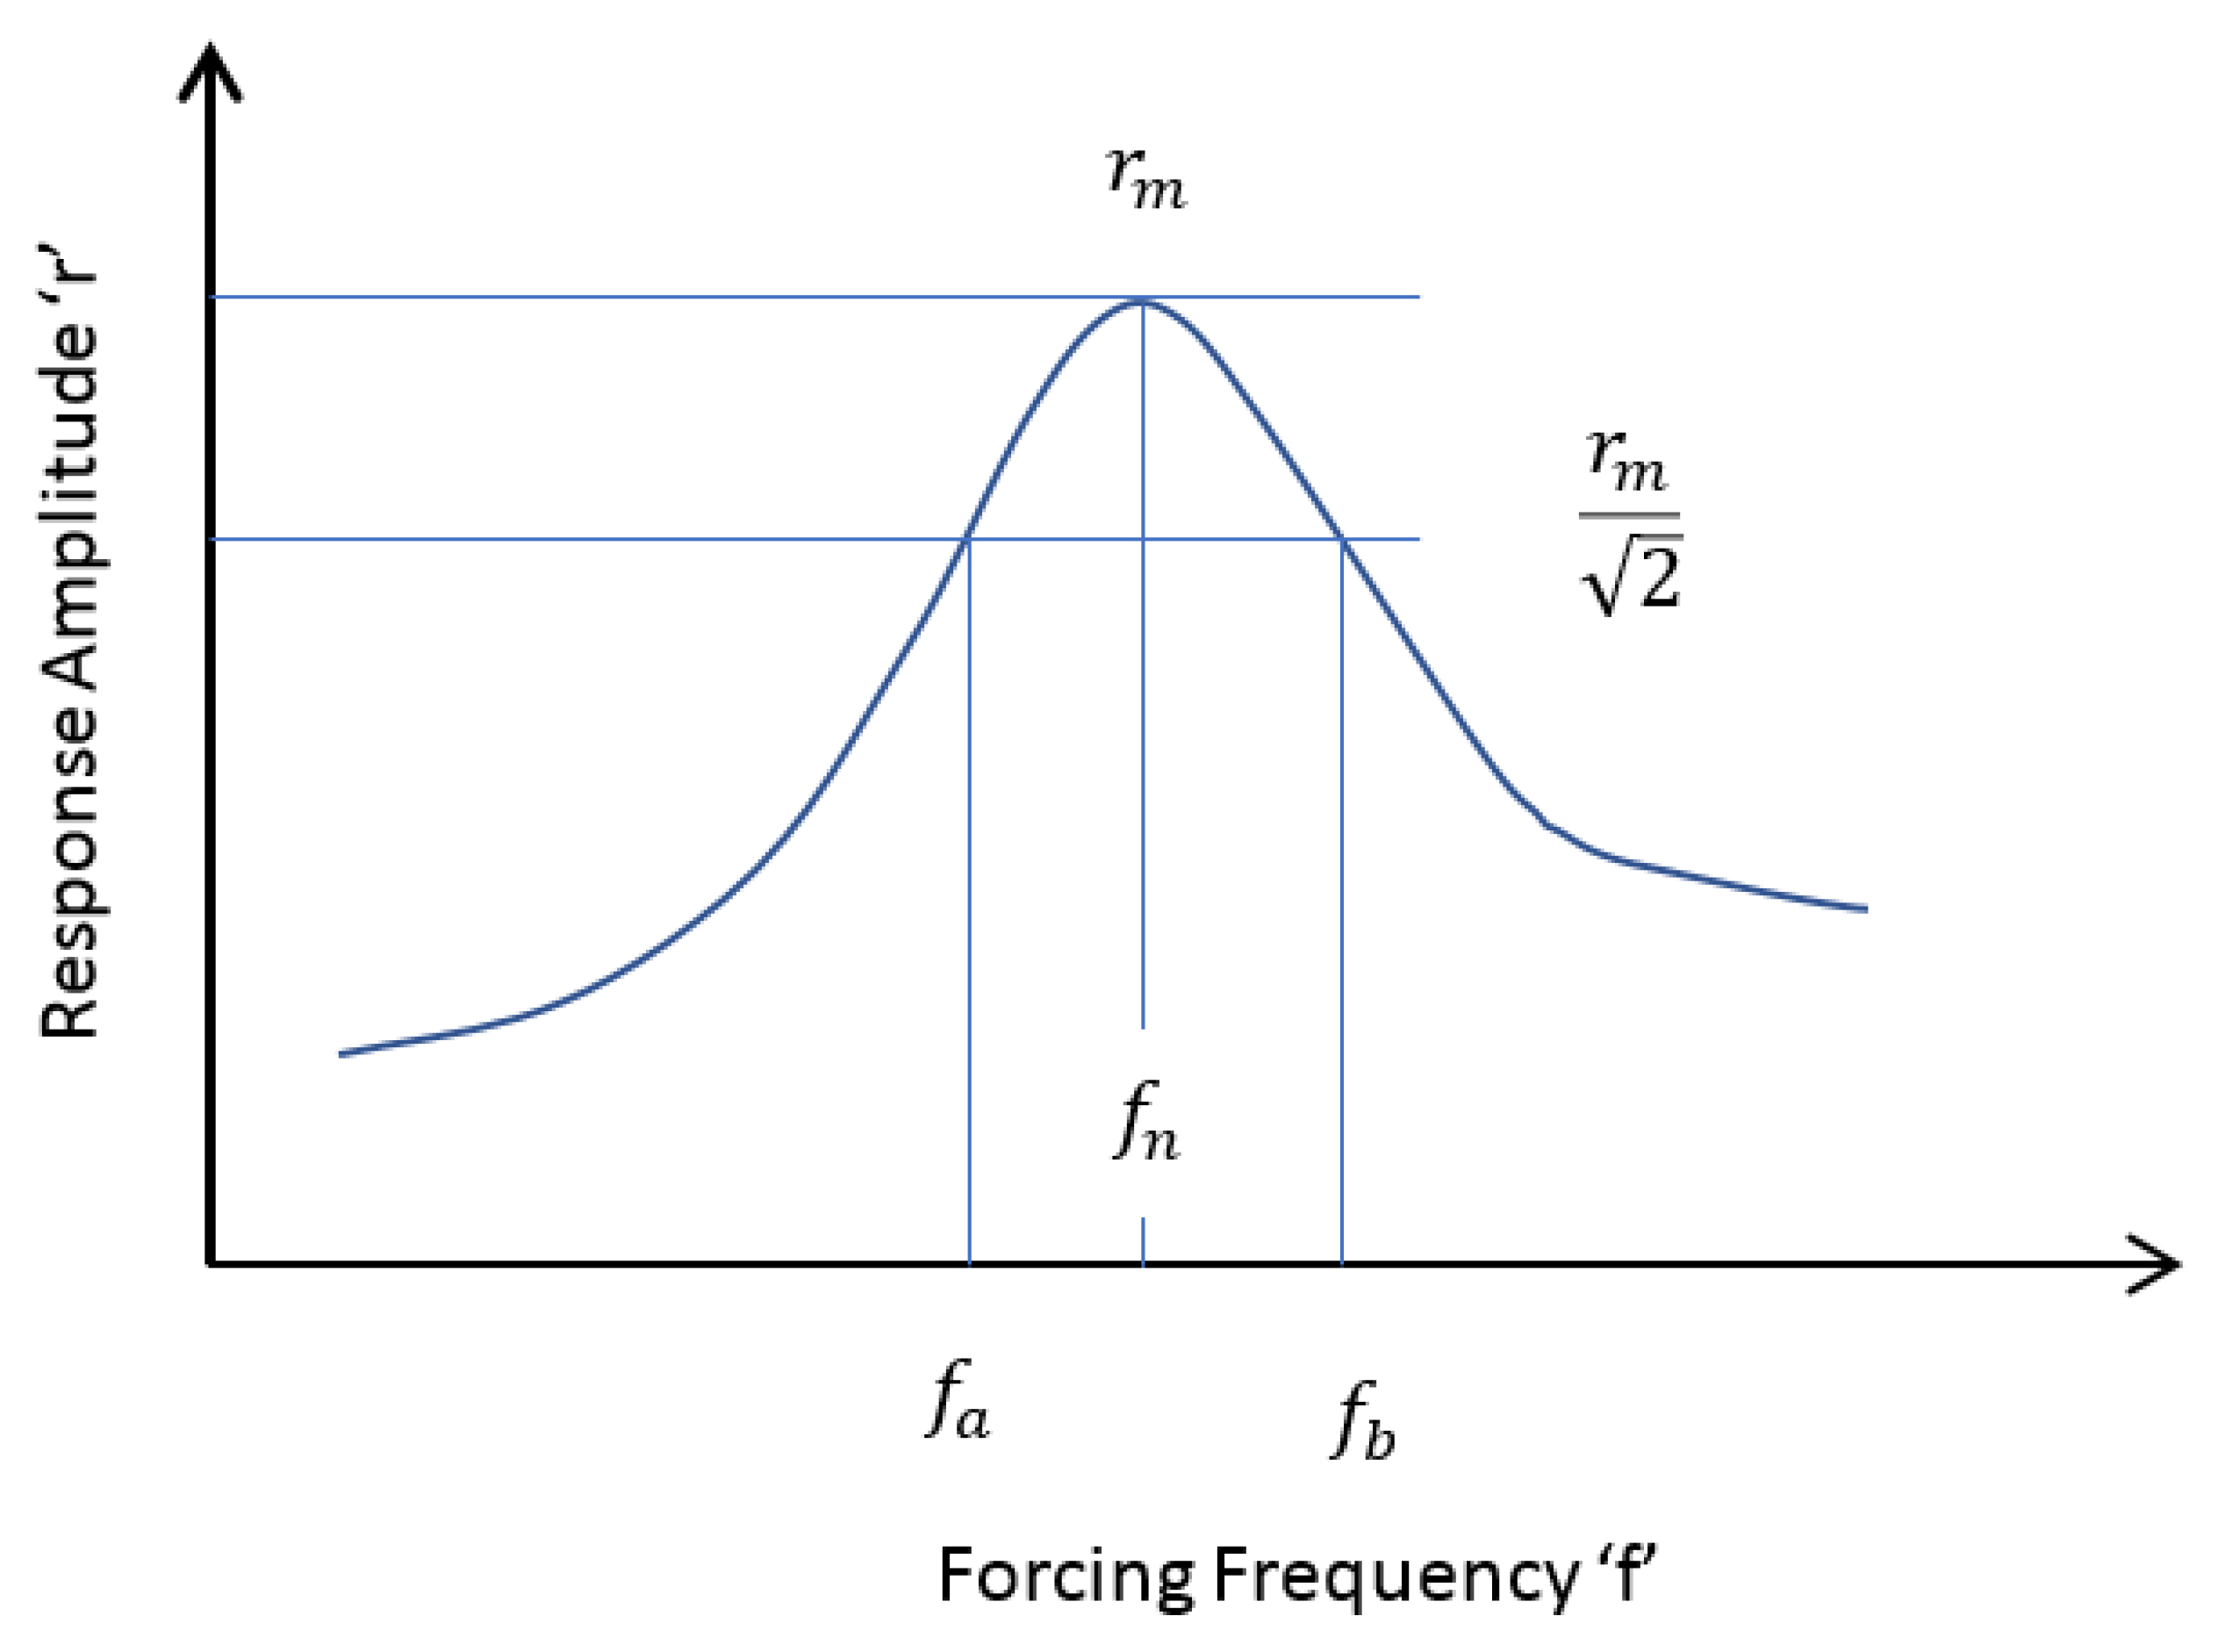
4. Damping of the System
5. Conclusions and Recommendations
Author Contributions
Funding
Institutional Review Board Statement
Informed Consent Statement
Acknowledgments
Conflicts of Interest
References
- Ng, A.L.Y.; Beale, R.G.; Godley, M.H.R. Methods of restraining progressive collapse in rack structures. Eng. Struct. 2009, 31, 1460–1468. [Google Scholar] [CrossRef]
- Javidan, M.M.; Kang, H.; Isobe, D.; Kim, J. Computationally efficient framework for probabilistic collapse analysis of structures under extreme actions. Eng. Struct. 2018, 172, 440–452. [Google Scholar] [CrossRef]
- Mohajeri Nav, F.; Usefi, N.; Abbasnia, R. Analytical investigation of reinforced concrete frames under middle column removal scenario. Adv. Struct. Eng. 2018, 21, 1388–1401. [Google Scholar] [CrossRef]
- Ahmadi, R.; Rashidian, O.; Abbasnia, R.; Mohajeri Nav, F.; Usefi, N. Experimental and numerical evaluation of progressive collapse behavior in scaled RC beam-column subassemblage. Shock Vib. 2016, 2016, 3748435. [Google Scholar] [CrossRef]
- Shayanfar, M.A.; Javidan, M.M. Progressive collapse-resisting mechanisms and robustness of RC frame–shear wall structures. J. Perform. Constr. Facil. 2017, 31, 04017045. [Google Scholar] [CrossRef]
- RMI. Specification for the Design, Testing and Utilization of Industrial Steel Storage Racks; RMI: Basalt, CO, USA, 1997. [Google Scholar]
- ECS. Steel Static Storage Systems—Adjustable Pallet Racking Systems—Principles for Structural Design, EN 16681; European Committee for Standardization: Brussels, Belgium, 2016. [Google Scholar]
- Liu, P.; Peterman, K.; Schafer, B. Test Report on Cold-Formed Steel Shear Walls; Johns Hopkins University: Baltimore, MD, USA, 2012. [Google Scholar]
- FEMA. Seismic Considerations for Steel Storage Racks Located in Areas Accessible to the Public, FEMA460; Federal Emergency Management Agency: Washington, DC, USA, 2005. [Google Scholar]
- User Guide for Steel Storage Racks, CSA A344; Canadian Standards Association: Toronto, ON, Canada, 2017.
- Rack Manufacturer’s Institute. Specification for the Design, Testing and Utilization of Industrial Steel Storage Racks, ANSI MH16; Rack Manufacturer’s Institute: Charlotte, CA, USA, 2012. [Google Scholar]
- Vassiliou, M.F.; Mackie, K.R.; Stojadinović, B. A finite element model for seismic response analysis of deformable rocking frames. Earthq. Eng. Struct. Dyn. 2017, 46, 447–466. [Google Scholar] [CrossRef]
- Di Egidio, A.; Alaggio, R.; Aloisio, A.; de Leo, A.M.; Contento, A.; Tursini, M. Analytical and experimental investigation into the effectiveness of a pendulum dynamic absorber to protect rigid blocks from overturning. Int. J. Non-Linear Mech. 2019, 115, 1–10. [Google Scholar] [CrossRef]
- Elias, G.C.; de Almeida Neiva, L.H.; Sarmanho, A.M.C.; Alves, V.N.; Castro, A.F.B.E. Ultimate load of steel storage systems uprights. Eng. Struct. 2018, 170, 53–62. [Google Scholar] [CrossRef]
- Yin, L.; Tang, G.; Zhang, M.; Wang, B.; Feng, B. Monotonic and cyclic response of speed-lock connections with bolts in storage racks. Eng. Struct. 2016, 116, 40–55. [Google Scholar] [CrossRef]
- Taheri, E.; Firouzianhaji, A.; Usefi, N.; Mehrabi, P.; Ronagh, H.; Samali, B. Investigation of a Method for Strengthening Perforated Cold-Formed Steel Profiles under Compression Loads. Appl. Sci. 2019, 9, 5085. [Google Scholar] [CrossRef]
- Taheri, E.; Firouzianhaji, A.; Mehrabi, P.; Hosseini, B.V.; Samali, B. Experimental and Numerical Investigation of a Method for Strengthening Cold-Formed Steel Profiles in Bending. Appl. Sci. 2020, 10, 3855. [Google Scholar] [CrossRef]
- Kanyilmaz, A.; Castiglioni, C.A.; Brambilla, G.; Chiarelli, G.P. Experimental assessment of the seismic behavior of unbraced steel storage pallet racks. Thin-Walled Struct. 2016, 108, 391–405. [Google Scholar] [CrossRef]
- Bernuzzi, C.; Di Gioia, A.; Gabbianelli, G.; Simoncelli, M. Pushover analyses of hand-loaded steel storage shelving racks. J. Earthq. Eng. 2017, 21, 1256–1282. [Google Scholar] [CrossRef]
- Adamakos, K.; Vayas, I.; Avgerinou, S. Estimation of the behavior factor of steel storage pallet racks. In Proceedings of the 4th ECCOMAS Thematic Conference on Computational Methods in Structural Dynamics and Earthquake Engineering, Kos Island, Greece, 12–14 June 2013. [Google Scholar]
- Campiche, A. Numerical Modelling of CFS Three-Story Strap-Braced Building under Shaking-Table Excitations. Materials 2021, 14, 118. [Google Scholar] [CrossRef] [PubMed]
- Chen, C.; Scholl, R.; Blume, J. Earthquake simulation tests of industrial steel storage racks. In Proceedings of the Seventh World Conference on Earthquake Engineering, Istanbul, Turkey, 8–13 September 1980; pp. 379–386. [Google Scholar]
- Chen, C.; Scholl, R.; Blume, J. Seismic Study of Industrial Storage Racks, Report Prepared for the National Science Foundation for the Rack Manufacturers Institute Automated Storage Retrieval Systems; URS/John A. Blume & Associates: San Francisco, CA, USA, 1980. [Google Scholar]
- Chen, C.; Blume, J.A.; Scholl, R.E. Seismic-Resistant Design of Industrail Storage Racks. In Proceedings of the Dynamic Response of Structures: Experimentation, Observation, Prediction and Control, Atlanta, GA, USA, 15–16 December 1981; pp. 745–759. [Google Scholar]
- Filiatrault, A.; Higgins, P.S.; Wanitkorkul, A. Experimental stiffness and seismic response of pallet-type steel storage rack connectors. Pract. Period. Struct. Des. Constr. 2006, 11, 161–170. [Google Scholar] [CrossRef]
- Filiatrault, A.; Wanitkorkul, A. Shake-Table Testing of Frazier Industrial Storage Racks; Report No. CSEE-SEESL-2005-02; Structural Engineering and Earthquake, University at Buffalo: Buffalo, NY, USA, 2004. [Google Scholar]
- Sideris, P.; Filiatrault, A.; Leclerc, M.; Tremblay, R. Experimental investigation on the seismic behavior of palletized merchandise in steel storage racks. Earthq. Spectra 2010, 26, 209–233. [Google Scholar] [CrossRef]
- Simoncelli, M.; Tagliafierro, B.; Montuori, R. Recent development on the seismic devices for steel storage structures. Thin-Walled Struct. 2020, 155, 106827. [Google Scholar] [CrossRef]
- Mohammadi, M.; Kafi, M.A.; Kheyroddin, A.; Ronagh, H. Performance of innovative composite buckling-restrained fuse for concentrically braced frames under cyclic loading. Steel Compos. Struct. Int. J. 2020, 36, 163–177. [Google Scholar]
- Mohammadi, M.; Kafi, M.A.; Kheyroddin, A.; Ronagh, H.R. Experimental and numerical investigation of an innovative buckling-restrained fuse under cyclic loading. Structures 2019, 22, 186–199. [Google Scholar] [CrossRef]
- Sharafi, P.; Mortazavi, M.; Usefi, N.; Kildashti, K.; Ronagh, H.; Samali, B. Lateral force resisting systems in lightweight steel frames: Recent research advances. Thin-Walled Struct. 2018, 130, 231–253. [Google Scholar] [CrossRef]
- Azandariani, M.G.; Rousta, A.M.; Usefvand, E.; Abdolmaleki, H.; Azandariani, A.G. Improved seismic behavior and performance of energy-absorbing systems constructed with steel rings. Structures 2021, 29, 534–548. [Google Scholar] [CrossRef]
- Azandariani, M.G.; Azandariani, A.G.; Abdolmaleki, H. Cyclic behavior of an energy dissipation system with steel dual-ring dampers (SDRDs). J. Constr. Steel Res. 2020, 172, 106145. [Google Scholar] [CrossRef]
- Rosin, I.; Proenca, J.; Calado, L.; Carydis, P.; Mouzakis, H.; Castiglioni, C.; Brescianini, J.C.; Plumier, A.; Degee, H.; Negro, P.; et al. Storage Racks in Seismic Areas, EUR 23744EN; European Commision: Luxembourg, 2009. [Google Scholar]
- Gilbert, B.P.; Rasmussen, K.J. Drive-in steel storage racks I: Stiffness tests and 3D load-transfer mechanisms. J. Struct. Eng. 2012, 138, 135–147. [Google Scholar] [CrossRef]
- Shaheen, M.S.; Rasmussen, K.J. Seismic tests of drive-in steel storage racks in cross-aisle direction. J. Constr. Steel Res. 2019, 162, 105701. [Google Scholar] [CrossRef]
- Maguire, J.R.; Teh, L.H.; Clifton, G.C.; Tang, Z.; Lim, J.B. Cross-aisle seismic performance of selective storage racks. J. Constr. Steel Res. 2020, 168, 105999. [Google Scholar] [CrossRef]
- Baldassino, N.; Bernuzzi, C.; di Gioia, A.; Simoncelli, M. An experimental investigation on solid and perforated steel storage racks uprights. J. Constr. Steel Res. 2019, 155, 409–425. [Google Scholar] [CrossRef]
- Rainieri, C.; Fabbrocino, G. Operational Modal Analysis of Civil Engineering Structures; Springer: Berlin/Heidelberg, Germany, 2014; Volume 142, p. 143. [Google Scholar]
- Aloisio, A.; Di Pasquale, A.; Alaggio, R.; Fragiacomo, M. Assessment of seismic retrofitting interventions of a masonry palace using operational modal analysis. Int. J. Archit. Herit. 2020, 1–13. [Google Scholar] [CrossRef]
- Jacobsen, E.; Tremblay, R. Shake-table testing and numerical modelling of inelastic seismic response of semi-rigid cold-formed rack moment frames. Thin-Walled Struct. 2017, 119, 190–210. [Google Scholar] [CrossRef]
- Krawinkler, H. Experimental Study on Seismic Behavior of Industrial Storage Racks; Blume Earthquake Engineering Center: Stanford, CA, USA, 1978; Available online: https://core.ac.uk/download/pdf/229100879.pdf (accessed on 17 February 2021).
- Javidan, M.M.; Kim, J. Seismic Retrofit of Soft-First-Story Structures Using Rotational Friction Dampers. J. Struct. Eng. 2019, 145, 04019162. [Google Scholar] [CrossRef]
- Javidan, M.M.; Kim, J. Steel hysteretic column dampers for seismic retrofit of soft-first-story structures. Steel Compos. Struct. 2020, 37, 259–272. [Google Scholar]
- Javidan, M.M.; Kim, J. Variance—Based global sensitivity analysis for fuzzy random structural systems. Comput. Aided Civ. Infrastruct. Eng. 2019, 34, 602–615. [Google Scholar] [CrossRef]
- Carneiro, J.; Demelo, F.; Jalali, S.; Teixeira, V.; Tomas, M. The use of pseudo-dynamic method in the evaluation of damping characteristics in reinforced concrete beams having variable bending stiffness. Mech. Res. Commun. 2006, 33, 601–613. [Google Scholar] [CrossRef]
- Chopra, A.K. Dynamics of Structures Theory and Applications to Earthquake Engineering; Prentice—Hall, Englewood Cliffs: Upper Saddle River, NJ, USA, 1995. [Google Scholar]
- Usefi, N.; Sharafi, P.; Ronagh, H. Numerical models for lateral behaviour analysis of cold-formed steel framed walls: State of the art, evaluation and challenges. Thin-Walled Struct. 2019, 138, 252–285. [Google Scholar] [CrossRef]
- Mehrabi, P.; Honarbari, S.; Rafiei, S.; Jahandari, S.; Bidgoli, M.A. Seismic response prediction of FRC rectangular columns using intelligent fuzzy-based hybrid metaheuristic techniques. J. Ambient. Intell. Humaniz. Comput. 2021, 1–19. [Google Scholar] [CrossRef]


| Element | Section | Length (mm) | Area (mm2) | Ix (mm4) | Iy(mm4) |
|---|---|---|---|---|---|
| Beam | Box105 × 50-1.6 mm | 1350 | 597 | 1,023,099 | 237,210 |
| Upright | 90 Upright 2.35 mm | 2800 | 578.6 | 700,217 | 325,825 |
| Brace | 25 × 30 × 1.8 (C Channel) | 1062 | 217 | 19,956 | 11,388 |
| Test Phase | Time Scaling Factor * | Earthquake Record | Intensities (%) |
|---|---|---|---|
| One | 1 | Northridge (1994) | 10 |
| El-Centro (1940) | 20 | ||
| Two | 20, 40, 60, 70, 80 | ||
| Three | 2 | 40, 60, 80, 100, 120, 140, 160, 180, 200, 220 |
| Intensity (% ELC) | Top Level Disp. (mm) | 1st Level Disp. (mm) | Top Level Acc. (a/g) | 1st Level Acc. (a/g) | Top Level Pallet Acc. (a/g) | 1st Level Pallet Acc. (a/g) |
|---|---|---|---|---|---|---|
| 20 | 16.4 | 10.0 | 0.15 | 0.086 | 0.15 | 0.083 |
| 40 | 47.5 | 39.1 | 0.31 | 0.23 | 0.33 | 0.23 |
| 60 | 60.6 | 47.7 | 0.52 | 0.29 | 0.5 | 0.285 |
| 70 | 68.4 | 52.6 | 0.61 | 0.35 | 0.54 | 0.327 |
| 80 | 76.2 | 58 | 0.69 | 0.425 | 0.545 | 0.396 |
| Intensity (% ELC) | Top Level Disp. (mm) | 1st Level Disp. (mm) | Top Level Acc. (a/g) | 1st Level Acc. (a/g) | Top Level Pallet Acc. (a/g) | 1st Level Pallet Acc. (a/g) |
|---|---|---|---|---|---|---|
| 40 | 9.21 | 5.76 | 0.132 | 0.08 | 0.078 | 0.068 |
| 60 | 14.56 | 8.95 | 0.21 | 0.14 | 0.13 | 0.11 |
| 80 | 19.31 | 11.84 | 0.27 | 0.16 | 0.16 | 0.14 |
| 100 | 22.94 | 13.81 | 0.33 | 0.19 | 0.19 | 0.16 |
| 120 | 26.36 | 15.70 | 0.36 | 0.21 | 0.22 | 0.18 |
| 140 | 29.43 | 17.45 | 0.42 | 0.23 | 0.23 | 0.19 |
| 160 | 31.85 | 19.05 | 0.45 | 0.25 | 0.25 | 0.21 |
| 180 | 33.42 | 20.20 | 0.48 | 0.26 | 0.26 | 0.22 |
| 200 | 35.39 | 21.19 | 0.50 | 0.27 | 0.28 | 0.23 |
| 220 | 37.82 | 22.91 | 0.52 | 0.28 | 0.29 | 0.24 |
| Time–Domain Scale | Intensity (%ELC) | Frequency (Hz) | Damping Ratio (%) | Top Level Displacement (mm) |
|---|---|---|---|---|
| Non scaled | 60 | 1.5 | 16.7 | 60.4 |
| 70 | 1.4 | 18.6 | 68.4 | |
| 80 | 1.35 | 19.2 | 76.2 | |
| Scaled | Before Tests | 1.85 | 5.3 | 0 |
| 40 | 1.85 | 6.8 | 9.21 | |
| 60 | 1.85 | 6.8 | 14.56 | |
| 80 | 1.85 | 7.4 | 19.31 | |
| 100 | 1.85 | 7.4 | 22.94 | |
| 120 | 1.85 | 7.5 | 26.36 | |
| 140 | 1.80 | 7.7 | 29.43 | |
| 160 | 1.80 | 7.3 | 31.85 | |
| 180 | 1.75 | 7.7 | 33.42 | |
| 200 | 1.70 | 8.1 | 35.39 | |
| 220 | 1.65 | 8.0 | 37.82 |
Publisher’s Note: MDPI stays neutral with regard to jurisdictional claims in published maps and institutional affiliations. |
© 2021 by the authors. Licensee MDPI, Basel, Switzerland. This article is an open access article distributed under the terms and conditions of the Creative Commons Attribution (CC BY) license (http://creativecommons.org/licenses/by/4.0/).
Share and Cite
Firouzianhaji, A.; Usefi, N.; Samali, B.; Mehrabi, P. Shake Table Testing of Standard Cold-Formed Steel Storage Rack. Appl. Sci. 2021, 11, 1821. https://doi.org/10.3390/app11041821
Firouzianhaji A, Usefi N, Samali B, Mehrabi P. Shake Table Testing of Standard Cold-Formed Steel Storage Rack. Applied Sciences. 2021; 11(4):1821. https://doi.org/10.3390/app11041821
Chicago/Turabian StyleFirouzianhaji, Ahmad, Nima Usefi, Bijan Samali, and Peyman Mehrabi. 2021. "Shake Table Testing of Standard Cold-Formed Steel Storage Rack" Applied Sciences 11, no. 4: 1821. https://doi.org/10.3390/app11041821
APA StyleFirouzianhaji, A., Usefi, N., Samali, B., & Mehrabi, P. (2021). Shake Table Testing of Standard Cold-Formed Steel Storage Rack. Applied Sciences, 11(4), 1821. https://doi.org/10.3390/app11041821