Article

Research on Microstructure of Soft Clay under Various Artificial Ground Freezing Conditions Based on NMR

1
Research Center of Coastal and Urban Geotechnical Engineering, Zhejiang University, Hangzhou 310058, China
2
School of Civil Engineering and Architecture, Zhejiang University of Science and Technology, Hangzhou 310023, China
3
Department of Civil Engineering, Zhejiang University City College, Hangzhou 310011, China
*
Authors to whom correspondence should be addressed.
Appl. Sci. 2021, 11(4), 1810; https://doi.org/10.3390/app11041810
Submission received: 14 January 2021 / Revised: 7 February 2021 / Accepted: 13 February 2021 / Published: 18 February 2021
(This article belongs to the Section Civil Engineering)

Abstract

:
Nuclear magnetic resonance (NMR) can help to collect soft clay pore size data. This paper uses NMR to study the effect of freezing duration, the gap time between two freezing actions and thawing temperature on the pore size distribution (PSD) in soft clay. It was found that most of the freezing and thawing progress was completed during the first two hours. A longer time gap between the first and second freezing cycles leads to greater structural damage. An appropriate thawing temperature results in less subsidence induced by the artificial ground freezing (AGF). A new method to distinguish water types for various freezing conditions is proposed. This freezing method to determine the cutoff value could fill the defect in the previous methods.

1. Introduction

Artificial freezing technique is an efficient method in soft clay reinforcement, it can both reduce the cost and shorten the construction period. In tunneling, especially in soft clay, artificial ground freezing (AGF) has been widely used [1,2,3]. However, the freezing–thawing cycles change the microstructure of soft clay and result in greater compressibility [4,5]. Information of the microstructural change in the soft clay is helpful for clarifying the deformation mechanism of the ground. To explore the microstructural change, pore size distribution (PSD) is selected as the index to quantize the soft clay microstructure [6,7].
There are five methods to measure the PSD of soft clay: mercury intrusion porosimetry, scanning electron microscopy, time domain reflectometry, computer tomography, and gas adsorption [8]. The first two methods are most commonly used. The mercury intrusion porosimetry methods obtain the PSD of soil by pressing mercury into the soil structure. Diamond determined the PSD of clay samples by mercury intrusion porosimetry, indicating that the range of equivalent pore diameter covers almost five orders of magnitude [9]. Mercury intrusion porosimetry tests on kaolin soil showed that there were test result errors associated with certain pore-size diameters [10]. Liquid water and ice coexist in frozen soft clay, and water retention properties are best obtained at high matrix potentials from draining and at low matrix potentials from freezing [11]. Wang and Li determined the surface fractal dimensions for porous media by mercury intrusion porosimetry [12]. Scanning electron microscopy uses the pictures of soil to observe the microstructure of soil [13,14,15]. Imprecise PSD of soil specimens can be obtained from scanning electron microscopy analysis [16,17,18]. Some scientists combine multiple methods to study the microstructure of soil. Zhou and Tang compared the porosity of frozen–thawed soil tested by scanning electron microscopy and mercury intrusion porosimetry. They concluded that freeze–thaw progress produced more connected and slender pores in the clay [19]. Chen et al. used mercury intrusion porosimetry and scanning electron microscopy to describe the microstructure and morphological character of clay [20,21]. Studies have shown that each method has its limitations, so combining multiple methods can get more accurate PSD.
In a break from traditional methods, low-field NMR (LF-NMR) technology offers a quick, lossless and repeatable way of precisely measuring water in samples [22,23]. Currently, NMR technology has been widely used in various industries, including chemistry, fuel, and medicine [24,25,26]. Geotechnical engineering has also benefited from NMR technology in recent years [27]. Low field NMR can obtain the signal from water in soft clay much more precisely, intelligently, and quickly [28,29]. Comparing NMR with MIP, Yao and Liu found that Low field NMR is an efficient tool for quantifying the PSD in coal nondestructively [29]. Additionally, Li et al. optimized the scheme of NMR measurement [30].
Progress has been made through technological developments concerning soft clay microstructure behavior when subjected to freeze–thaw cycling. The effect of freeze–thaw cycles on soil microstructure was tested by NMR and implied that pore crystallization could alter the soft clay structure and lead to severe frost heave, deterioration of soil engineering properties [31]. However, the current microstructure research on frozen–thawed soft clay mostly focuses on seasonal freezing–thawing. Unlike soft clay subjected to seasonal freeze–thaw cycles, soft clay subjected to artificial ground freezing (AGF), which completes the freeze–thaw cycle in a short time, experiences severe uneven settlement on subway foundations [18]. The degree of soil structure damage from water freezing is influenced by multiple factors [32,33,34,35,36,37], whereas, research on the soft clay microstructure under different freezing conditions in AGF construction is still blank. Therefore, the effect of freezing duration, gap time, and thawing temperature on soil microstructure will be investigated in this study.
T2 is the time that the transverse relaxation recovers to 63% after pulse. A T2 cutoff value could be applied to distinguish bound-water and free-fluid in soil samples [22]. Accurate measurement of cut-off value is an important part of evaluating soil strength [38]. There are two commonly used methods to test the cut-off value, including empirical method and high-speed centrifugation method. To fill the defect in the previous methods, a freezing way to determine T2 cutoff value will be proposed in this study.

2. Influence of AGF on Soft Clay

2.1. Measured Subsidence Data in AGF Area

Long-term subsidence of subways will always be a crucial problem in soft clay areas, which are complicated by the use of AGF [4,37]. Figure 1 shows the uneven settlement between two consecutive subway stations in Hangzhou, China (Yangtze River Delta). Additionally, montmorillonite-kaolinite clay is the main composition of the silty soft soil in this place, which has poor mechanical properties. The dataset featured is the cumulative subsidence in slightly overlapping AGF construction regions (in blue). After one month of operation, the maximum cumulative subsidence value reached −14 mm. It should be noted that after five months of operation the AGF and normal construction regions no longer showed decoupled subsidence responses.

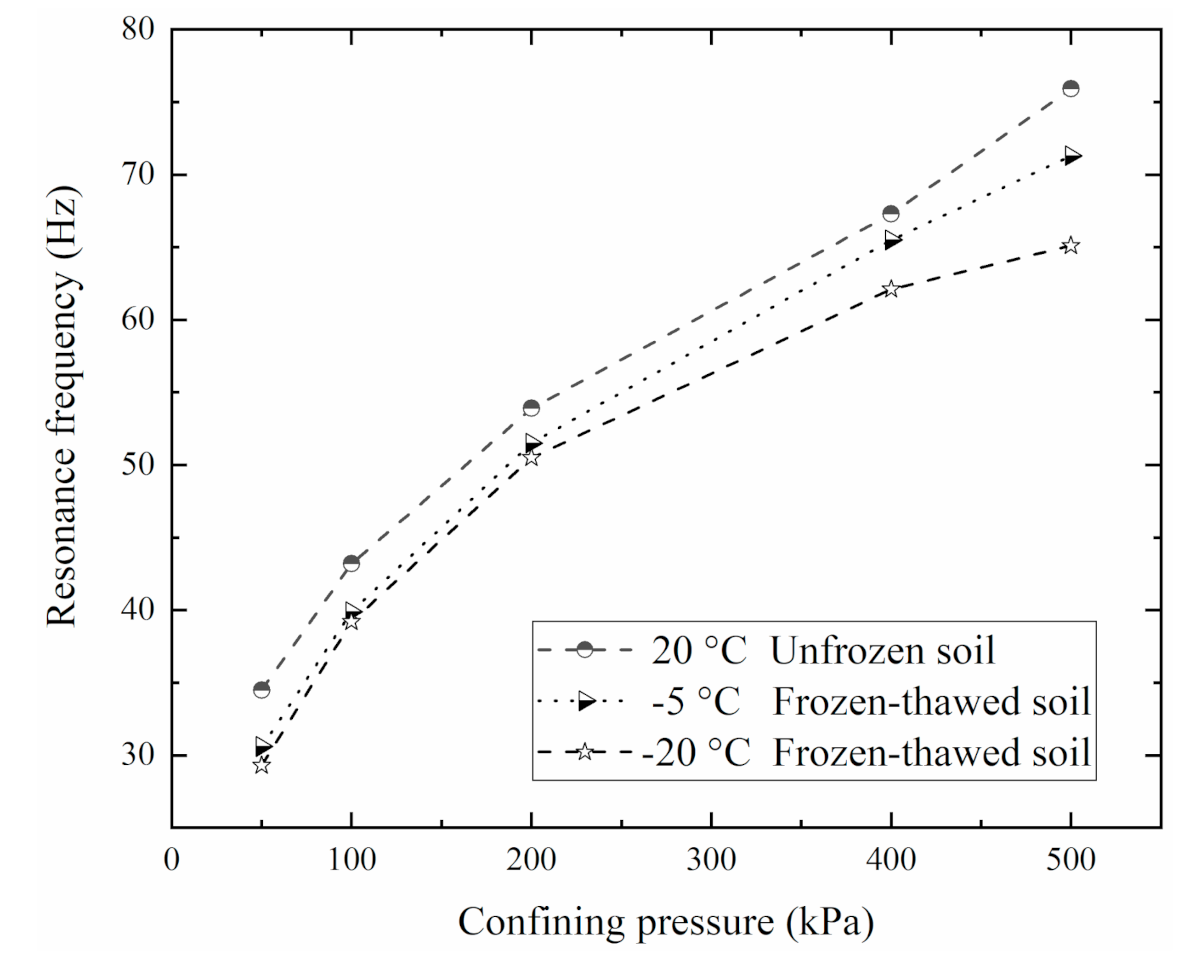
2.2. Stiffness Variation after Freeze–Thaw Action

Freeze–thaw action leading to a reduction in mechanical properties for building materials is expressed as a lower resonance frequency value tested from a resonance column experiment [39,40]. The relation of shear modulus G and resonance frequency fn is:
G = ρ 2 π L f n β 2 ,
In Equation (1), ρ is density, L is the length of sample, and β is instrument parameters. The lower the G value is, the more easily the deformation occurs. As Figure 2 shows the resonance frequency of thawed soft clays is positively correlated to the confining pressure. Furthermore, the freezing conditions have some influence on the soft clay shear modulus. To find the root cause of the impact, the freezing damage mechanism must be understood.

3. Materials and Methods

3.1. Soft Clay Samples

Soft clay samples taken from Zijingang Campus, located in Hangzhou City, Zhejiang Province, China. The soft clay had density ρ = 1.82 g/cm3, specific gravity Gs = 2.75, water content ω = 45%, plastic limit ωp = 33.4%, liquid limit ωL = 51.6%, and plasticity index Ip = 18.2. The reference range of the thermal conductivity was 0.8–1 W.m −1 K −1. Prior to the series of tests in this study, to minimize the uneven error, the undisturbed collected soft clay was remolded by the vacuum preloading method. First, the undisturbed soft clay was placed into the drying oven at 200 °C for 24 h. Then, the dry soft clay was crushed into a powder. Finally, the powder was mixed with hot water and placed into a vacuum container at −450 kPa for six weeks.
It is clear that the vacuum preloading soft clay had a uniform distribution from the cross-section of remolded soft clay (Figure 3). As shown in Figure 3a,b, the average value of the main peak was approximately 9%, while the average value of the subpeak was approximately 0.2%. The area between the curves and the X-axis represents the volume percent of corresponding sizes pores, thus, the small pores occupied 99% of the whole void volume.
The remolded soft clay was prepared in a cylinder with 38 mm in diameter and 76 mm in height. Then, the cylinder was placed in a vacuum saturation barrel at −100 kPa for 3 h. Finally, the soft clay was soaked in the cylinder at atmospheric pressure for 12 h to obtain saturated soft clay samples. Then the pores in the soft clay samples were full of water.

3.2. NMR Technique

3.2.1. Principle of NMR Spectrometry

The low-field NMR, MesoMR23-060H-I (provided by Newmag Company) was employed to investigate the PSD of soft clay. The soft clay sample was composed of soft clay aggregates and water. Additionally, the water distribution reflects pore distribution in the saturated soft clay (Figure 4), the brown particles in the picture represent aggregate, and the blue particles in the pictures represent water in the soil.
NMR operates on the principle of nuclear spin in a magnetic field. A nucleus spins around its own axis generating a magnetic field when the number of protons is odd, and the number of neutrons is even simultaneously. Therefore, hydrogen, which has an odd number of protons and an even number of neutrons, can be used to calculate liquid water content. There is no magnetization vector detected from a water molecule, unless it is exposed to a magnetic field, wherein it produces a macroscopic longitudinal magnetization vector because of the magnetic field. After a 90° pulse, the magnetic resonance detects the rotating transverse magnetization vector, then the magnetization vector gradually decreases to zero. The CMPG sequence, which can ensure accurate results and repeatability, is used to identify the saturated soft clay specimens [41]. The parameter T2 is introduced to represent the time required for the transverse magnetization vector decaying to 37% of its maximum value.
Assume the shape of a pore is cylindrical, and the diffusion time is negligible [35]. The T2 distribution has been correlated with the PSD curve [22], allowing the pore throat radii to be estimated with high accuracy by using the Laplace inverse transform and multiregression analysis [42]. The relationship of pore radius r (Figure 5) and T2 is given by Equation (2), in which ρ2 is the surface relativity, S represents surface area of the pore, and V represents the volume of the water.
1 T 2 ρ 2 S V p o r e = ρ 2 2 r
The soft clay sample was scanned before and after the freezing action. The previously prepared saturated soft clay samples were divided into two equal fractions to expose them to the 60 mm × 60 mm uniform magnetic field of the NMR equipment. The H elements in water can be detected by the magnetic field accurately, then the water distribution in soft clay is obtained. For the saturated soft clay samples, the distribution of water is the distribution of pores. Different pore size gives different signal intensity, then the pore size distribution is calculated. The small pores mainly come from the voids between soft clay particles, and the medium pores mainly come from the voids between aggregates (Figure 6).
To easily describe the test result in this paper, we defined the main peak as small pores, and the subpeak as medium pores in the soft clay (Figure 7). The freezing action has different influences on the water at different pore sizes. The first, second, and third peak identify the small, medium and large pores separately with the increasing of the radius.

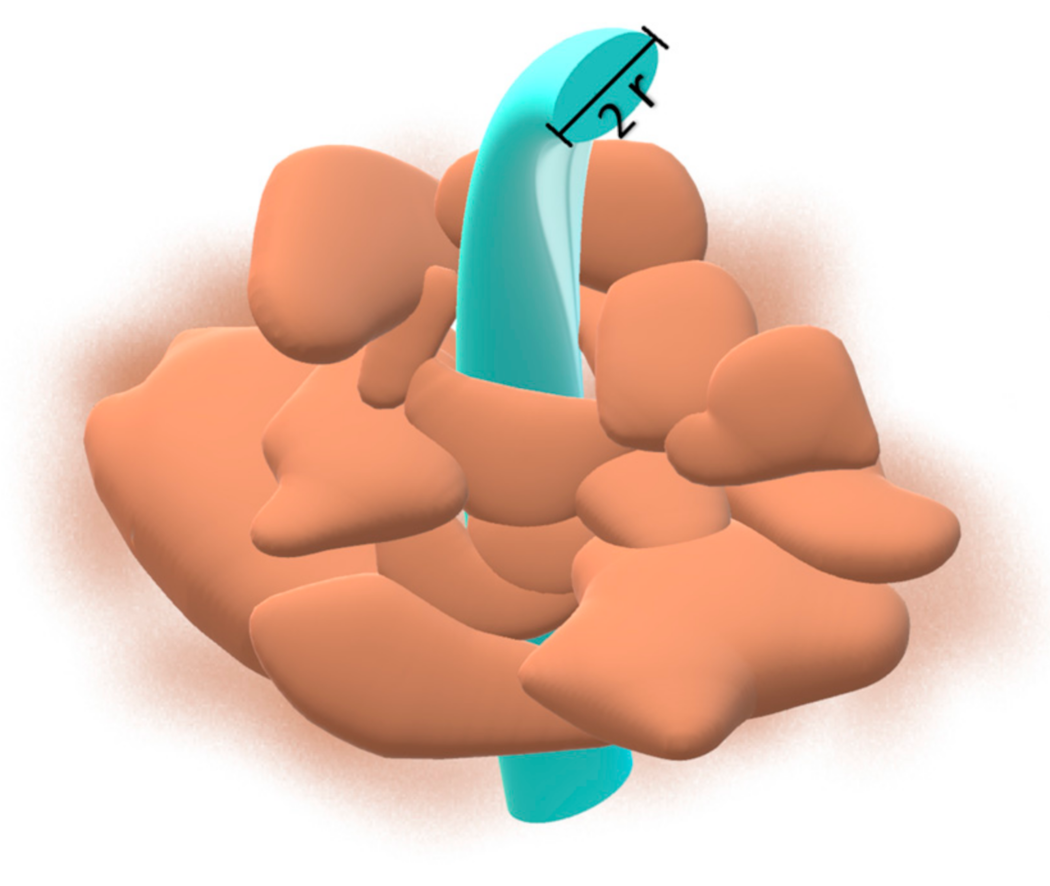
3.2.2. Surface Relaxation Ratio of Soft Clay

Using this method, we correlated the NMR response with PSD results measured using other techniques to calculate the surface relaxivity, and to determine the value of ρ in Equation (1). The value of ρ could be determined with the mercury intrusion porosimetry result [43,44]. The NMR and mercury intrusion porosimetry techniques could verify and improve each other. From the test result in the reference [45] in Figure 8, it can be concluded that the pore size has the highest proportion between 50 and 200 nm, and 26.9% of pores remain below 50 nm. Based on ρ = r/(2 × T2), to satisfy the pore size percentages, the value of ρ was judiciously chosen as 44.5.

3.3. Freezing Plan

Water freezing causes expansion in saturated soft clay, which damages the soft clay structure [46]. As shown in Figure 9, frozen soft clay has many surface fissures, and the number of fissures multiplied after thawing.
Variable setting based on mechanism research and construction situation:
  • Different freezing durations could show the progress of pore water freezing. Since there are three types of water to consider, including strong bound water, weak bound water, and free water, the freezing process is complicated compared with normal water.
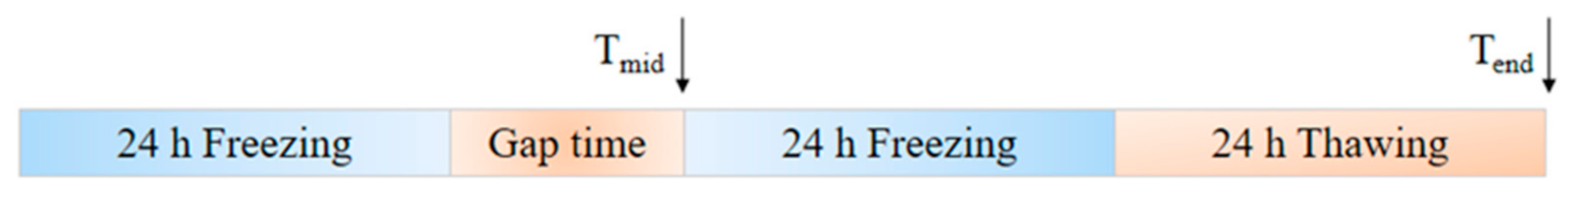
  • Considering the risk of a water or electricity accident during construction, the freezing process could be interrupted for an uncertain time and understanding this impact is crucial. Therefore, in this section we characterized the influence of gap time on pore distribution. Time nodes to detect pore size are shown in Figure 10.
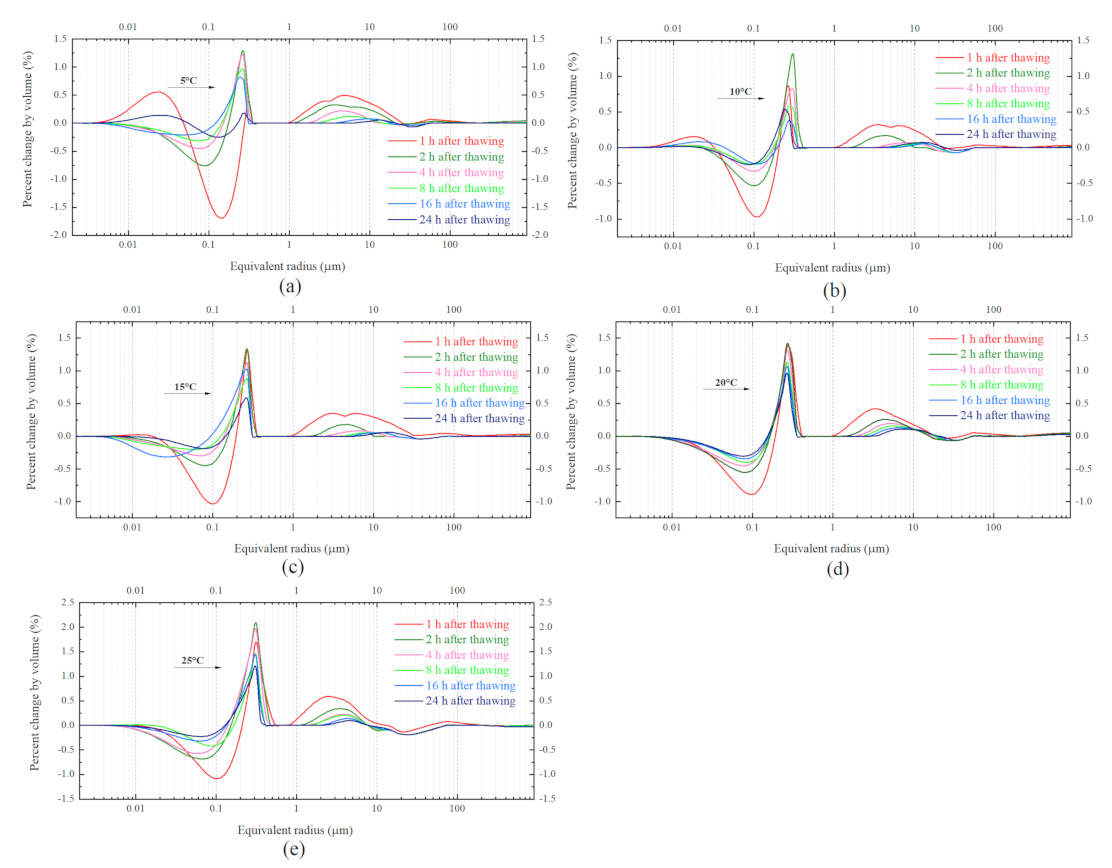
  • The seasonal change in Hangzhou spans a temperature range from −10 to 40 °C, and the underground subway is buried at a depth of 7–10 m. Therefore, the thawing temperature ranging from 5 to 25 °C is reasonable.
Variables are set based on the above conditions. All the prepared samples were frozen under specific temperature and times following the experimental program described in Table 1. Considering a medium freezing temperature and transmission efficiency, it is suitable to choose −20 °C as a test freezing temperature [47].
Three groups of variables were set to analyze the pore distribution change under different freezing conditions. The A1–A7 and C1–C5 samples were frozen under different freezing durations from 1 to 24 h at −20 °C. The second frozen soft clay samples with different gap times, from 1 to 24 h, were numbered as B1–B8. Five different thawing temperatures from 5 to 25 °C for −20 °C frozen soft clay samples were set as C1–C5. The testers tried to avoid any possible accidents to obtain highly reproducible and accurate results. For every serial number in Table 1, there are two samples for parallel trials, the average of the two experiments will be taken into account if the trends are consistent. The test will be repeated if the parallel trials differ widely to make sure the test results are reliable.

4. Results

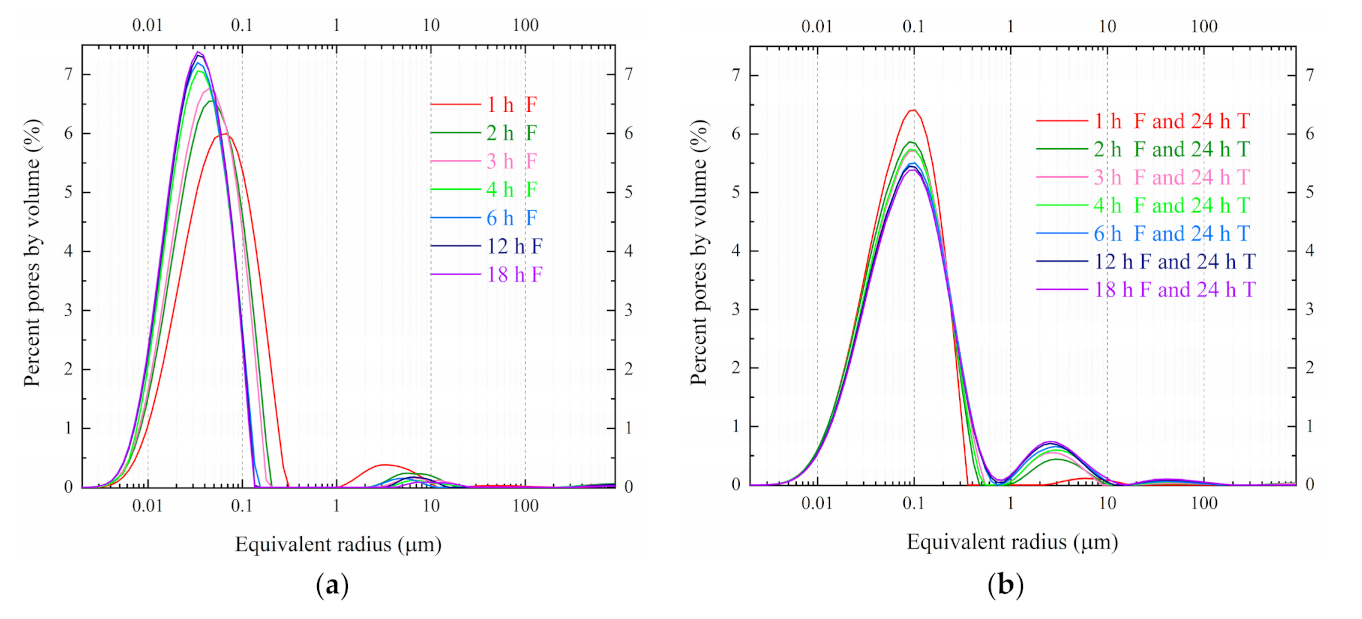
4.1. PSD under Different Freezing Durations at −20 °C

The freezing process has a complex relationship with thermal, hydraulic, and mechanical transformation [48], which could be investigated by analyzing the subtle changes in PSD for different freezing durations.
When the temperature drops below the freezing point of the soft clay, the free water and part of the weak bound water in the soft clay gradually begin to freeze. Free water with a small intermolecular force freezes quickly, while free water with a large van der Waals force and some weak bound water freezes at a slow rate. Due to the interaction between the water and the soft clay surface, a part of the water in the soft clay is difficult to freeze [49]. The water content in the soft clay measured under different freezing durations can reflect the icing sequence of the water in the soft clay, and the freezing duration can affect the icing process of the soft clay so that affect the final damage of the soft clay. Pore water cannot be detected by nuclear magnetic resonance after freezing, so the PSD of soft clay after freezing for a certain period only reflect the distribution of unfrozen water.
The unfrozen water is a key component that determines a soft clay’s physical change [49,50]. However, the frozen water is the key reason for microstructural damage. To explain the rationale behind the destructive effect of freezing, the percent change by volume at different freezing durations is plotted in Figure 11. It can be seen from Figure 11a that the water in the mesopores froze firstly and the water in the smaller pores froze later. The PSD of frozen soft clay at different freezing durations after thawing for 24 h is shown in Figure 11b. At this time, all the ice in the soft clay has melted into water, and all signals from water can be detected. In the case of freezing for 1 h and freezing for 2 h, the distribution of pores in the soft clay changes greatly. After freezing for 2 h, the peak proportion of small pores decreased by nearly 0.5%, and the peak proportion of mesopores increases by nearly 0.5%. The change in soft clay pores within 2–18 h of freezing is the same as the two hours before freezing. This indicates that during the entire freezing process, the freezing speed of water decreased.
After six hours of freezing, the freezing duration is no longer the main cause of the soft clay microstructure damage. Pores from 0 to 0.3 µm increased with freezing duration and the freezing stage was mostly completed in the first four hours, as demonstrated by the near overlap of the 6 h and 18 h curves.

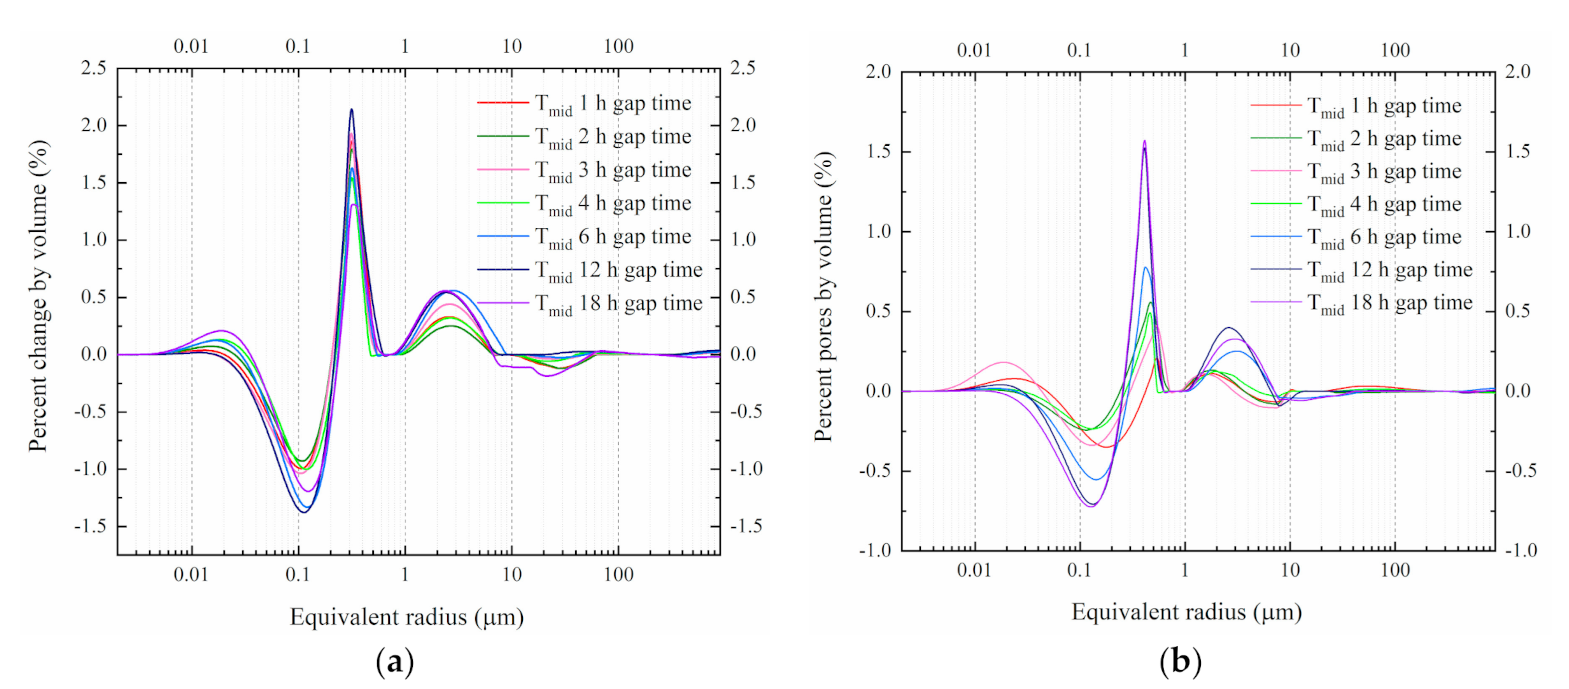
4.2. PSD under Different Freezing Gap Times at −20 °C

Figure 12a shows the pore distribution after setting gap times between freeze–thaw cycles. In general, with the increase in gap time, the first peak value decreased while the second peak value increased. As the thawing progressed, the ice in the pores from 1 to 10 µm gradually melted into water then the medium pores could be mistaken for small pores and be detected accurately. Figure 12b shows the pore distribution after two freezing–thawing cycles. After thawing, the pore size distribution range expanded and the value of two main peaks decreased after the full process. The differentiation of the seven curves reduced, but the differentiation related to the different gap times was still obvious after the second thawing cycle. The pores enlarged by freezing water had enough time to thaw so the subpeak moved left after the second thawing cycle. The freeze–thaw process included first pore volume expansion then contraction.
The longer the gap time, the greater the damage from the second freeze–thaw action. Unlike the freezing process, there is no obvious relationship between melting rate and melting time in the thawing process.

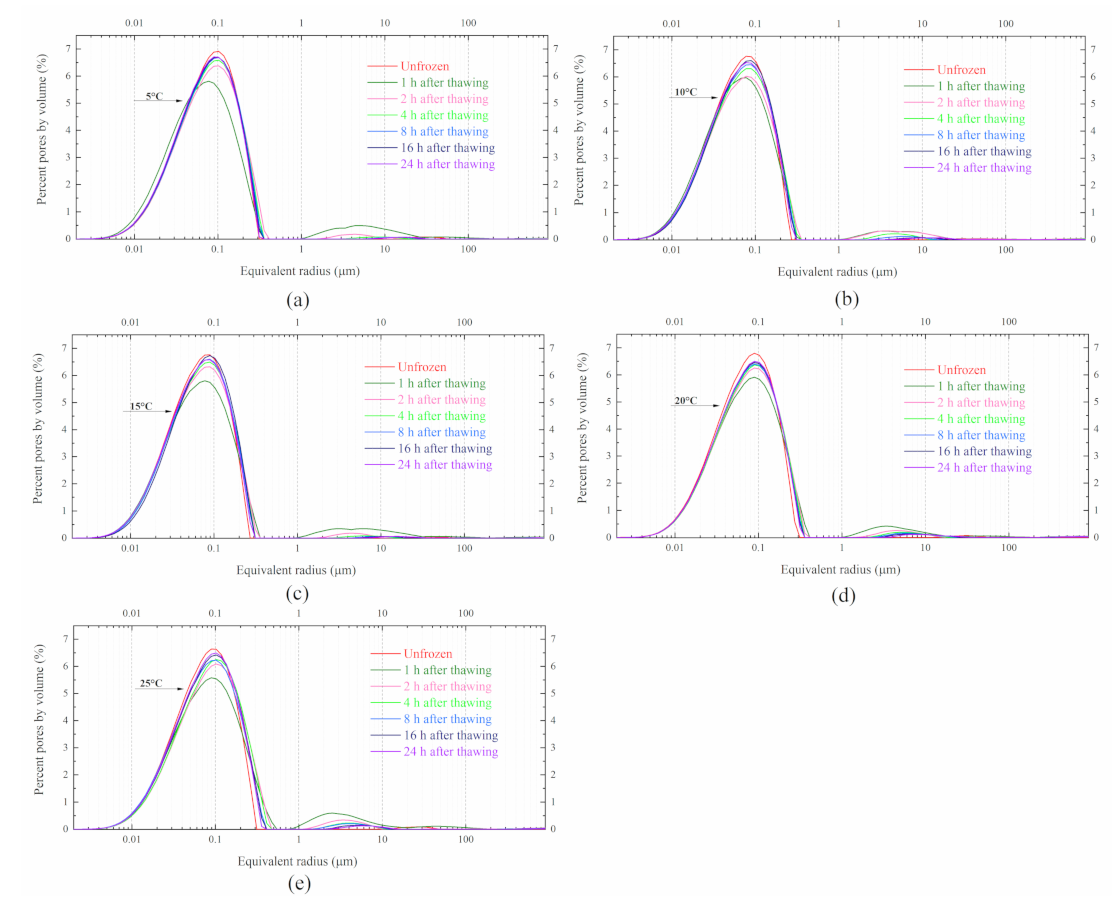
4.3. PSD under Different Thawing Temperature

The five pore PSDs at different thawing temperatures from 5 to 25 °C in Figure 13 have curves with similar characteristics. During the initial thawing process, the main-peak sharply decreased because the free water-derive ice could not be detected. With time, the signal receives from the melt ice grow, but did not recover its initial strength. Nearly half of the thawing process, which include both ice melt and thaw collapse, was completed in the first two hours for all thawing temperatures. The ice melt depresses the first peak value by connecting small pores to larger pores, while the thaw collapse led to growth because the weight compacts the instable newly form pores as seen in Figure 13b. For the 10 °C thawing temperature, the distinction between the thawing pores at 1 h and 2 h was not noticeable because the thaw collapse and ice melt behavior level off. Comparing 5 °C with 25 °C, the difference in pore distribution is concentrated in the pore fraction from 0.2 to 20 µm. The melt last more than two hours with no apparent regularity. The distinction among pore sizes under various gap durations is magnified after the second freeze–thaw cycle.

5. Discussion

5.1. PSD Changes under Different Freezing Durations at −20 °C

The acting forces makes the bound and capillary water freezing at lower temperature. For the large pores there are a lack of such forces and it freezes at higher temperature. In Figure 14a, the amount of water in pores with radii from 0 to 0.08 µm increased after freezing, which means in this radius range the water in the pores was frozen under −20 °C and therefore, only part of the small pores was frozen. Meanwhile, the water in pores with radii from 0.08 to 0.2 µm decreased sharply because the water in the pores was frozen into ice and was not detected. In addition, the water in pores with radii from 0.08 to 0.2 µm was disjointedly frozen so the liquid water was detected as smaller pores.
Figure 14b shows the percent change in pore distribution between unfrozen soft clay and frozen-thawed soft clay. After thawing, the pores size from 0.08 to 0.2 µm enlarged, from 0.2 to 1 µm. Considering the expansion of water when it freezes, the pink part of the trough expanded to the green part of the peak. In Figure 14b, with the increase in freezing duration, the peak value of temperature cycled small pores decreased, and the subpeak representing medium pores from 1 to 9 µm became more obvious.
It can be concluded that the pores forming 10 to 100 µm in the frozen–thawed soft clay originated from reorganization of unfrozen medium pores. Furthermore, the 1 h frozen soft clay sample differed substantially from the other samples, which means the freezing process was concentrated in the first two hours. During the first freezing hour, the small pores connected to each other to form medium pores from 1 to 9 µm. Meanwhile, the microstructure of soft clay was destroyed so that there were larger scale pores formed from 0.02 to 0.5 µm. The curves of A5–A7 almost overlapped because the freezing process was mostly completed during the first six hours. After the first six hours, the freezing duration was not the main reason for structural damage of the 38 mm × 38 mm soft clay samples. In summary, because of freezing action, the small pores connected and enlarged with almost no recovery after thawing. Due to the acting forces, bulk water at the highest freezing point frozen first, then most capillary water and some bound water frozen, and finally some strong bound water frozen [51]. Therefore, the water in small pores was more difficult to freeze than that in medium pores. The medium pores, especially from 0.03 to 0.2 µm, played a key role in the structural failure of soft clay.

5.2. The Relationship of Freezing Duration and Pore Distribution Peak Value

There is a relationship between the NMR peak value and freezing duration. The curves of Figure 12 link the first peak value intimately with freezing duration. During the first four hours of freezing in Figure 15a, the free water detected as small pores increased sharply, then the growth rate of the peak value declined. The relationship of peak value VF and freezing duration time t is established in:
V F = 7.45509 t 0.25617 + t ,
Similar to the freezing process, the peak value changed most rapidly in the first four hours of freezing after thawing. Small pores decreased significantly after freezing–thawing action. The curve of first peak value VF-T and freezing duration t is fitted as:
V F - T = 5.3225 + 1.8422 t ,
Equations (3) and (4) both reflect that the freezing speed goes down with the freezing duration increase. For the samples in this paper, 80% of the freezing process was concentrated in the first four hours. Considering the energy required to freeze water, the set temperature could hardly freeze the rest of the water after four hours of freezing duration. There was a turning point in the actual construction. That is, when the freezing time exceeded a certain value, the soil strength basically did not increase, while the freezing damage continued to increase. Therefore, it was important to find a turning point for freezing duration in AGF construction to shorten the working period.

5.3. PSD Changes under Different Freezing Gap Times at −20 °C

Figure 15 shows the percent change in pore size at different gap times between two freezing actions. After the first freeze–thaw cycle in Figure 16a, the features and regularity were obvious for the curves with different thawing times. With time, the ice from free water began to melt and the pores in the range from 0.01 to 0.03 µm and 1 to 9 µm increased. Unfreezing water from capillary water fused with the melt freezing water to be detected as larger pores so the number of pores from 0.03 to 0.2 µm decreased while the number of pores from 0.2 to 0.7 µm increased. The upturn process of the subpeak was broken when the gap time exceeded four hours, indicating that the second freezing more severely influenced the almost thawed soft clay.
From the above result, the pore with the size larger than 0.03 µm plays a key role in the structural failure of soft clay, so the pore size changes between 0.03 and 0.2 µm can reflected the influence of gap time.
Figure 16 shows that, after a double extend thaw collapse time, the secondary freezing action brought a very different change compared with the single freeze-thaw cycle. As the interval time increased, the proportion of small pores decreased slightly, and the proportion of mesopores increased rapidly.
When the gap time was short, the ice in the soft clay entered the frozen state again without completely melting. When the gap time was long enough, the ice in the soft clay was completely melted, and the melted soft clay would undergo an entire secondary freezing.
In summary, the degree of damage to the soft clay caused by the secondary freezing under different gap times was various. There is a certain time for thawing progress, when the gap time exceeds this value, the gap time increase has little influence on the thawed soft clay. In the actual construction, the interruption should be stopped before the main thawing effect occurs.

5.4. PSD Changes at Different Thawing Temperatures

Figure 17a–e shows the percent change at different thawing temperatures. The temperature significantly impacted thawing speed. For the 5 °C thawing temperature, one hour could not fully thaw water in small pores, while the ice in medium pores melted completely. The first peak reached the maximum value in the second hour while the subpeak reached the maximum value in the first hour. This phenomenon also reconfirms that the water in medium pores both freezes and thaws more easily than water in small pores because of the capillary force. For small pores after thawing, the pore size sharply increased from 0.2 to 0.4 µm. Meanwhile, the original medium pores from 10 to 100 µm almost disappeared and the new medium pores from 1 to 10 µm emerged. The higher the thawing temperature, the shorter the distance between the two peaks.
At each thawing temperature, the PSD changes within 24 h of melting were significantly different from the changes in the previous 16 h. The PSD of melting soft clay in the temperature range of 5–15 °C and 20–25 °C was quite different: in the small pores range of melting soft clay at a temperature within 15 °C, the proportion of pores from 0.01 to 0.03 μm tended to increase, and the proportion of pores from 0.03 to 0.2 μm tended to decrease. Additionally, this pattern was most obvious at 5 °C thawing temperature; when the thawing temperature was above 15 °C, the proportion of small pores in the range of 0.01–0.02 μm decreased, and the higher the thawing temperature, the greater the decrease. For the mesopores, as the melting time increased, the secondary peak shifted to the left and showed a trend of decreasing size.
In general, when the thawing temperature was lower than 15 °C, since ice melted into water at a slower speed, the frost heave of larger pores were easy to reach equilibrium, resulting in an easy compression structure. When the thawing temperature exceeded 15 °C, a high thawing rate made the structure of soft soil collapse. The higher the temperature, the greater the volume reduction. Therefore, 15 °C was a suitable thawing temperature to get stable thawed soft clay microstructure.

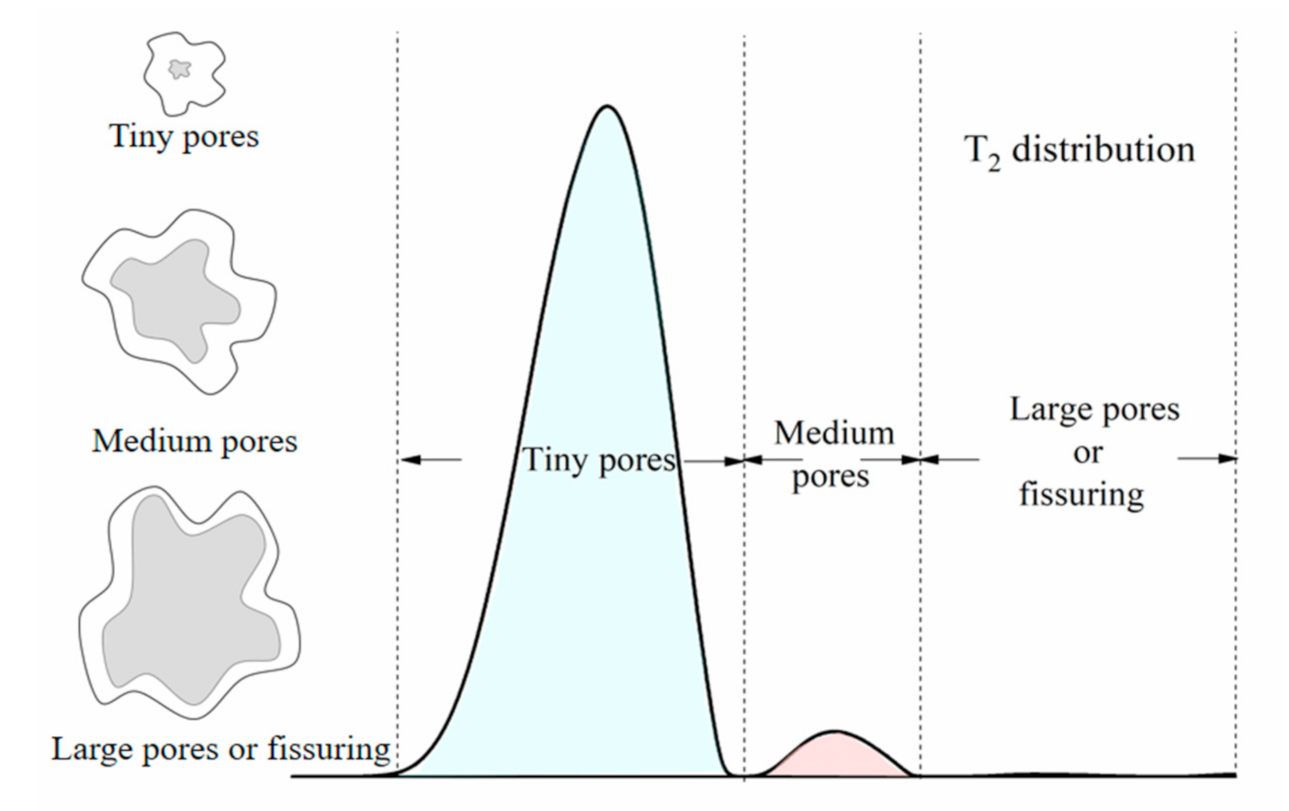
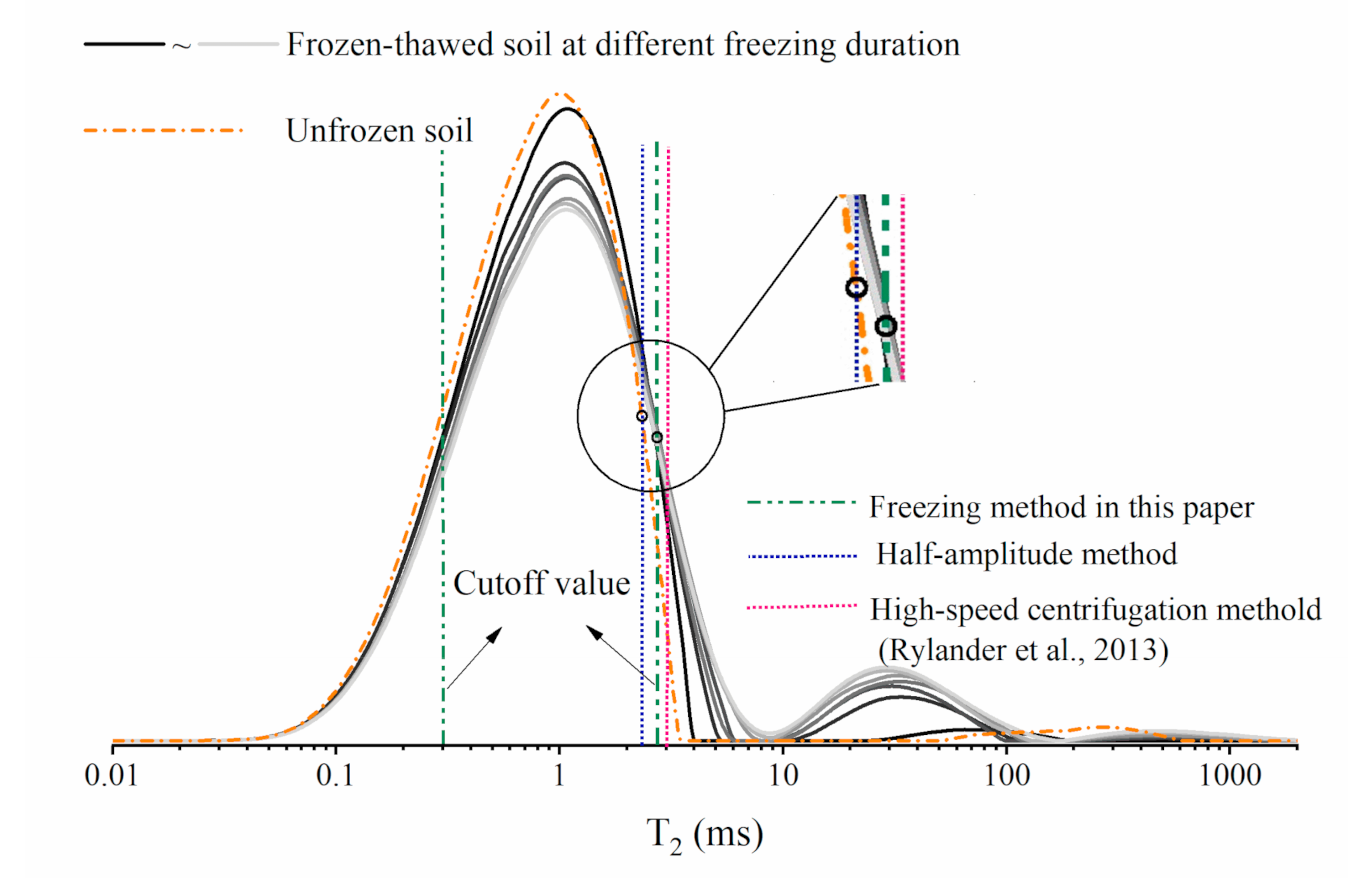
6. A New Method to Determine the T2 Cut-Off Value

Larger pore sizes occupy unrelaxed spin states and more time to reach the pore wall is required. Low-field NMR could add confidence to estimates of bound fluid, free fluid, and permeability [38]. Based on an expectation that producible fluids most reside in the larger pore spaces, and bound fluids are mostly held in the smaller pores, a T2 cutoff may be applied to the T2 distribution that divides the total NMR porosity into bound and free-fluid porosity [22]. The T2 cutoff separates free fluid from bound fluid, so the water saturation can be predicted. Borre et al. and Kuptsov et al. also showed that the influence of pore size distribution and the difference in the response depending depend on the fluid type [52,53]. More than separating free fluid from bound fluid, NMR can also discriminate porosity as clay-bound water, capillary-bound water, and movable fluid.
The proportion of different water types in soft clay becomes a critical component to evaluate soft clay strength. There are two methods to determine the T2 cutoff value. The first one compares the T2 relaxation time spectrum before and after high-speed centrifugation. The other method is experience-based judgment called the “half-amplitude method”. According to the summary of cutoff values of various soft clays, for predominantly single peak T2 relaxation time spectra less than 10 ms, the amplitude midpoint on the right limb of the relaxation time curve was set as the cutoff value. The normal two methods can determine the cutoff value between absorbed water and free water. This study provides a new method to determine the cutoff values between clay-bound water, capillary-bound water, and free water. It is well known that water freezes strongly with the binding force between hydrogen, the absorbed water could not be frozen by –20 °C. However, the smaller the pore size is, the more proportion absorbed water occupied. The pore water in different pore size has different freezing speed. So, the cutoff values of water types could be found by comparing the relaxation time spectra during different freezing durations.
From Figure 18, the evaluated cutoff value of bound water and free water from the three freezing methods cluster around 2–3 ms. The cutoff value between bound water and free water from half-amplitude, high-speed centrifugation, and freezing methods are 2.25 ms, 2.8 ms, and 3.0 ms, respectively [43]. The clay-bound water and capillary-bound water had an approximate demarcation point between 0.2 and 0.3 ms, which was the most accurate available range currently. The freezing method result was similar to the cutoff values from the other two methods.
Comparing the three test methods: the half-amplitude method is an empirical method, which is simple to determine the T2 cut-off value of the movable fluid. Meanwhile, the accuracy of the evaluation cutoff from empirical methods is difficult to guarantee. The high-speed centrifugation method has strict laboratory apparatus requirements and experimental operation to obtain a precise result. However, the operation of the high-speed centrifugal method is cumbersome; the freezing method proposed by this paper can simultaneously measure the cut-off value among the strong bound water, weak bound water, and the movable fluid. Moreover, the operation of the freezing method is relatively simple, and the test results have a high accuracy.
Therefore, the freezing method to test the T2 cut-off value is a suitable method to distinguish the three water components, which makes up for the blank test of the cut-off value of strong and weak bound water. The freezing method provides a pioneering new idea for determining the T2 cut-off value of NMR. Since the proportion of different water types determines the mechanical properties of saturated soft clay. Thus, the new way to determine the T2 cutoff value is meaningful to predict long-term subway settlement.

7. Conclusions

The sizes of saturated soil pores are strongly associated with the percentage of water types. Energy exchange of the water phase transition is mainly controlled by the pore size. Accounting for the specific surface area, the water in smaller pores contains more absorbed water than larger pores. Damage from freezing action is affected by many factors, including freezing temperature, thawing temperature, and gap time. Exploring the changing trend and mechanism of PSD under different freezing condition can help make a wise decision during AGF construction. Using NMR technology, the microstructural change in soil could be observed and a new method to determine the T2 cut-off value was proposed. There are several conclusions from this well-controlled experiment as follows:
  • Under the freezing effect, the size of small pores in the soft clay was increased by frost heave. After thawing, the structure of soft clay was destroyed, and the structure went looser.
  • For the soft clay samples volume in this test, the freezing stage was mostly completed during the first four hours. During the second hour, the freezing rate reached the maximum, and slowed after four hours. So, there was also a turning point freezing duration in practical engineering.
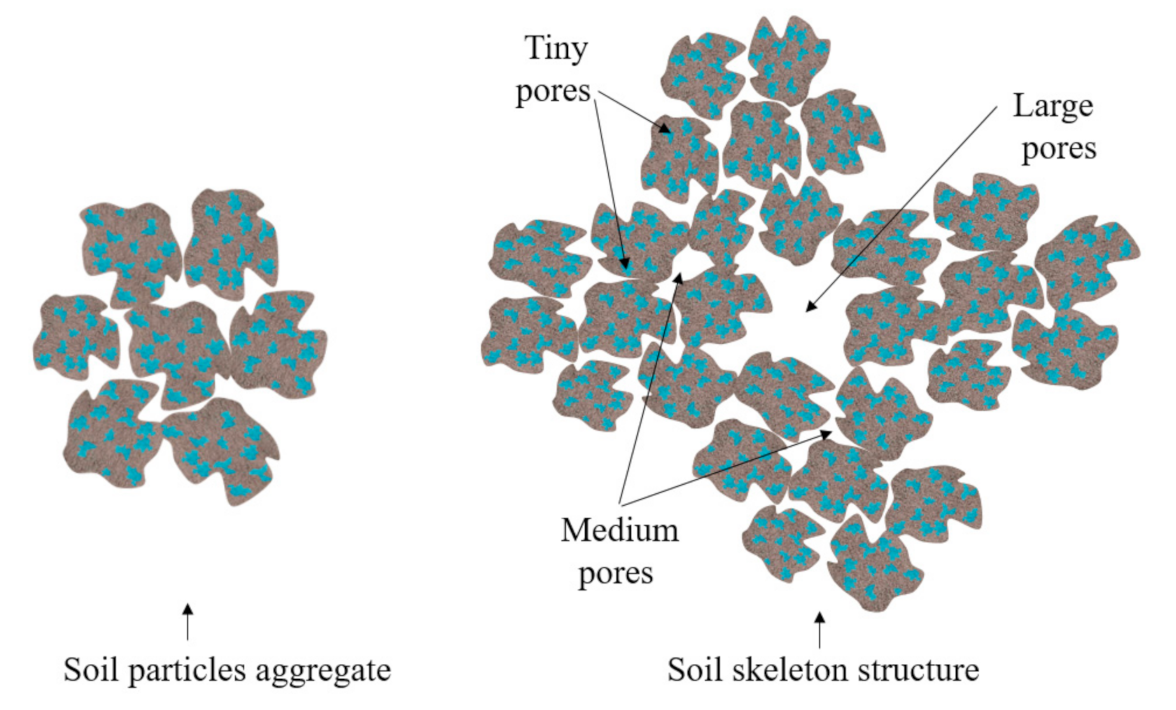
  • After the freezing progresses, some water in small pores and almost all water in medium pores was frozen; the frozen water in small pores interconnected and new medium pores were formed. The medium pores, especially from 0.03 to 0.2 µm, played a key role in the structural failure of soft clay.
  • The second freezing action could disrupt the recover progress of the enlarged pores. The shorter the gap time is, the less damage cause by refreezing. Accidental breaks should be controlled in a specified range to avoid more microstructure damage.
  • Considering the comprehensive effect of soft clay structure looseness and melting settlement, a thawing temperature above 15 °C was much better for the stable of soft clay structure. Therefore, arranging the cross-passage construction in spring and autumn was a good choice.

Author Contributions

Conceptualization, B.K. and Z.D.; methodology, S.H. formal analysis, S.H.; investigation, T.X.; resources, T.X.; data curation, B.K.; writing—original draft preparation, B.K.; writing—review and editing, S.H.; visualization, Z.D.; supervision, Z.D.; project administration, Z.D.; funding acquisition, Z.D. All authors have read and agreed to the published version of the manuscript.

Funding

This work is supported by the Chinese National Natural Science Foundation (51508506); Joint Fund of Zhejiang Provincial Natural Science Foundation (LHZ20E080001); Hangzhou Science Technology Plan Project (20172016A06, 20180533B06, 20180533B12, 20191203B44), and The Science and Technology Development Fund, Macau SAR (File no. SKL-IOTSC-2018-2020).

Institutional Review Board Statement

Not applicable.

Informed Consent Statement

Not applicable.

Data Availability Statement

Not public.

Conflicts of Interest

The authors declare no conflict of interest.

References

  1. Liu, J.M.B.; Cheng, Y. Design of the gongbei tunnel using a very large cross-section pipe-roof and soil freezing method. Tunn. Undergr. Sp. Technol. 2018, 72, 28–40. [Google Scholar] [CrossRef]
  2. Leung, C.K.W.; Leung, R.K.Y.; Cheung, A.K.K.; Chan, W.L.; Application of artificial ground freezing method for tunnel. HKIE Civ. Div. Int. Conf. 2012, 1–12. Available online: https://www.dsd.gov.hk/EN/Files/Technical_Manual/technical_papers/HATS1204.pdf (accessed on 18 January 2021).
  3. Chang, D.K.; Lacy, H.S. Artificial ground freezing in geotechnical engineering. In Proceedings of the International Conference on Case Histories in Geotechnical Engineering, Arlington, VA, USA, 14 August 2008; pp. 1–11. [Google Scholar]
  4. Cui, Z.D.; Tang, Y.Q.; Yan, X.X. Centrifuge modeling of land subsidence caused by the high-rise building group in the soft soil area. Environ. Earth Sci. 2009, 59, 1819–1826. [Google Scholar] [CrossRef]
  5. Casini, F.; Olivella, S.; Gens, A.; Viggiani, G.M.B. Artificial ground freezing of a volcanic ash: Laboratory tests and modelling. Environ. Geotech. 2016, 3, 141–154. [Google Scholar] [CrossRef] [Green Version]
  6. Anovitz, L.M.; Cole, D.R. Characterization and analysis of porosity and pore structures. Rev. Mineral. Geochem. 2015, 80, 61–164. [Google Scholar] [CrossRef] [Green Version]
  7. Wigger, C.; Gimmi, T.; Muller, A.; Loon, L.R. Van. The influence of small pores on the anion transport properties of natural argillaceous rocks—A pore size distribution investigation of Opalinus Clay and Helvetic Marl. Appl. Clay Sci. 2018, 156, 134–143. [Google Scholar] [CrossRef]
  8. Clarkson, C.R.; Freeman, M.; He, L.; Agamalian, M.; Melnichenko, Y.B.; Mastalerz, M.; Bustin, R.M.; Radliński, A.P.; Blach, T.P. Characterization of tight gas reservoir pore structure using USANS/SANS and gas adsorption analysis. Fuel 2012, 95, 371–385. [Google Scholar] [CrossRef]
  9. Diamond, S. Pore size distributions in clays. Clays Clay Miner. 2006, 18, 7–23. [Google Scholar] [CrossRef]
  10. Penumadu, D.; Dean, J. Compressibility effect in evaluating the pore-size distribution of kaolin clay using mercury intrusion porosimetry. Can. Geotech. J. 2000, 37, 393–405. [Google Scholar] [CrossRef]
  11. Spaans, E.J.A.; Baker, J.M. The soil freezing characteristic: Its measurement and similarity to the soil moisture charac-teristic. Soil Sci. Soc. Am. J. 1980, 60, 13–19. [Google Scholar] [CrossRef]
  12. Wang, F.; Li, S. Determination of the surface fractal dimension for porous media by capillary condensation. Ind. Eng. Chem. Res. 1997, 36, 1598–1602. [Google Scholar] [CrossRef]
  13. Moore, C.A.; Donaldson, C.F. Quantifying soil microstructure using fractals. Ghechnique 1995, 45, 105–116. [Google Scholar] [CrossRef]
  14. Yang, R.; He, S.; Yi, J.; Hu, Q. Nano-scale pore structure and fractal dimension of organic-rich Wufeng-Longmaxi shale from Jiaoshiba area, Sichuan Basin: Investigations using FE-SEM, gas adsorption and helium pycnometry. Mar. Pet. Geol. 2016, 70, 27–45. [Google Scholar] [CrossRef]
  15. Sun, W.; Zuo, Y.; Wu, Z.; Liu, H.; Xi, S.; Shui, Y. Fractal analysis of pores and the pore structure of the Lower Cambrian Niutitang shale in northern Guizhou province: Investigations using NMR, SEM and image analyses. Mar. Pet. Geol. 2019, 99, 416–428. [Google Scholar] [CrossRef]
  16. Shi, B.; Wu, Z.; Inyang, H.; Chen, J. Preparation of soil specimens for SEM analysis using freeze-cut-drying. Bull. Eng. Geol. Environ. 1999, 1, 1–7. [Google Scholar] [CrossRef]
  17. Hu, R.; Li, Z.; Du, T.; Hu, F.; Oyediran, I.A.; Huang, R.; Li, X. Study on pore structure characteristics of marine and continental shale in China. J. Nat. Gas Sci. Eng. 2016, 33, 143–152. [Google Scholar]
  18. Wang, S.; Yang (Joey), Z.; Yang, P. Structural change and volumetric shrinkage of clay due to freeze-thaw by 3D X-ray computed tomography. Cold Reg. Sci. Technol. 2017, 138, 108–116. [Google Scholar] [CrossRef]
  19. Zhou, J.; Tang, Y. Centrifuge experimental study of thaw settlement characteristics of mucky clay after artificial ground freezing. Eng. Geol. 2015, 190, 98–108. [Google Scholar] [CrossRef]
  20. Cui, Z.D.; Tang, Y. Microstructures of different soil layers caused by the high-rise building group in Shanghai. Environ. Earth Sci. 2011, 63, 109–119. [Google Scholar] [CrossRef]
  21. Chen, Y.Z.; Zhou, W.H.; Liu, F.; Yi, S.; Geng, X. Microstructure and morphological characterization of lead-contaminated clay with nanoscale zero-valent iron (nZVI) treatment. Eng. Geol. 2019, 256, 84–92. [Google Scholar] [CrossRef]
  22. Morriss, C.; Rossini, D.; Straley, C.; Christian, P.; Vinegar, H. Core analysis by low field NMR. The Log Analyst. 1997, 38, 43–56. [Google Scholar]
  23. Jaeger, F.; Shchegolikhina, A.; Van As, H.; Schaumann, G.E. Proton NMR relaxometry as a useful too l to evaluate swelling processes in peat soils. Open Magn. Reson. J. 2010, 3, 27–45. [Google Scholar] [CrossRef]
  24. Yao, Y.; Liu, D. Comparison of low-field NMR and mercury intrusion porosimetry in characterizing pore size distribu-tions of coals. Fuel 2012, 95, 152–158. [Google Scholar] [CrossRef]
  25. Gopinathan, N.; Yang, B.; Lowe, J.P.; Edler, K.J.; Rigby, S.P. NMR cryoporometry characterisation studies of the relation between drug release profile and pore structural evolution of polymeric nanoparticles. Int. J. Pharm. 2014, 469, 146–158. [Google Scholar] [CrossRef] [PubMed] [Green Version]
  26. Schuleit, M.; Furó, I.; Daicic, J.; Petrov, O.; Domanig, R.; Plunkett, M. Pore size distributions of biodegradable polymer microparticles in aqueous environments measured by NMR cryoporometry. Int. J. Pharm. 2005, 309, 157–162. [Google Scholar]
  27. Masiello, C.A.; Valenza, J.J.; Ogbonnaya, U.; Teel, W.S.; Semple, K.T.; Corbett, P.; Song, Y.-Q.; Hu, Q.; Webber, J.B.W.; Fisher, Q.J. An NMR study of porous rock and biochar containing organic material. Microporous Mesoporous Mater. 2013, 178, 94–98. [Google Scholar]
  28. Ishizaki, T.; Maruyama, M.; Furukawa, Y.; Dash, J.G. Premelting of ice in porous silica glass. J. Cryst. Growth 1996, 163, 455–460. [Google Scholar] [CrossRef]
  29. Jeon, J.D.; Kim, S.J.; Kwak, S.Y. 1H nuclear magnetic resonance (NMR) cryoporometry as a tool to determine the pore size distribution of ultrafiltration membranes. J. Memb. Sci. 2008, 309, 233–238. [Google Scholar] [CrossRef]
  30. Li, X.; Kang, Y.; Haghighi, M. Investigation of pore size distributions of coals with di ff erent structures by nuclear magnetic resonance (NMR) and mercury intrusion porosimetry (MIP). Meas. 2018, 116, 122–128. [Google Scholar] [CrossRef]
  31. Tian, H.; Wei, C.; Tan, L. Effect of freezing-thawing cycles on the microstructure of soils: A two- dimensional NMR relaxation analysis. Cold Reg. Sci. Technol. 2019, 158, 106–116. [Google Scholar] [CrossRef]
  32. Lai, Y.; Wu, D.; Zhang, M. Crystallization deformation of a saline soil during freezing and thawing processes. Appl. Therm. Eng. 2017, 120, 463–473. [Google Scholar] [CrossRef]
  33. Watanabe, K.; Mizoguchi, M. Amount of unfrozen water in frozen porous media saturated with solution. Cold Reg. Sci. Technol. 2002, 34, 103–110. [Google Scholar] [CrossRef]
  34. Jackson, C.L.; McKenna, G.B. The melting behavior of organic materials confined in porous solids. J. Chem. Phys. 1990, 93, 9002–9011. [Google Scholar] [CrossRef]
  35. Petrov, O.V.; Furó, I. A joint use of melting and freezing data in NMR cryoporometry. Microporous Mesoporous Mater. 2010, 136, 83–91. [Google Scholar] [CrossRef]
  36. Liu, X.; Chen, H.; Kou, W.; Zhang, D. Robust anti-icing coatings via enhanced super hydrophobicity on fiberglass cloth. Cold Reg. Sci. Technol. 2017, 138, 18–23. [Google Scholar] [CrossRef]
  37. Nitao, J.J.; Bear, J. Potentials and their role in transport in porous media. Water Resour. Res. 1996, 32, 225–250. [Google Scholar] [CrossRef]
  38. Lowden, B.D.; Porter, M.J.; Powrie, L.S. T2 relaxation time versus mercury injection capillary pressure: Implications for NMR logging and reservoir characterization. Proc. Eur. Pet. Conf. 1998, 1, 323–327. [Google Scholar] [CrossRef]
  39. Liu, J.; Chang, D.; Yu, Q. Influence of freeze-thaw cycles on mechanical properties of a silty sand. Eng. Geol. 2016, 210, 23–32. [Google Scholar] [CrossRef]
  40. Mu, J.Q.; Pei, X.J.; Huang, R.Q.; Rengers, N.; Zou, X.Q. Degradation characteristics of shear strength of joints in three rock types due to cyclic freezing and thawing. Cold Reg. Sci. Technol. 2017, 138, 91–97. [Google Scholar] [CrossRef]
  41. Weihermu, L.; van Dusschoten, D. Characterization of unsaturated porous media by high-field and low-field NMR relaxometry. Ghechnique 2009, 45, 1–11. [Google Scholar]
  42. Rezaee, R.; Saeedi, A.; Clennell, B. Tight gas sands permeability estimation from mercury injection capillary pressure and nuclear magnetic resonance data. J. Pet. Sci. Eng. 2012, 88–89, 92–99. [Google Scholar] [CrossRef] [Green Version]
  43. Rylander, E.; Singer, P.M.; Jiang, T.; Lewis, R.; McLin, R.; Sinclair, S. NMR T2 distributions in the Eagle Ford shale: Reflections on pore size. Soc. Pet. Eng. SPE USA Unconv. Resour. Conf. 2013, 426–440. [Google Scholar]
  44. Zheng, S.; Yao, Y.; Liu, D.; Cai, Y. Nuclear magnetic resonance surface relaxivity of coals. Int. J. Coal Geol. 2019, 205, 1–13. [Google Scholar] [CrossRef]
  45. Tang, Y.Q.; Zhao, S.K.; Yang, P.; Wang, J.X.; Zhang, X.Y. Quantitative analysis of the microscopic behavior of saturated soft clays under cyclic loading. Chin. Civ. Eng. J. 2009, 42, 98–103. (In Chinese) [Google Scholar]
  46. Cetin, H.; Fener, M.; Söylemez, M.; Günaydin, O. Soil structure changes during compaction of a cohesive soil. Eng. Geol. 2007, 92, 38–48. [Google Scholar] [CrossRef]
  47. Papakonstantinou, S.; Anagnostou, G.; Pimentel, E. Evaluation of ground freezing data from the Naples subway. Proc. Inst. Civ. Eng. Geotech. Eng. 2013, 166, 280–298. [Google Scholar] [CrossRef]
  48. Cicchetti, L. Thermo-Hydro-Mechanical Simulations of Artificial Ground Freezing. Master’s Thesis, Norwegian University of Science and Technology, Trondheim, Norway, June 2018. Available online: http://hdl.handle.net/11250/2507933 (accessed on 18 January 2021).
  49. Tian, H.; Wei, C.; Wei, H.; Zhou, J. Freezing and thawing characteristics of frozen soils: Bound water content and hysteresis phenomenon. Cold Reg. Sci. Technol. 2014, 103, 74–81. [Google Scholar] [CrossRef]
  50. Kruse, A.M.; Darrow, M.M. Adsorbed cation effects on unfrozen water in fine-grained frozen soil measured using pulsed nuclear magnetic resonance. Cold Reg. Sci. Technol. 2017, 142, 42–54. [Google Scholar] [CrossRef]
  51. Chai, M.; Zhang, J.; Zhang, H.; Mu, Y.; Sun, G.; Yin, Z. A method for calculating unfrozen water content of silty clay with consideration of freezing point. Appl. Clay Sci. 2018, 161, 474–481. [Google Scholar] [CrossRef]
  52. Borre, M.K.; Coffey, B.P. Multi-stage cleaning for routine core analysis in heavy oil-bearing carbonates, Campos Basin, Brazil. Soc. Pet. Eng. SPE Heavy Oil Conf. Can. 2014, 3, 1801–1809. [Google Scholar]
  53. Kuptsov, K.; Griffiths, R.; Maggs, D. Technology update: Magnetic resonance-while-drilling system improves under-standing of complex reservoirs. J. Pet. Technol. 2015, 67, 26–29. [Google Scholar] [CrossRef]
Figure 1. Uneven cumulative subsidence after artificial ground freezing (AGF) subway construction. The areas in blue show the regions where AGF construction areas overlap.
Applsci 11 01810 g001
Figure 2. Resonance frequency of thawed soft clay. The resonance frequency increases with increasing confining pressure for three different temperature soft clays.
Applsci 11 01810 g002
Figure 3. Uniformity of soft clay sample before freezing: (a) shows the data for the freezing duration tests and (b) shows the data for the gap time tests.
Applsci 11 01810 g003
Figure 4. Pore distribution schematic diagram. Blue areas represent the water-filled pores.
Applsci 11 01810 g004
Figure 5. Pores size schematic diagram. The diagram shows a schematic pore throat indicating the pore throat radius.
Applsci 11 01810 g005
Figure 6. Soft clay structure diagram. In the diagram, blue spaces represent the water-filled pore space in the particle and aggregate material.
Applsci 11 01810 g006
Figure 7. Pore size distribution (PSD) spectrum corresponding to pore size. The small pores represent the main peak area, the subpeak is the medium pores, and the large pores are in the tail of the curve.
Applsci 11 01810 g007
Figure 8. PSD test by mercury intrusion porosimetry [45].
Applsci 11 01810 g008
Figure 9. Freeze–thaw action influence on sample surface. Fissures are highlighted in blue and yellow for frozen and thawed soft clay, respectively.
Applsci 11 01810 g009
Figure 10. Schematic diagram of the experimental process.
Applsci 11 01810 g010
Figure 11. PSD after different freezing duration: (a,b) show the corresponding post-test results for the freezing duration initially and after a 24 h rest period.
Applsci 11 01810 g011
Figure 12. (a,b) PSD at different freezing gap times.
Applsci 11 01810 g012
Figure 13. PSD at different thawing temperature: (ae) show the PSDs at 5, 10, 15, 20, and 25 °C, respectively.
Applsci 11 01810 g013
Figure 14. PSD changes after different freezing durations: (a,b) show the post-test results changes to pore distribution initially and after a 24 h rest period.
Applsci 11 01810 g014
Figure 15. (a,b) Fitting curve of the peak value of freezing and thawing duration.
Applsci 11 01810 g015
Figure 16. (a,b) PSD change at different freezing gap times.
Applsci 11 01810 g016
Figure 17. PSD change at different thawing temperatures: (ae) show the percent change at 5, 10, 15, 20, and 25 °C, respectively.
Applsci 11 01810 g017
Figure 18. Cutoff values tested by three methods.
Applsci 11 01810 g018
Table 1. Freezing plan.
Sample No.Sample Size
/mm
Freezing Duration
/h
Gap Time
/h
Thawing Temperature
/°C
A138 × 381-25
A238 × 382-25
A338 × 383-25
A438 × 384-25
A538 × 386-25
A638 × 3812-25
A738 × 3818-25
B138 × 3824125
B238 × 3824225
B338 × 3824325
B438 × 3824425
B538 × 3824625
B638 × 38241225
B738 × 38241825
B838 × 38242425
C138 × 3824-5
C238 × 3824-10
C338 × 3824-15
C438 × 3824-20
C538 × 3824-25
Publisher’s Note: MDPI stays neutral with regard to jurisdictional claims in published maps and institutional affiliations.

