Featured Application
As a kind of high-energy green energy source with great potential, aluminum particles are still not well understood in their combustion mechanism. The research results of this paper propose a new type of combustion model, which can more accurately simulate the combustion characteristics of aluminum particles, and provide theoretical guidance for the large-scale application of aluminum particles.
Abstract
In this study, a quasi-steady combustion model of an aluminum particle is established, which is more accurate to simulate the physical combustion process. Detailed gas-phase reaction mechanism and surface reaction mechanism are considered. Moreover, the particle temperature is not constant in this work, which is calculated in different combustion stages. The judgement standard of each combustion stage is from observational data in the experiment and the simulation results of combustion durations of each stage, and distribution of ambient temperature and gas-phase species profiles are in good agreement with experimental results. The calculation results show that in the first stage, burning rate of the particle is the fastest, and in the second stage, particle temperature can drop to more than 100 K below the boiling point for the large particles, which is slightly below the boiling point for small ones. As the combustion stage changes, number is going to keep going down, which will lead to the transition of combustion method from diffusion-limited control to kinetic-limited control for an aluminum particle.
1. Introduction
Aluminum is widely used as a metal additive in solid propellants due to its good energy characteristics [1]. Due to its advantages of wide source, low cost, combustion products containing only alumina and easy for recycling, aluminum has the potential to be a new type of renewable green energy [2,3,4,5,6]. Nano-sized aluminum particles are a new kind of high-energy material, which is very suitable for microscale energy-demanding systems [7]. In addition, aluminum is easy to store and transport over long distances, which is the basis for the large-scale use of aluminum particles as a new type of green energy. However, aluminum is a kind of metal fuel; its melting point and boiling point are much higher than fossil fuels, and during the combustion process, aluminum oxide will deposit on the surface to form an oxide cap [8], which hinders the evaporation process of high-temperature aluminum droplets. The combustion process of aluminum particles is complicated and requires further in-depth study of its combustion mechanism.
The experimental and theoretical studies on the combustion characteristics of the aluminum particles have been extensively carried out since the 1950s. Beckstead [9] summarized a large number of experimental studies and proposed an empirical correlation for burning time as:
Though this empirical correlation is widely used, Lynch, et al. [10] has reported it to be unsuitable for small particle sizes and has proposed another correlation for burning time for small particle sizes. Feng, et al. [11,12] accurately observed a single aluminum particle and obtained the burning time of a large number of micron aluminum particles in a complex high-temperature gas. Bucher, et al. [13] measured the distribution of ambient temperature and gas phase composition during the combustion process and suggested that the position of the peak of the AlO concentration represented the position of the flame. Dreizin [14] measured the changes in the aluminum particle temperature and divided the combustion process of the aluminum particles in air into three stages just as Figure 1 shows. Recently, Marsh, et al. [15] observed a similar phenomenon by the holography technique.
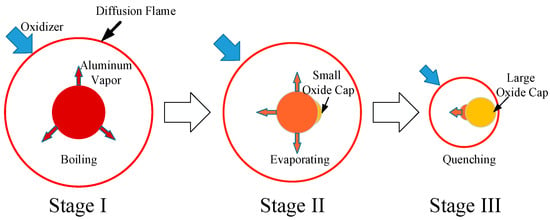
Figure 1.
The three stages during the combustion process of an aluminum particle.
Brzustowski and Glassman [16] proposed that the combustion of aluminum particles was similar to the hydrocarbon fuels. Liang and Beckstead [17,18] proposed a two-dimensional unsteady state/quasi-steady state aluminum combustion model, including the finite rate chemical reactions and oxide cap. Further, Widener, et al. [19] improved the model by changing the ambient atmosphere to the rocket environment and subsequently calculated the burning time based on the assumption that the mass consumption rate decreased linearly. Washburn, et al. [20,21] incorporated the detailed mechanism of the gas phase chemical reactions and studied the transition from diffusion-limited to kinetic-limited combustion control. Glorian, et al. [22] further supplemented the detailed mechanism of the surface reactions and regarded the evaporation process as a surface reaction. Bojko, et al. [23,24] suggested that the conversion rate of AlO and Al2O at the particle surface determined the combustion control method.
Most of the previous aluminum combustion models are quasi-steady, but it is incorrect to use a quasi-steady state result to represent the entire combustion process. In the actual combustion process, the temperature of the particles is constantly changing, accompanied by the growth of oxidation caps, and sometimes the particles will rotate and micro-explode. According to the experimental results of Dreizin [14], this work assumes that the particle temperature in Stage I is kept at the boiling point, which is related to the ambient pressure [19] as:
is united in in the above equation and the particle temperature in Stage II is calculated by the energy balance equation:
The heat absorbed by the evaporation of aluminum is regarded as part of the heat of the surface reaction, and the radiative heat absorption of the particle is not considered in the energy equation, because the calculation results in [8] suggested that the influence of radiant heat was small and could be ignored. The goal of this article is to establish a more accurate quasi-steady combustion model, considering the different stages of combustion, as well as detailed gas phase and surface chemical reaction mechanisms.
2. Model Formation
This article focuses on the combustion process of a burning aluminum particle and tries to use different quasi-steady states to model the different combustion stages. The particle is assumed to be spherically symmetric as Figure 2 shows and oxide cap is ignored. A lumped capacitance approach is used because the number () is estimated to be no larger than 0.01 for all cases considered. Most of the oxidizers in the environment will react with the vaporized aluminum vapor and form a high temperature diffusion flame zone, while part of them will cross the flame zone and react with the liquid aluminum at particle surface. Both gas phase reactions and surface reactions considered in this work are regarded as finite rate reactions and detailed reaction mechanisms are used.
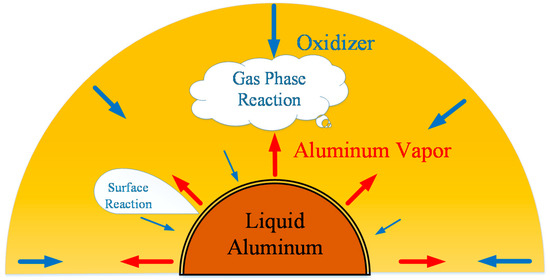
Figure 2.
Schematic diagram of gas phase reaction and surface reaction process between oxidizer with aluminum vapor and aluminum particle.
2.1. Gas-Phase Analysis
The diffusion and reaction of gas phase substances follow the governing equations of conservation of mass, species, momentum and energy, as shown in Equations (4)–(7), respectively:
the right side of Equation (5) successively represents the mass change caused by diffusion and chemical reaction.
the right side of Equation (6) successively represents the momentum change caused by pressure and viscous force.
the right side of Equation (7) successively represents the total energy change caused by the heat conduction, species diffusion and surface force work. Since the model is quasi-steady state, the change of each physical quantity in the equation with time is not considered.
The detailed gas-phase mechanism employed to model the aluminum combustion is taken from [22,25] and is shown in Table 1. As the aluminum particles burned in the air react weakly with nitrogen, reaction and species involving nitrogen are discarded and argon is used as a dilution gas. The gas-phase mechanism includes gas-phase species and reactions. Any reaction in the gas-phase mechanism can be represented as:
where is the chemical symbol for the species and the rate-of-progress variable for the gas-phase reaction is calculated by Equations (9)–(11):
where the preexponential factor , temperature exponent and activation energy are given in Table 1. Thus, source term in Equation (5) can be obtained by following equation:

Table 1.
Detailed gas-phase reactions [22,25].
Condensation reaction is vital for the gas-phase reactions due to the condensation heat and it has been regarded as a reversible reaction with high kinetic parameters, as the liquefaction process of the high-temperature gaseous alumina is extremely rapid. However, the combustion flame temperature of aluminum is close to 4000 K; thus, the reverse reaction of the condensation process should not be ignored. For gas-phase species, the transport properties are needed to model the diffusion flame. In this work, the coefficients of molecular diffusion, thermal conductivity and viscosity were estimated with the usage of known formulas [26]. The dipole moment , polarizability , Van-der-Waals collision diameters and well depth of Lennard-Jones potential, needed for these estimations were taken from [27,28] and are presented in Table 2. As the particle size of the generated alumina smoke is small (~1 μm), the transport properties of condensed phase Al2O3 are identical to its gas phase [29].

Table 2.
Parameters taken for the calculation of species transport properties [27,28].
2.2. Surface Formalism
The mathematical formalism to describe surface kinetics for events such as adsorption, desorption, surface reactions and deposition is developed in this section. There are three types of species in surface formalism: gas-phase, surface and bulk. The first is a species in the gas phase above the particle surface. A surface species denoted by (S), is defined to be the chemical species on the top-most layer of the particle which means the liquid-gas interface. For example, the evaporation and absorption process (Al + Al(L) = Al(B) + Al(L)) of aluminum are shown in Figure 3. The symbol Al represents the gas atom of Al; Al(L) represents the open site at the surface, which will be occupied by gas species to form surface species; Al(B) represents the liquid aluminum particle. During the combustion of the aluminum, the two processes are going on at the same time, and when equilibrium is reached, the evaporation rate will be much greater than the absorption rate.
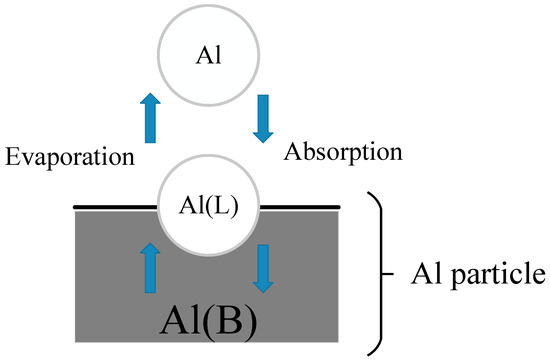
Figure 3.
The evaporation and absorption process of Al atom on the particle surface.
The detailed surface reaction mechanism employed to model the aluminum oxidation is taken from [22] and is shown in Table 3. The surface reactions can be represented in the general form:

Table 3.
Detailed surface reactions [22,31].
In any surface reaction, gas-phase species can participate in surface chemistry as well. The rate-of-progress variable for the surface reaction can also be written in the similar form as gas-phase reaction:
The only difference is that can represent either a volume () or a surface molar concentration (). Surface molar concentration is calculated as:
and is obtained from quantum chemistry [30,31]. For bulk species, is taken as 1. For absorption reactions, their forward rate is calculated by stick coefficient r in following equation:
2.3. Numerical Method
An axisymmetric two-dimensional grid was established to model the particle and the surroundings. The size of the computation domain is 50 times of the particle radius. The number of radial grids is and the grid is refined close the center, and the number of circumferential grids is, which are evenly distributed. Half of a typical grid with and of 100 is shown in Figure 4. In this study, the grids with being , ,, and were calculated to study the influence of the number of grids. The calculation model is a laminar component transport model with finite rate of chemical reaction, and a steady pressure-based solver is used for the numerical calculations. The coupled method is used for the pressure-velocity coupling, and the second-order upwind difference scheme is used for the continuity, component, momentum and energy equations. The simulation results of the ambient temperature in Y direction are shown in Figure 5. It can be seen that grid numbers have resulted in minor differences, thus, of was chosen to study the combustion of aluminum particles.
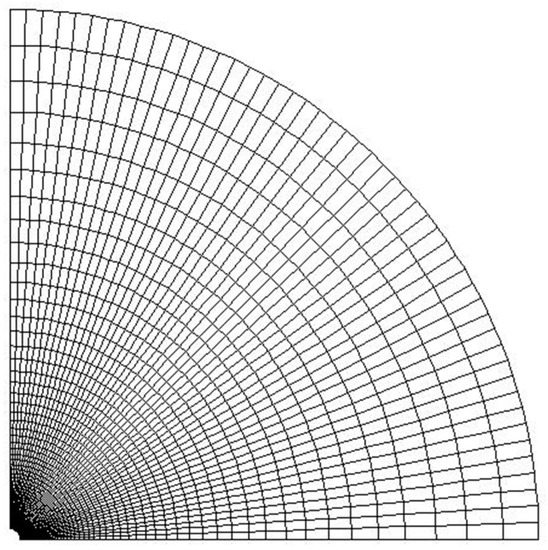
Figure 4.
Half of a typical grid with number of radial grids and number of circumferential grids of 100.
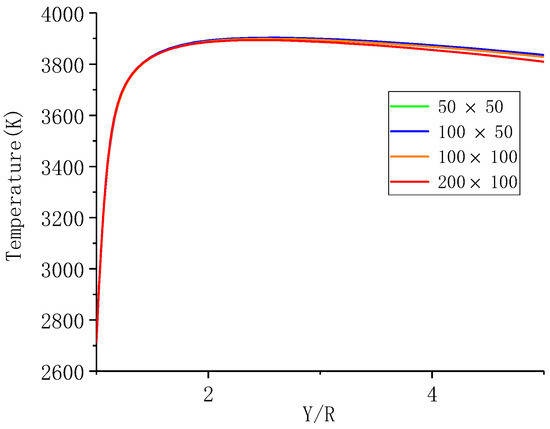
Figure 5.
The simulation results of the ambient temperature in Y direction under different grid numbers.
3. Results and Discussion
3.1. Validation
3.1.1. Temperature and Species Profile
Bucher, et al. [13] studied the combustion of a free falling aluminum particle (D = 210 μm) in air. The authors measured the temperature and composition distribution around the particle. The data was obtained at the stable radiation signal during the early stage of combustion. The combustion at this moment could be considered to be in the boiling combustion stage. As the data was acquired after the particles have been burned for a while, thus, in order to achieve an effective comparison with the experimental results, the combustion of an aluminum particle (D = 200 μm) in an O2/Ar = 21/79 environment was measured. The particle temperature was set at 2713 K (boiling point at 1 atm), with the ambient temperature of 300 K and flow velocity of 0.3 m/s. The flow field and temperature distribution around the particle are shown in Figure 6a, whereas the experimental and computed profiles are presented in Figure 6b as a function of the non-dimensional distance to the surface Y/R (R is the particle radius).
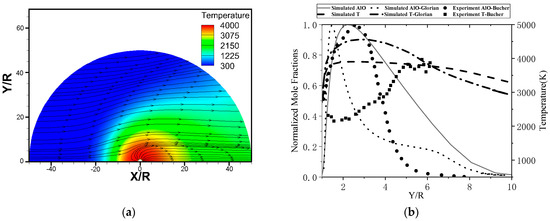
Figure 6.
The flow field and temperature distribution around the particle (a) and comparison of the simulated AlO normalized mole fraction and temperature (K) profiles with the experimental measurements reported by Bucher [13] and simulated results reported by Glorian [22] (b).
AlO radical is often interpreted as a marker for the flame position, and the simulated AlO distribution is noted to be in good agreement with the experimentally measured one. The simulated peak is at Y~2.2R, whereas the experiments suggest it to lie further from the surface (at Y~2.5R). The calculated maximum flame temperature (around 4000 K) is also in good agreement with the experimental result. In addition, it can be seen that the simulation results obtained in this study are more accurate than the previous literature reports. Figure 7 shows the fraction of sites occupied by the surface species, Al(L), Al2O(S) and Al2O2(S), are the most important surface intermediates, whereas the fractions of the other three species are close to 0.
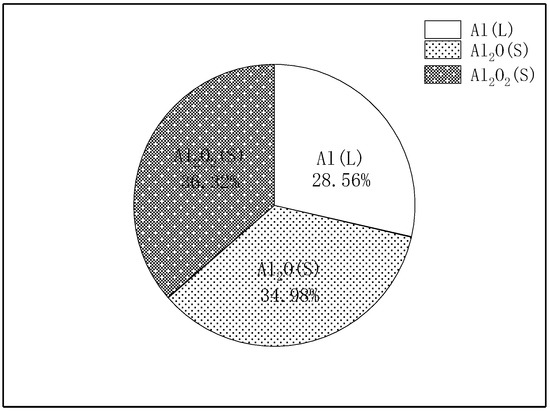
Figure 7.
Fraction of sites occupied by the surface species.
3.1.2. Burning Duration of Different Combustion Stages
The experimental measurements involving the burning duration of the different combustion stages are scarce. Only Dreizin [14] analyzed the burning of an aluminum particle with a diameter D = 165 μm in air. Figure 8 shows the results from [14]. In order to estimate the burning time from mass consumption , some ancillary assumption must be applied:
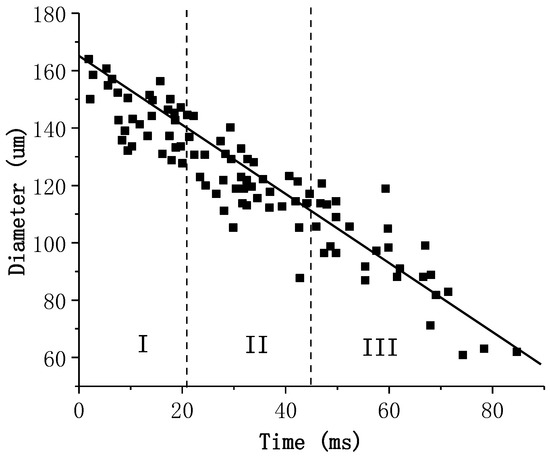
Figure 8.
The temporal variation of particle diameter in different combustion stages in [14].
- decreased linearly with the residual aluminum mass;
- Combustion ends as the residual aluminum mass reaches 0.01 of the initial mass.
At the beginning of the combustion process, the particle diameter measured in the experiment was the diameter of the pure aluminum particle. However, in the third stage, due to the growth of the oxidation cap, the initial diameter in Stage III was corrected here from 110 μm to 100 μm. The duration and initial diameter ranges for the different stages are shown in Table 4. In this study, the burning time of each stage is calculated by using Equation (4):
the density of aluminum was obtained by using Marion’s correlation [32]: , and the density at 2600 K is taken as the average density.

Table 4.
The duration and initial diameter ranges for the different stages.
The mass consumption rate with the aluminum mass in the whole combustion process for an aluminum particle (D = 165 μm) is shown in Figure 9, and the computed and experimental durations for each stage are shown in Figure 10. It can be observed that the calculated durations of Stage II and Stage III are highly consistent with those measured experimentally; however, the time of Stage I exhibits a specific error. This may be due to the fact that the linear reduction of considered in this study is different from the actual combustion process in Stage I. However, the consistency for the other two stages shows that the combustion model still has a high accuracy and can be used to analyze the characteristics of the different combustion stages.
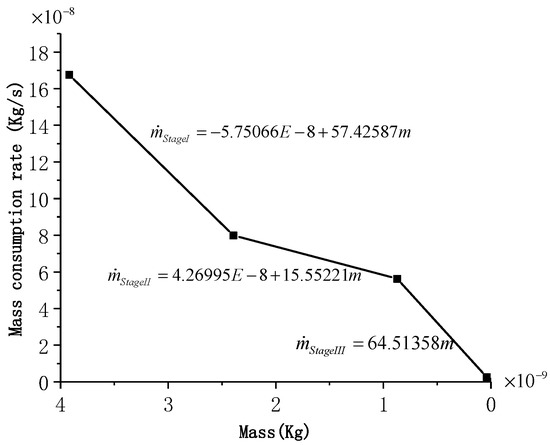
Figure 9.
Mass consumption rate with the aluminum mass in the whole combustion process for an aluminum particle (D = 165 μm).
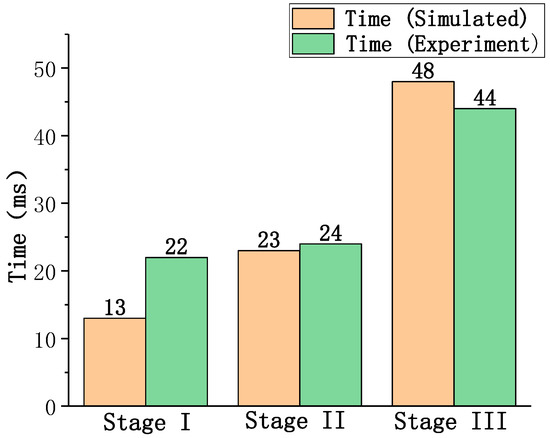
Figure 10.
The computed and experimental results of combustion time in each stage.
3.2. Combustion Time
for each particle size in the two combustion states was calculated first (Table 5), and subsequently the fitting relationship between and mass of the two states was obtained (Figure 11). It can be seen that decreases as the diameter is reduced, andin the boiling combustion state is always greater than that in the vaporized combustion state. In addition, for particles with same diameter, the temperature of the particle in the evaporative combustion state is lower than the boiling point and increases as the diameter decreases. As the diameter is decreased, the surface reaction becomes more intense and the particles absorb more heat; thus, the temperature is enhanced. It has also been experimentally observed that the particle temperature exhibits a period of increment in the later stages of combustion [7]. As there is no basis for dividing the combustion stage of particles with different diameters, all calculations are based on the classification basis presented in Table 4. Figure 12 shows the calculated duration of each combustion stage for the particles with different diameters. The total combustion time is proportional to the D1.94, which is consistent with the trend observed for the D2 law.

Table 5.
for each particle size in the two combustion states.
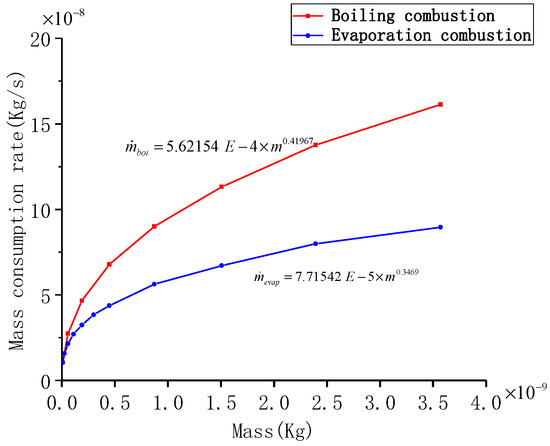
Figure 11.
The fitting relationship between and mass of the two states.
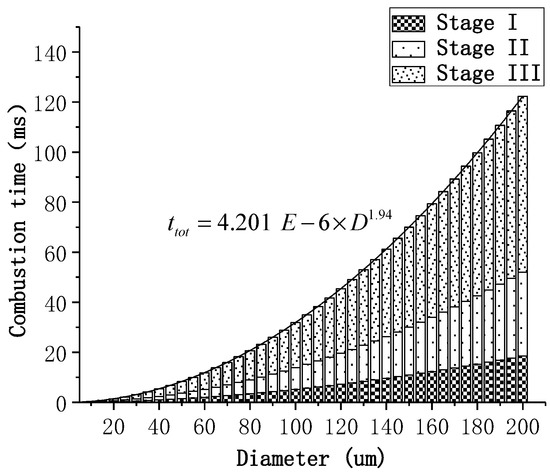
Figure 12.
The calculated time of each combustion stage for the particles with different diameters.
3.3. Large Particles
As mentioned earlier, for an aluminum particle with D = 165 μm, Stage I lasts until 140 μm, whereas Stage II lasts until 100 μm. The calculation results for the particles with 160 μm and 120 μm diameters are used to represent Stage I and Stage II, respectively. Figure 13a shows the temperature and gas composition distributions of the two combustion stages. The highest temperature of the flame in Stage I is noted to be about 100 K higher than that in Stage II, and the temperature in Stage II drops faster after the flame. The peak position of AlO in Stage II is observed to be closer to the particle surface than that in Stage I, and the mole fraction of Al2O near the surface is much larger than that of AlO, where the content of AlO is close to 0.
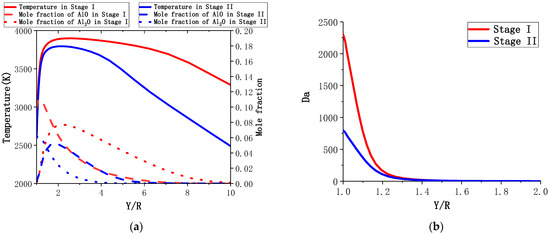
Figure 13.
The temperature and gas composition distributions (a) and the number (b) of the two combustion stages for an aluminum particle (D = 165 μm).
To illustrate the trade-off between the near-surface reaction and diffusion, Figure 13b shows the trend of number vs. normalized radius:, in which and , is the reaction rate of Al2O = AlO + Al. The number values near the wall in Stage I and Stage II are observed to be much higher than 1, indicating that the two stages are in a diffusion-controlled combustion mode. Further, from Stage I to Stage II, the number decreases significantly, indicating that the diffusion-controlled combustion eventually transforms into the chemical kinetics-controlled combustion.
To represent the importance of the surface reaction, the ratio of the Al2O3 deposition rate and Al consumption rate was used. The calculated results for the surface reaction are shown in Figure 14. The proportion of the surface reaction is observed to be very small for large particle sizes; however, the importance of surface reaction increases with the combustion stage. The fraction of the sites occupied by the three major surface species is almost similar. On changing the combustion stage, the proportion of Al (L) increases slightly, while the proportion of the other two species decreases to some extent.
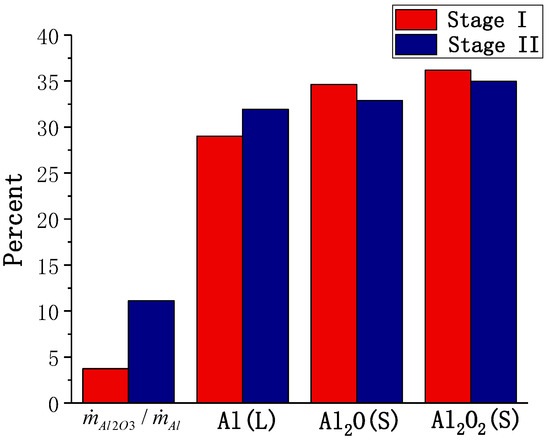
Figure 14.
The calculated results for the surface reaction of an aluminum particle (D = 165 μm).
3.4. Small Particles
A particle with D = 30 μm was chosen to study the combustion of the small particles. The calculation results for the particle with 30 μm and 20 μm diameters are used to represent Stage I and Stage II, respectively. Figure 15a shows the temperature and gas composition distributions of the two combustion stages. Compared with the particle with D = 165 μm, the temperature around the particle is lower. The content of AlO near the surface cannot be ignored, and the peak position of AlO hardly changes from Stage I to Stage II. From Figure 15b, it can be seen that the number is much smaller than that for the large particles, indicating that the rate of the chemical reaction is similar to the diffusion rate, and the combustion is undergoing transition stage from the diffusion-controlled combustion to the kinetics-controlled combustion. The calculated results for the surface reaction of the small particles are shown in Figure 16. is more than a quarter, indicating the importance of the surface reaction in small diameter particles. The fraction of sites of Al(L) is higher than the sum of other two, indicating intense evaporation.
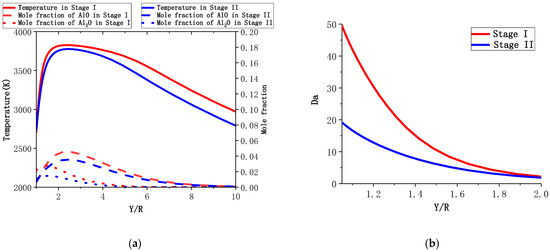
Figure 15.
The temperature and gas composition distributions (a) and the number (b) of the two combustion stages for an aluminum particle (D = 30 μm).
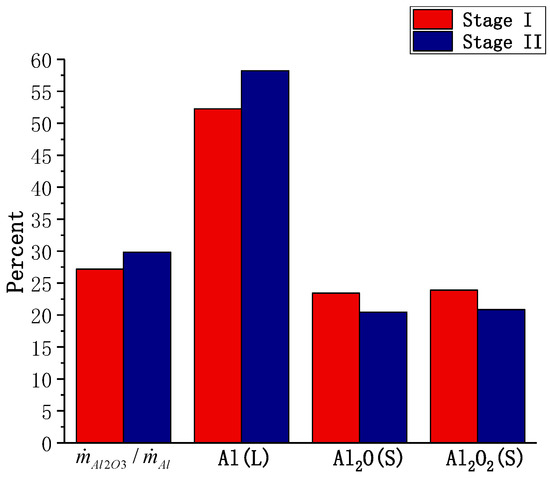
Figure 16.
The calculated results for the surface reaction of an aluminum particle (D = 30 μm).
4. Conclusions
In this study, the different combustion stages of an aluminum particle were simulated by using a quasi-steady combustion model. The model considered the detailed gas-phase and surface reaction mechanisms, which is more detailed and accurate than previous quasi-steady combustion models. This is the first report employing the quasi-steady-state model to simulate the different combustion stages and the results are observed to be in good agreement with the experimental data. During the aluminum combustion, the particle temperature keeps going down, which slows down the combustion rate. Particle temperature is a key factor affecting combustion intensity and cannot been seen as constant like in the previous model.
As the combustion process goes on, the flame temperature keeps decreasing, and the position of the flame is close to the surface and the surface reaction plays an increasingly importance role. The particle temperature in Stage II is lower than that in Stage I. For large particles, the temperature in stage II would be more than 100 K lower than the boiling point, while the value of small particles is slightly lower than the boiling point, indicating that the surface reaction of small particles of aluminum is more intense. The change of number reveals that the combustion model gradually transforms from diffusion control to kinetic control.
During the combustion process of aluminum particles, molten aluminum oxide will continuously deposit to form an oxidation cap, which may cause the particles to rotate and break, thereby affecting the combustion process. However, the model in this work ignores the influence of the oxidation cap. In the future, research on the growth process of the oxidation cap will be the focus of the aluminum particle combustion model.
Author Contributions
Writing—original draft preparation, Z.H.; writing—review and editing, L.M.; visualization, M.L.; supervision, T.Y.; project administration, Z.X.; funding acquisition, Y.F. All authors have read and agreed to the published version of the manuscript.
Funding
The research was funded by the National Natural Science Foundation of China (No.52006240).
Institutional Review Board Statement
Not applicable.
Informed Consent Statement
Informed consent was obtained from all subjects involved in the study.
Data Availability Statement
The study did not report any data.
Conflicts of Interest
The authors declare no conflict of interest.
Nomenclature
| Convection coefficient of particle () | |
| Diameter (m) | |
| Mass diffusion coefficient of the species in the mixture () | |
| Thermal conductivity of particle () | |
| Thermal conductivity of the gas mixture () | |
| Molar fraction | |
| Molar concentration of the species (gas or surface) ( or ) | |
| Pressure () | |
| Temperature () | |
| Time () | |
| Density () | |
| Velocity () | |
| Shear stress tensor () | |
| Mass fraction of the species | |
| Mass enthalpy of the species () | |
| Total energy () | |
| Activation energy of reaction () | |
| Enthalpy of reaction () | |
| Entropy of reaction () | |
| Equilibrium constant in pressure units for the th reaction | |
| Total number of gas phase species | |
| Total number of surface species | |
| Total number of gas phase reactions | |
| Total number of surface reactions | |
| Forward stoichiometric coefficients for the species in reaction | |
| Backward stoichiometric coefficients for the species in reaction | |
| Forward rate constant for reaction | |
| Backward rate constant for reaction | |
| Preexponential factor of reaction (---) | |
| Temperature exponent of reaction | |
| Rate of progress of the reaction ( or ) | |
| Mass production rate for the species due to gas phase reactions () | |
| Mass production rate for the species due to surface reactions () | |
| Sticking coefficient for the reaction | |
| Total density of open sites () | |
| Surface site fraction for the species | |
| Number of sites occupied by the species | |
| Sum of all the stoichiometric coefficients of reactants that are surface species | |
| Lennard-Jones potential well depth for the species () | |
| Boltzmann constant () | |
| Lennard-Jones diameter of the species | |
| Dipole moment (Debye) | |
| Polarizability | |
| Rotational relaxation collision number | |
| Time of diffusion () | |
| ) | |
| Dimensionless number representing the speed of diffusion and reaction | |
| Ratio of Y coordinate value to particle radius |
References
- Chen, Y.; Guildenbecher, D.R.; Hoffmeister, K.N.G.; Cooper, M.A.; Stauffacher, H.L.; Oliver, M.S.; Washburn, E.B. Study of aluminum particle combustion in solid propellant plumes using digital in-line holography and imaging pyrometry. Combust. Flame 2017, 182, 225–237. [Google Scholar] [CrossRef]
- Chu, Q.; Shi, B.; Liao, L.; Zou, X.; Luo, K.H.; Wang, N. Reaction Mechanism of the Aluminum Nanoparticle: Physicochemical Reaction and Heat/Mass Transfer. J. Phys. Chem. C 2020, 124, 3886–3894. [Google Scholar] [CrossRef]
- Dirven, L.; Deen, N.G.; Golombok, M. Dense energy carrier assessment of four combustible metal powders. Sustain. Energy Technol. 2018, 30, 52–58. [Google Scholar] [CrossRef]
- Bergthorson, J.M. Recyclable metal fuels for clean and compact zero-carbon power. Prog. Energy Combust. Sci. 2018, 68, 169–196. [Google Scholar] [CrossRef]
- Bergthorson, J.M.; Goroshin, S.; Soo, M.J.; Julien, P.; Palecka, J.; Frost, D.L.; Jarvis, D.J. Direct combustion of recyclable metal fuels for zero-carbon heat and power. Appl. Energy 2015, 160, 368–382. [Google Scholar] [CrossRef]
- Shkolnikov, E.I.; Zhuk, A.Z.; Vlaskin, M.S. Aluminum as energy carrier: Feasibility analysis and current technologies overview. Renew. Sustain. Energy Rev. 2011, 15, 4611–4623. [Google Scholar] [CrossRef]
- Rossi, C.; Zhang, K.; Esteve, D.; Alphonse, P.; Tailhades, P.; Vahlas, C. Nanoenergetic Materials for MEMS: A Review. J. Microelectromech. Syst. 2007, 16, 919–931. [Google Scholar] [CrossRef]
- DesJardin, P.E.; Felske, J.D.; Carrara, M.D. Mechanistic Model for Aluminum Particle Ignition and Combustion in Air. J. Propuls. Power 2005, 21, 478–485. [Google Scholar] [CrossRef]
- Beckstead, M.W. Correlating Aluminum Burning Times. Combust. Explos. Shock Waves 2005, 41, 533–546. [Google Scholar] [CrossRef]
- Lynch, P.; Krier, H.; Glumac, N. A correlation for burn time of aluminum particles in the transition regime. Proc. Combust. Inst. 2009, 32, 1887–1893. [Google Scholar] [CrossRef]
- Feng, Y.; Xia, Z.; Huang, L.; Ma, L. Ignition and combustion of a single aluminum particle in hot gas flow. Combust. Flame 2018, 196, 35–44. [Google Scholar] [CrossRef]
- Feng, Y.; Xia, Z.; Huang, L.; Ma, L. Effect of ambient temperature on the ignition and combustion process of single aluminium particles. Energy 2018, 162, 618–629. [Google Scholar] [CrossRef]
- Bucher, P.; Yetter, R.A.; Dryer, F.L.; Parr, T.P.; Hanson-Parr, D.M.; Viceni, E.P. Flames structure measurement of single, isolated aluminum particles burning in air. Symp. Combust. 1996, 26, 1899–1908. [Google Scholar] [CrossRef]
- Dreizin, E.L. Experimental study of stages in aluminium particle combustion in air. Combust. Flame 1996, 105, 541–556. [Google Scholar] [CrossRef]
- Marsh, A.W.; Wang, G.T.; Heyborne, J.D.; Guildenbecher, D.R.; Mazumdar, Y.C. Time-resolved size, velocity, and temperature statistics of aluminum combustion in solid rocket propellants. Proc. Combust. Inst. 2020. [Google Scholar] [CrossRef]
- Brzustowski, T.A.; Glassman, I. Spectroscopic Investigation of Metal Combustion. Prog. Astronaut. Rocket. 1964, 15, 41–73. [Google Scholar] [CrossRef]
- Liang, Y.; Beckstead, M. Numerical simulation of quasi-steady, single aluminum particle combustion in air. In Proceedings of the 36th Aerospace Sciences Meeting & Exhibit, Reno, NV, USA, 12–15 January 1998. [Google Scholar] [CrossRef]
- Liang, Y.; Beckstead, M. Numerical simulation of unsteady, single aluminum particle combustion in air. In Proceedings of the 34th JANNAF Meeting, West Palm Beach, FL, USA, 27–30 October 1997. [Google Scholar]
- Widener, J.; Liang, Y.; Beckstead, M. Aluminum combustion modeling in solid propellant environments. In Proceedings of the Joint Propulsion Conference & Exhibit, Cleveland, OH, USA, 13–15 July 1998. [Google Scholar]
- Washburn, E.B.; Trivedi, J.N.; Catoire, L.; Beckstead, M.W. The Simulation of the Combustion of Micrometer-Sized Aluminum Particles with Steam. Combust. Sci. Technol. 2008, 180, 1502–1517. [Google Scholar] [CrossRef]
- Washburn, E.B.; Webb, J.A.; Beckstead, M.W. The simulation of the combustion of micrometer-sized aluminum particles with oxygen and carbon dioxide. Combust. Flame 2010, 157, 540–545. [Google Scholar] [CrossRef]
- Glorian, J.; Gallier, S.; Catoire, L. On the role of heterogeneous reactions in aluminum combustion. Combust. Flame 2016, 168, 378–392. [Google Scholar] [CrossRef]
- Bojko, B.T.; DesJardin, P. Modeling the Diffusion to Kinetically Controlled Burning Transition of Micron-Sized Aluminum Particles. In Proceedings of the 53rd AIAA Aerospace Sciences Meeting, Kissimmee, FL, USA, 5 January 2015. [Google Scholar]
- Bojko, B.T. Numerical Modeling of the Transition from Kinetics to Diffusion Controlled Combustion of Aluminum Particles. Ph.D. Thesis, State University of New York at Buffalo, Buffalo, NY, USA, 2014. [Google Scholar]
- Catoire, L.; Giraud, M.; Legendre, J.-F. Kinetic Model for Aluminum-Sensitized Ram Accelerator Combustion. J. Propul. Power 2003, 19, 196–202. [Google Scholar] [CrossRef]
- Joseph, O.H.; Charles, F.C. Molecular Theory of Gases and Liquids; John Wiley & Sons, Inc.: New York, NY, USA, 1954; 1219p. [Google Scholar]
- Starik, A.M.; Kuleshov, P.S.; Sharipov, A.S.; Titova, N.S.; Tsai, C.-J. Numerical analysis of nanoaluminum combustion in steam. Combust. Flame 2014, 161, 1659–1667. [Google Scholar] [CrossRef]
- ANSYS. Chemkin-Pro Input Manual 18.0; ANSYS, Inc.: San Diego, CA, USA, 2017. [Google Scholar]
- Huang, Y.; Risha, G.A.; Yang, V.; Yetter, R.A. Effect of particle size on combustion of aluminum particle dust in air. Combust. Flame 2009, 156, 5–13. [Google Scholar] [CrossRef]
- Glorian, J.; Catoire, L.; Gallier, S.; Cesco, N. Gas-surface thermochemistry and kinetics for aluminum particle combustion. Proc. Combust. Inst. 2015, 35, 2439–2446. [Google Scholar] [CrossRef]
- Glorian, J. Heterogeneous Kinetics for Aluminum Combustion. Ph.D. Thesis, ENSTA ParisTech, Paris, France, 2014. [Google Scholar]
- Marion, M. Etudes Sur la Combustion des Particules D’aluminium Sous Pression. Ph.D. Thesis, Maastricht University, Maastrich, The Netherlands, 1996. [Google Scholar]
Publisher’s Note: MDPI stays neutral with regard to jurisdictional claims in published maps and institutional affiliations. |
© 2021 by the authors. Licensee MDPI, Basel, Switzerland. This article is an open access article distributed under the terms and conditions of the Creative Commons Attribution (CC BY) license (http://creativecommons.org/licenses/by/4.0/).