Article

Relationships between the Macrostructure Features and Acoustic Parameters of Resonance Spruce for Piano Soundboards

Faculty of Forestry and Wood Technology, Mendel University in Brno, Zemědělská 3, 613 00 Brno, Czech Republic
*
Author to whom correspondence should be addressed.
Appl. Sci. 2021, 11(4), 1749; https://doi.org/10.3390/app11041749
Submission received: 19 January 2021 / Revised: 9 February 2021 / Accepted: 13 February 2021 / Published: 16 February 2021

Abstract

:
An experimental examination of the relationship between the macrostructure characteristics and the acoustic properties of Norway spruce was performed. The macrostructure features were found to comprise the density (ρ), percentage of latewood (%LW), slope of grain (α), and angle the annual rings in a cross section (β). The main acoustic parameters of the research were the sound velocity, dynamic Young’s modulus, acoustic impedance (Z), and radiation coefficient (R). The acoustic properties for both the cross section and the longitudinal direction were calculated. Non-destructive evaluation (NDE) is the appropriate approach to define acoustic properties. Ultrasonic direct transmission and a transitory excitation method were used to calculate and compare the acoustic properties. A modal analysis was performed to predict the frequency range that corresponded to the different mode shapes. There were no significant differences between the two methods, yet an 80% reduction of the velocity, Z and R was identified between the longitudinal direction and the cross section. The equations used to define acoustic radiation according to the latewood component were defined, and strong correlations between the macrostructure and acoustic parameters were confirmed. A tight relationship was observed between the reduction of sound velocity and material density exceeding 440 kg m−3.

1. Introduction

The resonance wood is the wood used in the manufacturing of the soundboard of the string musical instruments. Picea abies is the resonance wood species. Requirements for the resonance wood used for a piano’s soundboard are defined by multiple parameters, such as micro and macro structural, physical, mechanical, and acoustic characteristics [1]. Nevertheless, published research on the relationship between the structure of wood and its acoustic properties is incomplete. The macrostructure’s most essential attributes include the non-slope grain, non-present pitch pockets, and knots, which create obstacles for the transmission of sound, cause a distortion to wave propagation, and no insect and/or fungi attacks. To obtain a good-quality piano soundboard, the seasoning of wood is fundamental. Ideally, this is obtained by natural aging. Seasoning is necessary to stabilize the timber’s shape and dimensions so as to acquire hygroscopic equilibrium and release the internal stresses of the material [2]. The presence of compression wood is undesired because of its anomalous structure and high density. Thanks to Bucur et al. [3], it is well known that the presence of juvenile wood produces potential reduction in sound speed compared to mature wood. The growth ring should consist of approximately 25% latewood [4], and the ring’s width should exhibit between 0.7 and 3 mm [5] of constant growth. Considering the velocity of sound in the longitudinal (L) and transversal directions (VLL and VTT, respectively), latewood displays a higher speed value than earlywood [6] due to its thick wall and different density. The thickness of the annual ring influences the sound pitch. Wide rings have low vibration frequencies, while thin rings have high vibration frequencies [7]. Violin makers require another interesting characteristic in resonance wood: the presence of hazelwood—mostly because of its aesthetic features. Bucur [6] and Maina [8] affirm that high elasticity but low density of wood is sought for the manufacturing of string instruments.
The experience of top violin makers affirms Norway spruce (Picea abies L. Karst.) is the species of resonance wood to create a quality soundboard for string instruments [9,10]. The parameters and properties that define the acoustic qualities of soundboards are moisture, density, and sound speed, which are followed by modulus of elasticity (MOE), specific dynamic modulus, internal friction, radiation coefficient (R) (acoustic constant), acoustic conversion efficiency, and acoustic impedance (Z) [11,12,13,14,15,16,17,18,19,20]. Non-destructive evaluations (NDEs) are an appropriate method to define acoustic properties.
Acoustic NDEs identify the physical and mechanical properties of a material without altering its end-use capabilities [21]. Three methods were developed for the acoustic NDEs: ultrasonic direct transmission, stress wave, and resonance frequency vibration [22,23]. The stress wave method utilizes the audible frequency (approx. 20 Hz to 20 kHz). It was developed on the basis of a sonic wave flight time generated by an impact from the transmitter to the receiver sensor. The ultrasonic direct transmission method uses a higher frequency (>20 kHz ultrasonic waves) and two piezoelectric sensors [24,25]. The frequency resonance method employs the vibration of the sample by natural mode shapes after impact (e.g., hammer strike). The research described in this paper used two acoustic NDE methods: the ultrasonic direct transmission method and the frequency resonance method.
The direct transmission and frequency resonance methods were developed to determine the dynamic MOE [6,26,27,28]. These dynamic methods are rapid and accurate for the determination of dynamic Young’s modulus of wood.
This article focuses on the definition of the strict relationships between the macrostructure of resonance wood and its acoustic properties.

2. Materials and Methods

Two hundred and two Norway spruce (Picea abies L. Karst.) specimens were provided by the Petrof Ltd. company (producer of Czech pianos). No defects were observed; high quality wood was used.
The dimensions of samples were 450 × 44 × 12 mm (longitudinal × radial × tangential), based on the manufacturing of the piano soundboard. The equilibrium moisture content was 7% (long-term conditioning in 20 °C at 35% relative humidity). The three dimensions of each specimen were measured to calculate the volume (V); afterward, the samples were weighted to define the mass (m); thus, density (ρ) was calculated as the ratio of mass and volume.

2.1. Determination of Macroscopic Features

The determination of macroscopic features was performed by image processing. The percentage of latewood and the average width of the annual rings (AWAR) were calculated. Then, the ring angle on the longitudinal quarter sawing surface of the laths (slope of grain) and the ring angle of the cross orthogonal section were measured.

2.1.1. Calculation of Latewood Percentage

WinDENDRO® software was employed to calculate the percentage of latewood (%LT). At first, the cross orthogonal sections of all the samples’ surfaces were scanned using a commercial scanner. Afterward, the path perpendicular to the rings was defined. The borders between each ring and the borders between earlywood and latewood were delimited automatically, based on the different colors of the two types of wood. The AWAR and the average latewood width (LW) were calculated. The calculation of the percentage of the latewood component was carried out (%LW).

2.1.2. Longitudinal Angle and Slope of Grain

In general, the longitudinal quarter sawing shows the rings in longitudinal direction and the slope of grain corresponds to the rings’ direction (feasibly visible). Therefore, the L angle (or slope of grain then named α) was identified as the rings angle on the longitudinal quarter sawing surface of the laths. Thus, the slope of grain was measured.

2.1.3. Orientation of Annual Rings in Cross Section

The annual ring orientation of the lath’s quarter sawing was also visible in the cross section. In piano soundboards the orientation of the rings in cross section must be perpendicular to the wide edge. In this research, the angle (δ) between the ring and the wide edge of the cross section was measured. The angle that defines the orientation of growing rings in the cross section was named β angle. The β angle was calculated using the equation |90- δ|, as complementary of δ. For radial orientation of the cross section, β was 0°; for tangential orientation, β was 90°.
The radial orientation in the cross section and thus the longitudinal quarter sawn (as straight grain) is a basilar macroscopic feature. The velocity of sound is definitely faster in the straight fiber orientation.

2.2. Determination of Acoustic Parameters through Ultrasonic Direct Transmission Method

The basis of ultrasonic measurements is the calculation of ultrasonic wave velocities through measuring the times of progression between two points. The technique is very simple, and the time measurements are very accurate; the rate of error is less than 1% [6]. The ultrasonic direct transmission described in this paper focused on the L and the radial–tangential (RT) directions using a FAKOPP ultrasonic timer. This device was composed of a generator of ultrasonic impulses and two piezoelectric transducers and was used to measure the travelling time of the ultrasonic pulse across the specimens. The impulse is an electrical signal converted by the piezoelectric transducer to a mechanical signal for a very short duration. The impulse is made by the emitter transducer and travels at the speed of sound to the receiver transducer, which was placed at the other side of the sample. The receiver sensor operated within the frequency range of 15–300 kHz. The transducers had a resonance frequency of 45 kHz. The dynamic modulus was calculated from the sound velocity, combining the transition time through the specimen and its length.
The FAKOPP ultrasonic timer device was used to determine the dynamic MOE in the L (Figure 1a) and RT directions (Figure 1b).
The reading on the device displayed the crossing time of the impulse, from which the calculation of the speed sound for each specimen was made. Consequently, the dynamic MOE was calculated using the dimensional wave equation [29]:
M O E U S = ρ × v 2  
where v is the calculated ultrasonic speed and ρ is the density of the wood specimen.

2.3. Determination of Acoustic Parameters through Transitory Excitation Method

The principles of the resonance method (also named transitory excitation) consisted of an excitation of samples by a hammer strike. The hammer had to weigh enough to excite the vibration of the sample but light enough not to produce too much impulse to carry the specimen with it as a rigid body. In many situations, these requirements lead to the use of a hammer that weighs approximately the same as the specimen. The excitation was given at a known antinode. Then, a microphone that was close to another known antinode recorded the sound created by the strike. The signal was sent to a digital oscilloscope settled in a Fast Fourier Transform processor, which revealed the spectrogram in the frequency domain. Dynamic MOE was calculated by the frequency value. The capability of a Fast Fourier Transform greatly simplifies dynamic test analysis, particularly in the resonance method. The free support conditions provided the most accurate support conditions achievable [30,31].
This method for measuring the dynamic Young’s modulus was carried out in L and flexural direction.

2.3.1. Pre-Analysis by Finite Element Simulation

The determination of acoustic properties through the transitory excitation method requires knowledge of the mode shape the corresponding natural frequency of samples. The site of the antinodes and nodes was identified, which is very important for the transitory excitation method. Pre-analysis was achieved with a numerical simulation based on the finite element method (FEM) using the software ANSYS Academic R16.2. A modal analysis of free- free vibration was implemented. The modal analysis needs the 9 independent elastic constants of wood and the physical property, the density. The modal analysis computes the natural vibrations of a body (mode shapes) at the relative frequencies (natural frequencies). The free- free vibration means that the geometry of the body does not contain constrains.
As a first step, the geometry of the model volume as a rectangle, defined by the coordinates x (radial direction), y (L), and z (tangential), was built up. The element type, SOLID 185 (solid structural brick with eight nodes), was chosen to produce the discretization of the region. A physical model based on linear–elastic orthotropic material was created by defining the material’s constant density and MOE in three directions (X, Y, Z), shear modulus (G), and the Poisson’s coefficient (NU) (both in three planes: XY, YZ, XZ). The values of the MOE, G, and NU in the Norway spruce samples correlated with Hearmon’s 1948 “Engineering Parameters of Solid Wood” table [6,32]. To describe the variability of the material, two different material models and analyses were employed: one with the lowest density results and one with the highest. The algorithm of the block Lanczos was used to find the natural frequencies and mode shapes. Twelve simulations were carried out. The mode shapes were: first bending mode, torsion mode, second bending mode, first transversal bending mode, second torsion mode, third bending mode, third torsion mode, second transversal bending mode, fourth bending mode, fourth torsional mode, and the longitudinal one. The focus was given to the first bending mode and the L mode.
Four of the computed mode shapes are shown in Figure 2. Predictably, two different values of density were applied: the lowest measured (365 kg m−3) and the highest measured (589 kg m−3), from which different frequencies were derived. The higher the density, the lower the frequency. The first bending mode of the lowest density corresponded to 391 Hz and the highest to 308 Hz; the average value of density (463 kg m−3) corresponded to the frequency of 341 Hz.
Following the simulation results, the behavior of the laths between diverse density values was intuited. Specifically, after the modal simulation, the relationships between density, mode shape, and frequency were observed, as already summarized in the figure above. Moreover, the modal analysis indicated the antinodes and nodes for each mode shape.

2.3.2. Analysis of the Longitudinal Vibration Mode

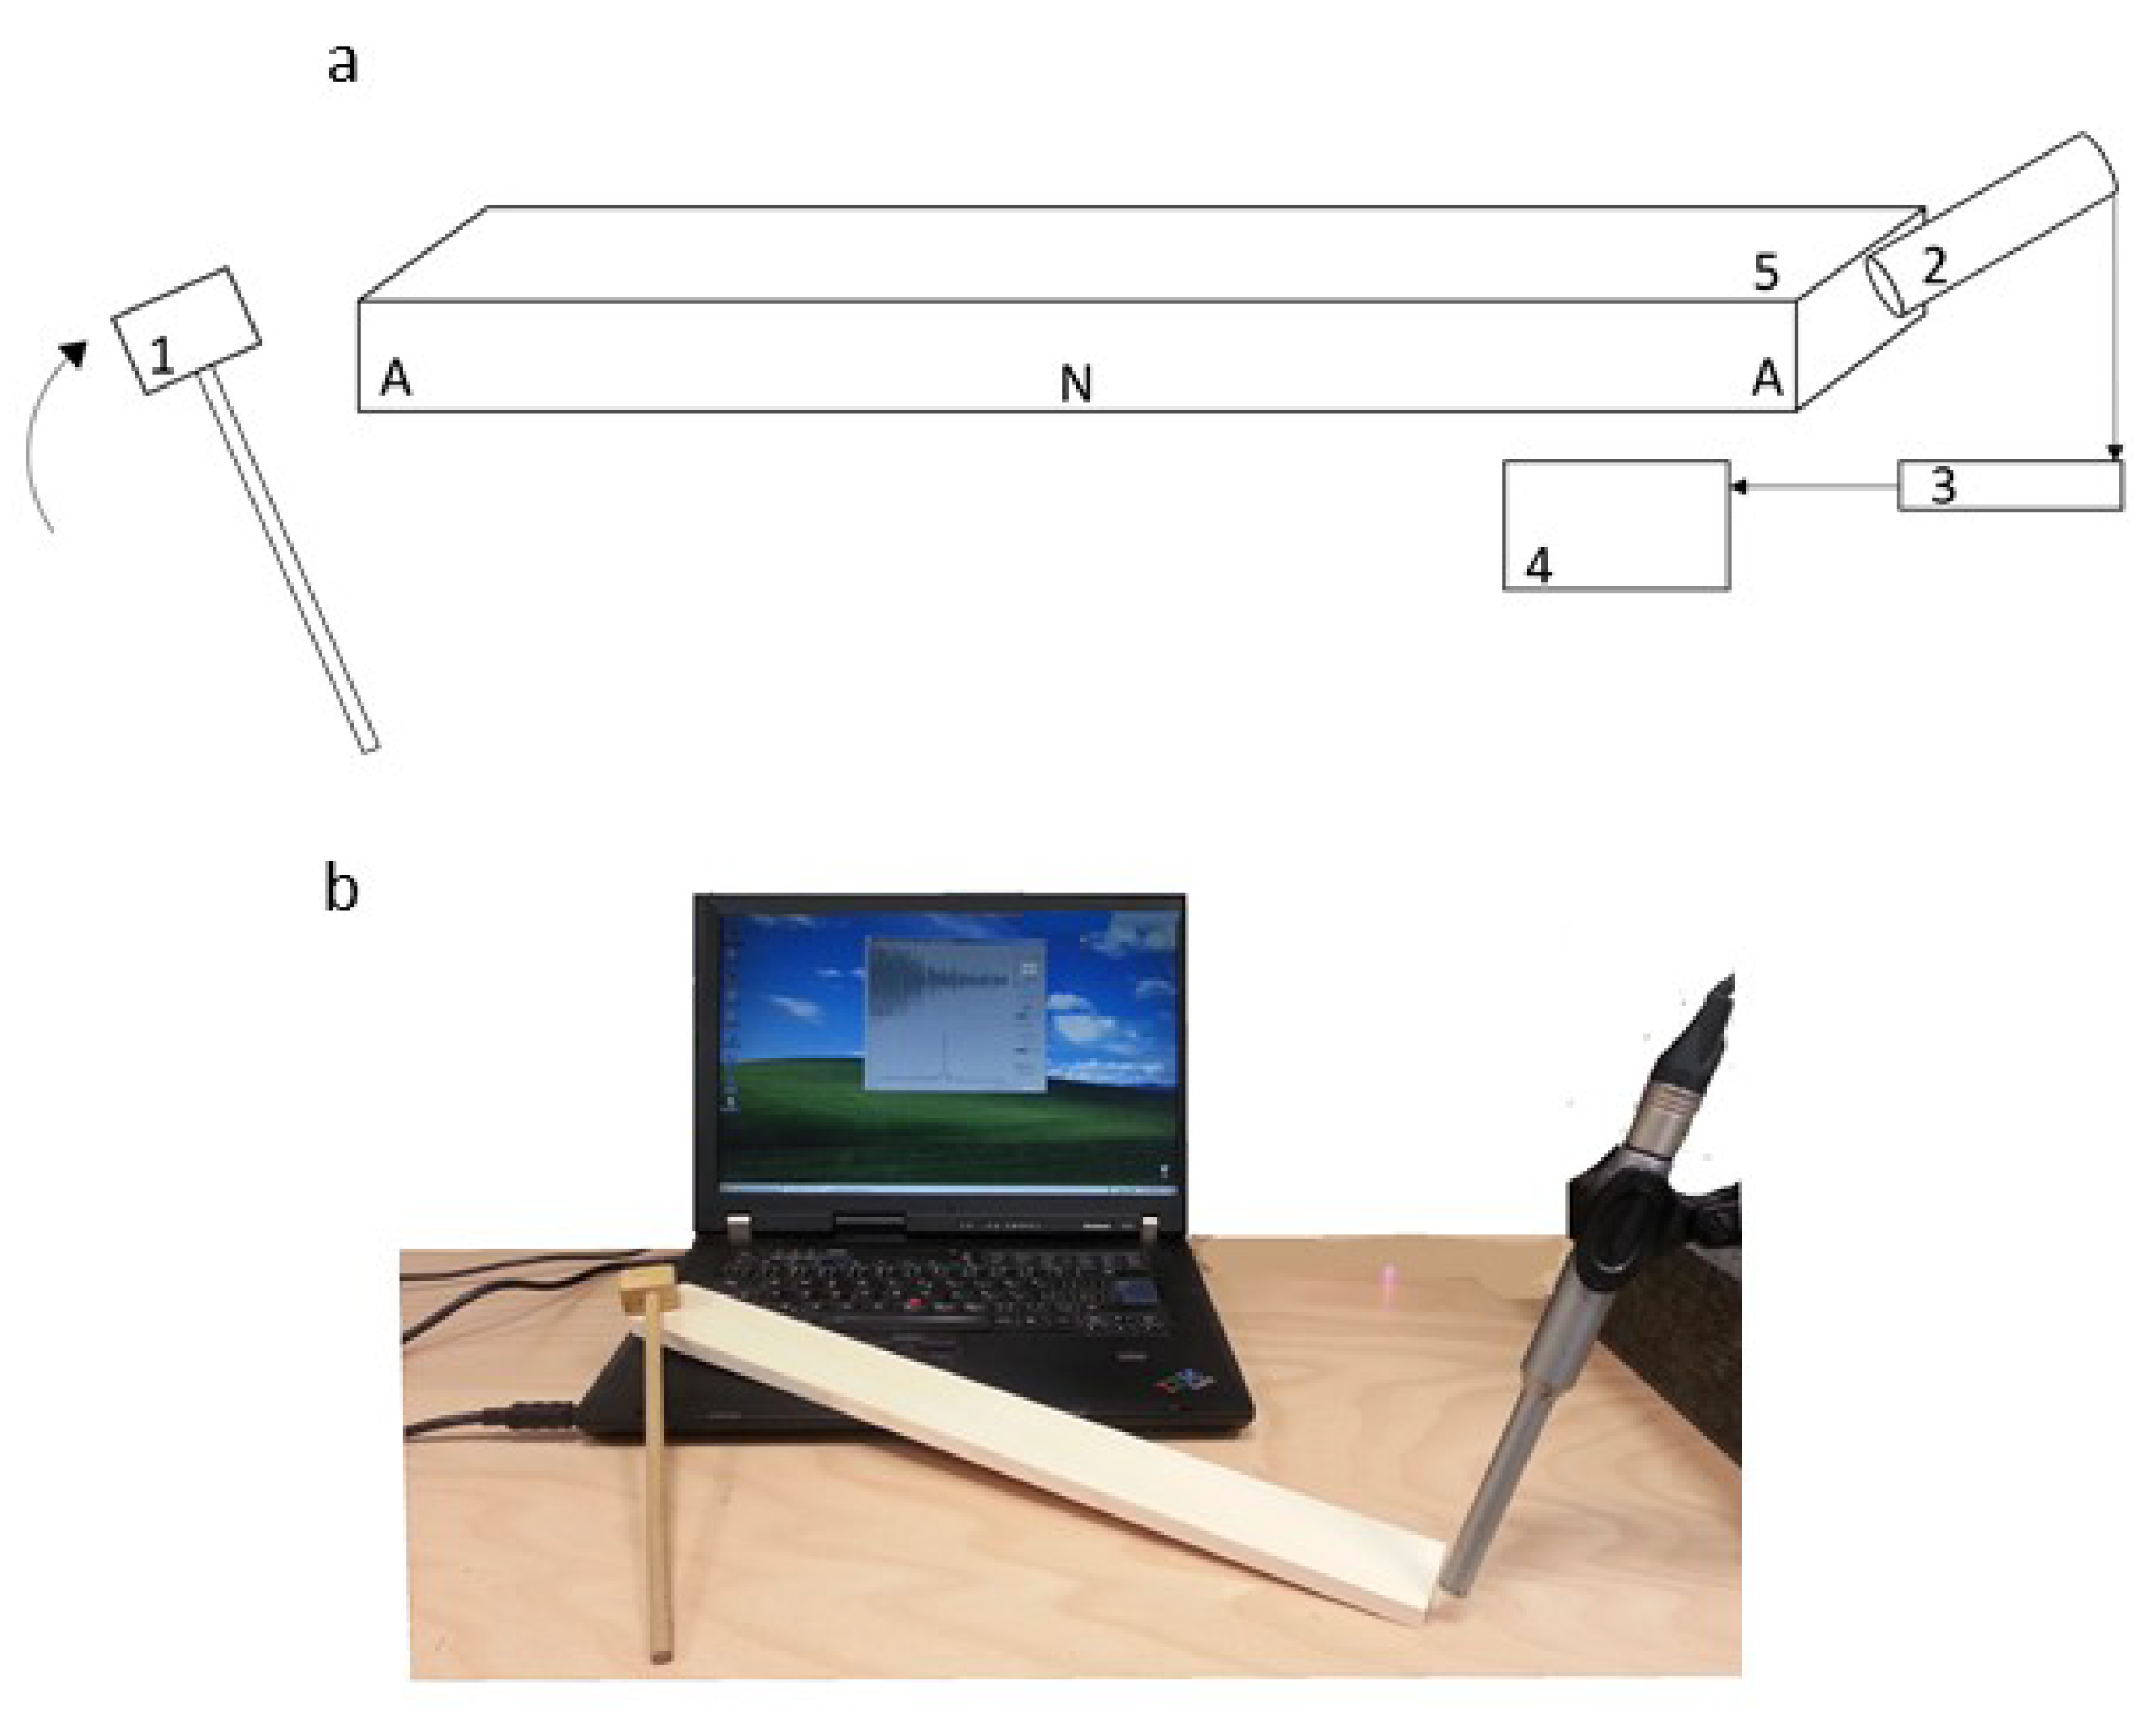
The vibration used to reach the L dynamic MOE through resonance frequency was produced by striking the specimen with a wooden hammer. The antinodes were at both ends of the lath, and the node was at its length center. This means that the samples were struck at one end, directly parallel to the long dimension, and were handheld in the middle of the length of the sample (node position). The microphone was positioned near to the opposite free end of the lath to capture the radiation of sound from the sample (Figure 3). The microphone model Behringer ECM8000 was linked to the FireWire Audio Capture Interface EDIROL FA-101 with an acoustic resolution of 194 kHz at 24 bit.
The fundamental L resonance frequency occurred between 5000 and 9000 Hz [30]. From the modal analysis, the range of L resonance frequency was between 5700 and 7500 Hz. The software, based on Fast Fourier Transform analysis, showed the value of recorded frequency. The sound velocity was calculated according to the frequency. Thus, dynamic MOEL was achieved with the following equation [29]:
M O E F R E Q L = ρ × ( 2 × l × f L ) 2  
where ρ is density, l is the length of the test sample, and fL is the L frequency.

2.3.3. Analysis of Flexural Vibration Mode (Free-Free Vibration)

The determination of the dynamic MOE in bending by the resonance method simulates the excitation of a free-free bar test. To achieve the dynamic MOE in bending, the first fundamental bending mode was simulated. The antinode was located in the middle of the sample. The nodes were located on 0.2 and 0.8 of the length of the specimens, 90 and 360 mm, respectively. A resin hammer was used to strike the antinode of the bar and the microphone was positioned next to it. To limit the constraint of the free-free test sample, two foam rubber supports were placed under the nodes’ sites (Figure 4).
The dynamic MOE in bending (MOEB) was calculated from the first frequency of bending (fB) [29]:
M O E F R E Q B = ρ × ( f B × l 2 I × 3 , 5608 ) 2
where l is length, ρ is density, and I is the moment of inertia, which is calculated as follows [29]:
= l × w × t 3 12 × w × t
where l is length, t is thickness and w is width.
The acoustic properties for piano soundboards were defined by velocity, R, and Z. Wood temperature, density, and moisture may influence acoustic properties [12]; therefore, they must be maintained constant during measuring [17].
The acoustic impedance was calculated from this equation [33]:
Z = v × ρ
where v is sound velocity through the sample, and ρ is density.
The equation of the acoustic radiation R is [12,34]:
R = v ρ = M O E ρ 3  
where v is sound speed, ρ is density, and MOE is modulus of elasticity.

2.4. Statistical Analysis

The macroscopic characteristics and acoustic properties were computed by statistical analysis. Firstly, descriptive statistics was achieved per each feature by mean, standard deviation, and coefficient of variation. Sign tests and t-test analysis were performed to compare the acoustic properties calculated by different methods and different directions. Correlations and linear regressions were achieved to define equations to estimate acoustic properties via macroscopic features or velocity of the sound. Analysis of variance was performed based on structural and physical factors.

3. Results

3.1. Macroscopic Features

The results of measurements and calculations of the macroscopic features and density are shown in Table 1.
It is suggested that suitable resonance wood must have a density between 354 and 501 kg m−3 [9]. Similar to this figure is that of the density defined by Wegst [14] in wood used for soundboard, which may range from 360 to 550 kg m−3. Indeed, the density of Picea abies is placed around 460 kg m−3 [35,36,37]. The average density value in this research is 463 kg m−3—perfectly inside the range defined in the literature. The lowest value is 364 and the highest is 588 kg m−3. The highest value exceeds the highest limit of the ranges defined in the literature [14].

3.2. Acoustic Properties

The results of the acoustic properties are presented in Table 2. The acoustic properties were calculated in the L direction, both with the ultrasonic direct transmission (USL) and the transitory excitation method (FREQL). Then, the acoustic properties of the cross section were measured through the ultrasonic method (USRT). Eventually, the flexural MOE and R were calculated using the transitory excitation method (FREQB).
Table 3 presents the range of results of the acoustic properties in the L direction distinguished by the two methods.
The value of the sound velocity along the L direction (VLL) for Norway spruce is around 5350 m s−1 [35,36,37,38]. This is also confirmed by Yoshikawa [15], with a similar value: 5300 m s−1. Wegst [14] recommends that the value of L velocity for soundboard wood should reside between 3900 and 6700 m s−1. Buksnowitz [9] experimented on Norway spruce that the VLL value varied from a minimum of 4906 m s−1 to a maximum of 6897 m s−1, with an average of 6183 m s−1. The L velocity achieved by the ultrasonic direct transmission method was 5833 m s−1 and 5833 m s−1 by the resonance method. The results were very close, and both acceptable according to the literature data. Furthermore, the values of radial sound velocity must lie between 1042 and 2194 m s−1 and average 1889 m s−1; the average of the radial–transversal velocity measured by this research was 1165 m s−1, in agreement with the literature of Buksnowitz [9].
The MOE in the L direction (MOEL) of a material used for piano soundboards should mostly lie between 6 and 20 GPa [14]. Barducci and Pasqualini [35] define the MOEL of spruce of 13.5 GPa. Despide this, Hearmon [32] identifies a 15.9 GPa of the MOEL in Norway spruce. The ultrasonic direct transmission method found an MOEL of 15.901 GPa, and the transitory excitation produced a value of 15.857 GPa. These results were closer to Hearmon’s values than those of Barducci and Pasqualini. Moreover, the values of MOEB of Norway spruce varied from 9 to 14 GPa [31]. Similar values were found by Buksnowitz [9]: 6.42 to 14.72 GPa. The results of this research produced an average MOEB of 15.04 GPa, which is higher than that in the literature.
The R must be high in resonance soundboard. The R ranges between 8.7 and 16.4 m4 kg s−1 [14]. The R of spruce is stabilized at 11.41 m4 kg s−1 [35,37]. The average R results of this research were: 12.72 for the ultrasonic direct transmission method and 12.70 m4 kg s−1 for the resonance method—both inside the range shown in the literature by Wegst [14] but higher than that of Bucur [37]. The R in bending was slightly lower—12.37 m4 kg s−1.
The Z is the main factor when the vibration energy passes from the strings to a soundboard and vice versa [33,37,39]. A low value of impedance corresponds to a high efficiency of energy transfer. In Norway spruce, the Z is fixed to 2.5 MPa s m−1, and, when used as the wood for soundboards, the allowed range is defined between 1.2 and 3.339 MPa s m−1 [14,37]. Since the impedance is calculated by the velocity, Z was achieved based only on the L direction; both methods reached the same value of Z: 2.71 MPa s m−1.

3.3. Correlation and Regression between Macrostructure and Acoustic Parameters

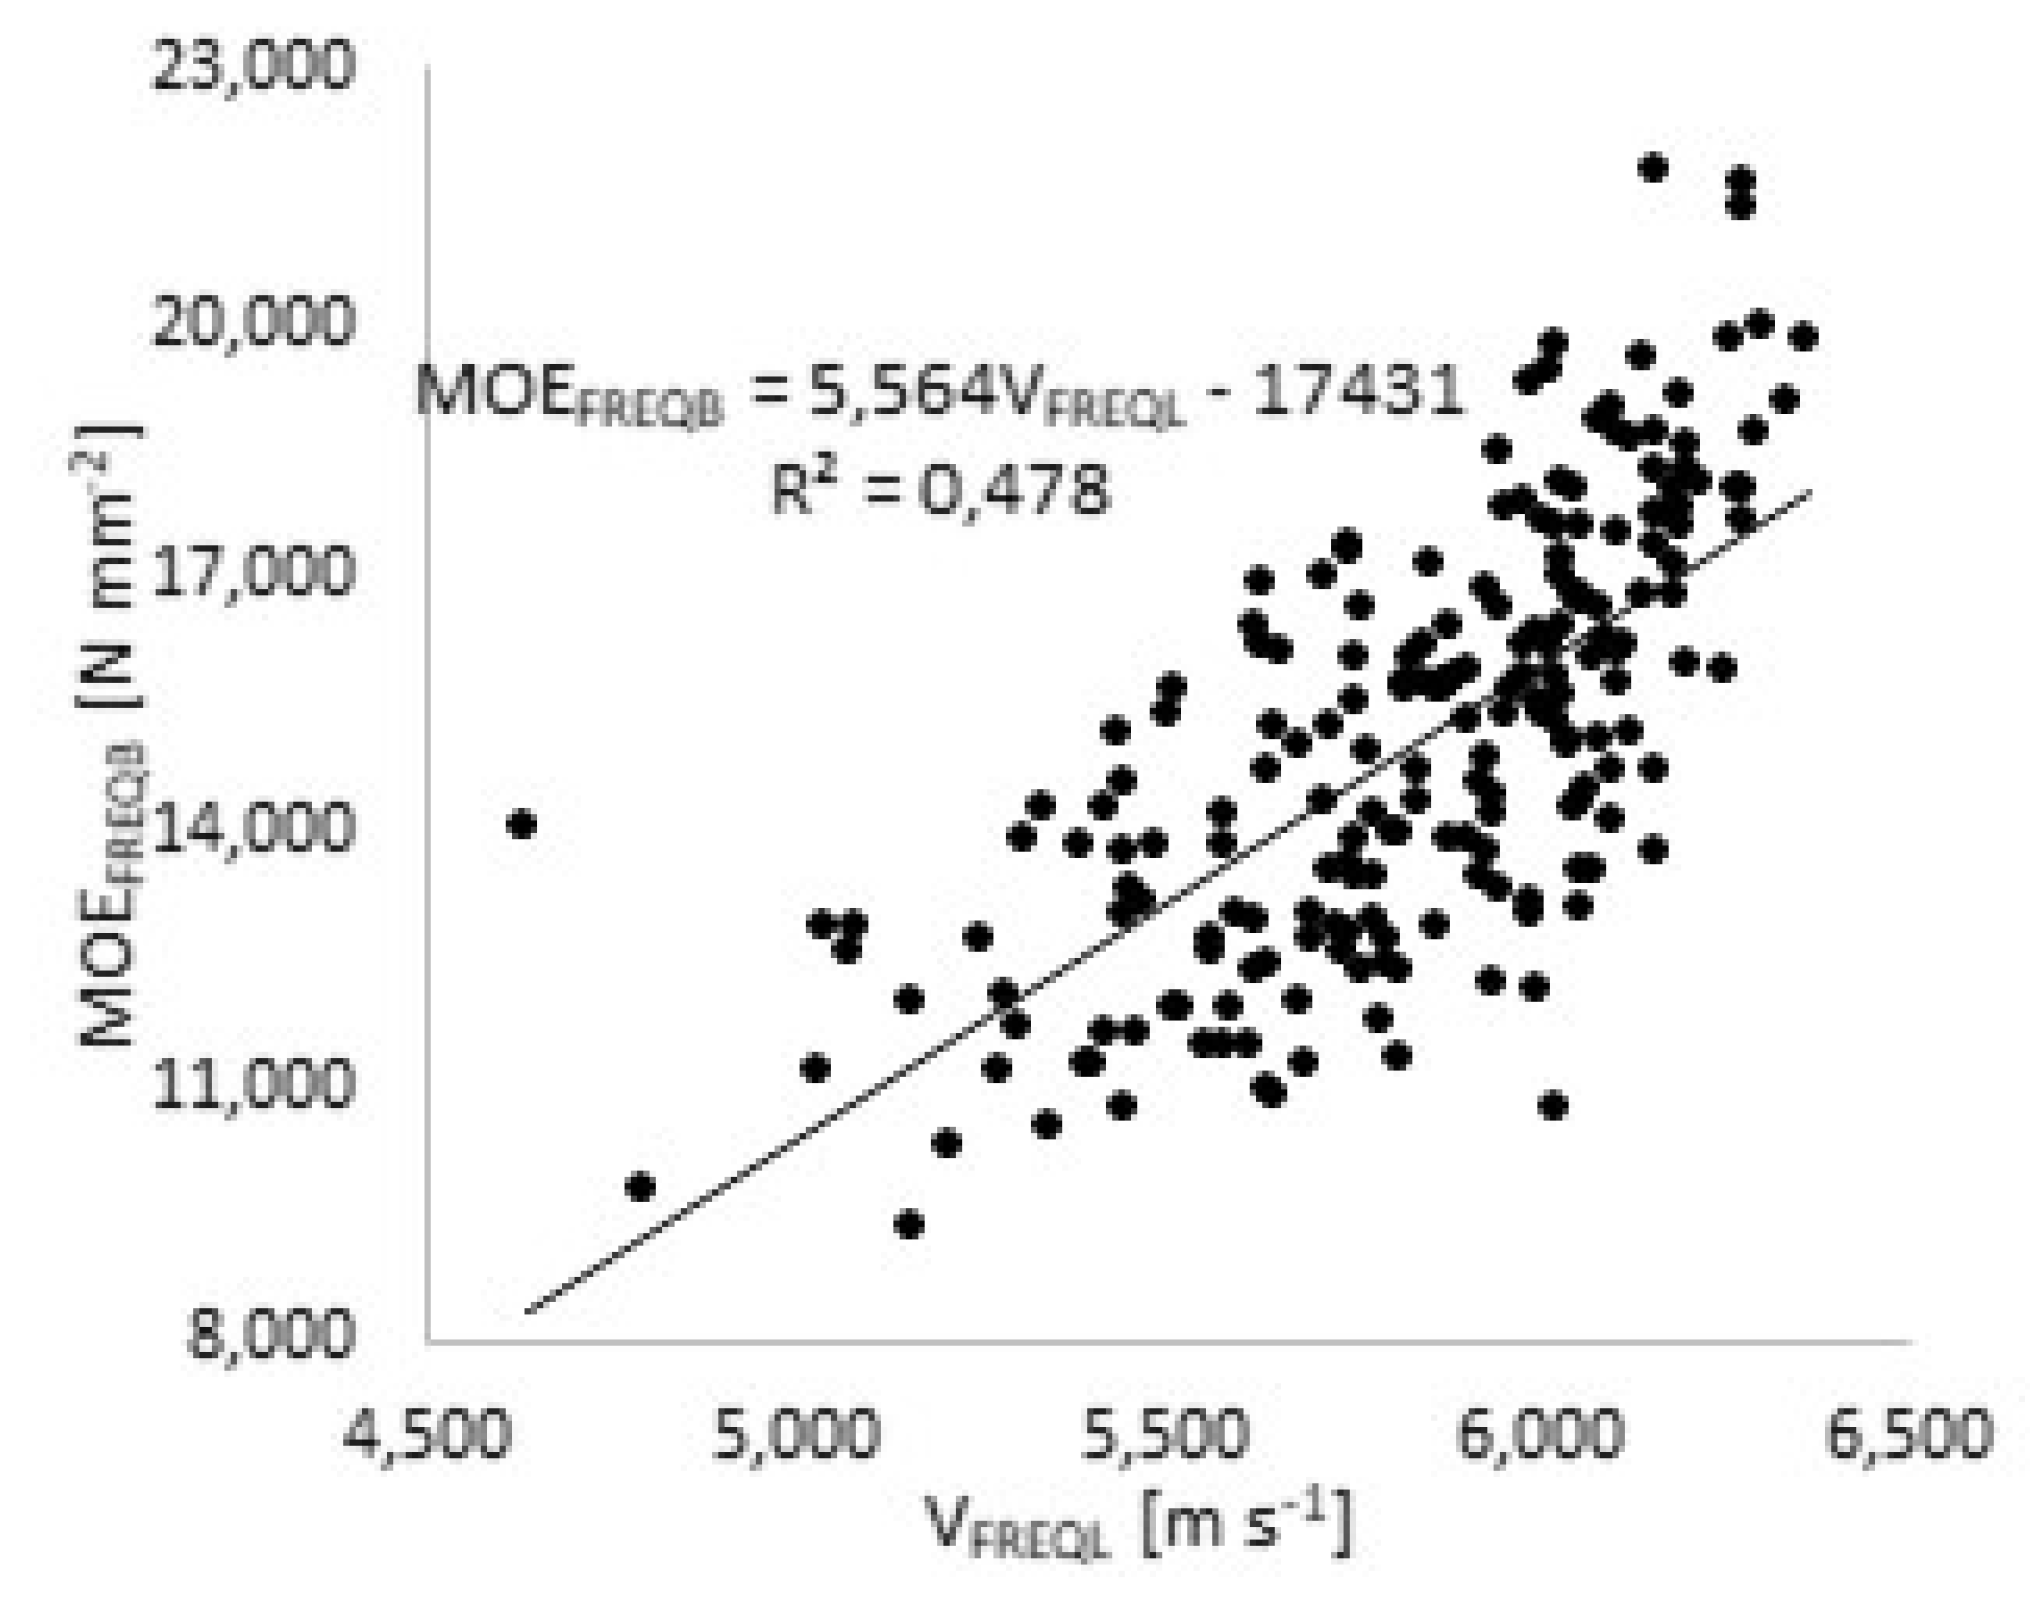
A higher correlation index (r) was found among the L velocities, obtained using both VUSL and VFREQL methods and in the dynamic Young’s modulus in bending, which produced values of r = 0.668 and r = 0.692, respectively. Because of the high r value, a linear correlation of MOEFREQB was made according to the velocity of the frequency method (Figure 5). In the case of Norway spruce designated for piano soundboard, the dynamic MOE in bending can be calculated by the use of the L velocity (VL). The result is explained through velocity as a factor for dynamic Young’s modulus calculation in the L direction (MOEL). As the L modulus of elasticity is crucial for the behavior in bending, a strong correlation between VFREQL and MOEFREQB was expected.
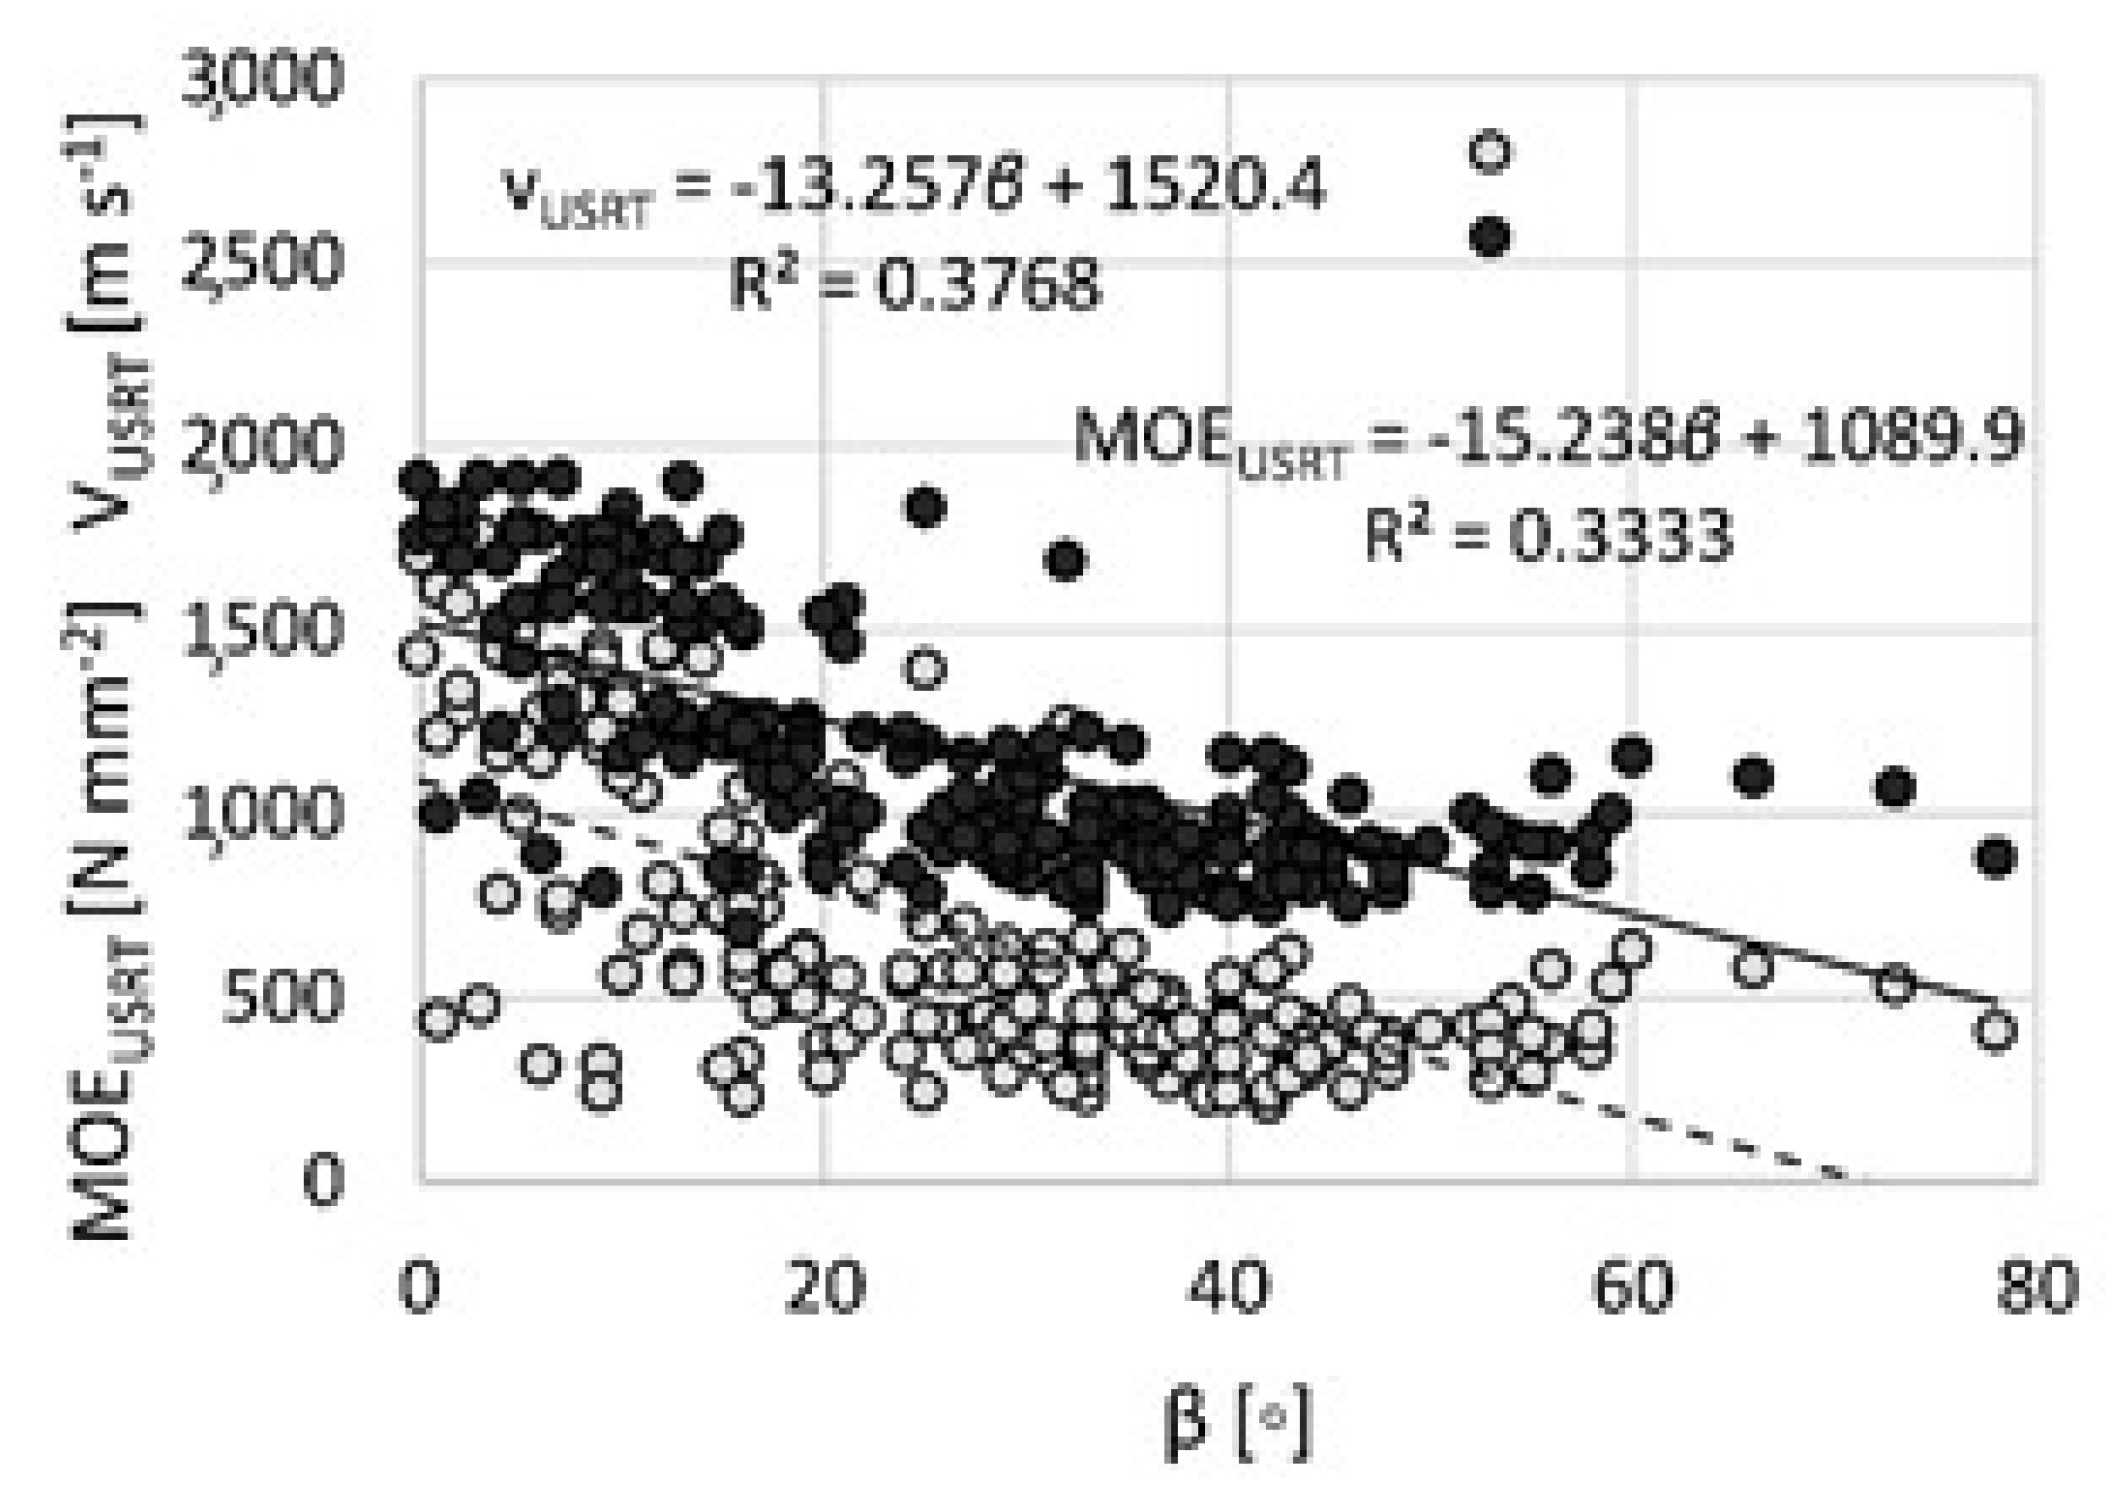
The orientation of annual rings in the orthogonal section (β) had an inverse correlation with transversal velocity VusRT (r = –0.614) and the mechanical–acoustic properties. Figure 6 shows the inverse regression between β (x axis) and VUSRT and MOEUSRT (y axis). The figure provides further information by the coefficients of determination (R2), which were 0.3768 and 0.3333 for VUSRT and MOEUSRT, respectively.
One of the strongest coefficients of the matrix correlation analysis was found between density and the percentage component of latewood (r = 0.559). Thus, all directly density-dependent properties had a strong correlation with %LW. Hence, between the percentage component of latewood and R. Figure 7 depicts the linear regression between %LW (x axis) and the Rs (y axis). The R acquired with the frequency method (FREQ) in bending and in the L direction had higher correlation coefficient with %LW than the RUSL (L direction from ultrasonic direct transmission method). RFREQB had shown the highest r value.

3.4. Comparison of the Ultrasonic Direct Transmission and the Transitory Excitation methods

The relationship between the acoustic properties of the L direction obtained by both methods was analyzed for comparison. The analysis was based on the sign test (non-normal distribution of variables) or on the z-test (normal distribution of variables) to compare the velocities, dynamic Young’s moduli, Rs, and impedances Zs. Figure 8 presents the comparison of the methods, including the acoustic properties R and Z.
The results of the elaborations show that all p values were over the alpha level (0.05); there were no significant differences between the direct transmission and the frequency method for L direction.

3.5. Comparison of Dynamic MOE in Longitudinal and Flexural Directions for the Resonance Method

Another analysis compared the dynamic properties of MOEFREQ and RFREQ in L and flexural directions. A t-test examination (due to the normal distribution of samples) was carried out. The results showed a significant difference between the bending and the L directions, with p < 0.05. The results of this analysis lead to a preference of calculating MOE and R in the bending direction as the MOEFREQ and RFREQ are closer to the literature data regarding the soundboards of pianos [14].

3.6. Comparison of Longitudinal and Transversal Acoustic Properties

The relationship between VUSL and VUSRT was examined. To understand if there was a statistical difference between the two tested directions (L and transversal), a sign test was executed (non-normal distribution). When the p value was less than 0.05, there was a significant difference. The same examination was carried out on the other acoustic factors (dynamic MOE, R, and Z); longitudinal and transversal directions produced significant differences (p < 0.05) between the acoustic properties. The significance difference between L and RT directions of the acoustic properties were caused by the strong reductions of these properties in the RT directions. The properties in L direction were greater because of the natural L orientation of mostly all the wood elements, which gives continuity.

3.7. Analysis of Variance of Selected Factors

A division of the sample’s population into three subpopulations was made. The division was computed according to several different factors (structural and physical).
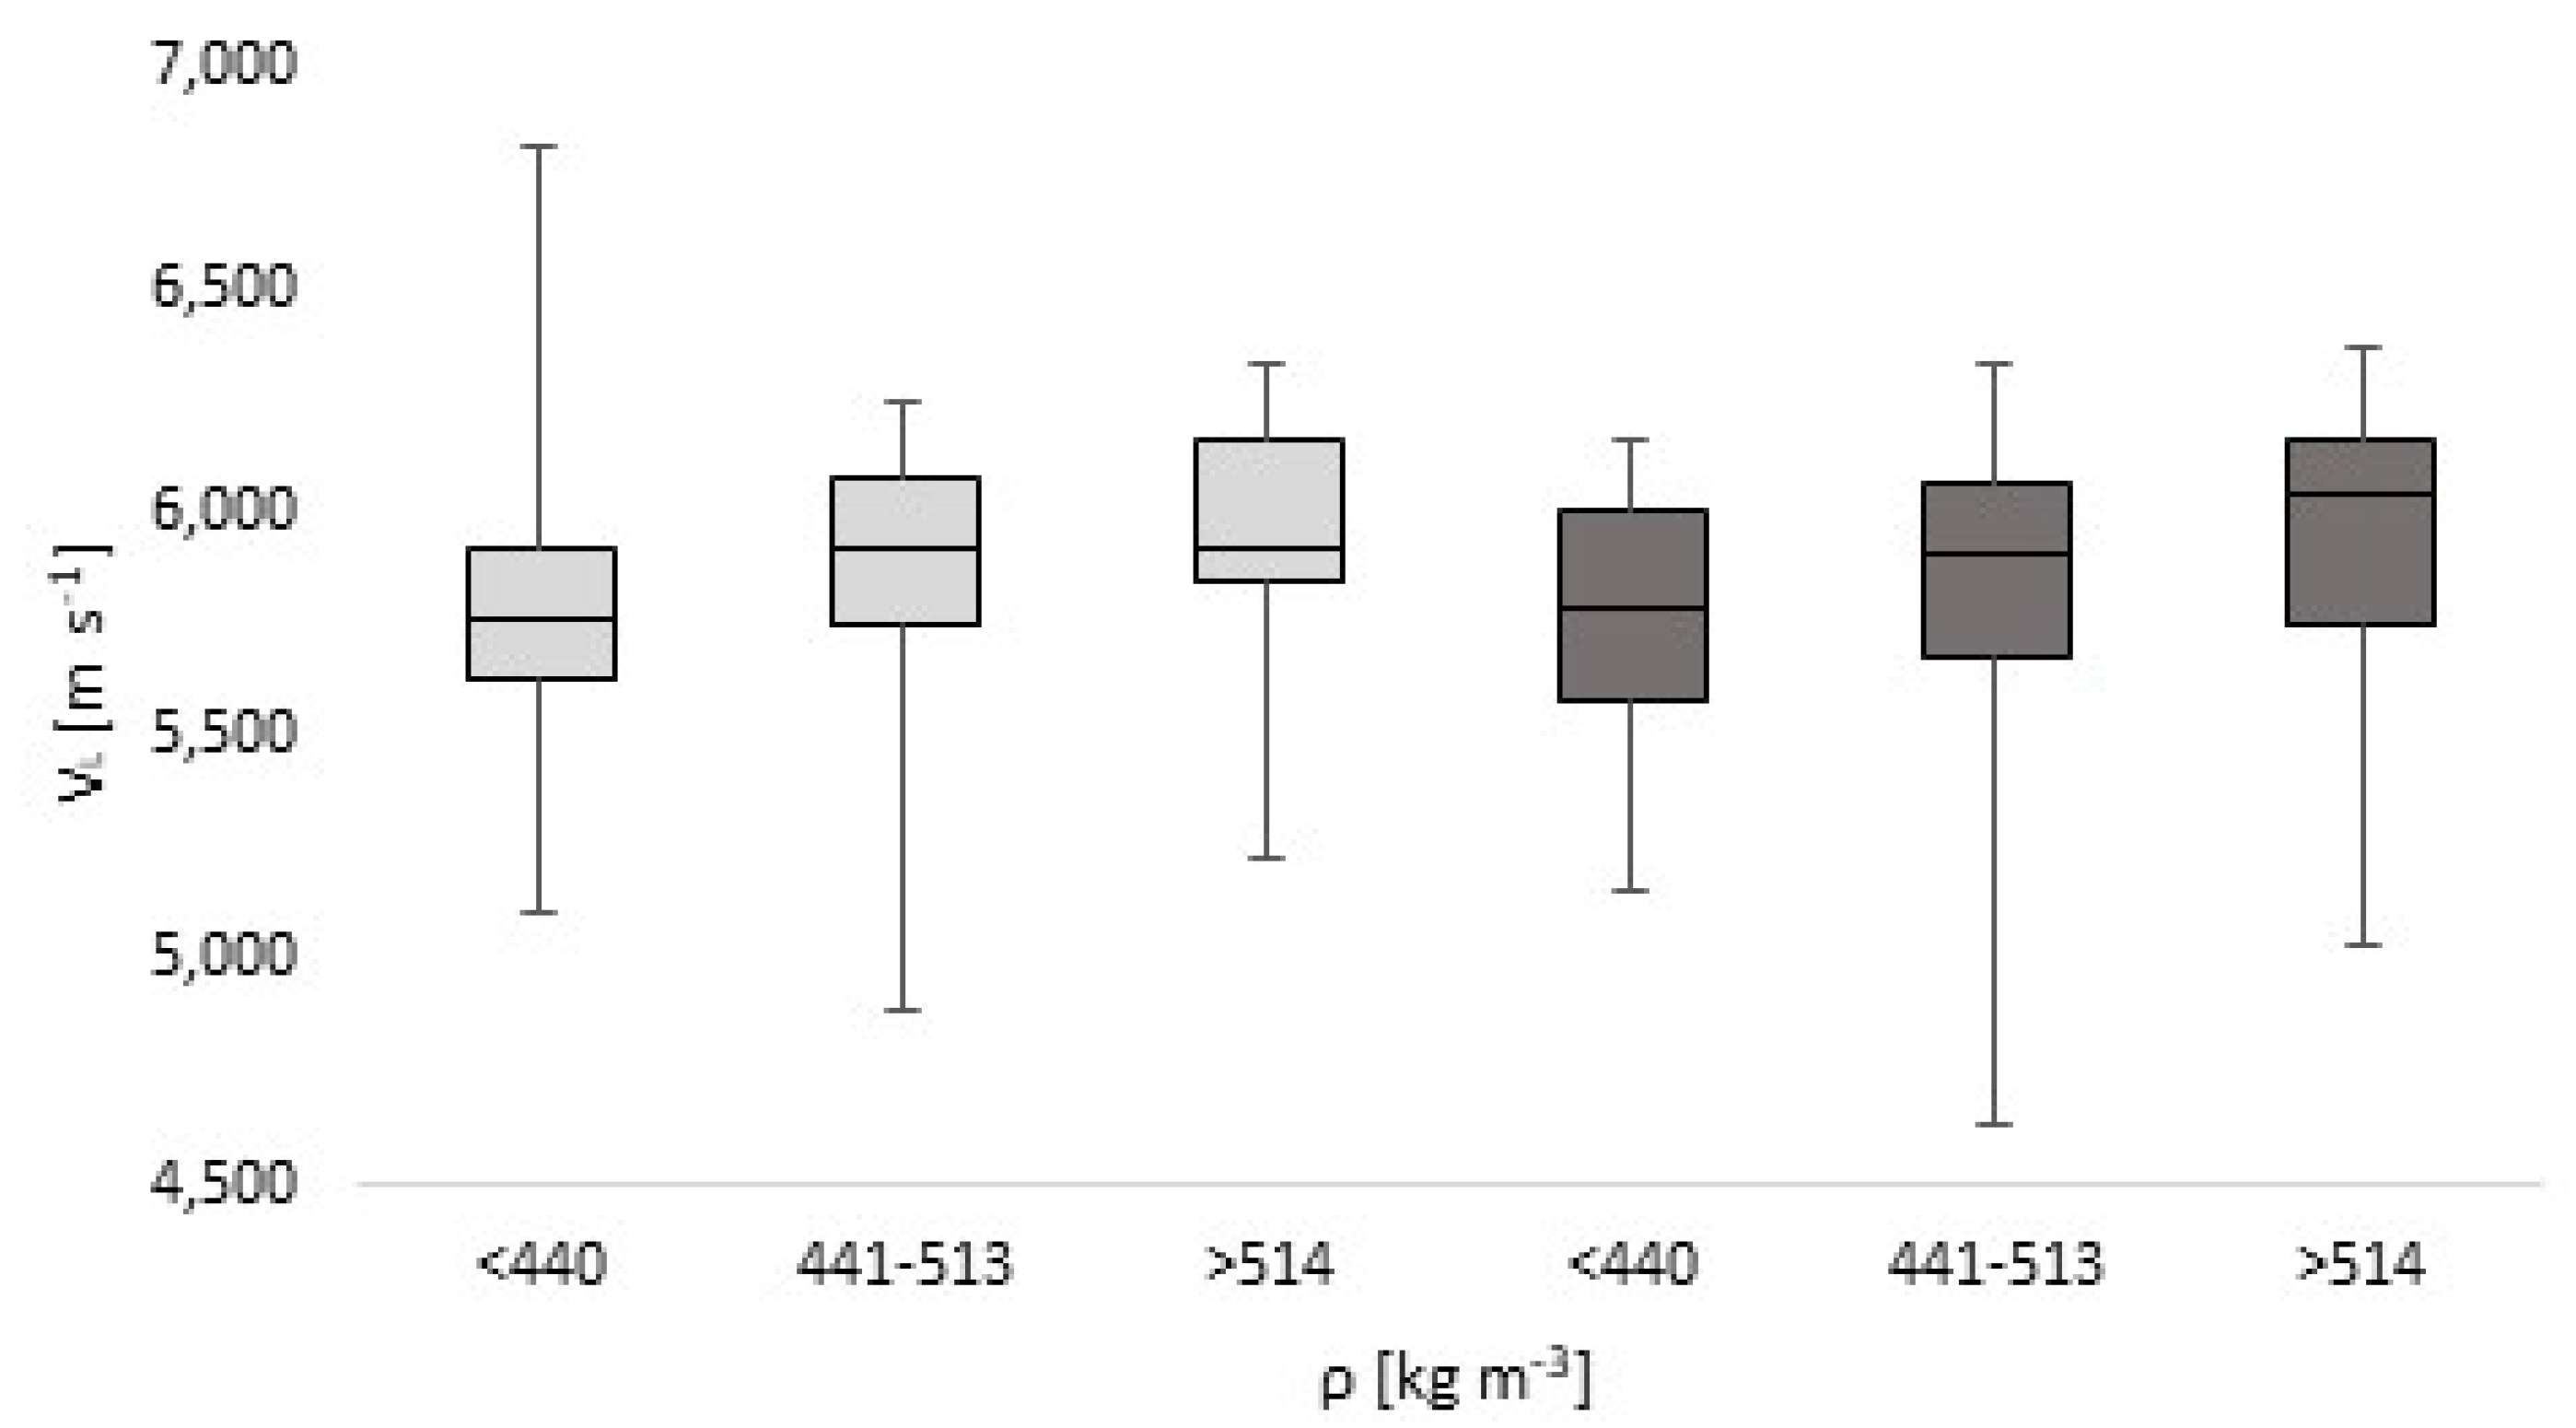
Angle α (slope of grain) was the first regrouping element. The α ranges were 0° to 0.5°, 0.6° to 1°, and over 1°. The tendency of the L velocities to change according to α was observed. Multiple comparisons were made by Kruskal Wallis Anova (non-normal distribution of subpopulations). Significant differences among the groups were identified between the first and the third group and between the second and third group. The second element used to regroup the subpopulation was the β angle (cross orthogonal section). The β ranges were 0° to 15°, 16° to 30°, and over 30°. The VRTUS was then analyzed according to β. Significant differences among all groups were seen. Furthermore, the density, ρ, was another regrouping element, between ranges of less than 440 kg m−3, 441 to 513 kg m−3, and over 514 kg m−3. L velocities (calculated by both methods) showed the most interesting results related to ρ (Figure 9). Multiple comparisons showed significant differences between the second and third groups compared to the first one. Velocity reduction increased when the density was above 440 kg m−3.
Final analysis focused on the AWAR as a regrouping element with the following ranges: less than 1.80 cm; 1.80 to 2.80; over 2.81 cm. The density (ρ) was examined using an analysis of variance (normal distribution). As confirmed with the p value, there was consistent variation throughout all groups. ρ decreased with an increasing AWAR. This happened because in coniferous wood the portion of latewood is the same, and the thicker the ring, the more earlywood.

4. Conclusions

There were two hundred and two samples of Norway spruce studied in this research. The relationships of structural factors and acoustic properties were analyzed.
  • The FEM analysis results displayed the range for setting up the experimental analysis of frequency for the resonance method.
  • Important correlation coefficients between the latewood component and the density were obtained. Therefore, the %LW showed strong correlations with all density dependent properties and most of all with the acoustic radiation. The R in bending displayed the maximum correlation index (r) value among %LW and all Rs. Consequently, the equation to calculate RFREQB according to %LW for resonance spruce was defined: RFREQB = –0.1533%LW + 15.58.
  • A strong correlation was also attained between L velocities defined by both methods and MOEFREQB. Thus, MOE in bending could be estimated according to L velocity: VFREQL; the equation is MOEFREQB = 5.564 VFREQL –17431.
  • The comparison of the two methods in L direction showed no significant differences in acoustic properties. Both methods were suitable to estimating the VL, dynamic MOEL, RL, and ZL for resonance spruce for piano soundboard. A significant difference in L and bending directions was established. The dynamic Young’s modulus from L direction to bending had a reduction of 5%, and the R from L to bending had a reduction of 3%.
  • Differences between the L and the RT directions occurred. Therefore, VUSRT, RUSRT, and ZUSRT correspond to 1/5 of the equivalent properties of the L direction. The reduction was greater in the dynamic Young’s moduli, reaching a reduction of 96% from L to RT.
  • Kruskal Wallis Anova highlighted that more than 1° of slope of grain produced an important reduction in L velocities. The slope of grain would never be more than 1°.
  • Another Kruskal Wallis Anova defined the limit of rings’ angle in the cross section. Not to reduce the transversal velocity, the angle should be less than 15°.
  • Similar analysis, as mentioned above, was performed based on density. Generally, the higher the density, the greater increase in L velocity. The increase lessened when ρwas > 440 kg m−3.
  • The average width of the growing rings should be less than 2.80 cm to maintain density and all density dependent properties constant.

Author Contributions

Measuring acoustic data, analyzing data, and writing the manuscript: G.M.; leading, supervising, and writing the manuscript: J.T.; analyzing acoustic data: P.Z. All authors have read and agreed to the published version of the manuscript.

Funding

This research was funded by the Internal Grant Agency Fund of Mendel University in Brno. Grant number LDF_VP_2019012.

Institutional Review Board Statement

Not applicable.

Informed Consent Statement

Not applicable.

Data Availability Statement

The data are not publicly available due to privacy restrictions. The data presented in this study are available on request from the corresponding author.

Acknowledgments

The data were collected at the Research Center Josef Ressel in Brno-Útěchov, Mendel University in Brno. The research was supported by the Internal Grant Agency Fund of Mendel University in Brno, Faculty of Forestry and Wood Technology. Project No LDF_VP_2019012. Particular thanks go to the Petrof Ltd. company for dispending the material for the research.

Conflicts of Interest

The authors declare no conflict of interest.

References

  1. Giuliano Zugliani; Lisa Dotta Resonance wood. Technical features and ecological conditions. Sherwood 2009, 154, 7–13. [Google Scholar]
  2. Bucur, V. Aging, a modifying factor of resonance wood properties (in Rumanian). Ind. Lemn 1975, 26, 169–174. [Google Scholar]
  3. Bucur, V.; Feeney, F. Attenuation of ultrasound in silicone-oil-in-water emulsions. Ultrasonics 1992, 30, 76–81. [Google Scholar] [CrossRef]
  4. Ghelmezien, N.; Beldie, I. On the characteristics of resonance spruce wood. Bullettin Transilv. Univiversity Brasov 1970, 12, 315–326. [Google Scholar]
  5. Holz, D. Investigations on resonance wood. Communication: On the simultaneous determination of the dynamic modulus of elasticity and the damping of wooden bars in the audible frequency range. Holztechnologie 1967, 8, 221–224. [Google Scholar]
  6. Bucur, V. Acoustics of Wood, 2nd ed.; Timell, T.E., Wimmer, R., Eds.; Springer: Berlin/Heidelberg, Germany, 2006; ISBN 13 978-3-642-06555-2. [Google Scholar]
  7. Caniato, M. Caratterizzazione microstrutturale di legno per strumenti musicali-Microstructural characterization of wood for musical instruments. In Proceedings of the Italian Acoustic Association Congress, Firenze, Italy, 13–15 June 2014. [Google Scholar]
  8. Mania, P.; Fabisiak, E.; Skrodzka, E. Investigation of Modal Behaviour of Resonance Spruce Wood Samples (Picea abies L.). Arch. Acoust. 2017, 42, 23–28. [Google Scholar] [CrossRef] [Green Version]
  9. Buksnowitz, C.; Teischinger, A.; Müller, U.; Pahler, A.; Evans, R. Resonance wood [ Picea abies (L.) Karst.] – evaluation and prediction of violin makers’ quality-grading. J. Acoust. Soc. Am. 2007, 121, 2384–2395. [Google Scholar] [CrossRef] [PubMed]
  10. Gabriele Bonamini La ricerca sul legno di risonanza di Paneveggio-The research on Paneveggio’s resonance wood. In Proceedings of the Conference Proceeding The Resonance Wood of Paneveggio Forest, Trento, Italy, 10–11 September 1998; pp. 49–82.
  11. Krzysik, F. Untersuchungen uber den Einfluss der Rohdichte auf die Verwendungsmoglichkeit von Fichtenklangholz - Investigations on resonance wood. Communication: On the simultaneous determination of the dynamic modulus of elasticity and the damping of wooden bars in. Holz als Roh- und Werkst. 1967, 25, 37. [Google Scholar]
  12. Tsoumis, G. Science and Technology of Wood, 1st ed.; Van Nostrand Reinold: New York, NY, USA, 1991; ISBN 0-412-07851-1. [Google Scholar]
  13. Barlow, C. Materials selection for musical instruments. Proc. Inst. Acoust. 1997, 19, 69–78. [Google Scholar]
  14. Wegst, U.G.K. WOOD FOR SOUND. Am. J. Bot. 2006, 93, 1439–1448. [Google Scholar] [CrossRef]
  15. Yoshikawa, S. Acoustical classification of woods for string instruments. J. Acoust. Soc. Am. 2007, 122, 568–573. [Google Scholar] [CrossRef] [PubMed]
  16. Sedik, Y.; Hamdan, S.; Jusoh, I.; Hasan, M. Acoustic properties of selected tropical wood species. J. Nondestruct. Eval. 2010, 29, 38–42. [Google Scholar] [CrossRef]
  17. Roohnia, M.; Hossein, M.A.; Alavi-Tabar, S.E.; Tajdini, A.; Jahan-Latibari, A.; Manouchehri, N. Acoustic properties in arizona cypress logs: A tool to select wood for sounding board. BioResources 2011, 6, 386–399. [Google Scholar] [CrossRef]
  18. Roohnia, M.; Tajdini, A.; Manouchehri, N. Assessing wood in sounding boards considering the ratio of acoustical anisotropy. NDT E Int. 2011, 44, 13–20. [Google Scholar] [CrossRef]
  19. Brémaud, I.; El Kaïm, Y.; Guibal, D.; Minato, K.; Thibaut, B.; Gril, J. Characterisation and categorisation of the diversity in viscoelastic vibrational properties between 98 wood types. Ann. For. Sci. 2012, 69, 373–386. [Google Scholar] [CrossRef]
  20. Baar, J.; Tippner, J.; Gryc, V. Wood anatomy and acoustic properties of selected tropical hardwoods. IAWA J. 2016, 37, 69–83. [Google Scholar] [CrossRef]
  21. Ross, R.J.; Brashaw, B.K.; Pellerin, R.F. Nondestructive evaluation of wood. For. Prod. J. 1998, 48, 14–19. [Google Scholar]
  22. Ilic, J. Variation of the dynamic elastic modulus and wave velocity in the fibre direction with other properties during the drying of Eucalyptus regnans F. Muell. Wood Sci. Technol. 2001, 35, 157–166. [Google Scholar] [CrossRef]
  23. Hassan, K.T.S.; Horáček, P.; Tippnera, J. Evaluation of stiffness and strength of scots pine wood using resonance frequency and ultrasonic techniques. BioResources 2013, 8, 1634–1645. [Google Scholar] [CrossRef] [Green Version]
  24. Kasal, B.; Anthony, R.W. Advances inin situ evaluation of timber structures. Prog. Struct. Eng. Mater. 2004, 6, 94–103. [Google Scholar] [CrossRef]
  25. Horáček, P.; Tippner, J. Nondestructive Evaluation of Static Bending Properties of Scots Pine Wood Using Stress Wave Technique. Wood Res. 2012, 57, 359–366. [Google Scholar]
  26. Jung, J. Stress-Wave Grading Techniques on Veneer Sheets. USDA For. Serv. Gen. Tech. Rep. FPL (Forest Prod. Lab.) 1979. [Google Scholar]
  27. SMULSKI, S. Relationship of stress wave- and static bending-determined properties of four northeastern hardwoods. Wood Fiber Sci. 1991, 23, 44–57. [Google Scholar]
  28. Tippner, J.; Gryc, V.; Baar, J. Application of microwave treatment for the plasticisation of beech wood (Fagus sylvatica L.) and its densification for flooring system purposes. Wood Sci. Technol. 2016, 48, 1–14. [Google Scholar] [CrossRef]
  29. Giordano, G. Tecnologia del Legno- Wood Technology, 3rd ed.; UTET: Torino, Italy, 1981; ISBN 8802036233. [Google Scholar]
  30. Haines, D.; Leban, J.-M.; Herbe, C. Determination of Young’s modulus for spruce, fir and isotropic materials by the resonance flexure method with comparisons to static flexure and other dynamic methods. Wood Sci. Technol. 1996, 30, 253–263. [Google Scholar] [CrossRef]
  31. Haines, D.W.; Leban, J.M. Evaluation of the MOE of Norway spruce by the resonance flexure method. For. Prod. J. 1997, 47, 91–93. [Google Scholar]
  32. Hearmon, R.F.S. Elasticity of Wood and Plywood. Nature 1948, 162, 826. [Google Scholar] [CrossRef]
  33. Fletcher, N.H.; Rossing, T.D. The Physics of Musical Instruments, 2nd ed.; Springer Science+ Business: New York, NY, USA, 1998; ISBN 978-1-4419-3120-7. [Google Scholar]
  34. Abdolahian Sohi, A.M.; Khademi-Eslam, H.; Hemmasi, A.H.; Roohnia, M.; Talaiepour, M. Nondestructive detection of the effect of drilling on acoustic performance of wood. BioResources 2011, 6, 2632–2646. [Google Scholar]
  35. Barducci, I.; Pasqualini, G. Misura dell’attrito interno e delle costanti elastiche del legno- Measurement of internal friction and elastic constants of wood. Nuovo Cim. 1948, 5, 416–446. [Google Scholar] [CrossRef]
  36. Haines, D.W. On musical instrument wood. Catgut Acoust. Soc. Newsl. 1979, 31, 23–32. [Google Scholar]
  37. Bucur, V. Handbook of Materials for String Musical Instruments; Springer: Berlin/Heidelberg, Germany, 2016; ISBN 9783319320786. [Google Scholar]
  38. Brémaud, I. Diversity of Woods Used or Usable in Musical Instruments Making; University of Montpellier II: Montpellier, France, 2006. [Google Scholar]
  39. Benade, A.H. Fundamentals of musical acoustics, 2nd ed.; Dover Publications Inc.: New York, NY, USA, 1990; ISBN 0486670473. [Google Scholar]
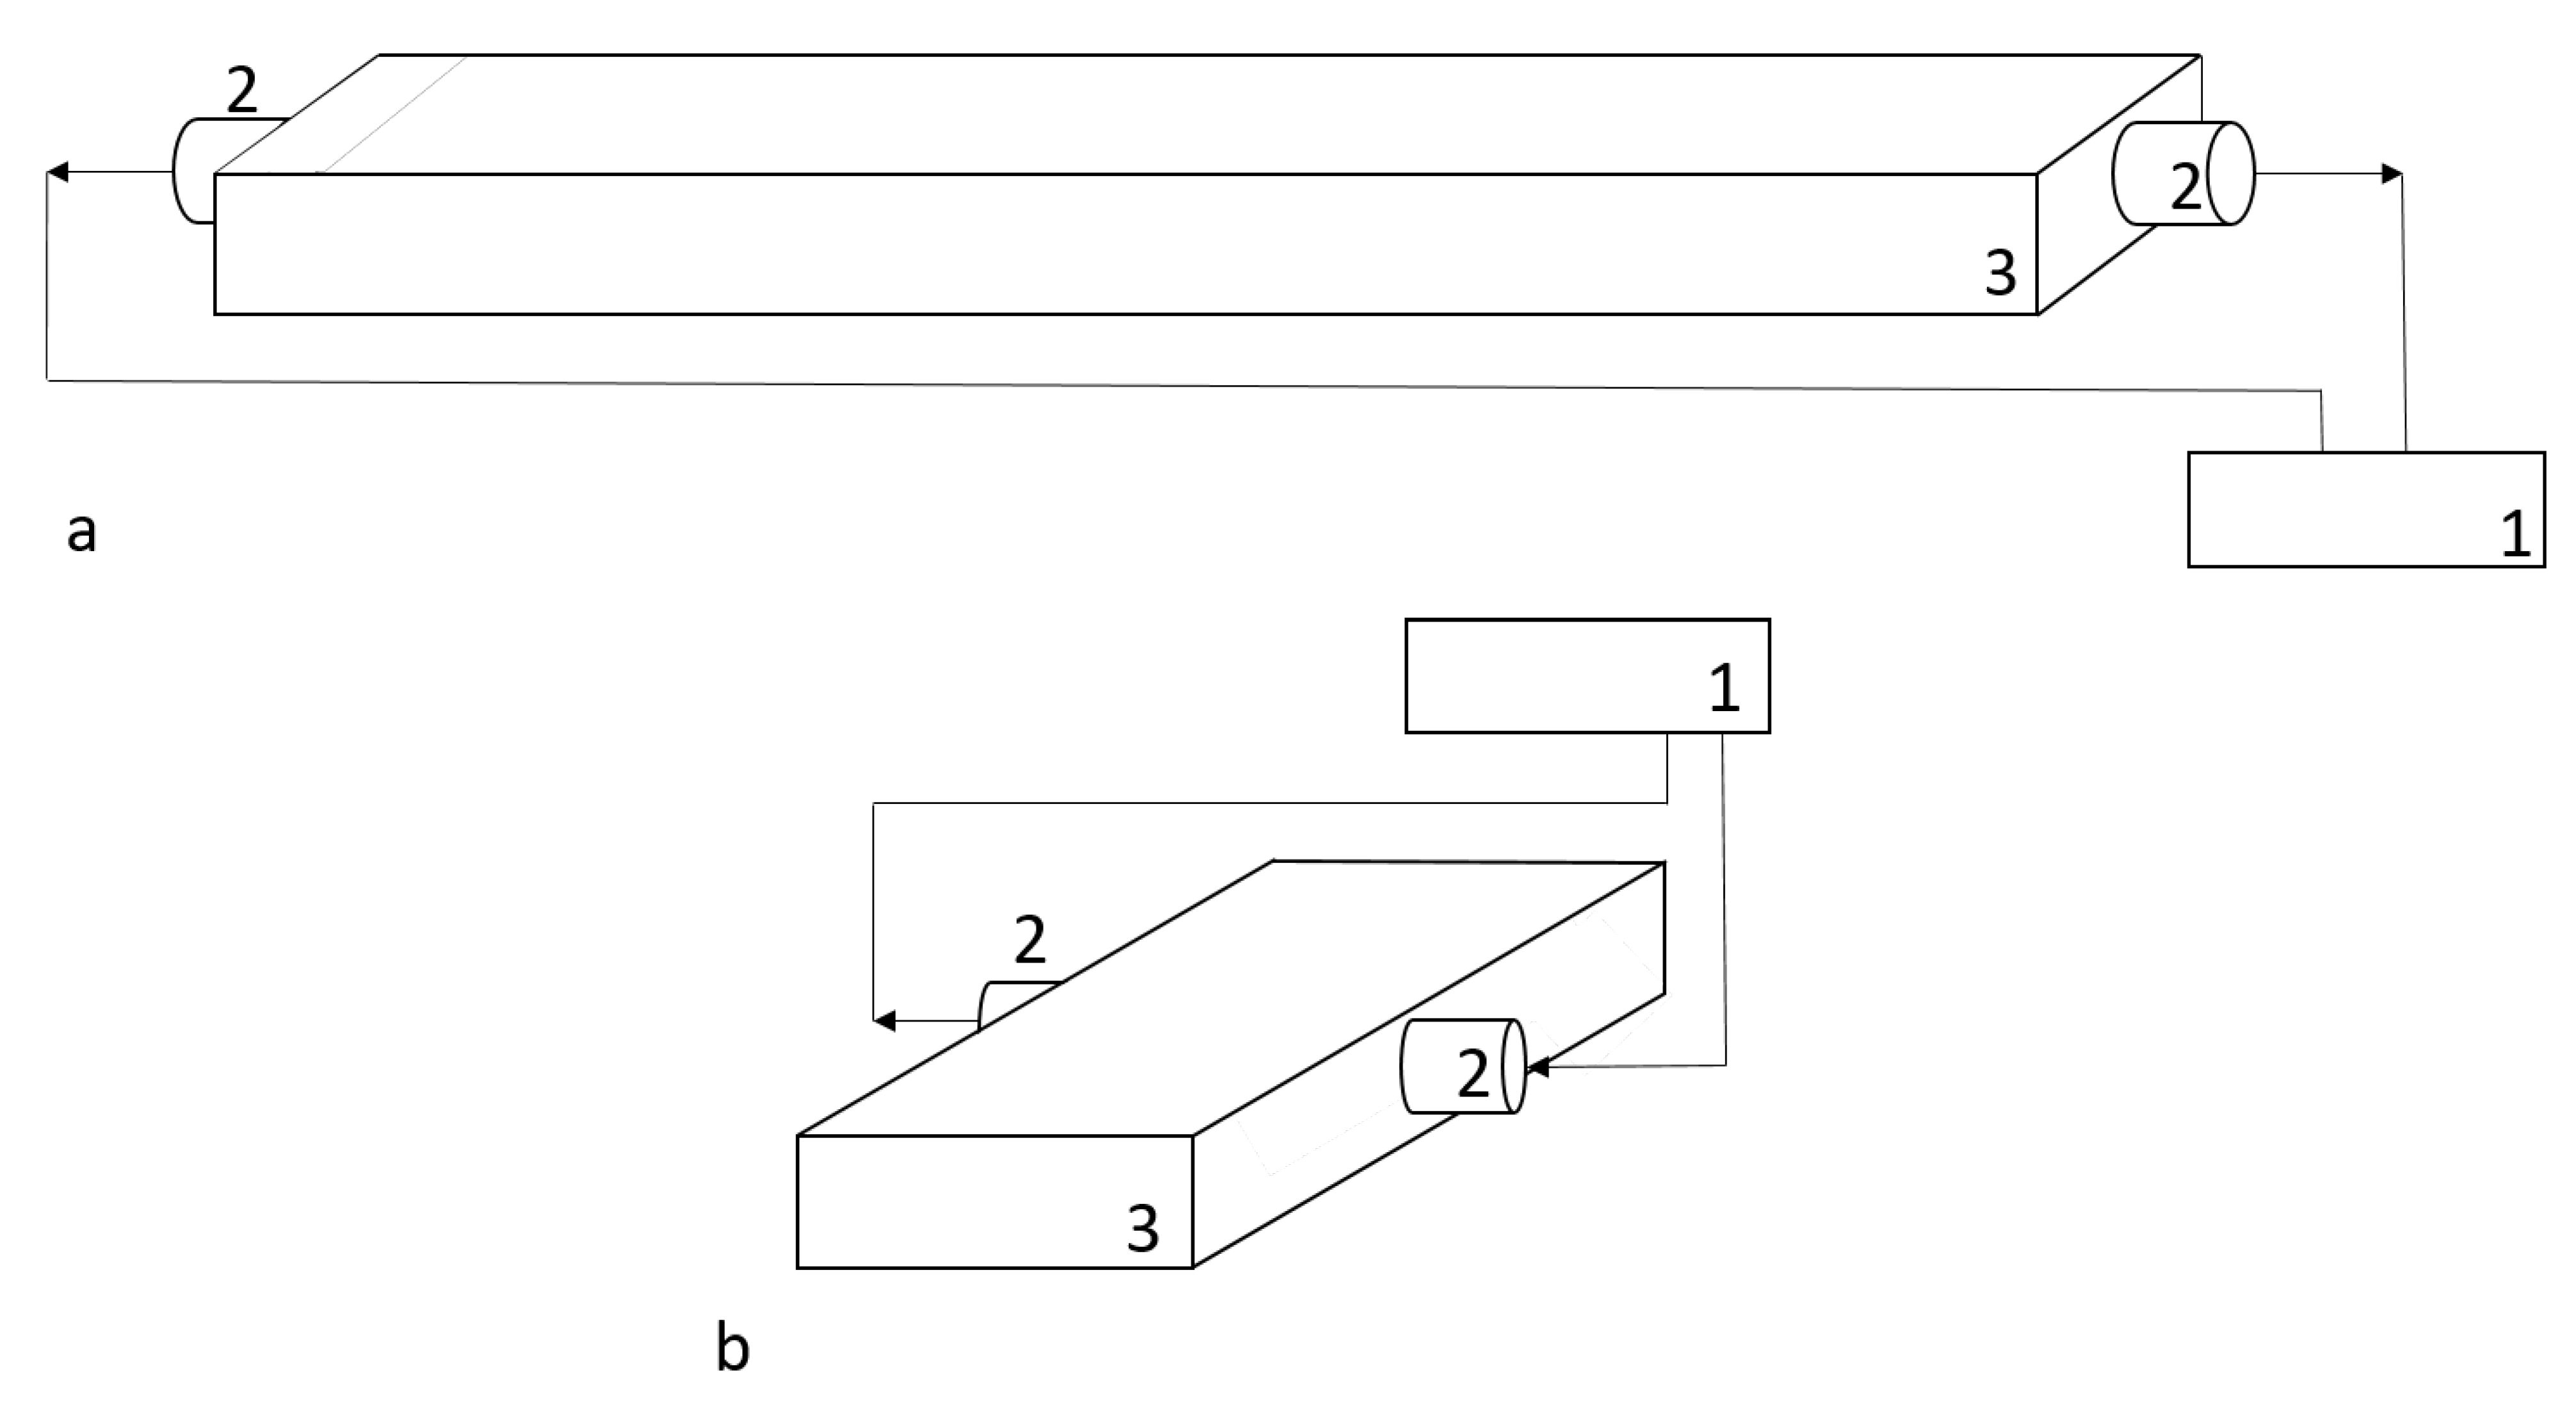
Figure 1. Direct transmission method in the L direction (a) and the radial–tangential (RT) direction (b). 1: FAKOPP device, 2: piezoelectric transducers, frequency: 45 kHz, 3: specimen.
Applsci 11 01749 g001
Figure 2. The two images on the top (from left to right) demonstrate the first bending mode shape and the torsional mode with corresponding frequencies at different values of density. The two images on the bottom demonstrate the second bending and the L modes.
Applsci 11 01749 g002
Figure 3. Longitudinal vibration mode (a) 1: wood hammer, 2: microphone, 3: FireWire audio capture, 4: digital oscilloscope, and 5: specimen. A = antinode and N = node. Picture of the transitory excitation method in L (b).
Applsci 11 01749 g003
Figure 4. Flexural vibration mode (a) 1: resin hammer, 2: microphone, 3: FireWire audio capture, 4: digital oscilloscope, 5: specimen, and 6: foam rubber. A = antinode and N = node. Picture of the measurement set (b).
Applsci 11 01749 g004
Figure 5. Linear regression of MOEFREQB according to VFREQL.
Applsci 11 01749 g005
Figure 6. Linear regression of ● VUSRT and ○ MOEUSRT (y-axis) according to β (x-axis); — = VUSRT trendline and – – = MOEUSRT trendline.
Applsci 11 01749 g006
Figure 7. Acoustic constant according to %LW: ● RUSL (— = trendline), ○ RFREQL(– – = trendline), and □ RFREQB (··· = trendline).
Applsci 11 01749 g007
Figure 8. Comparison of the L acoustic radiation in US and FREQ methods (a) and comparison of the L impedance in US and FREQ methods (b). The box plots focus on the minimum, first quartile, median, third quartile, and maximum values (from the lowest).
Applsci 11 01749 g008
Figure 9. VUSL (direct transmission) □ and VFREQL (frequency method) (y axis) according to density ρ (x axis).
Applsci 11 01749 g009
Table 1. Data of main parameters showing the average, standard deviation, and coefficient of variation (CV). The moisture content is 7%, as provided by the Petrof Ltd. company. ρ = density, AWAR = average widths of annual ring, %LW = percentage latewood component, α angle = slope of grain, and β angle = the orientation of the annual rings in the orthogonal section.
ParameterMeanst. dev.CV(%)
Macrostructure Parametersρ (kg m−3)4634810
AWAR (mm)2.160.6329
%LW (%)20.965.1925
α (°)0.850.93110
β(°)26.8216.2461
Table 2. Data of acoustic parameters showing the average, standard deviation, and coefficient of variation (CV). The moisture content is 7%, as provided by the Petrof Ltd. company. v, MOE, Z, and R are, respectively, velocity, dynamic Young’s modulus, impedance, and acoustic constant. Subscript US = ultrasonic method, and FREQ = frequency method. L, RT, and B = longitudinal, radial–tangential, and bending directions, respectively.
Method: USRange of ValuesMethod: FREQRange of Values
VL (m s−1)4891.306818.18VL (m s−1)4635.006367.50
MOEL (GPa)9865.5322,369.25MOEL (GPa)9854.5322,607.64
ZL (MPa s m−1)1.933.63ZL (MPa s m−1)1.953.63
RL (m4 kg−1 s−1)9.8217.77RL (m4 kg−1 s−1)9.3415.77
Table 3. A summary of the acoustic properties calculated in the L direction using both the ultrasonic method (US) and the frequency method (FREQ).
ParameterMeanst. dev.CV(%)
Acoustic ParametersVUSL (m s−1)58432785
MOEUSL (GPa)15901251816
ZUSL (MPa s m−1)2.710.3413
RUSL (m4 kg−1 s−1)12.721.2810
VUSRT (m s−1)116535130
MOEUSRT (GPa)68142963
ZUSRT (MPa s m−1)0.540.1631
RUSRT (m4 kg−1 s−1)2.550.8433
VFREQL (m s−1)58333135
MOEFREQL (GPa)15857264117
ZFREQL (MPa s m−1)2.710.3513
RFREQL (m4 kg−1 s−1)12.701.3110
MOEFREQB (GPa)15040251217
RFREQB (m4 kg−1 s−1)12.371.2310
Publisher’s Note: MDPI stays neutral with regard to jurisdictional claims in published maps and institutional affiliations.