Article

Pulse Peak Delay-Total Focusing Method for Ultrasonic Tomography on Concrete Structure

Korea Institute of Civil Engineering and Building Technology, Goyang, Gyeonggi 10223, Korea
*
Author to whom correspondence should be addressed.
Appl. Sci. 2021, 11(4), 1741; https://doi.org/10.3390/app11041741
Submission received: 4 January 2021 / Revised: 8 February 2021 / Accepted: 12 February 2021 / Published: 16 February 2021
(This article belongs to the Section Civil Engineering)

Abstract

:
An ultrasonic array device like the A1040 MIRA is used to non-destructively visualize the inside of concrete structures. A data set acquired by the ultrasonic array device is so unfocused that an image reconstruction algorithm is required to transform the data set into an understandable image. The image reconstruction algorithm like total focusing method exploits the time-of-flight of an ultrasonic pulse when focusing the image. While a high frequency ultrasonic pulse barely affects the accuracy of results, a low frequency ultrasonic pulse with a long wavelength causes an overall sagging of the resulting image around half wavelength of the pulse, which results in a poor quality of results. In this research, a modified total focusing method called pulse peak delay-total focusing method is proposed to calibrate the sagging in the resulting images due to the long wavelength of the pulse. The simulation of an ultrasonic array signal is implemented to validate the proposed method. The experimental results are compared with the simulation results to validate the proposed method. The simulation using the proposed method shows good agreement with experimental results. Analysis of results using potential damage curve and array performance indicator shows that the proposed method allows the higher accuracy, as well as the increased resolution of resulting images.

1. Introduction

After the rapid rise in the construction of concrete infrastructures in the past, there is now a huge number of old infrastructures that necessitate tremendous budget for their maintenance [1,2]. Accordingly, the cost to improve old infrastructures increased from 1.3 trillion dollars in 2001 to 4.6 trillion dollars in 2017 in the United States [3]. In order to use this budget efficiently, preemptive maintenance based upon precise status is essential.
Ultrasonic tomography technique is a popular non-destructive evaluation method to illustrate the inside of concrete structures. One of the ultrasonic tomography techniques is the through-transmission method that measures the time-of-flight or signal attenuation coefficient to depict the internal profile of concrete structures [4,5,6,7,8]. This method, however, requires to access the opposite surface, which is usually impossible for concrete structure. Another ultrasonic tomography technique is the pulse-echo method that measures the reflected time-of-flight of ultrasonic pulse to describe the inside of concrete [9,10,11]. The ultrasonic array system A1040 MIRA is one of the pulse-echo tomography device that has been commonly used to evaluate concrete structures accurately. The MIRA collects ultrasonic signals along multiple paths to visualize the inside of concrete structures [12]. These collected ultrasonic signals are converted into an understandable image by using image reconstruction algorithms [13]. One popular image reconstruction algorithm is TFM (Total Focusing Method), based on the delay-and-sum method [14]. The delay-and-sum method sums up the delayed collected signals according to an appropriate spatial rule for each point on images [15].
The delayed time is calculated based on the spatial information of transducers and image pixels with a known wave speed and not ultrasonic pulse information [16]. A short ultrasonic pulse with a high frequency has a bare impact on resulting images due to its short pulse duration. However, the MIRA device targeting at concrete structures uses low-frequency ultrasonic pulse to avoid severe signal attenuation [17,18], which results in long pulse duration, as well as sagging images. Although the MIRA device can handle the frequency of the input electronic signal within a range to change the pulse duration, it is not of great effect on the pulse duration due to a fixed frequency bandwidth of the transducers constituting the MIRA device.
Cropping resulting images to make up for the sagging phenomenon does not realize the maximum performance of the TFM as the resulting images are still defocused by the long pulse duration. An image reconstruction algorithm embedded in the MIRA called SAFT-C calibrates this phenomenon by means of its own undisclosed way [19,20]. In this research, the PPD-TFM (Pulse Peak Delay—Total Focusing Method) is proposed to compensate the sagging phenomenon and maximize the performance of the algorithm. A bandwidth filter similar to the transducer in the MIRA is simulated to generate an ultrasonic pulse with a given electronic pulse. A calculated pulse peak delay from the simulated ultrasonic pulse is reflected to the image reconstruction algorithm. Ultrasonic array signals are simulated to validate the proposed method, and an experimental test on a concrete specimen is performed to test the proposed method, as well. The performance of the proposed method is compared with the TFM, as well as the SAFT-C, by means of the PDC (potential damage curve) and API (array performance indicator).

2. Pulse Peak Delay Calibration

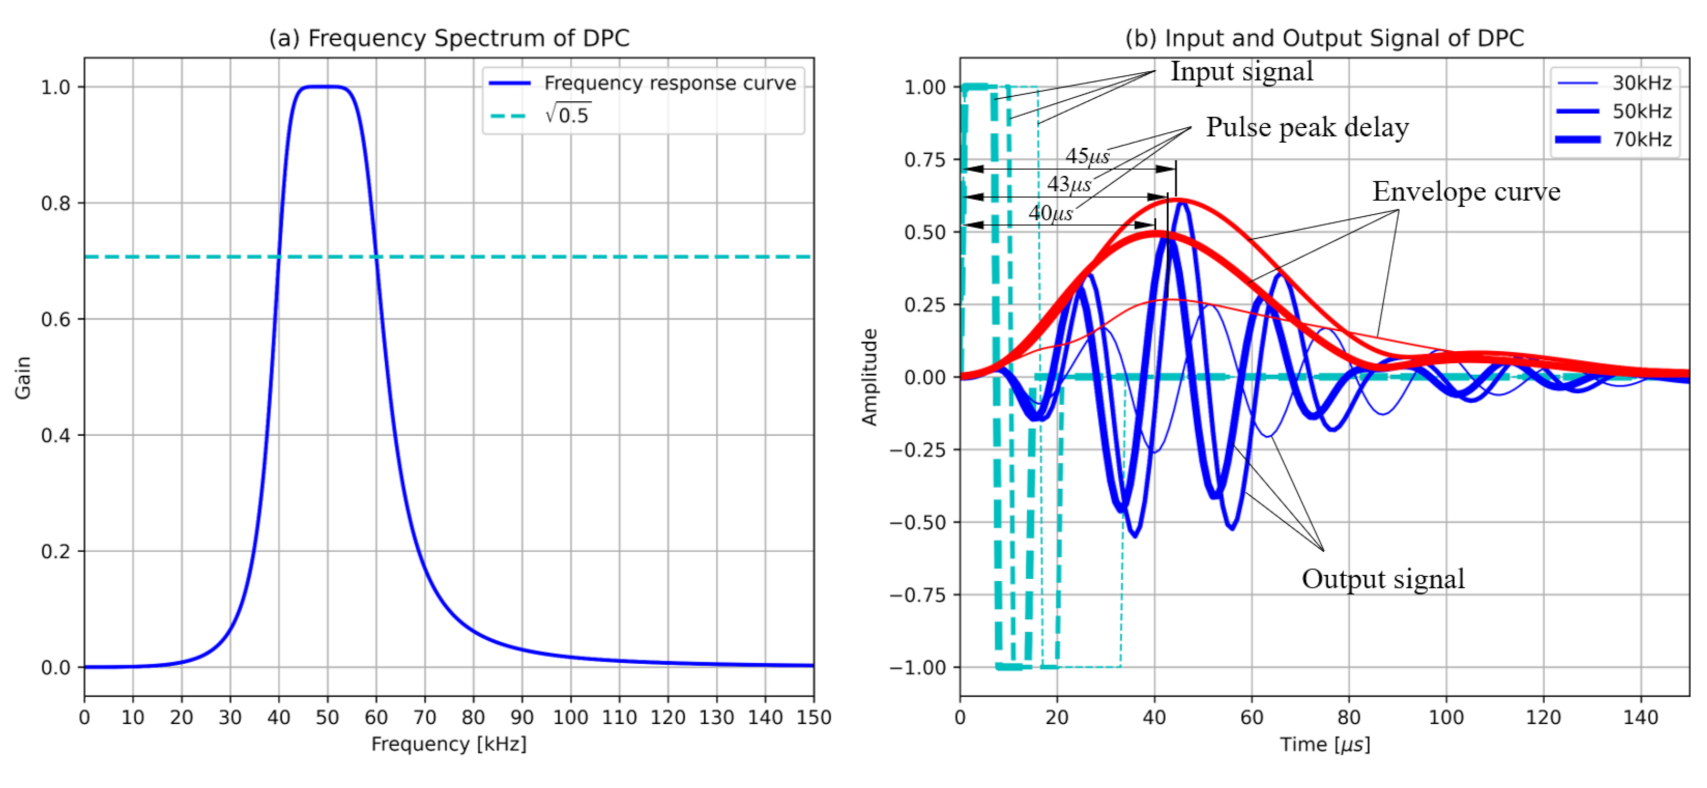
2.1. Pulse Peak Delay

The central frequency of an ultrasonic transducer is determined by the thickness of the active element constituting the ultrasonic transducer [21], and the backing material in the ultrasonic transducer determines the bandwidth [22]. Each transducer in the MIRA device is an ultrasonic shear wave DPC (Dry Point Contact) transducer that has a central frequency at 50 kHz and −3 dB frequency bandwidth of 20 kHz [23], as shown in Figure 1a. The ultrasonic pulses of the MIRA’s transducer were simulated by the estimated frequency response function, as shown in Figure 1b. Input signals with three different frequencies of 30, 50, and 70 kHz were fed to the estimated frequency response function. A square wave which is a form of the MIRA device’s input signal was used as an input signal in the pulse simulation.
The TFM algorithm does not consider the pulse duration when calculating the time-of-flight of the pulse. As a result, an intense reflection will be formed and shifted further against the ultrasonic array as much as about half the pulse duration in the TFM algorithm. The duration of the generated ultrasonic signal is about 5 times longer than the duration of the input signal, which results in more severe sagging phenomenon by the long pulse duration on resulting images. Therefore, the long pulse duration should be considered in the image reconstruction algorithm, TFM. As intense reflection on the resulting image is formed by summing peak amplitudes of signals, a pulse peak delay should be included in the term of the delayed time in the image reconstruction algorithm.
The PPD (Pulse Peak Delay) is the time interval between the beginning and the peak of the generated ultrasonic pulse. The measured PPDs are 43, 45, and 40 µs for the input frequency of 30, 50, and 70 kHz, respectively, as shown in Figure 1b. If the ultrasonic wave speed is assumed as 2300 m/s, the PPD distances of the generated ultrasonic pulse will be 98.9, 103.5, and 92 mm, respectively, for 30, 50, and 70 kHz of input frequencies. As the frequency response function of the transducer is a constant property, the generated ultrasonic pulse is rarely affected by the input frequency. In addition, the PPD is not proportional to the input frequency. Therefore, the PPD should be calculated by simulating the ultrasonic pulse with an estimated frequency response function of the transducer and input signal.

2.2. Pulse Peak Delay-Total Focusing Method

The visualization of the inside of a concrete structure requires a data set of signals from diverse wave paths, and the quality of the image increases as much as the diversity of the wave paths. The monostatic system, which was widely used in the past, shifts the location of a single transducer while transmitting and receiving an ultrasonic pulse simultaneously [24]. This method lacks diversity in the wave path and presents limitation in the quality of the resulting image. The ultrasonic array device A1040 MIRA used in this research is a bistatic system that measures wave signals from all possible wave paths except for the identical transducer pair [25], as shown in Figure 2a. The measuring method for the bistatic system is called full matrix capture (FMC) [26], and the measured signal data set is called full matrix data [27]. The MIRA device collects 66 time-domain signals with a single scan by using 12 sets of transducers.
The collected full matrix data is almost impossible to be understood intuitively and visually as it is defocused. Therefore, an image reconstruction algorithm is required to convert the full matrix data into a focused image. An image reconstruction algorithm used by the MIRA device is the SAFT-C algorithm of which detailed information is undisclosed. But, it has been known that this algorithm is a delay-and-sum method. One popular image reconstruction algorithm using the delay-and-sum method for the FMC is the TFM, and the proposed method PPD-TFM (pulse peak delay-TFM) modifies the TFM.
The array geometry in the wave field is described in Figure 2b. The TFM uses full matrix data as input data, and the input data e has a 3-dimensional form as described in Equation (1):
e ( t , x T , x R ) = f ( x , z ) δ ( t t d ) d x d z ,
where t is the time; x T and x R are the transmitter and the receiver, respectively; f is the unknown wave field; x and z are the horizontal and the vertical coordinates at each pixel, respectively; δ is the Dirac delta function; and t d is the delayed time, as follows.
t d = ( x x T ) 2 + z 2 + ( x x R ) 2 + z 2 c ,
where c is the wave speed.
The TFM estimates the unknown wave field by superposing the signals from all transducer pairs at the delayed time to synthesize a focus at every point in the grid. The estimated wave field f ^ is given by
f ^ ( x , z ) = x T = 1 N e 1 x R = x T + 1 N e e ( t d , x T , x R ) ,
where N e is the number of array elements.
The PPD-TFM has a procedure identical to the TFM except for the delayed time. The delayed time for the PPD-TFM, t d = t d + P P D , includes an additional term, the pulse peak delay, as shown in Figure 1b. This value is calculated by the simulated band-pass filter and the input signal. Although little is known regarding the SAFT-C algorithm, it is known that the SAFT-C algorithm crops a resulting image as much as a delay predetermined by the speed and the frequency of an ultrasonic pulse to compensate the sagging phenomenon by the PPD. While the SAFT-C algorithm provides enough accuracy with a simple method to interpret results, the result of the SAFT-C is not the most accurate result as much as the MIRA device can provide. The PPD-TFM algorithm considers all possible information to simulate the output signal and focuses images at the strongest point in the signal to increase the performance.

3. Simulation

In order to validate the influence of the PPD, an ultrasonic array signal was simulated by modifying the method by Reference [28]. It is assumed that the wave field is 2-dimensional and a downward elastic half-space, and the sections perpendicular to the out-of-plane axis are identical. To simplify the simulation in this research, the effects of beam pattern and power attenuation along the wave path are ignored. The array signal is simulated by using phase shifts applying to the ultrasonic pulse, p ( t ) , as shown in Figure 1b. The pulse spectrum, P ( ω ) , can be calculated by the Fourier transform of the pulse signal, as follows:
P ( ω ) = p ( t ) e i ω t d t ,
where ω is the angular frequency; and i is the imaginary unit.
The pulse spectrum, P ( ω ) , is then phase-shifted as much as the delayed time from the transmitter to reflector to receiver with the known wave speed.
E s , n ( ω , x T , x R ) = P ( ω ) e i ω d n / c ,
where E s , n is the phase-shifted pulse spectrum of n t h reflector ( x n , z n ) ; and d n is the travel distance from transmitter to n t h reflector to receiver, which is
d n = ( x n x T ) 2 + z n 2 + ( x n x R ) 2 + z n 2 .
The simulated array signal, e s , is then calculated by summing the inverse Fourier transform of the phase-shifted pulse spectrum.
e s ( t , x T , x R ) = 1 2 π n = 1 N D E s , n ( ω , x T , x R ) e i ω t d ω ,
where N D is the number of reflectors.
The simulation parameters are the same as the experimental parameters. The array system is placed at the top surface and has 12 transducers spaced by 30 mm, as shown in Figure 2a. The wave speed in the wave field is 2300 m/s, and the point damage is assumed at coordinates (12.5, 100) mm. The input electronic signal with frequency of 50 kHz is a 1-cycle square wave pulse and is fed to the simulated band-pass filter shown in Figure 1a. The generated signal is fed to both the TFM and the PPD-TFM.

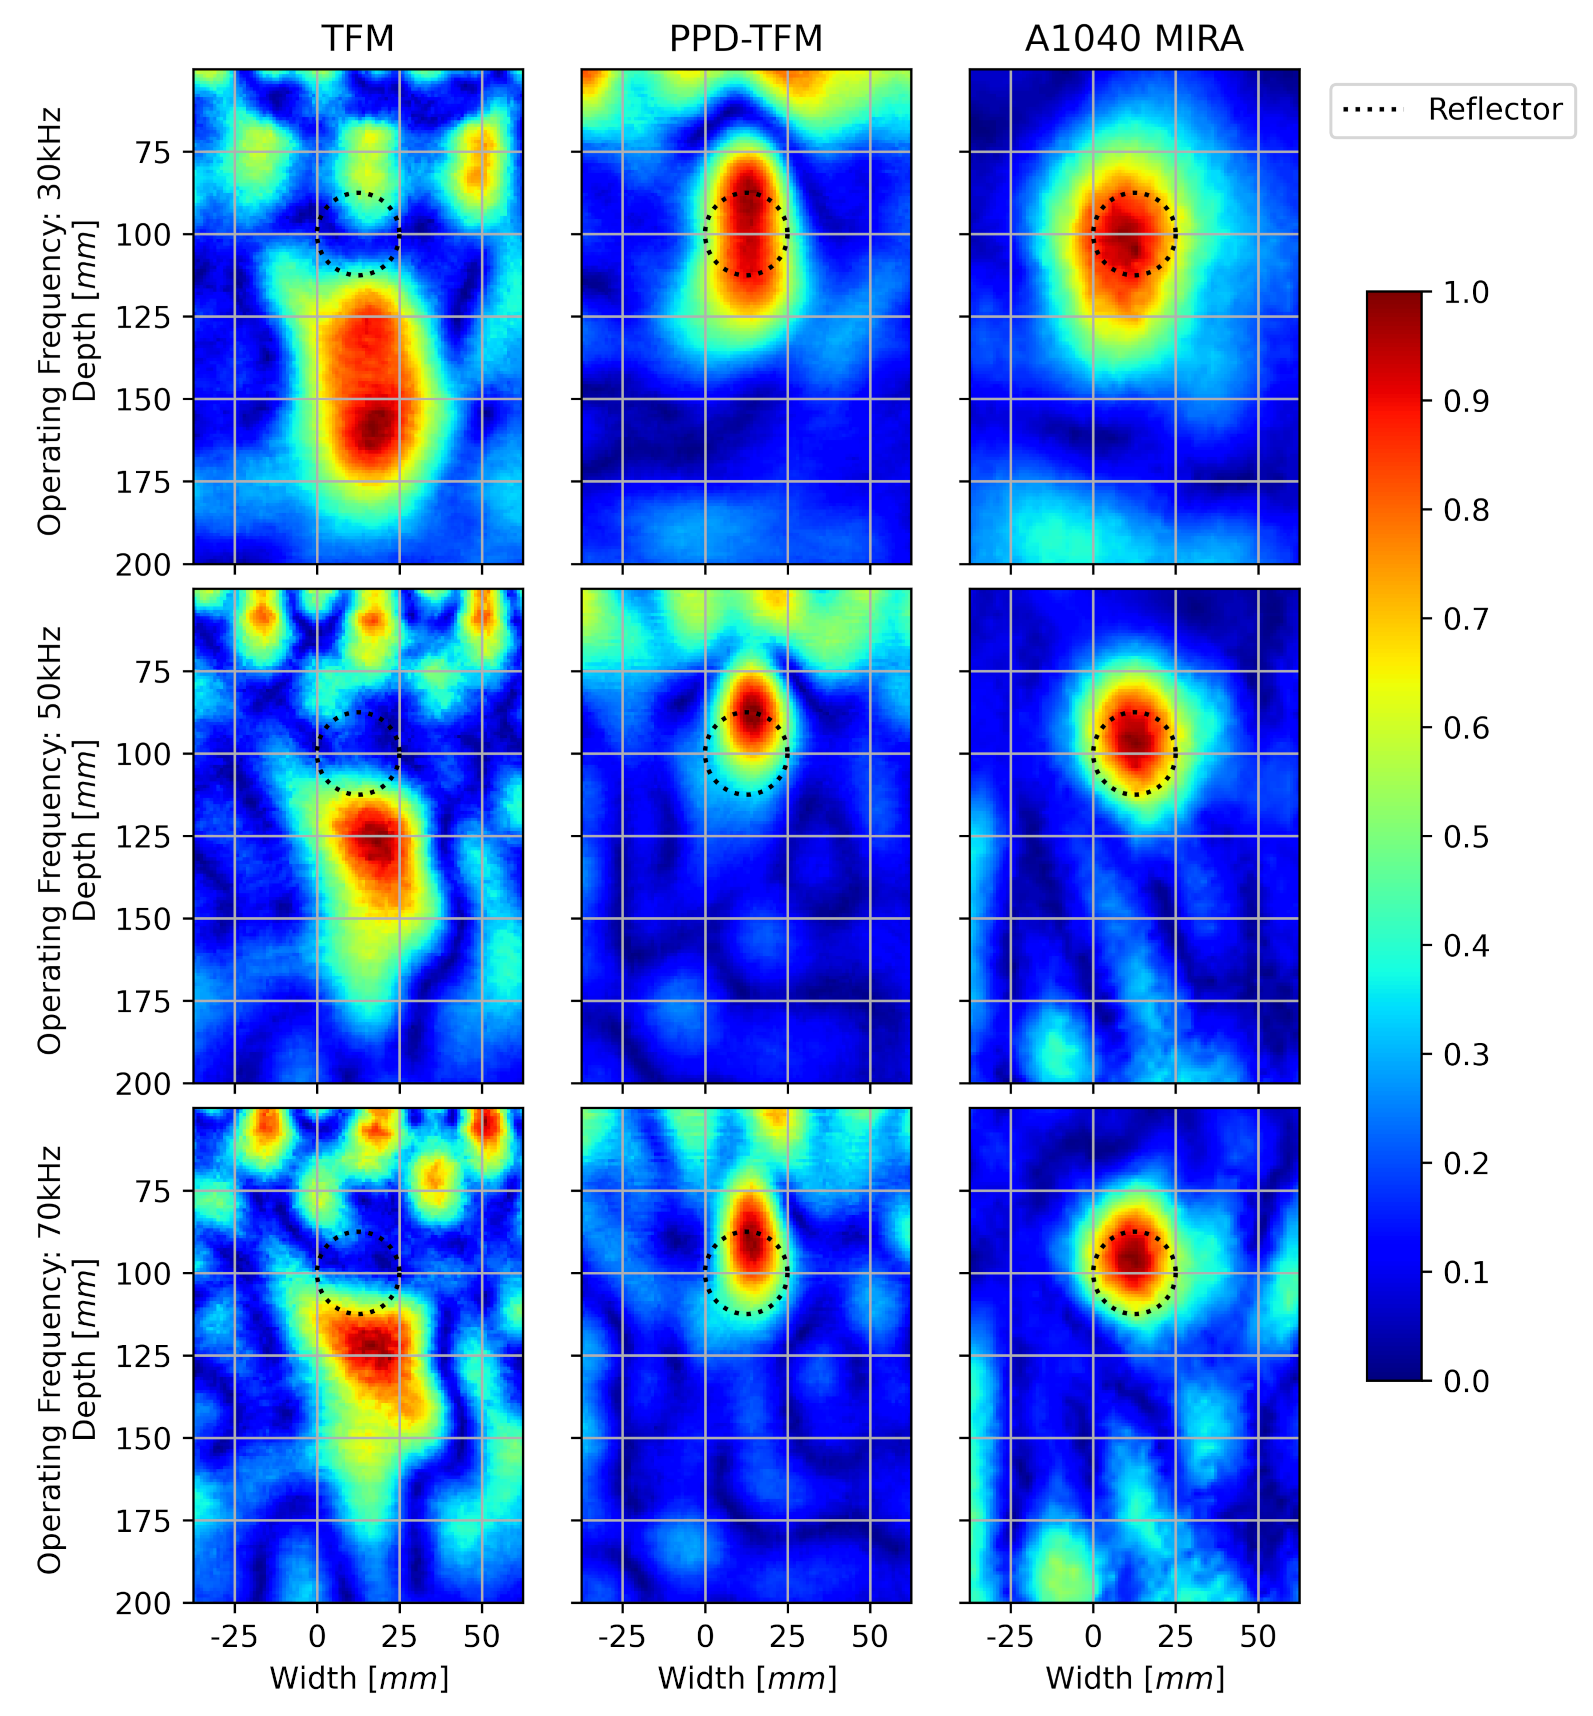
3.1. Simulation Results

A sectional image generated by an ultrasonic array system is called B-scan. B-scans by both the TFM and the PPD-TFM are plotted in Figure 3. Each B-scan is normalized by its maximum reflection value. In the B-scan by the TFM, an intense reflection is formed below the exact reflector location. The distance between the intense reflection and the reflector location is about half the measured PPD length, 103.5 mm, as the ultrasonic array system is a pulse-echo system where a pulse usually travels more than twice of the pixel depth. However, the PPD-TFM considering the PPD focuses a strong reflection at the exact reflector location.
Although the input electronic signal is a one-cycle wave pulse, the generated ultrasonic pulse has multiple cycles of waves. In addition, an inadequate focusing technique of the TFM made subsidiary reflections next to the strong reflection. However, the PPD-TFM weakened the subsidiary reflections by the exact focusing.

3.2. Array Performance Evaluation

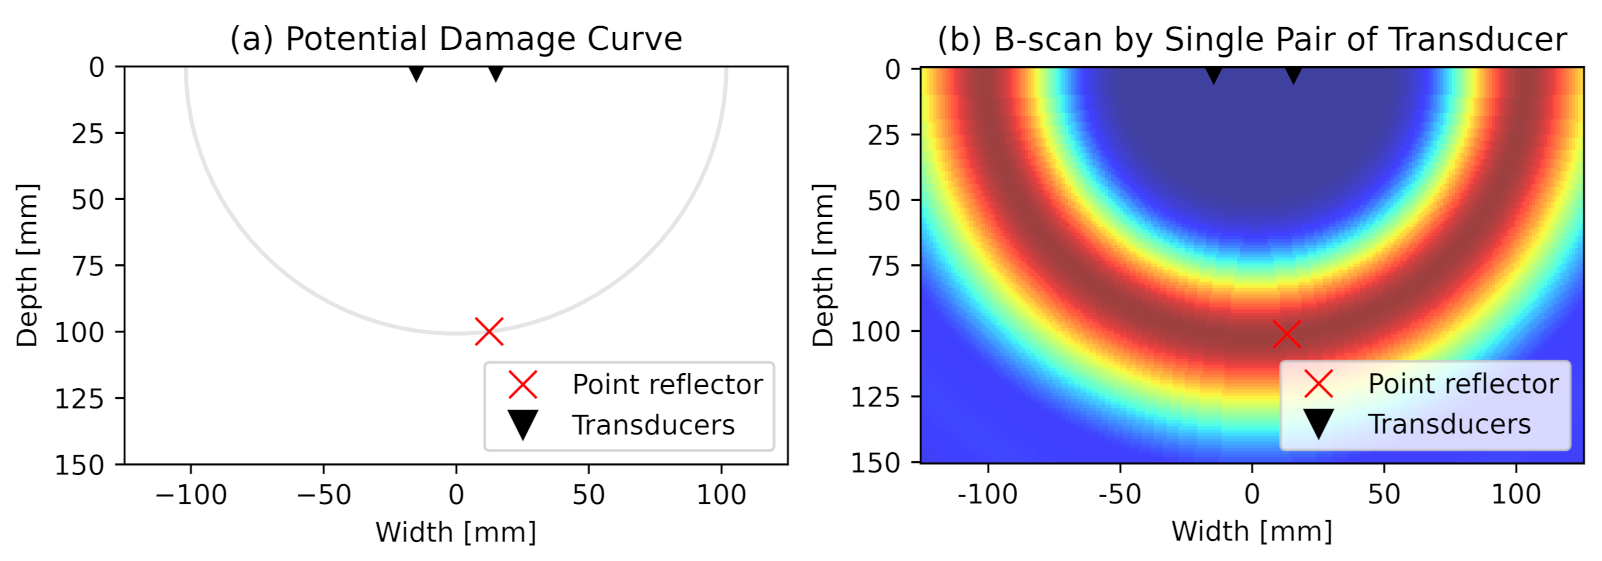
3.2.1. Potential Damage Curve

The potential damage curve is the collection of the possible damage locations. If information of a time-of-flight for a reflector with transducers is given and the same wave speed in the wave field is assumed as the wave speed in the algorithm, the potential damage curve will look like an half ellipse passing the location of the reflector, as shown in Figure 4a. Since the potential damage curve shows possible damage locations, a corresponding B-scan is similar to the potential damage curve, as shown in Figure 4b. Thus, a resulting B-scan image can be approximated by drawing all potential damage curves for all pair of transducers.
The potential damage curves for the B-scans of the simulated signal by the TFM and the PPD-TFM are illustrated in Figure 5. Since the PPD is not calibrated in the TFM, the potential damage curves are crossing down shifted from the exact reflector location. On the other hand, the potential damage curves for the PPD-TFM are exactly passing through the exact reflector location. Similar reflection shapes can be seen in the corresponding B-scans in Figure 3.

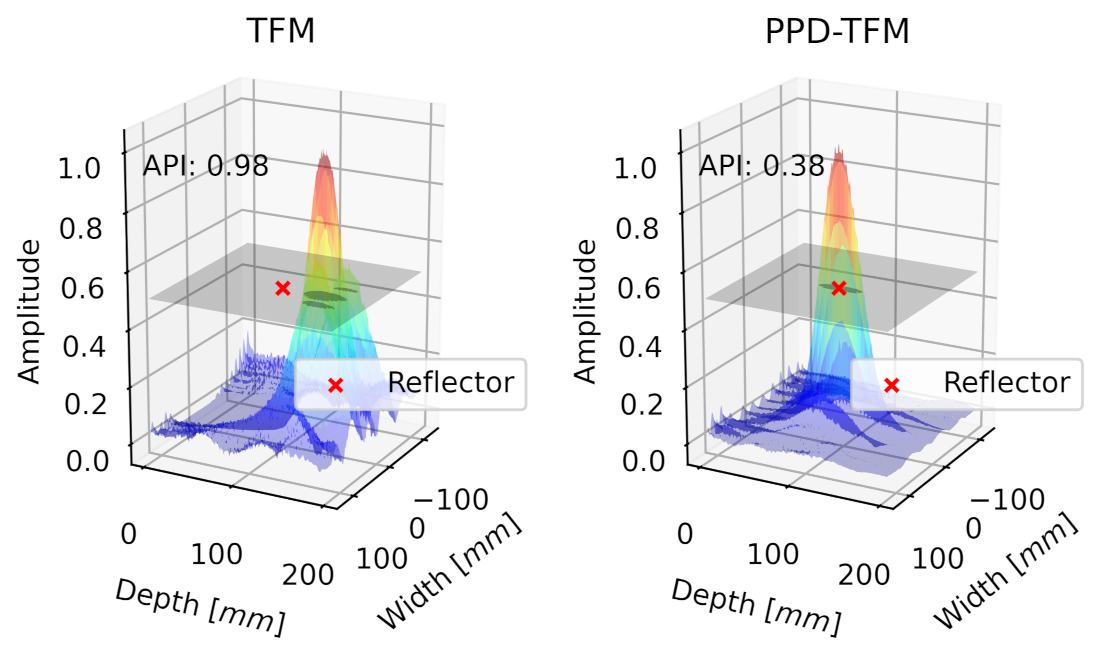
3.2.2. Array Performance Indicator
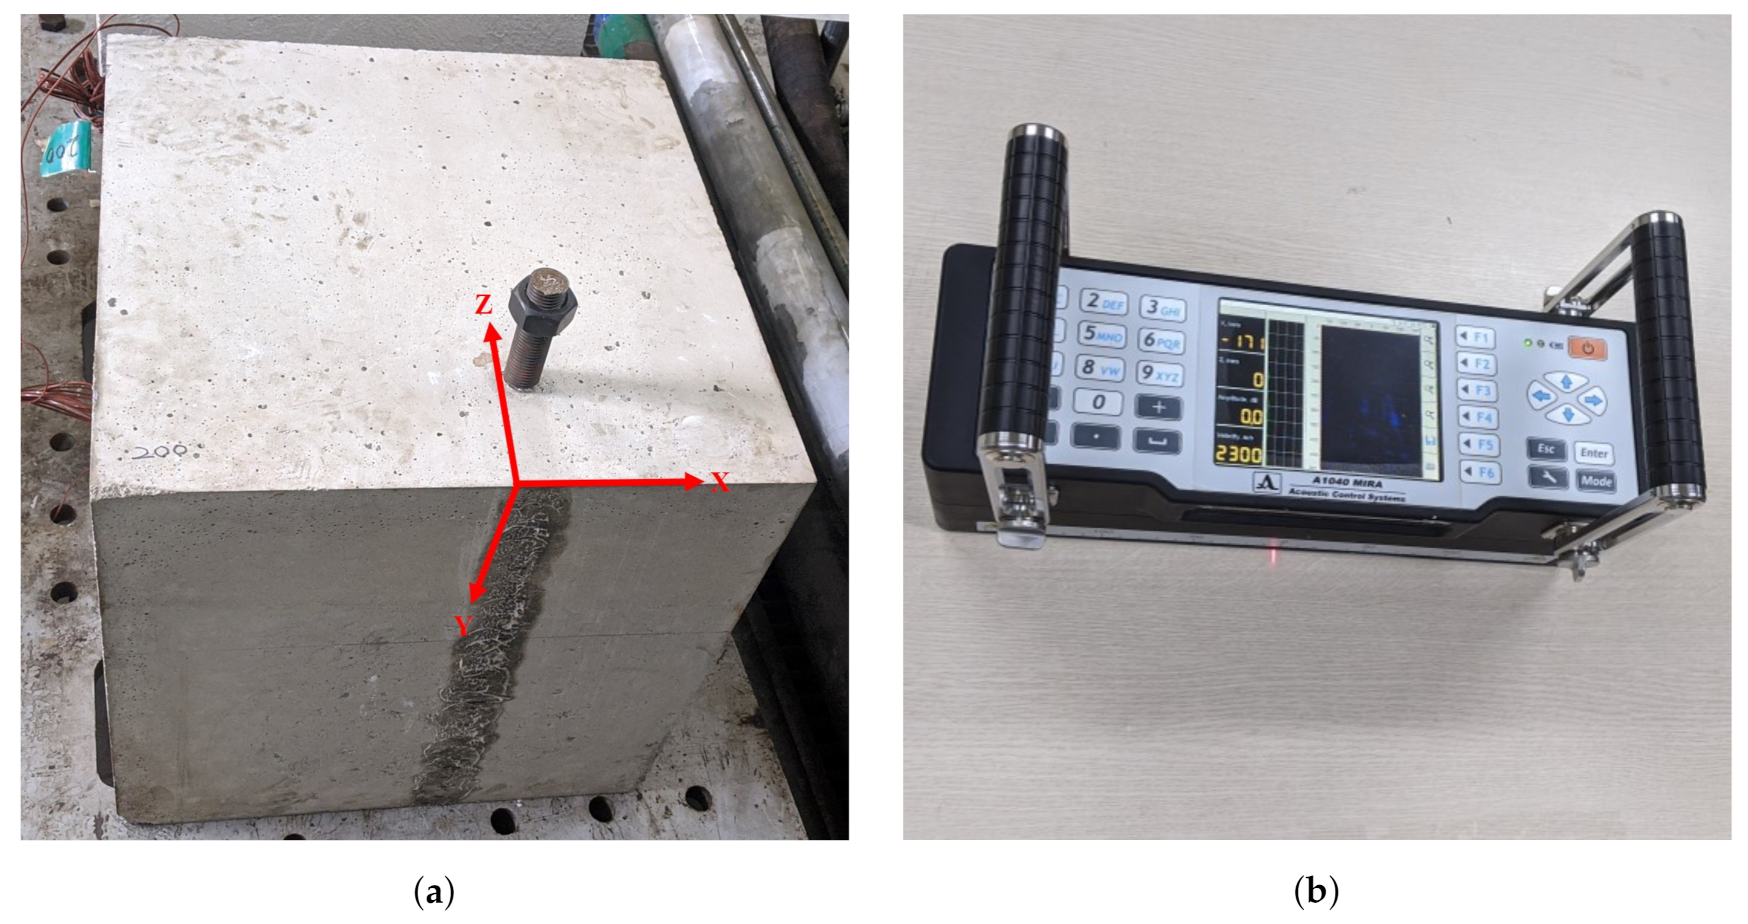
The array performance indicator (API) was introduced to quantify the performance of the array and image reconstruction algorithm [28]. If a point reflector is assumed in the wave field, a reflection surface of the B-scan will look like a Gaussian distribution in the three dimensional space. Since the image reconstruction algorithm with better performance focuses reflection at a smaller area, the reflection surface will be sharper. Thus, the concept of the API aims at estimating the narrowness of the reflection hill by calculating the intersecting area between the reflection surface and a flat surface down from the maximum value. The smaller the API, the better the performance of the array and algorithm. The equation of API is expressed in Equation (8).
A P I = A λ c 2 ,
where A is the intersection area between reflection surface of the B-scan and the flat surface down from the maximum reflection point; and λ c is the wavelength of the input pulse. In this research, the flat surface is down-shifted by −6 dB from the max value.
The API is consistent regardless of wave frequency as the area value is divided by the square of the wavelength. The reflection surfaces of the B-scan by the TFM and the PPD-TFM on the simulated data are depicted in Figure 6. The reflection values are normalized to the maximum values. With the peak delay calibration, not only did the accuracy of the algorithm improve, but the performance of the B-scan also increased in terms of the API by decreasing 61.2%.

4. Experiment

The PPD-TFM algorithm was tested on a concrete cube specimen, as shown in Figure 7a. The concrete cube specimen is a plain concrete that has the dimension of 500 × 500 × 500 mm. Fine aggregates that are less than 5 mm in diameter, which is smaller than the wavelength of ultrasonic pulse, are used to avoid the interruption by aggregates. A 25-mm diameter anchor bolt is placed at (12.5, 100) mm in the X-Z plane. Unlike the simulation, the reflector is not a point, but a circular reflector.
The ultrasonic array device A1040 MIRA, as shown in Figure 7b, was used to scan the specimen. The MIRA device consists of 4 × 12 transducer array, and each 4 transducers acts as 1 transducer. The MIRA device resultantly operates as if 12 transducers array. Each transducer is a shear wave DPC transducer of which the tip is resistant-contact ceramic not requiring any coupling agent [29]. In addition, each one is independently braced by springs allowing to scan on rough surfaces. The MIRA device drives an ultrasonic pulse with a low frequency ranging from 25 to 100 kHz to avoid signal noise when the wavelength of the pulse is smaller than the size of concrete aggregates. In addition, the shear wave DPC transducer prevents the measured signal from being interrupted by different types of waves generated by mode conversion at interfaces.
The MIRA device was placed at the z = 0 plane, as shown in Figure 2a, and the ultrasonic 1-cycle input pulse was driven at frequency of 30, 50, and 70 kHz. The raw data from the MIRA device was extracted to feed the TFM and PPD-TFM. B-scans by the PPD-TFM are compared with B-scans by the TFM and the MIRA device.

Experimental Results and Discussion

Figure 8 shows the B-scans by the TFM, PPD-TFM, and SAFT-C embedded in the MIRA device. The values in B-scans are normalized to the maximum reflection values. As an ultrasonic pulse is reflected at the top boundary of the anchor bolt, a strong reflection needs to be formed at the top boundary of the circular anchor bolt. The PPD-TFM that calculates the PPDs for the different input frequencies shows the exact placement of the strong reflections regardless of the input frequencies. On the other hand, the TFM that does not deal with PPD formed strong reflections below the exact reflector location. But, the position of the strong reflection comes close to the exact location once the input frequency increases and the PPD length shortens. The SAFT-C algorithm calibrates the PPD in its own way, though the strong reflections were formed slightly below the exact location.
The reflection surfaces and -6 dB API values are presented in Figure 9 and Table 1. The PPD-TFM shows better performance than the TFM, as well as the SAFT-C, embedded in the MIRA device. For the input frequency of 70 kHz that is out of the DPC transducer’s frequency bandwidth range, the overall performance of all methods diminished. This shows that an input frequency higher than the bandwidth of a transducer does not provide adequate performance.
One of the recorded signals is plotted in Figure 10. As the surface line is the shortest wave path, the surface wave is recorded at first, then the signal reflected at the anchor bolt is recorded after that. Since the surface noise makes unnecessary strong reflections near the array in B-scan, as shown in Figure 8, a damage reflection near the array can be interrupted by the surface noise. In addition, the slower speed of the surface wave than the shear wave makes the area of the surface noise bigger. In order to improve the image quality, a technique to get rid of the surface noise needs to be developed, as well. For reference, the SAFT-C diminishes the surface noise in its own method.

5. Conclusions

A new TFM method called PPD-TFM is proposed to compensate for the long pulse duration of the MIRA device applied to concrete structures. The results show that the PPD-TFM have higher accuracy and array performance than the TFM and SAFT-C by using the modified ultrasonic time-of-flight values considering pulse peak delay. The PPD-TFM calculates a PPD using a simulated frequency response function of a transducer comprised in the MIRA and an electronic input signal. The calculated PPD is added to the delayed time term in the algorithm. The results of the PPD-TFM were compared with the existing TFM method and the SAFT-C method by using simulated ultrasonic array data and experimental data. The following conclusions were drawn from the results and observations.
  • The PPD-TFM improved the accuracy of the image reconstruction algorithm on concrete structures. The proposed method even showed better accuracy than the SAFT-C embedded in the MIRA device. In addition to the higher accuracy, the PPD-TFM showed better performance than the existing TFM and even the SAFT-C method in terms of API.
  • A high input frequency could result in an accurate B-scan result even if the PPD-TFM is not applied. However, in the case of the MIRA device that was developed for concrete structures, a low-frequency input pulse is inevitable to avoid severe signal attenuation by concrete aggregates. In addition, a fixed range of frequency bandwidth for the DPC transducer in the MIRA device makes the usage of high-frequency input out of the bandwidth ineffective. Therefore, the calibration of the PPD like the PPD-TFM is essential for the MIRA device.
  • Although the proposed PPD-TFM provides a high-quality image, the image can be impaired by surface noise especially if the reflector is close to the surface. If surface noise removal techniques are adapted in the PPD-TFM, a better B-scan with reduced surface noise could be expected.

Author Contributions

Conceptualization, H.K.; methodology, H.K.; software, H.K.; validation, H.K., C.J. and W.J.C.; formal analysis, H.K.; investigation, H.K.; resources, H.K., C.J. and W.J.C.; data curation, H.K.; writing—original draft preparation, H.K.; writing—review and editing, H.K.; visualization, H.K.; supervision, H.K.; project administration, C.J. and W.J.C.; funding acquisition, C.J. All authors have read and agreed to the published version of the manuscript.

Funding

This research was supported by a grant from a Strategic Research Project (Non-Destructive Evaluation (NDE) Technology for PSC Structures (PSC Stethoscope), Project # 20210158-001) funded by the Korea Institute of Civil Engineering and Building Technology (KICT).

Institutional Review Board Statement

Not applicable.

Informed Consent Statement

Not applicable.

Data Availability Statement

Data sharing not applicable.

Conflicts of Interest

The authors declare no conflict of interest.

References

  1. Mindess, S. Developments in the Formulation and Reinforcement of Concrete; Woodhead Publishing: Sawston, Cambridge, MA, USA, 2019. [Google Scholar]
  2. Pacheco-Torgal, F.; Abdollahnejad, Z.; Miraldo, S.; Baklouti, S.; Ding, Y. An overview on the potential of geopolymers for concrete infrastructure rehabilitation. Constr. Build. Mater. 2012, 36, 1053–1058. [Google Scholar] [CrossRef] [Green Version]
  3. ASCE. Infrastructure Report Card; ASCE: Asce Reston, VA, USA, 2017. [Google Scholar]
  4. Haach, V.G.; Ramirez, F.C. Qualitative assessment of concrete by ultrasound tomography. Constr. Build. Mater. 2016, 119, 61–70. [Google Scholar] [CrossRef]
  5. Camassa, D.; Castellano, A.; Fraddosio, A.; Piccioni, M.D. A New Ultrasonic Amplitude Tomography Approach, with Validation on Masonry Tuff Blocks. J. Nondestruct. Eval. 2020, 39, 1–19. [Google Scholar] [CrossRef]
  6. Camassa, D.; Castellano, A.; Fraddosio, A.; Piccioni, M.D. Improvements of the ultrasonic tomography for applications to historical masonry constructions. In Structural Analysis of Historical Constructions; Springer: Berlin, Germany, 2019; pp. 447–455. [Google Scholar]
  7. Zielińska, M.; Rucka, M. Non-destructive assessment of masonry pillars using ultrasonic tomography. Materials 2018, 11, 2543. [Google Scholar] [CrossRef] [PubMed] [Green Version]
  8. Choi, H.; Popovics, J.S. NDE application of ultrasonic tomography to a full-scale concrete structure. IEEE Trans. Ultrason. Ferroelectr. Freq. Control 2015, 62, 1076–1085. [Google Scholar] [CrossRef] [PubMed]
  9. Hoegh, K.; Khazanovich, L.; Yu, H.T. Ultrasonic tomography for evaluation of concrete pavements. Transp. Res. Rec. 2011, 2232, 85–94. [Google Scholar] [CrossRef]
  10. Schabowicz, K. Ultrasonic tomography-The latest nondestructive technique for testing concrete members-Description, test methodology, application example. Arch. Civ. Mech. Eng. 2014, 14, 295–303. [Google Scholar] [CrossRef]
  11. Misak, L.; Corbett, D.; Grantham, M. Comparison of 2D and 3D ultrasonic pulse echo imaging techniques for structural assessment. In MATEC Web of Conferences; EDP Sciences: Ulis, France, 2019; Volume 289, p. 06003. [Google Scholar]
  12. Bellanova, M.; Cucchi, M.; Felicetti, R.; Monte, F.L. Unconventional applications of A1040 MIRA tomograph. In Atti Conferenza Nazionale Sulle Prove Non Distruttive Monitoraggio Diagnostica AIPnD 2017; 2017; Available online: https://www.researchgate.net/publication/330716844 (accessed on 14 September 2020).
  13. Oraevsky, A.A.; Andreev, V.A.; Karabutov, A.A.; Esenaliev, R.O. Two-dimensional optoacoustic tomography: Transducer array and image reconstruction algorithm. In Laser-Tissue Interaction X: Photochemical, Photothermal, and Photomechanical; International Society for Optics and Photonics: Bellingham, Washington, WA, USA, 1999; Volume 3601, pp. 256–267. [Google Scholar]
  14. Zhang, J.; Drinkwater, B.W.; Wilcox, P.D. Effects of array transducer inconsistencies on total focusing method imaging performance. NDT E Int. 2011, 44, 361–368. [Google Scholar] [CrossRef]
  15. Shan, S.; Qiu, J.; Zhang, C.; Ji, H.; Cheng, L. Multi-damage localization on large complex structures through an extended delay-and-sum based method. Struct. Health Monit. 2016, 15, 50–64. [Google Scholar] [CrossRef]
  16. Salmanpour, M.; Sharif Khodaei, Z.; Aliabadi, M. Transducer placement optimisation scheme for a delay and sum damage detection algorithm. Struct. Control Health Monit. 2017, 24, e1898. [Google Scholar] [CrossRef] [Green Version]
  17. Harshit, J.; Patankar, V.H. Advances in Ultrasonic Instrumentation for Inspection of Concrete/RCC Structures; Elsevier: Amsterdam, The Netherlands, 2019. [Google Scholar]
  18. Chaix, J.F.; Garnier, V.; Corneloup, G. Concrete damage evolution analysis by backscattered ultrasonic waves. NDT E Int. 2003, 36, 461–469. [Google Scholar] [CrossRef]
  19. Bishko, A.; Samokrutov, A.A.; Shevaldykin, V.G. Ultrasonic echo-pulse tomography of concrete using shear waves low-frequency phased antenna arrays. In Proceedings of the 17th World Conference on Nondestructive Testing, Shanghai, China, 25–28 October 2008; Volume 25. [Google Scholar]
  20. De La Haza, A.O.; Samokrutov, A.A.; Samokrutov, P.A. Assessment of concrete structures using the Mira and Eyecon ultrasonic shear wave devices and the SAFT-C image reconstruction technique. Constr. Build. Mater. 2013, 38, 1276–1291. [Google Scholar] [CrossRef]
  21. Chen, Y.; Lam, K.; Zhou, D.; Cheng, W.; Dai, J.; Luo, H.; Chan, H. High-frequency PIN–PMN–PT single crystal ultrasonic transducer for imaging applications. Appl. Phys. A 2012, 108, 987–991. [Google Scholar] [CrossRef]
  22. Kim, H.J.; Lee, H.; Ziaie, B. A wideband PVDF-on-silicon ultrasonic transducer array with microspheres embedded low melting temperature alloy backing. Biomed. Microdevices 2007, 9, 83–90. [Google Scholar] [CrossRef] [PubMed]
  23. S1802-Shear wave DPC transducer 50 KHz | Acoustic Control Systems. Available online: https://acs-international.com/instruments/transducers/low-frequency-50-to-300-khz/dry-point-contact/single/s1802/ (accessed on 14 September 2020).
  24. Sakamoto, T.; Taki, H.; Sato, T. An experimental study of ultrasonic imaging with a reduced number of array elements using the envelope method. Acoust. Sci. Technol. 2011, 32, 143–150. [Google Scholar] [CrossRef] [Green Version]
  25. Wiggenhauser, H.; Samokrutov, A.; Mayer, K.; Krause, M.; Alekhin, S.; Elkin, V. Large aperture ultrasonic system for testing thick concrete structures. J. Infrastruct. Syst. 2017, 23, B4016004. [Google Scholar] [CrossRef]
  26. Stratoudaki, T.; Clark, M.; Wilcox, P.D. Laser induced ultrasonic phased array using full matrix capture data acquisition and total focusing method. Opt. Express 2016, 24, 21921–21938. [Google Scholar] [CrossRef] [PubMed] [Green Version]
  27. Hunter, A.J.; Drinkwater, B.W.; Wilcox, P.D. The wavenumber algorithm for full-matrix imaging using an ultrasonic array. IEEE Trans. Ultrason. Ferroelectr. Freq. Control 2008, 55, 2450–2462. [Google Scholar] [CrossRef] [PubMed]
  28. Holmes, C.; Drinkwater, B.W.; Wilcox, P.D. Post-processing of the full matrix of ultrasonic transmit–receive array data for non-destructive evaluation. NDT E Int. 2005, 38, 701–711. [Google Scholar] [CrossRef]
  29. Schabowicz, K.; Sterniuk, A.; Kwiecińska, A. Ultrasonic examination of concrete with one side access in practice. Mater. Sci. Eng. 2018, 365, 032058. [Google Scholar] [CrossRef] [Green Version]
Figure 1. Frequency response spectrum and input/output signal of DPC (Dry Point Contact).
Applsci 11 01741 g001
Figure 2. (a) Ultrasonic array system and scanning scheme and (b) array geometry.
Applsci 11 01741 g002
Figure 3. B-scan for Simulation by Total Focusing Method (TFM) (left) and Pulse Peak Delay—Total Focusing Method (PPD-TFM) (right).
Applsci 11 01741 g003
Figure 4. (a) Potential damage curve and (b) corresponding B-scan for a single pair of transducers.
Applsci 11 01741 g004
Figure 5. Potential damage curve for TFM (left) and PPD-TFM (right).
Applsci 11 01741 g005
Figure 6. Array performance indicator (API) for Simulation by TFM (left) and PPD-TFM (right).
Applsci 11 01741 g006
Figure 7. (a) Scanning target concrete cube specimen and (b) ultrasonic array device A1040 MIRA.
Applsci 11 01741 g007
Figure 8. B-scan for concrete cube specimen by TFM (left), PPD-TFM (center), and SAFT-C (right).
Applsci 11 01741 g008
Figure 9. API for concrete cube specimen by TFM (left), PPD-TFM (center), and SAFT-C (right).
Applsci 11 01741 g009
Figure 10. Received Signal by A1040 MIRA for Pair of 1st and 8th Transducers.
Applsci 11 01741 g010
Table 1. API values for TFM, PPD-TFM, and SAFT-C (A1040 MIRA).
Image Reconstruction Algorithm
TFMPPD-TFMSAFT-C
Input signal frequency30 kHz0.390.230.34
50 kHz0.670.270.49
70 kHz1.420.560.89
Publisher’s Note: MDPI stays neutral with regard to jurisdictional claims in published maps and institutional affiliations.

