
Greenhouse Gas Emissions from Solid Waste Management in Saudi Arabia—Analysis of Growth Dynamics and Mitigation Opportunities

 ,
,  ,
, 

 and
and 
Abstract
1. Introduction
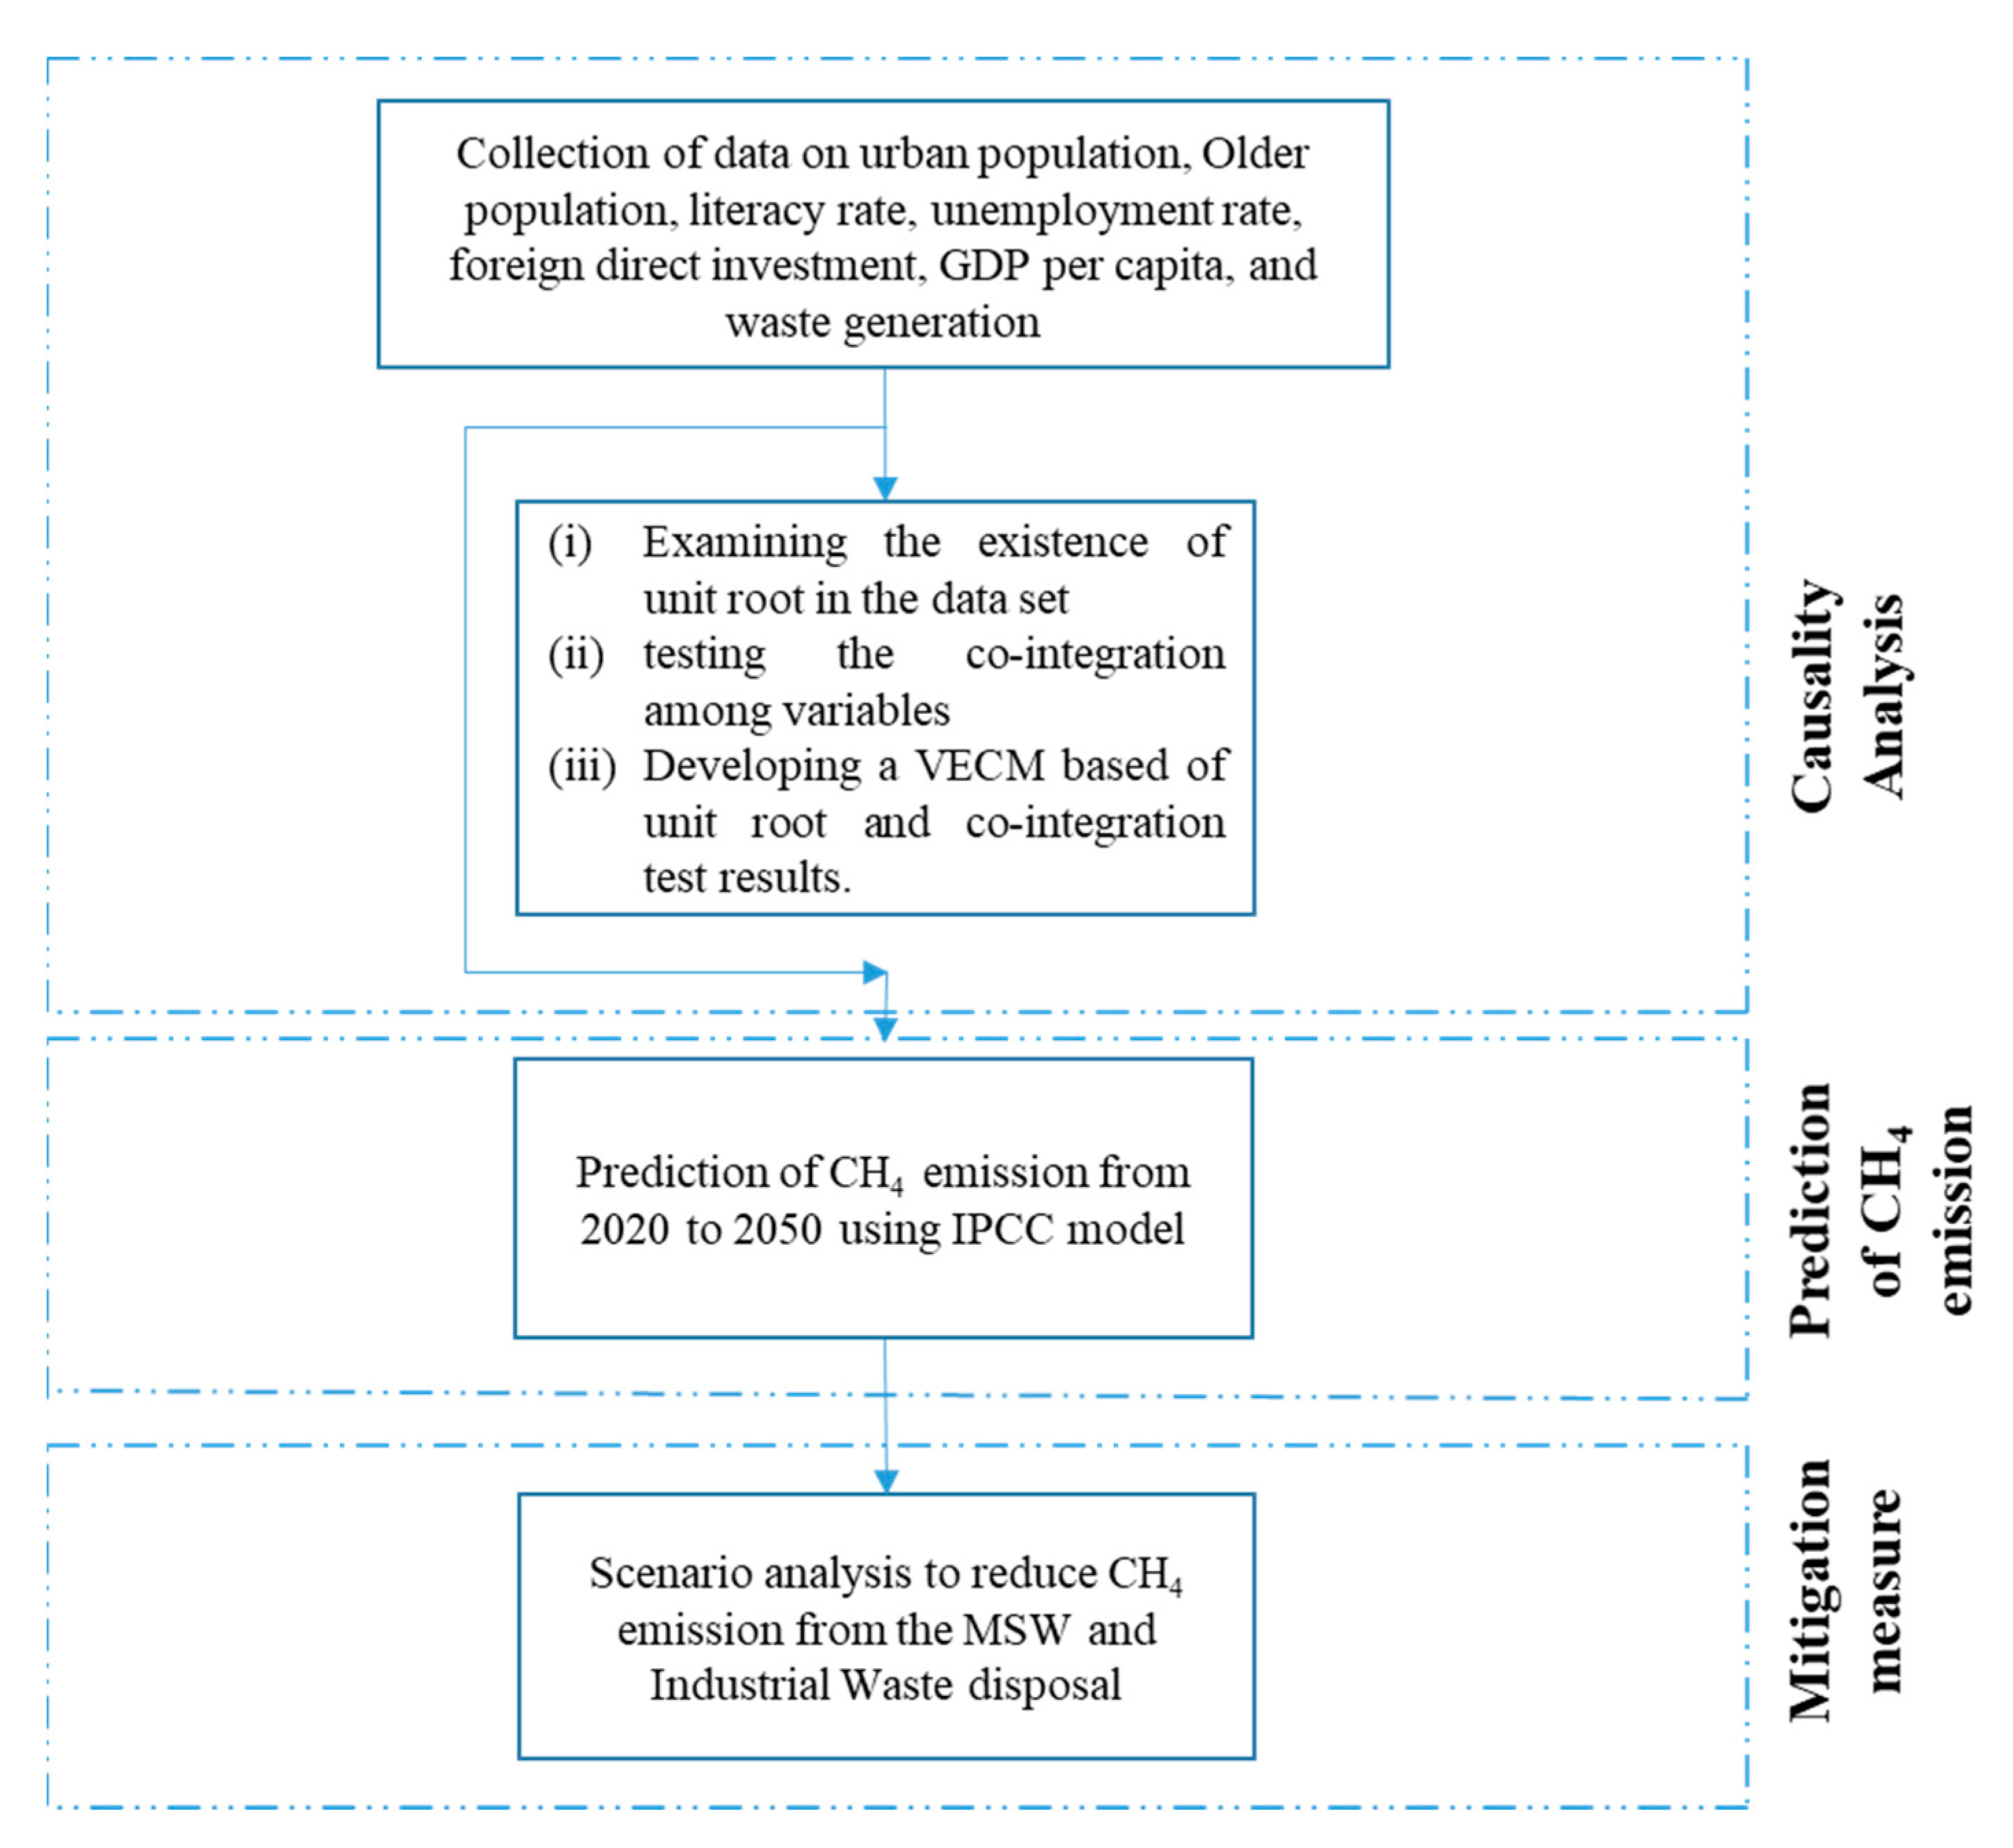
2. Materials and Methods
2.1. Causality Analysis
2.1.1. Model Specifications
2.1.2. Developing VECM Models
2.2. Methane Emission Calculation
2.3. Waste Collection Practices in Saudi Arabia
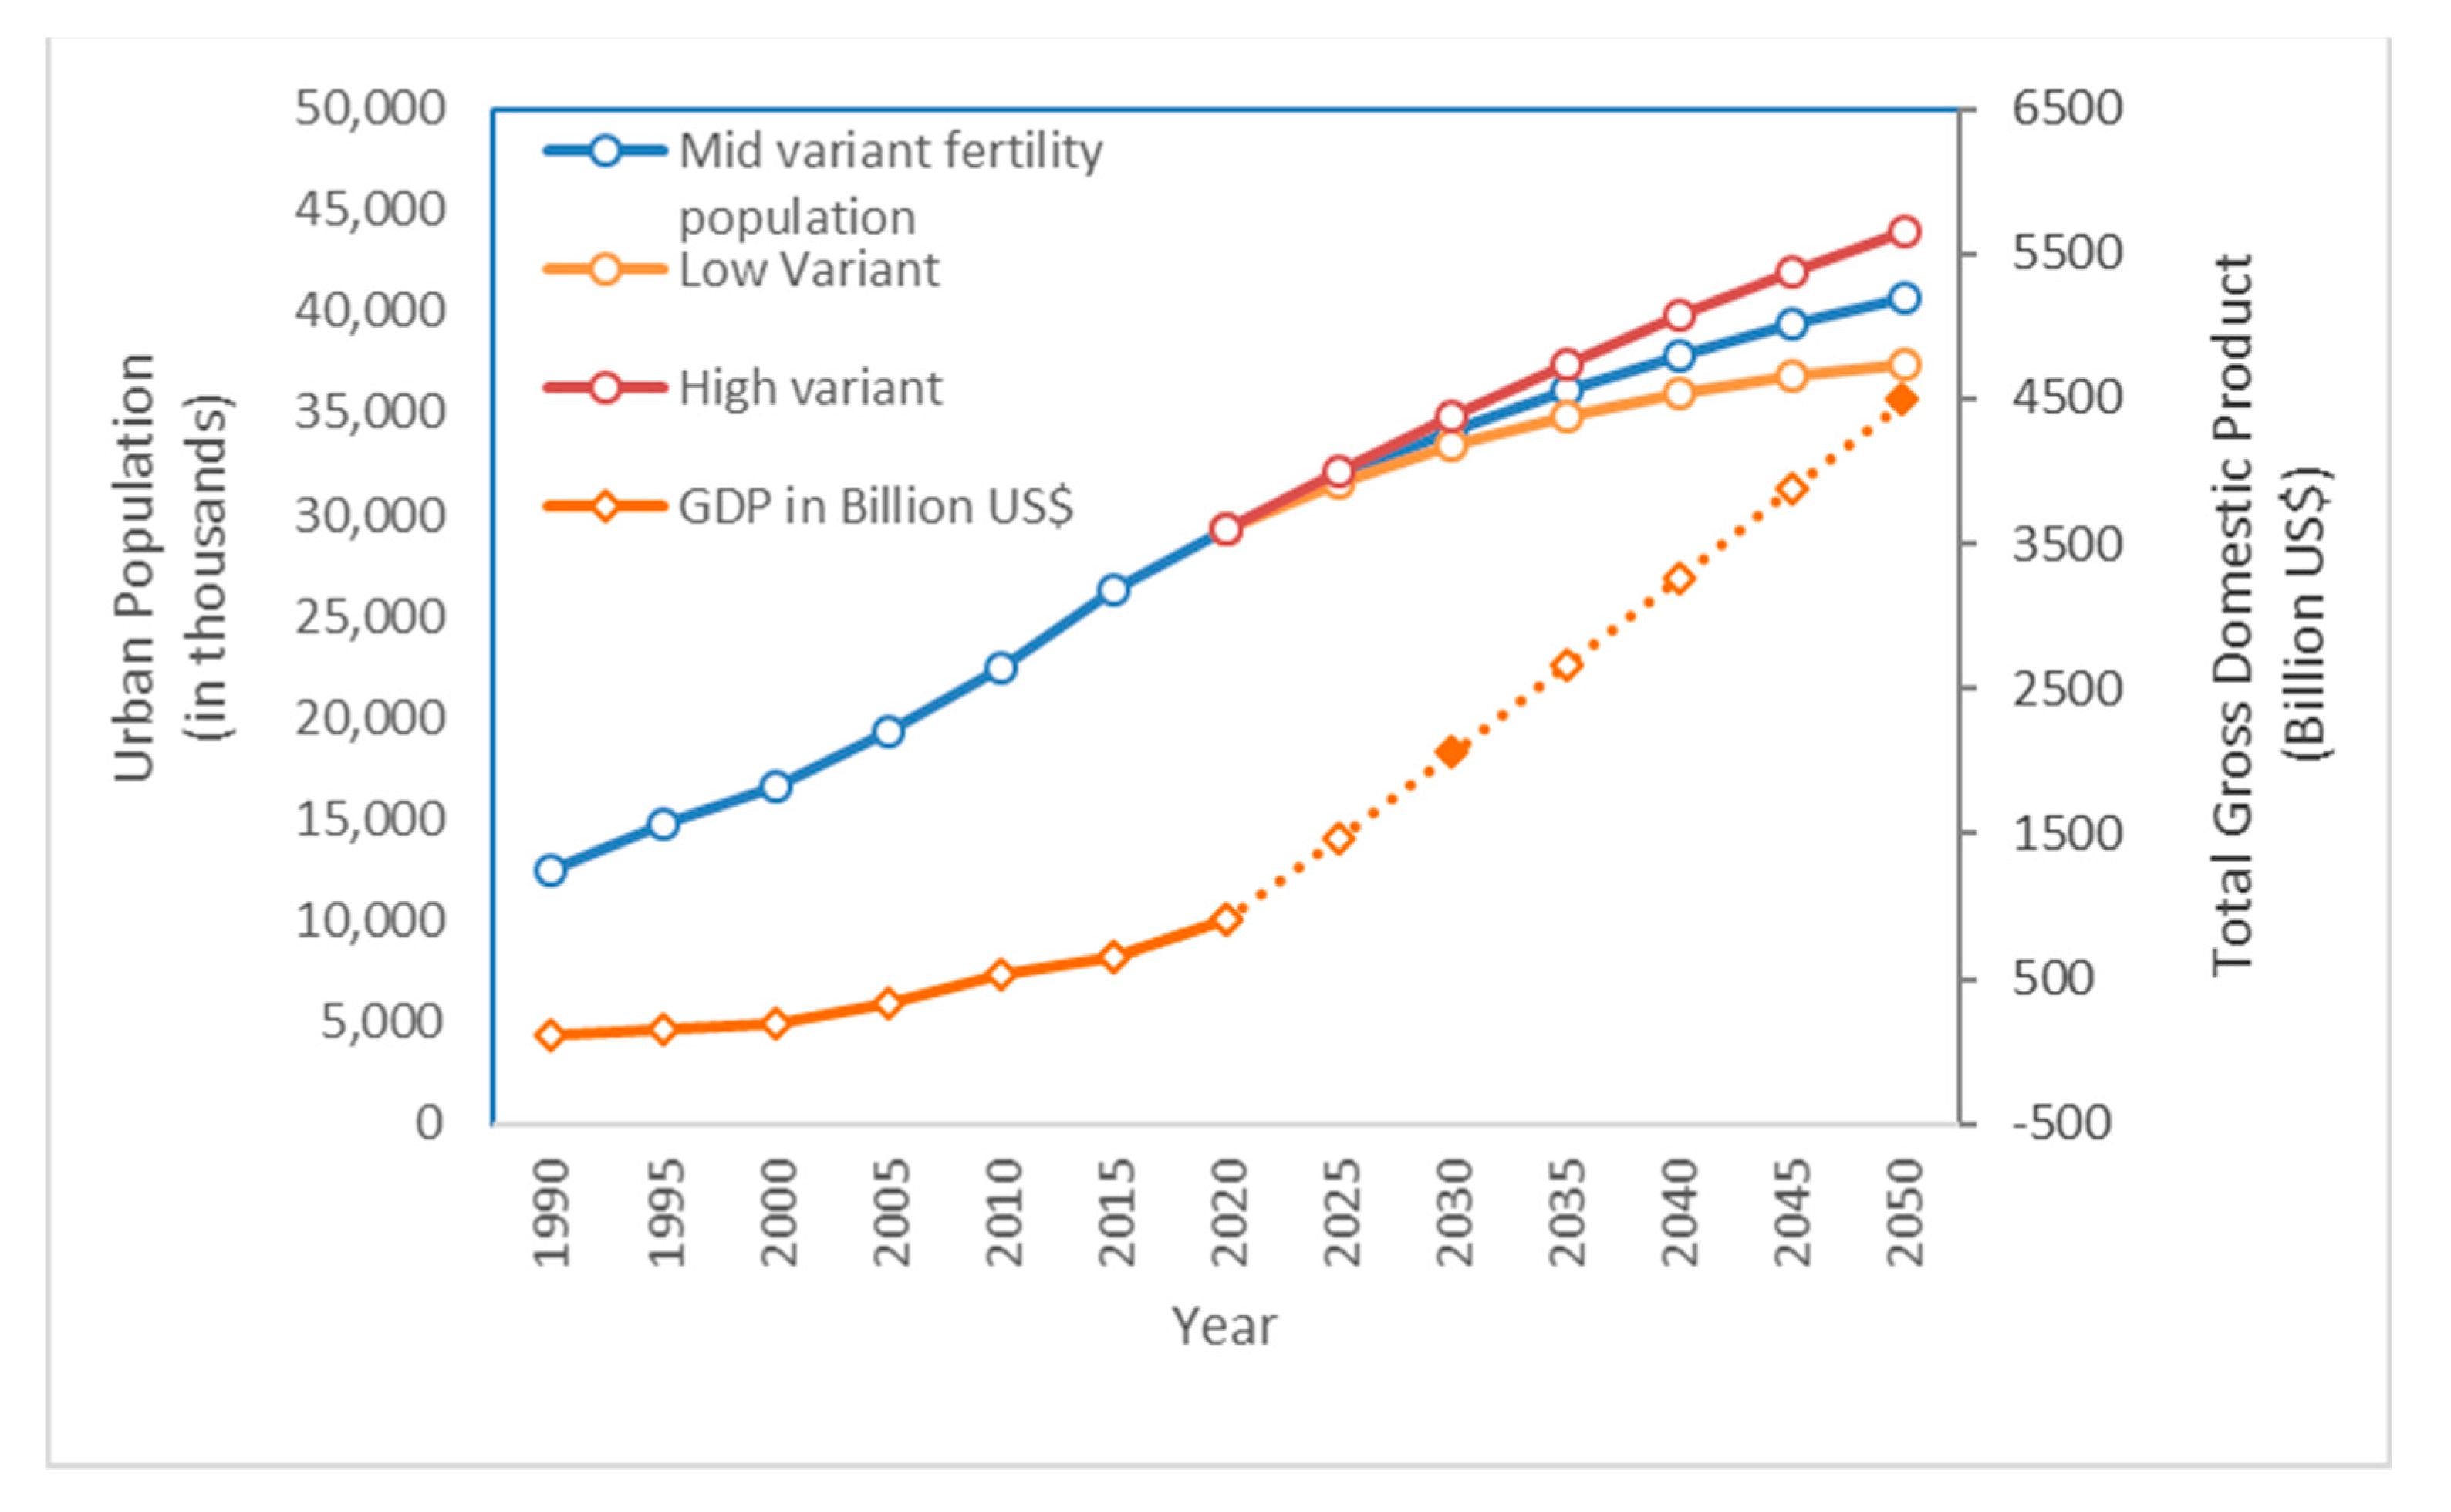
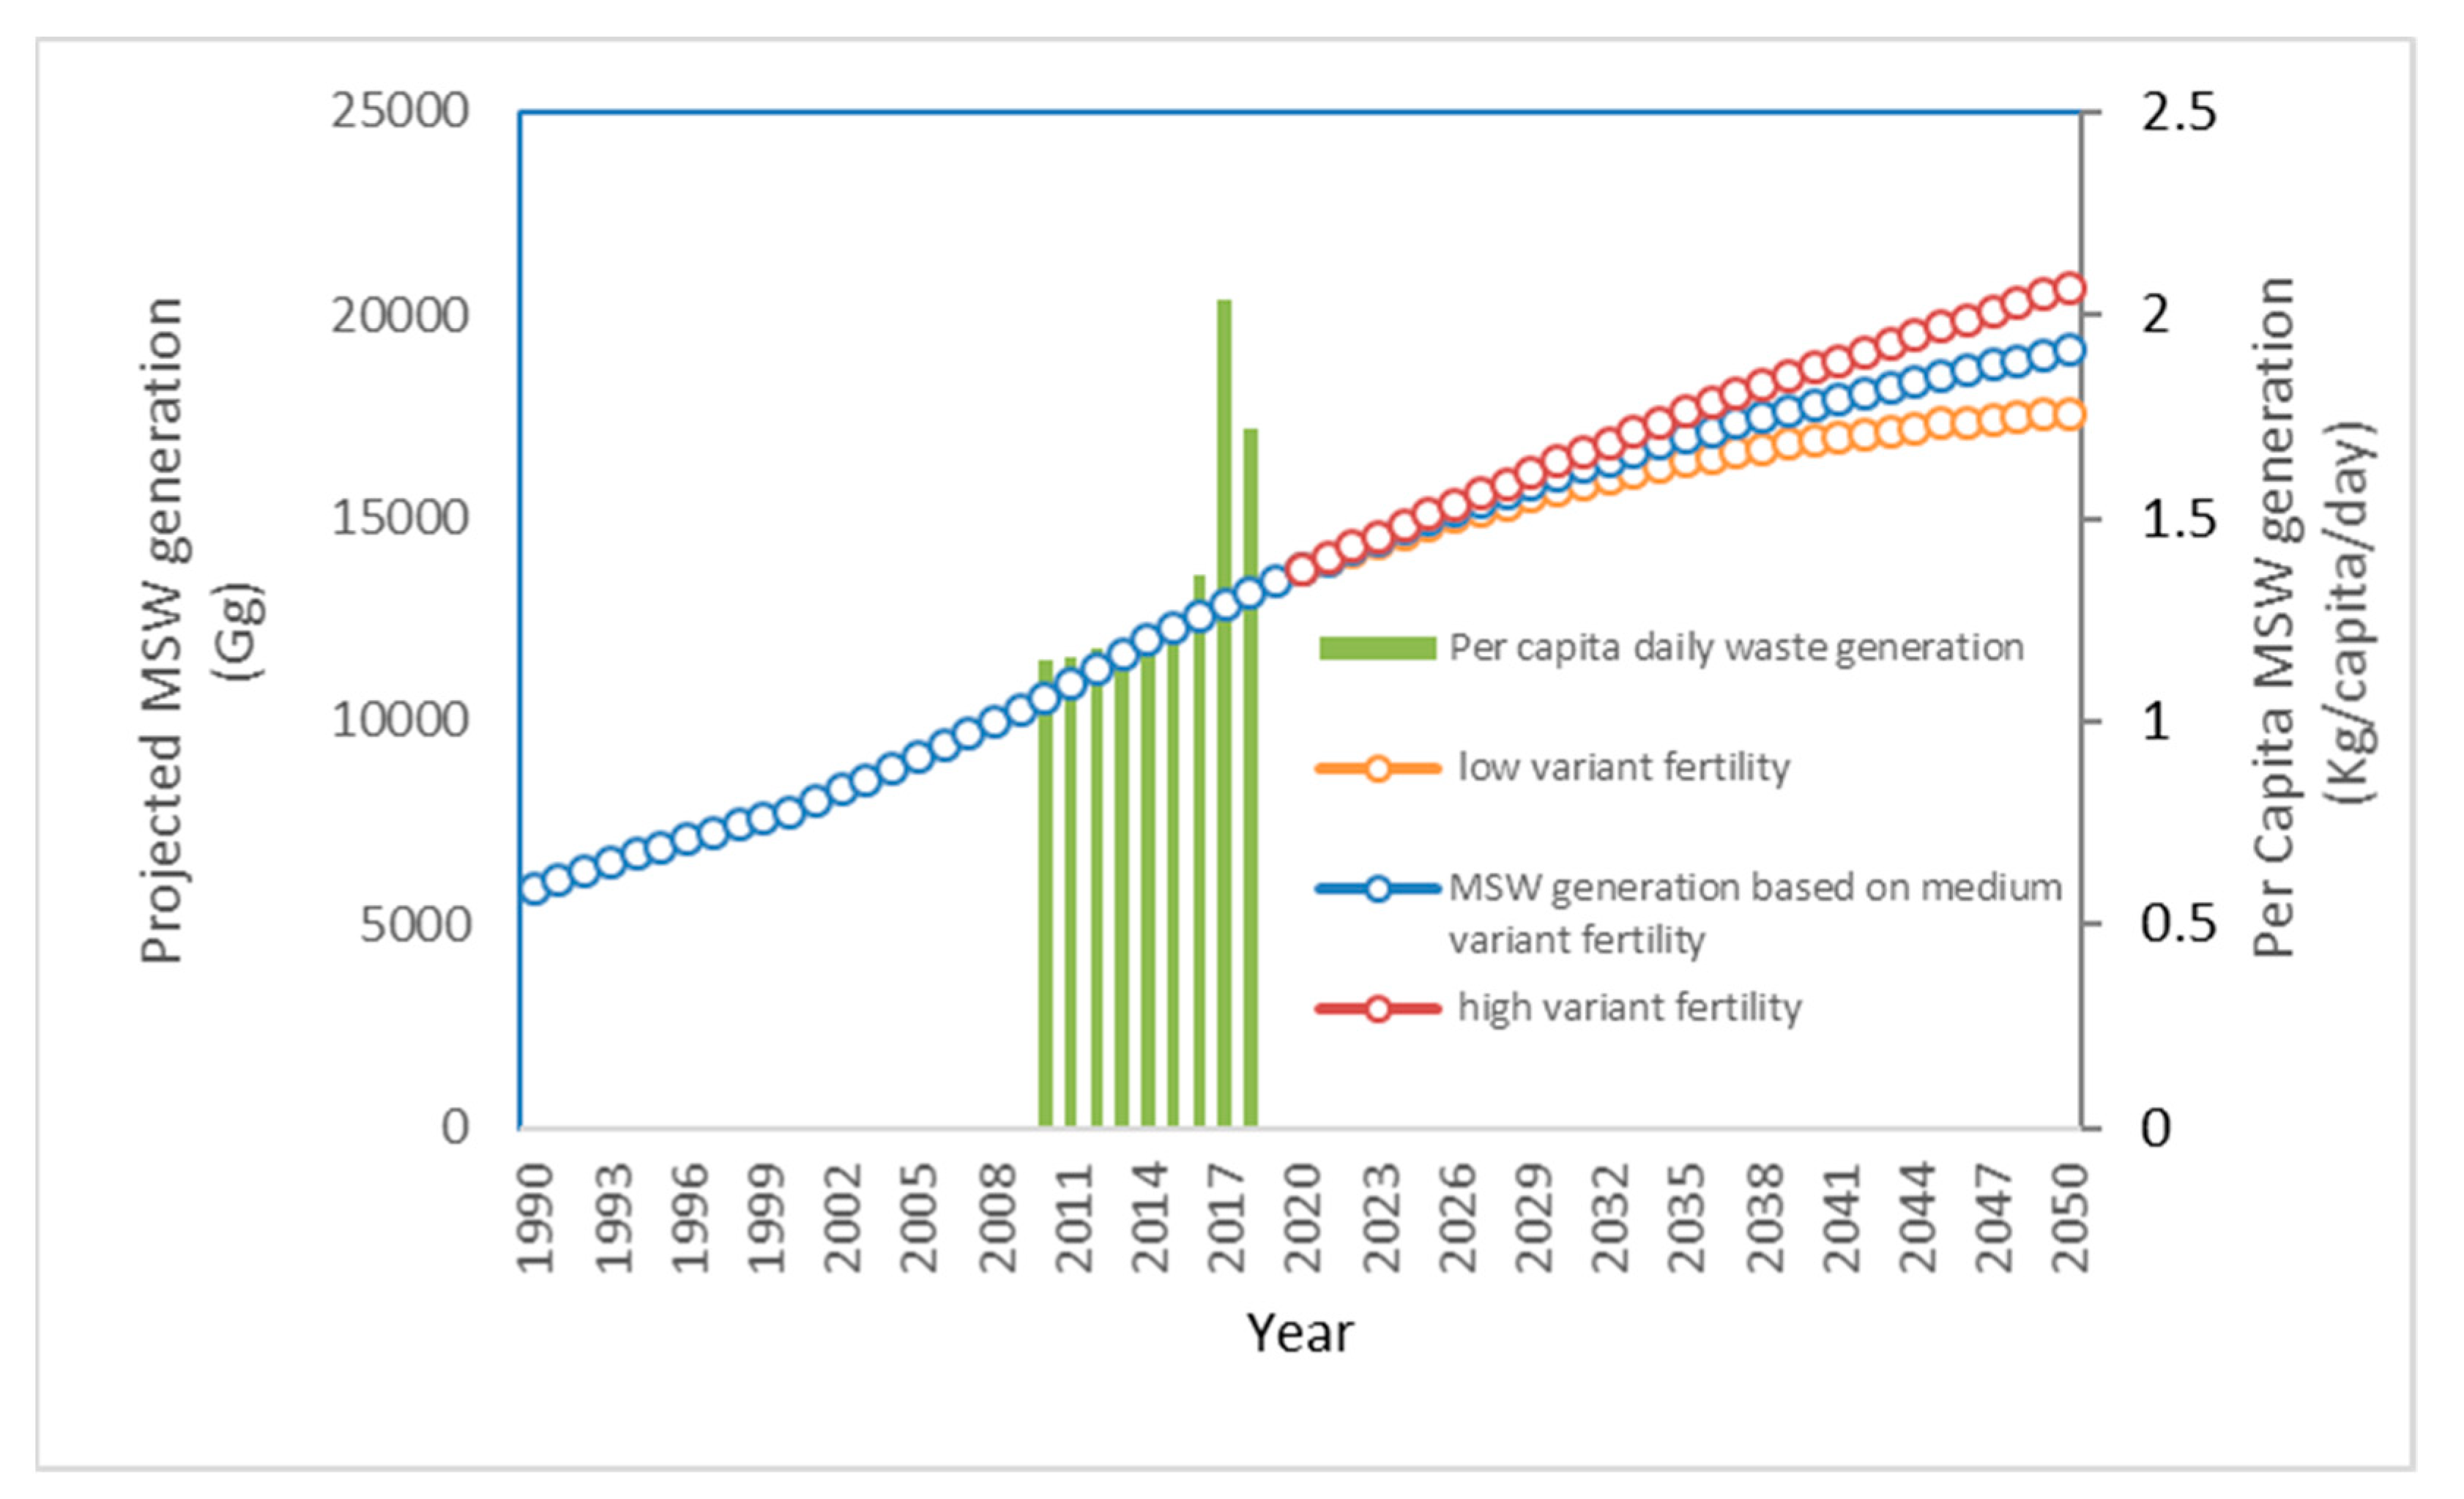
2.4. Estimation of the Urban Population, GDP, and Amount of Solid Waste
3. Results and Discussion
3.1. Causality Analysis
3.1.1. Unit Root Test
3.1.2. Johansen’s Test of Co-Integration
3.1.3. Short- and Long-Run Granger Causality (GC) Tests
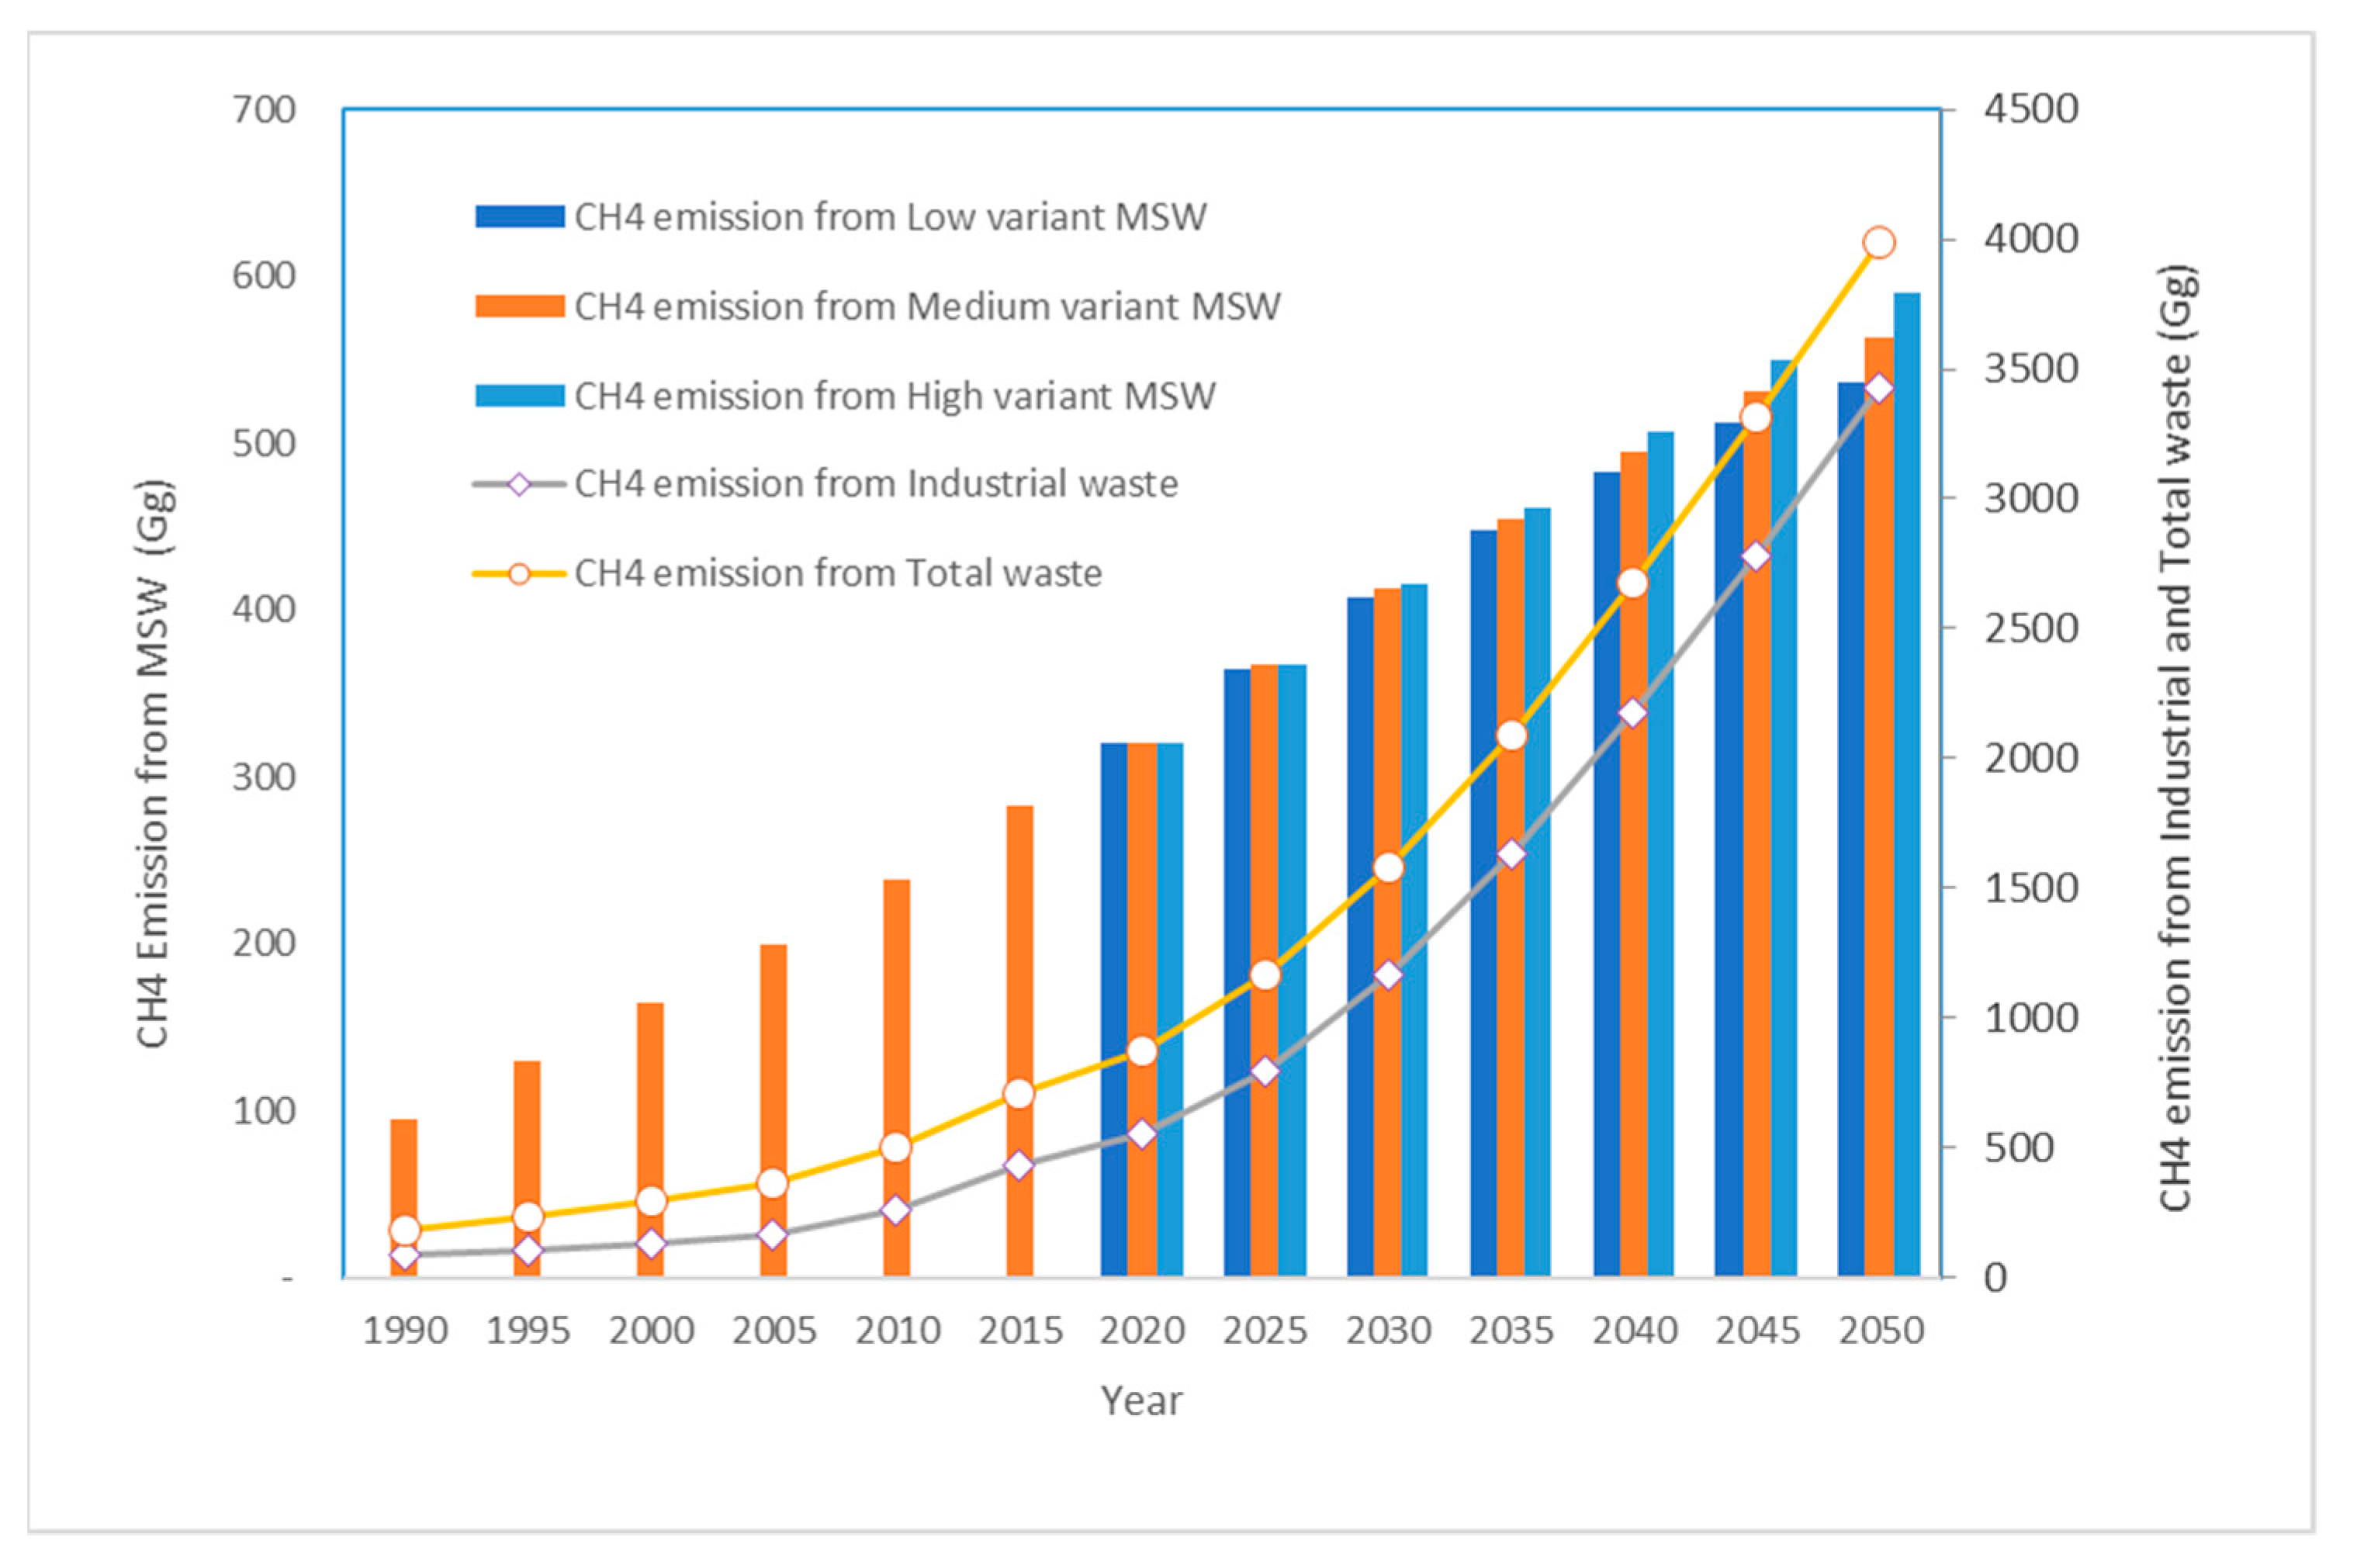
3.2. Historical CH4 Emission from MSW and Industrial Waste and Predicted Future Emission
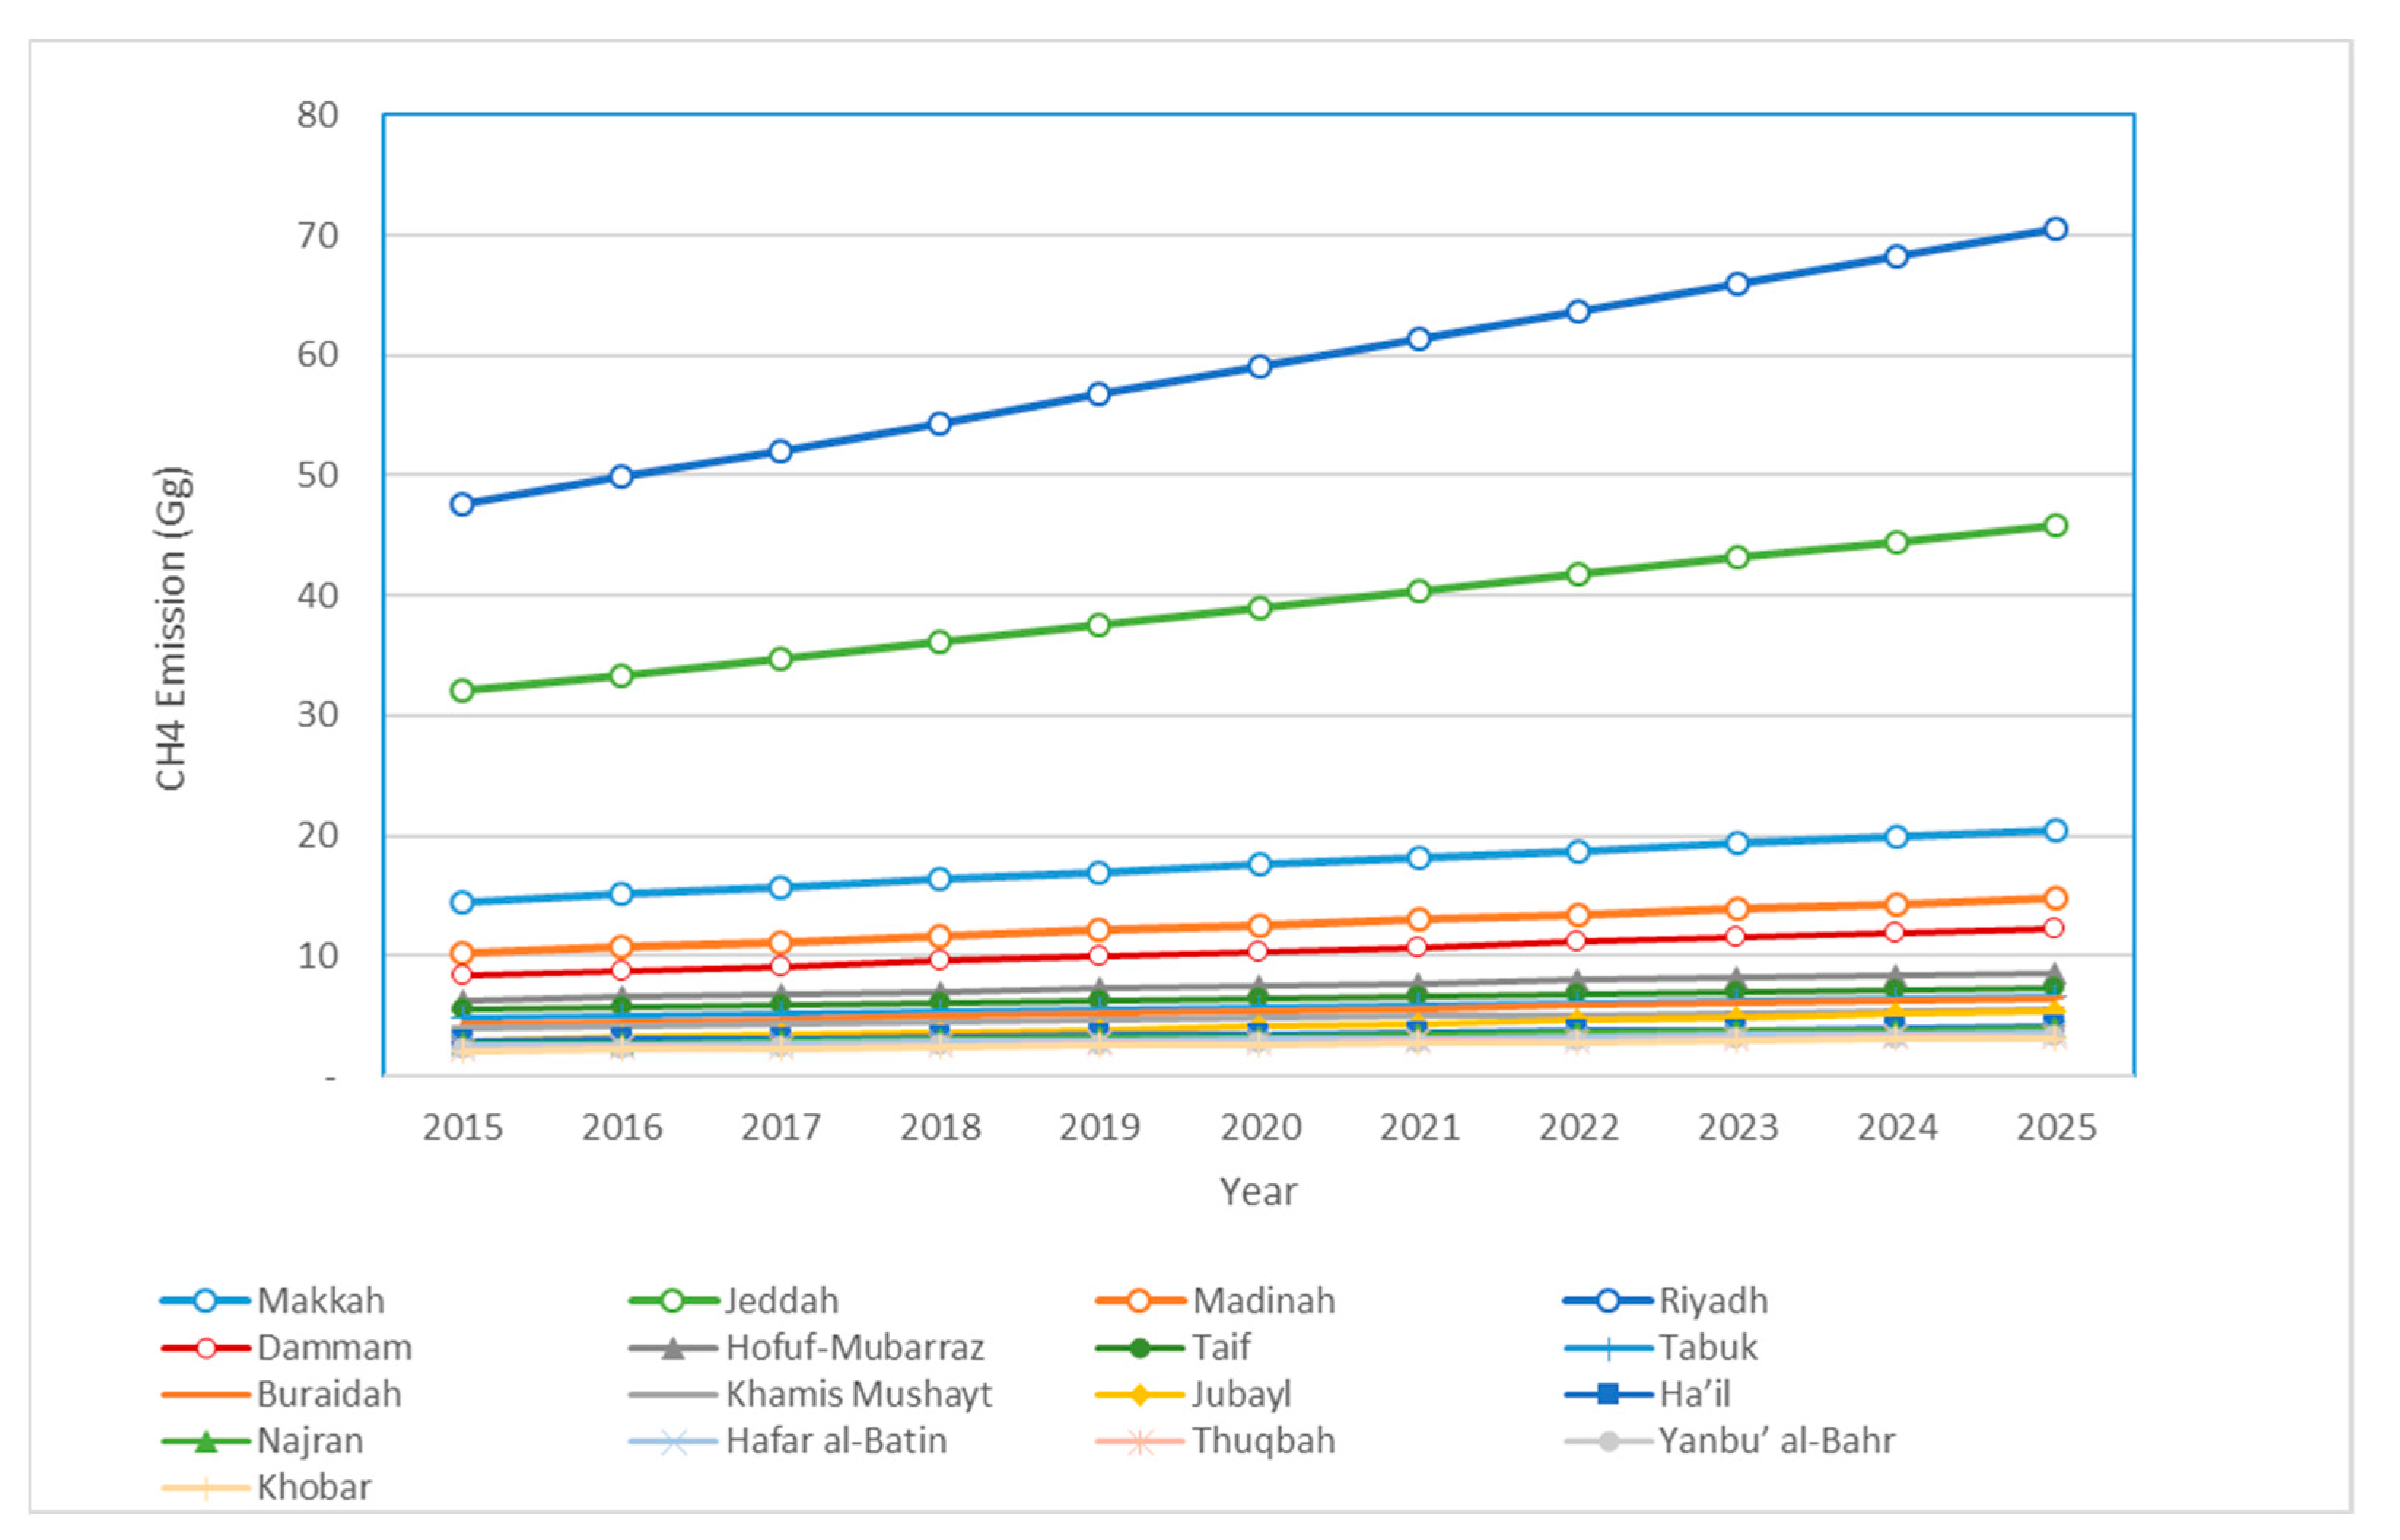
3.2.1. Impact of Urbanization on the CH4 Emission
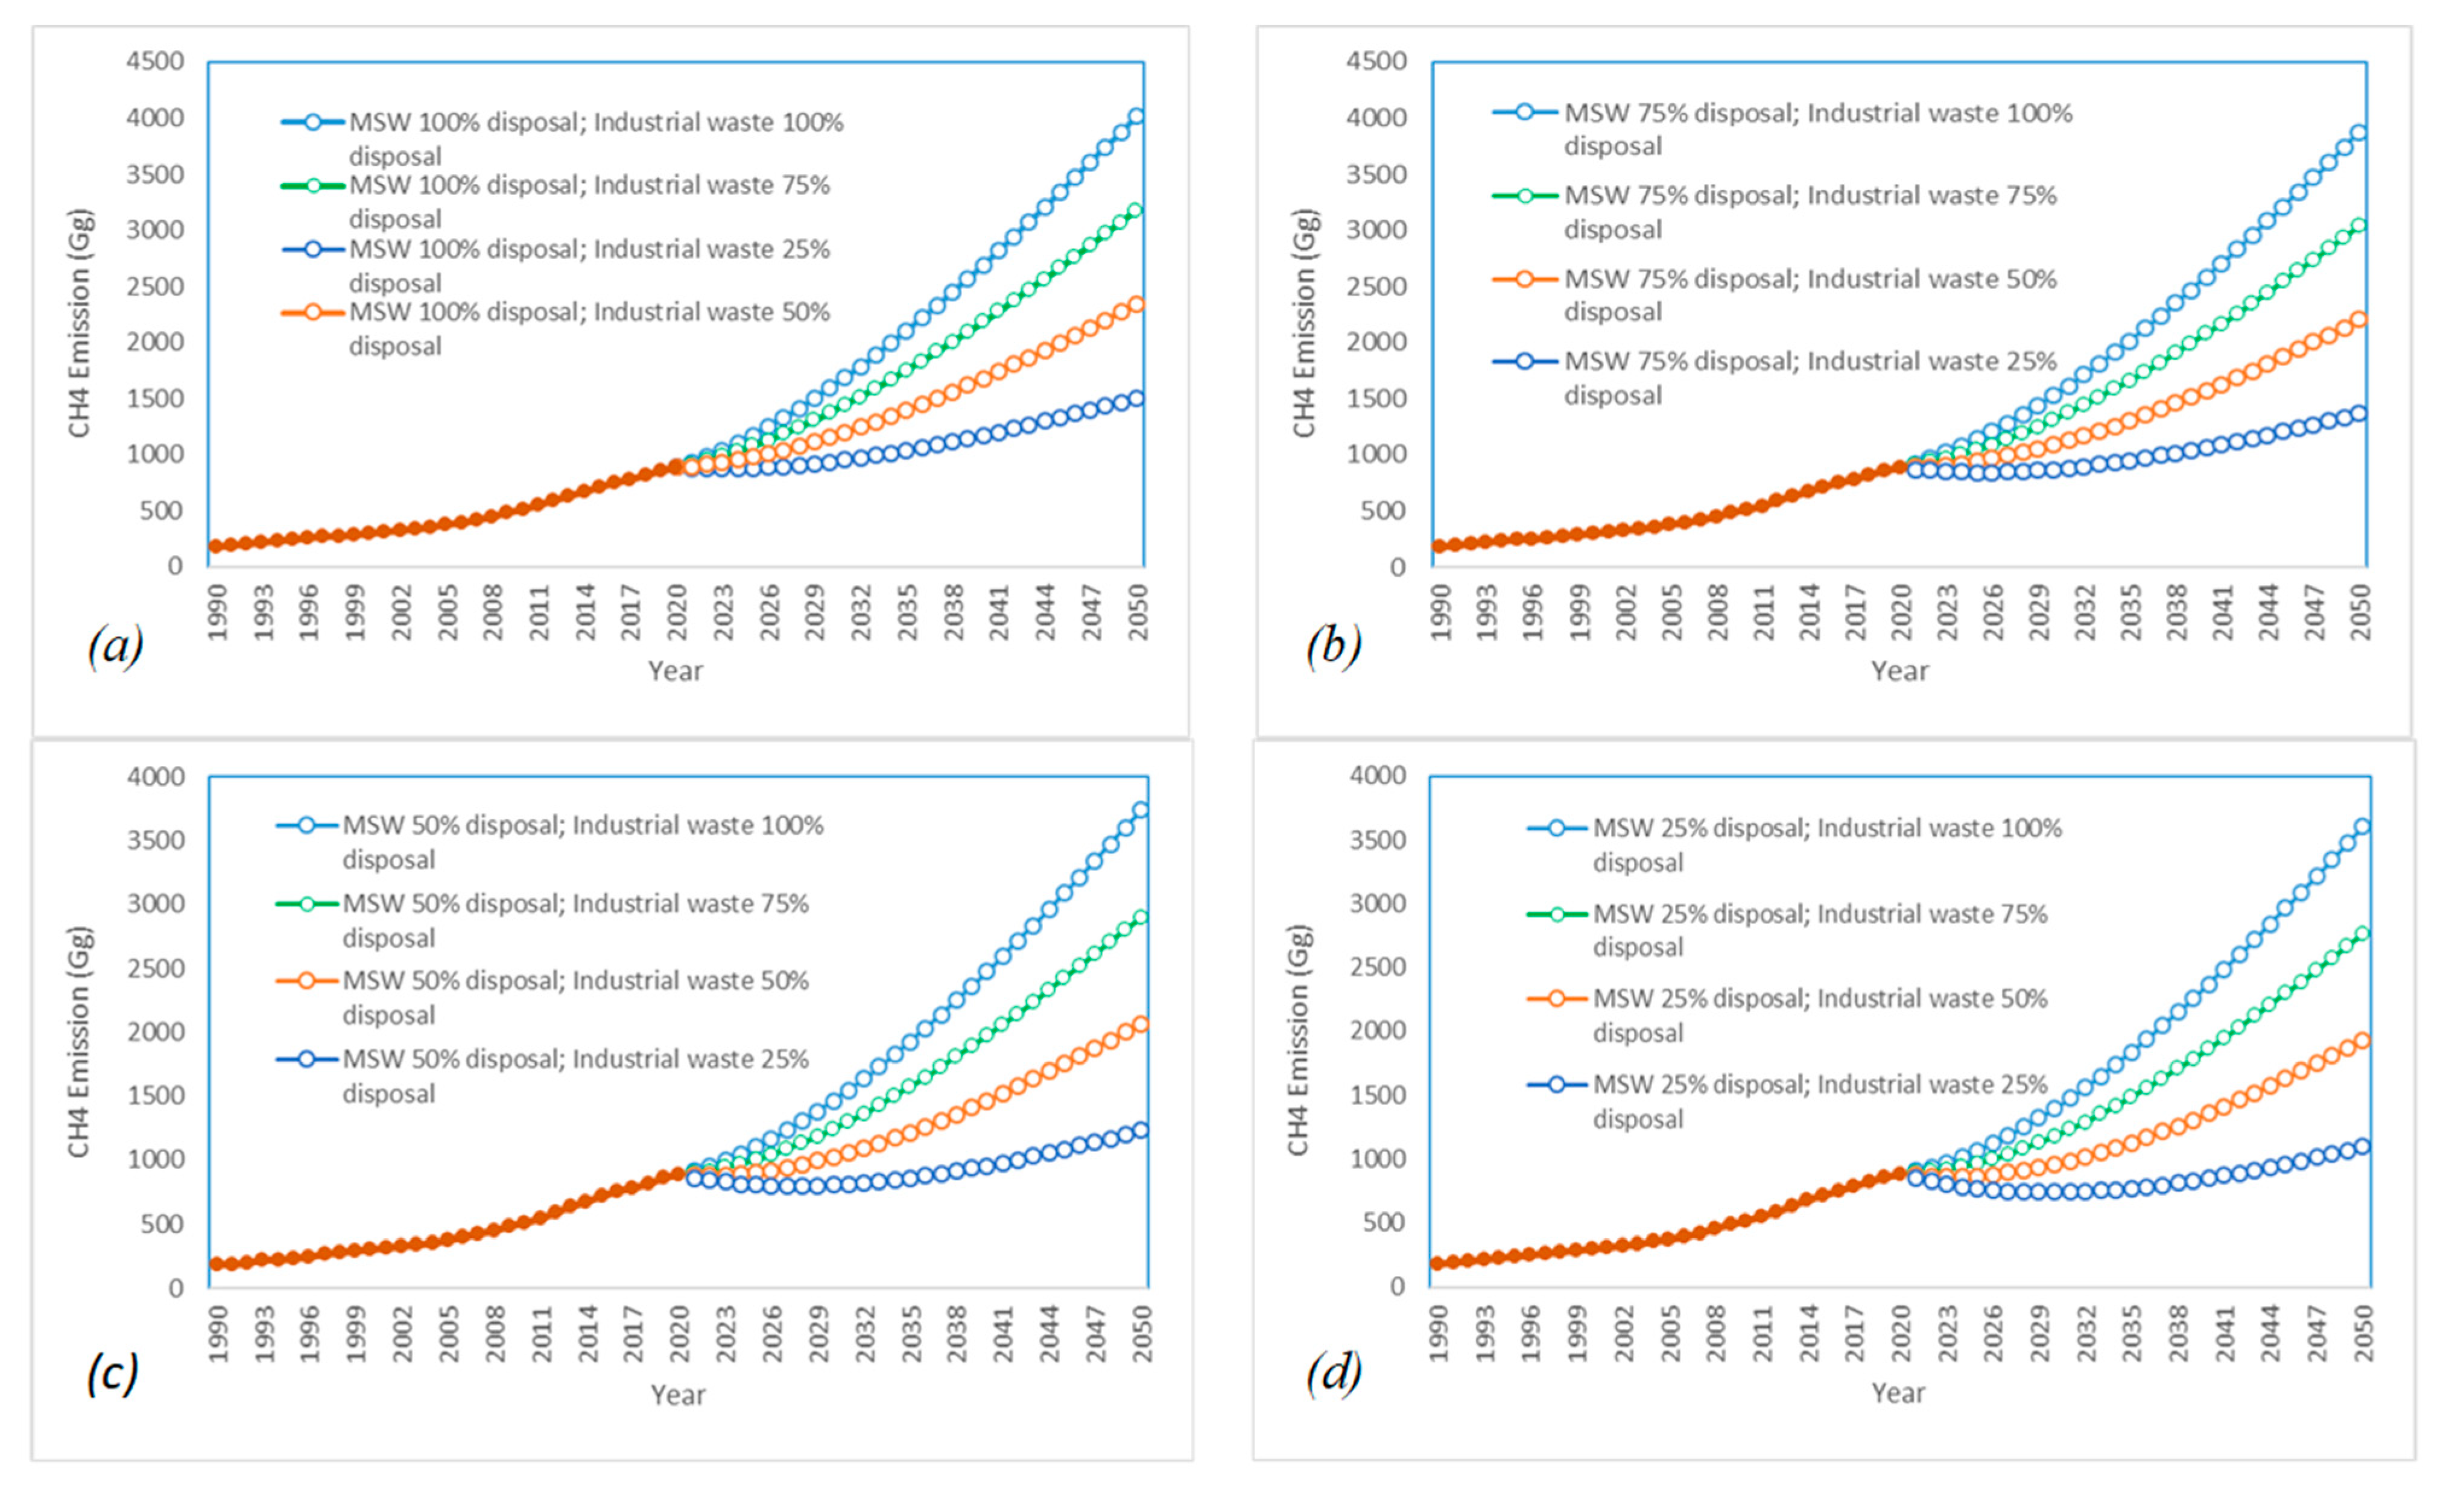
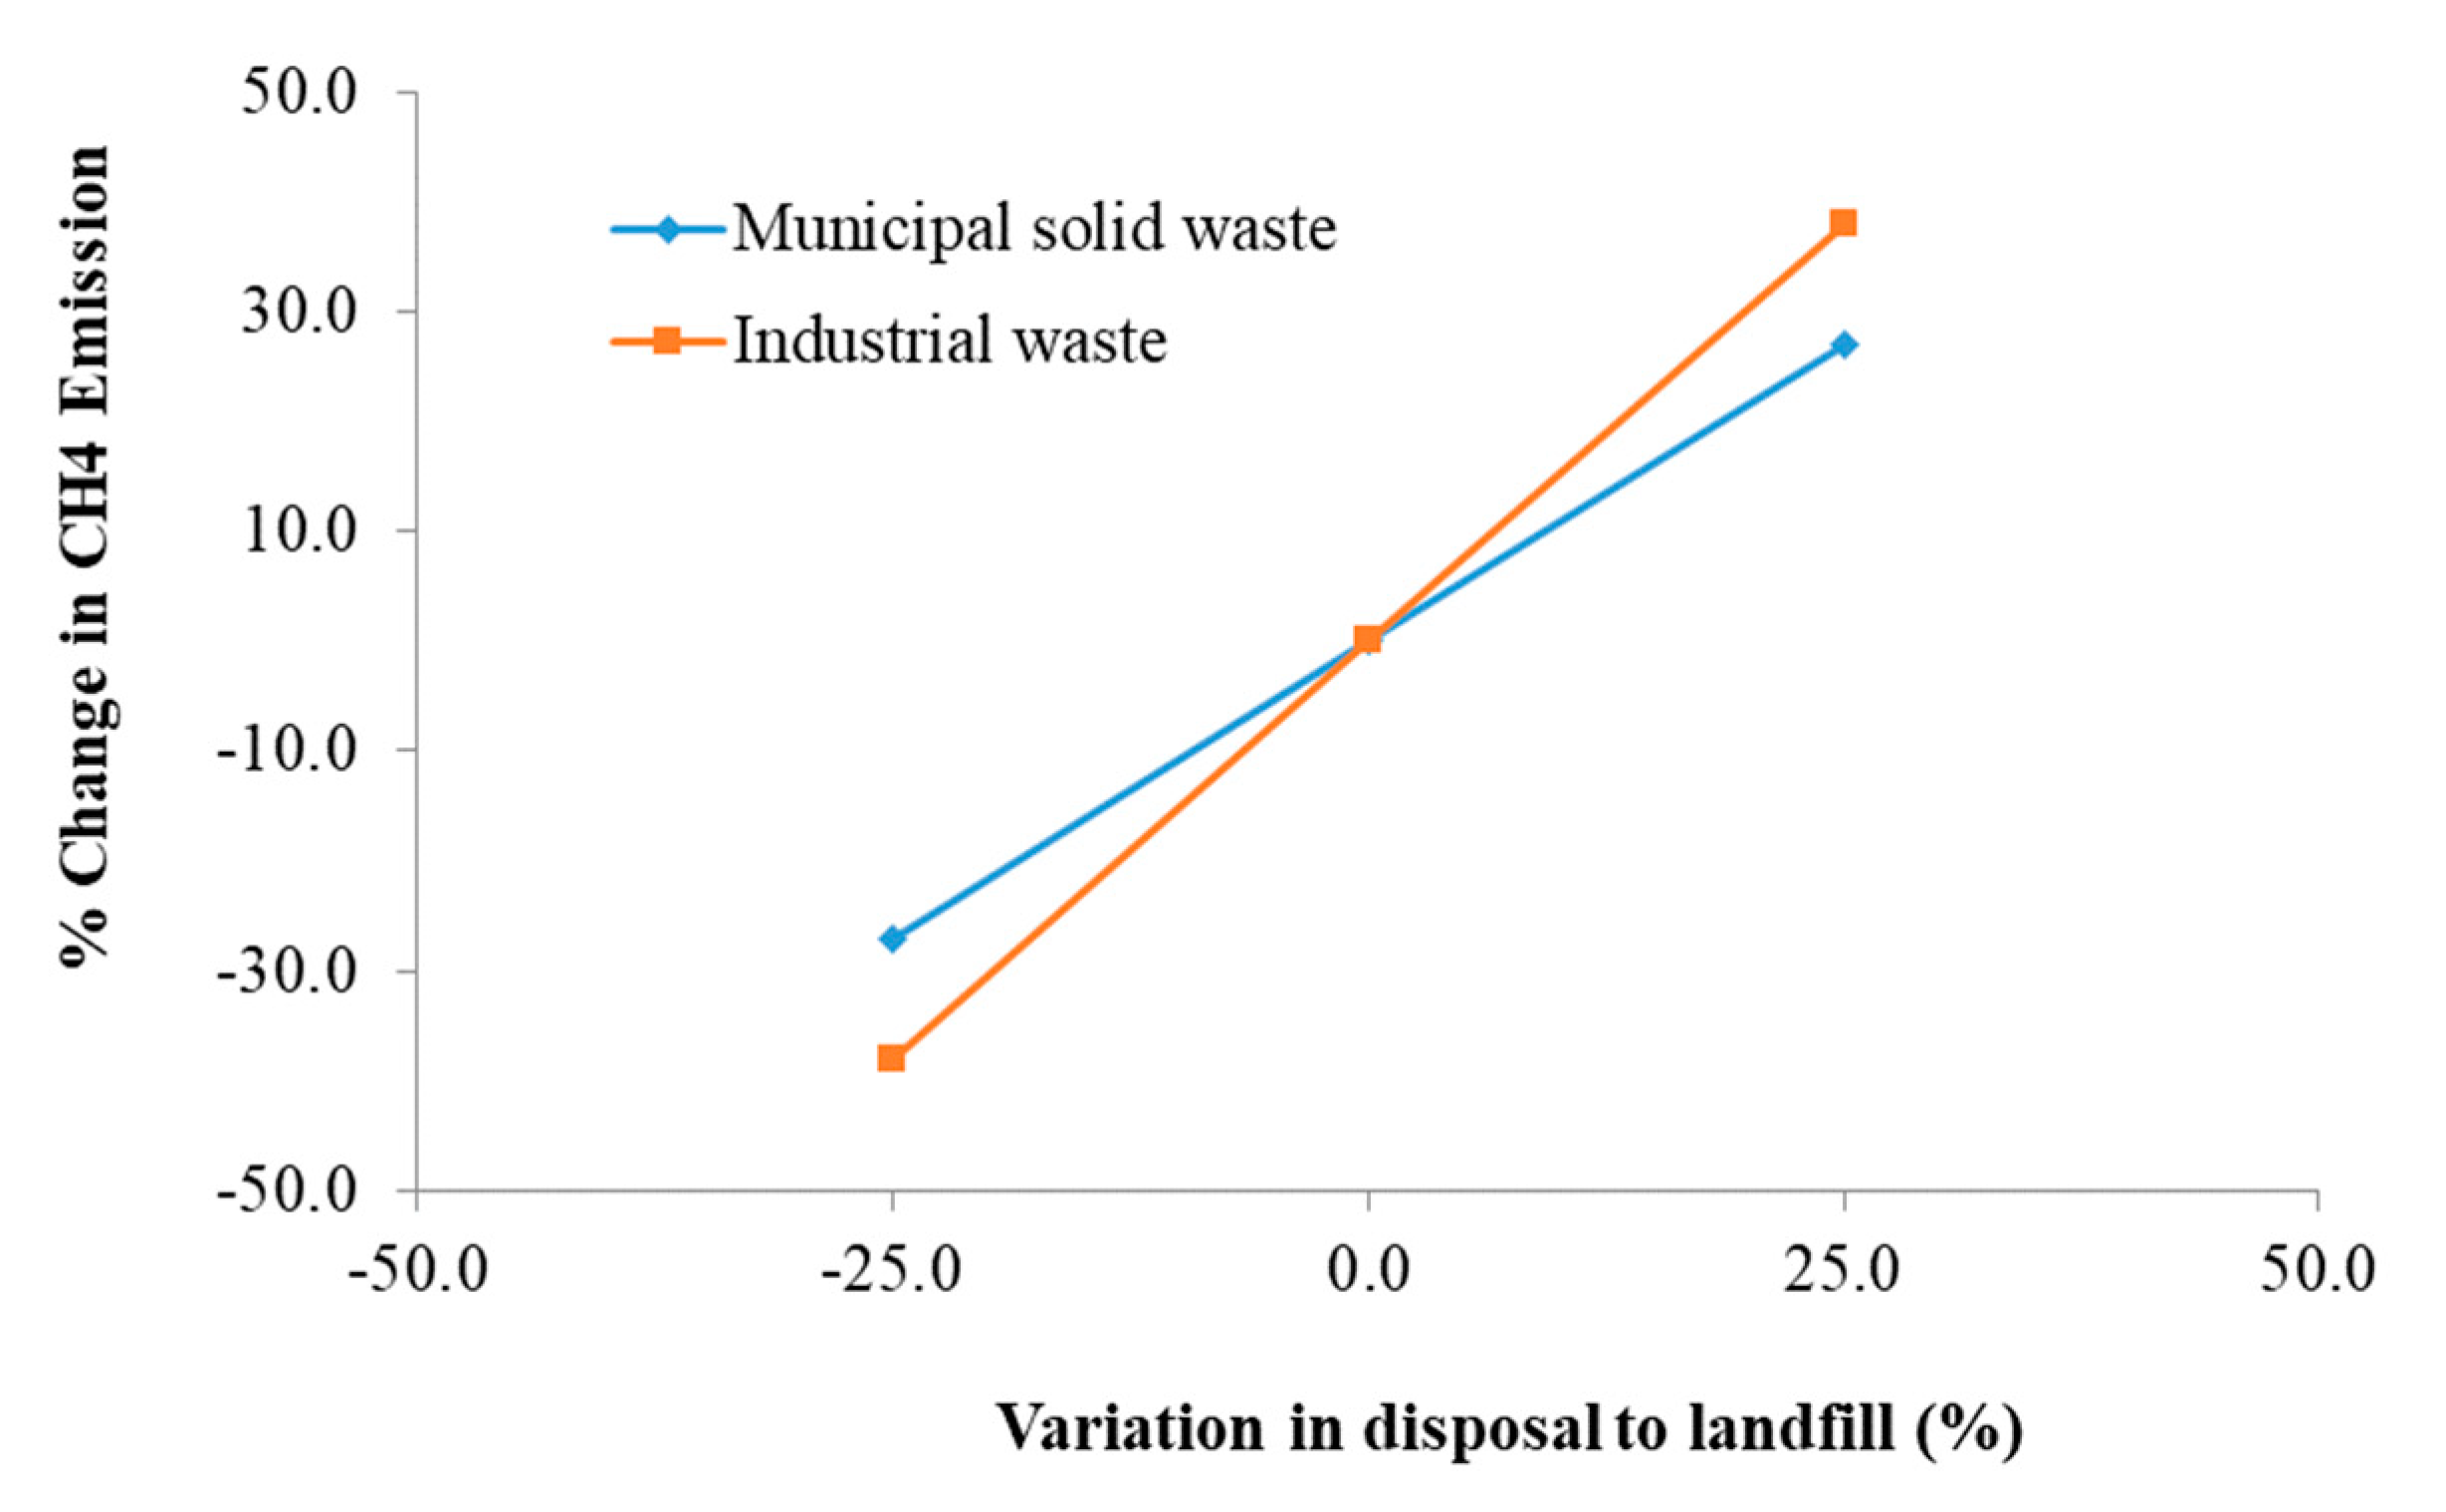
3.3. Mitigation Measures to Reduce Methane Emission
4. Conclusions
Policy Implications
Author Contributions
Funding
Data Availability Statement
Acknowledgments
Conflicts of Interest
References
- Xin, C.; Zhang, T.; Tsai, S.B.; Zhai, Y.M.; Wang, J. An empirical study on greenhouse gas emission calculations under different municipal solid waste management strategies. Appl. Sci. 2020, 10, 1673. [Google Scholar] [CrossRef]
- Hogland, W.; Marques, M. Sustainable waste management: International perspectives. In Proceedings of the International Conference on Sustainable Solid Waste Management, Chennai, India, 5–7 September 2007; pp. 1–8. [Google Scholar]
- IPCC. 2019 Refinement to the 2006 IPCC Guidelines for National Greenhouse Gas Inventories; IPCC: Geneva, Switzerland, 2019. Available online: https://www.ipcc.ch/report/2019-refinement-to-the-2006-ipcc-guidelines-for-national-greenhouse-gas-inventories/ (accessed on 21 January 2021).
- Pires, A.; Martinho, G.; Chang, N.-B. Solid waste management in European countries: A review of systems analysis techniques. J. Environ. Manag. 2011, 92, 1033–1050. [Google Scholar] [CrossRef]
- Abdoli, M.A.; Falahnezhad, M.; Behboudian, S. Multivariate Econometric Approach for Solid Waste Generation Modeling: Impact of Climate Factors. Environ. Eng. Sci. 2011, 28, 627–633. [Google Scholar] [CrossRef]
- Daskalopoulos, E.; Badr, O.; Probert, S. Municipal solid waste: A prediction methodology for the generation rate and composition in the European Union countries and the United States of America. Resour. Conserv. Recycl. 1998, 24, 155–166. [Google Scholar] [CrossRef]
- Hockett, D.; Lober, D.J.; Pilgrim, K. Determinants of Per Capita Municipal Solid Waste Generation in the Southeastern United States. J. Environ. Manag. 1995, 45, 205–217. [Google Scholar] [CrossRef]
- Dong, Y.H.; An, A.K.; Yan, Y.S.; Yi, S. Hong Kong’s greenhouse gas emissions from the waste sector and its projected changes by integrated waste management facilities. J. Clean. Prod. 2017, 149, 690–700. [Google Scholar] [CrossRef]
- Ermolaev, E.; Jarvis, Å.; Sundberg, C.; Smårs, S.; Pell, M.; Jönsson, H. Nitrous oxide and methane emissions from food waste composting at different temperatures. Waste Manag. 2015, 46, 113–119. [Google Scholar] [CrossRef] [PubMed]
- Giannakitsidou, O.; Tsagkanos, A.; Giannikos, I. Correlation of municipal solid waste production and treatment with socioeconomic indexes. Int. J. Environ. Waste Manag. 2016, 18, 303. [Google Scholar] [CrossRef]
- Vieira, V.H.A.D.M.; Matheus, D.R. The impact of socioeconomic factors on municipal solid waste generation in São Paulo, Brazil. Waste Manag. Res. 2018, 36, 79–85. [Google Scholar] [CrossRef] [PubMed]
- Hoornweg, D.; Bhada-Tata, P. What a Waste: A Global Review of Solid Waste Management; World Bank: Washington, DC, USA, 2012. [Google Scholar]
- Chandrappa, R.; Das, D. Solid Waste Management Principles and Practice; Springer: Berlin/Heidelberg, Germany, 2012. [Google Scholar]
- Rodic, L.; Scheinberg, A.; Wilson, D.C. Solid Waste Management in the World’s Cities; Wageningen University & Research: Wageningen, The Netherlands, 2010. [Google Scholar]
- Khan, D.; Kumar, A.; Samadder, S. Impact of socioeconomic status on municipal solid waste generation rate. Waste Manag. 2016, 49, 15–25. [Google Scholar] [CrossRef]
- Mahees, M.; Sigayoganathan, C.; Basnayake, B. Consumption, Solid Waste Generation and Water Pollution in Pinga Oya Catchment area. Trop. Agric. Res. 2011, 22, 239. [Google Scholar] [CrossRef]
- Lu, J.-W.; Zhang, S.; Hai, J.; Lei, M. Status and perspectives of municipal solid waste incineration in China: A comparison with developed regions. Waste Manag. 2017, 69, 170–186. [Google Scholar] [CrossRef] [PubMed]
- Kuznets, S. Economic growth and income. Am. Econ. Rev. 1955, 45, 3–29. [Google Scholar]
- Lee, S.; Kim, J.; Chong, W.O. The Causes of the Municipal Solid Waste and the Greenhouse Gas Emissions from the Waste Sector in the United States. Procedia Eng. 2016, 145, 1074–1079. [Google Scholar] [CrossRef]
- Magazzino, C.; Mele, M.; Schneider, N. The relationship between municipal solid waste and greenhouse gas emissions: Evidence from Switzerland. Waste Manag. 2020, 113, 508–520. [Google Scholar] [CrossRef]
- Namlis, K.-G.; Komilis, D. Influence of four socioeconomic indices and the impact of economic crisis on solid waste generation in Europe. Waste Manag. 2019, 89, 190–200. [Google Scholar] [CrossRef]
- Liu, J.; Li, Q.; Gu, W.; Wang, C. The Impact of Consumption Patterns on the Generation of Municipal Solid Waste in China: Evidences from Provincial Data. Int. J. Environ. Res. Public Heal. 2019, 16, 1717. [Google Scholar] [CrossRef]
- Trang, P.T.T.; Dong, H.Q.; Toan, D.Q.; Hanh, N.T.X.; Thu, N.T. The Effects of Socio-economic Factors on Household Solid Waste Generation and Composition: A Case Study in Thu Dau Mot, Vietnam. Energy Procedia 2017, 107, 253–258. [Google Scholar] [CrossRef]
- Talalaj, I.A.; Walery, M. The effect of gender and age structure on municipal waste generation in Poland. Waste Manag. 2015, 40, 3–8. [Google Scholar] [CrossRef]
- Kannangara, M.; Dua, R.; Ahmadi, L.; Bensebaa, F. Modeling and prediction of regional municipal solid waste generation and diversion in Canada using machine learning approaches. Waste Manag. 2018, 74, 3–15. [Google Scholar] [CrossRef] [PubMed]
- Song, Q.; Li, J.; Zeng, X. Minimizing the increasing solid waste through zero waste strategy. J. Clean. Prod. 2015, 104, 199–210. [Google Scholar] [CrossRef]
- Ari, I.; Şentürk, H. The relationship between GDP and methane emissions from solid waste: A panel data analysis for the G7. Sustain. Prod. Consum. 2020, 23, 282–290. [Google Scholar] [CrossRef]
- Chen, Y.-C.; Wu, W.-F. Constructing an effective prevention mechanism for MSW lifecycle using failure mode and effects analysis. Waste Manag. 2015, 46, 646–652. [Google Scholar] [CrossRef] [PubMed]
- Yang, D.; Xu, L.; Gao, X.; Guo, Q.; Huang, N. Inventories and reduction scenarios of urban waste-related greenhouse gas emissions for management potential science of the total environment inventories and reduction scenarios of urban waste-related greenhouse gas emissions for management potential. Sci. Total Environ. 2018, 626, 727–736. [Google Scholar] [CrossRef] [PubMed]
- Turan, N.G.; Çoruh, S.; Akdemir, A.; Ergun, O.N. Municipal solid waste management strategies in Turkey. Waste Manag. 2009, 29, 465–469. [Google Scholar] [CrossRef]
- Lima, R.M.; Santos, A.H.; Pereira, C.R.; Flauzino, B.K.; Pereira, A.C.O.; Nogueira, F.J.; Valverde, J.A.R. Spatially distributed potential of landfill biogas production and electric power generation in Brazil. Waste Manag. 2018, 74, 323–334. [Google Scholar] [CrossRef] [PubMed]
- USEPA. Landfill Methane Outreach Program (LMOP), Landfill Gas Energy Project Development Handbook; USEPA: Washington, DC, USA, 2020.
- Jha, A.K.; Sharma, C.; Singh, N.; Ramesh, R.; Purvaja, R.; Gupta, P.K. Greenhouse gas emissions from municipal solid waste management in Indian mega-cities: A case study of Chennai landfill sites. Chemosphere 2008, 71, 750–758. [Google Scholar] [CrossRef]
- Kormi, T.; Ali, N.B.H.; Abichou, T.; Green, R. Estimation of landfill methane emissions using stochastic search methods. Atmos. Pollut. Res. 2017, 8, 597–605. [Google Scholar] [CrossRef]
- Themelis, N.J.; Ulloa, P.A. Methane generation in landfills. Renew. Energy 2007, 32, 1243–1257. [Google Scholar] [CrossRef]
- Silva, T.R.; Barros, R.M.; Filho, G.L.T.; Dos Santos, I.F.S. Methodology for the determination of optimum power of a Thermal Power Plant (TPP) by biogas from sanitary landfill. Waste Manag. 2017, 65, 75–91. [Google Scholar] [CrossRef]
- Lucernoni, F.; Capelli, L.; Sironi, S. Comparison of different approaches for the estimation of odour emissions from landfill surfaces. Waste Manag. 2017, 63, 345–353. [Google Scholar] [CrossRef]
- World Bank. Data Bank of World Development Indicators 2020. Available online: https://data.worldbank.org/country/SA (accessed on 5 November 2020).
- United Nations. World Population Prospects 2019: Methodology of the United Nations Population Estimates and Projections (ST/ESA/SER.A/425). Department of Economic and Social Affairs, Population Division 2019. Available online: https://population.un.org/wpp/Publications/Files/WPP2019_Methodology.pdf (accessed on 5 November 2020).
- Grazhdani, D. Assessing the variables affecting on the rate of solid waste generation and recycling: An empirical analysis in Prespa Park. Waste Manag. 2016, 48, 3–13. [Google Scholar] [CrossRef]
- Hasan, A.; Frame, D.J.; Chapman, R.; Archie, K.M. Emissions from the road transport sector of New Zealand: Key drivers and challenges. Environ. Sci. Pollut. Res. 2019, 26, 23937–23957. [Google Scholar] [CrossRef]
- Hasan, M.A. Understanding the Costs, Benefits, Mitigation Potentials and Ethical Aspects of New Zealand’s Transport Emissions Reduction Policies by Md Arif Hasan; Victoria University of Wellington: Auckland, New Zealand, 2020. [Google Scholar]
- Arltová, M.; Fedorová, D. Selection of unit root test on the basis of length of the time series and value of AR(1) parameter. Statistika 2016, 96, 47–64. [Google Scholar]
- Azlina, A.; Law, S.H.; Mustapha, N.H.N. Dynamic linkages among transport energy consumption, income and CO2 emission in Malaysia. Energy Policy 2014, 73, 598–606. [Google Scholar] [CrossRef]
- Gharaibeh, E.S.; Haimour, N.M.; Akash, B.A. Evaluation of Current Municipal Solid Waste Practice and Management for Al-Ahsa, Saudi Arabia. Int. J. Sustain. Water Environ. Syst. 2011, 2, 103–110. [Google Scholar] [CrossRef]
- CDM. Clean Development Mechanism. United Nations Framework Convention on Climate Change 2020. Available online: https://cdm.unfccc.int/Projects/DB/DNV-CUK1343105327.39/view (accessed on 5 November 2020).
- Adhikari, B.K.; Barrington, S.; Martinez, J.; King, S. Characterization of food waste and bulking agents for composting. Waste Manag. 2008, 28, 795–804. [Google Scholar] [CrossRef] [PubMed]
- Khan, M.S.M.; Kaneesamkandi, Z. Biodegradable waste to biogas: Renewable energy option for the Kingdom of Saudi Arabia. Int. J. Innov. Appl. Stud. 2013, 4, 101–113. [Google Scholar]
- GAS. General Authority of Statistics in Saudi Arabia. Percentage of Disposal Methods for Industrial Waste in Saudi Arabia (Jubail) during the Period 2010–2018. Available online: https://www.stats.gov.sa/sites/default/files/percentage_of_disposal_methods_for_industrial_waste_in_saudi_arabia.pdf (accessed on 5 November 2020).
- Price Water Cooper. The World in 2050- will the shift in Global Economic Power Continue? 2020. Available online: https://www.pwc.com/gx/en/issues/the-economy/assets/world-in-2050-february-2015.pdf (accessed on 5 November 2020).
- United Nations. World Urbanization Prospects: The 2018 Revision; United Nations: New York, NY, USA, 2018.
- GAS. General Authority of Statistics in Saudi Arabia. Per Capita Waste Generation in Saudi Arabia during the Period 2010–2018. Available online: https://www.stats.gov.sa/en/node/10131 (accessed on 5 November 2020).
- Sedek, E.-S.; Seif, A.; Hakami, B.A. Household solid waste composition and management in jeddah city, saudi arabia: A planning model pollution view project construction material view project household solid waste composition and management in Jeddah city, Saudi Arabia: A planning model. Int. Res. J. Environ. Sci. Int. Sci. Congr. Assoc. 2015, 4, 1–10. [Google Scholar]
- Alsabbagh, M. Mitigation of CO2e Emissions from the Municipal Solid Waste Sector in the Kingdom of Bahrain. Climate 2019, 7, 100. [Google Scholar] [CrossRef]
- VISION 2030. The Saudi 2030 Vision Theme 2020. Available online: https://vision2030.gov.sa/en (accessed on 21 January 2021).
- UN-Habitat. Future Saudi Cities Programme, Saudi Cities Report 2019. Available online: https://unhabitat.org/sites/default/files/2020/05/saudi_city_report.english.pdf (accessed on 17 November 2020).
- Wang, J.; Li, Z.; Tam, V.W. Identifying best design strategies for construction waste minimization. J. Clean. Prod. 2015, 92, 237–247. [Google Scholar] [CrossRef]
- Luz, F.C.; Rocha, M.H.; Lora, E.E.S.; Venturini, O.J.; Andrade, R.V.; Leme, M.M.V.; Del Olmo, O.A. Techno-economic analysis of municipal solid waste gasification for electricity generation in Brazil. Energy Convers. Manag. 2015, 103, 321–337. [Google Scholar] [CrossRef]
- Chen, Y.-C. Evaluating greenhouse gas emissions and energy recovery from municipal and industrial solid waste using waste-to-energy technology. J. Clean. Prod. 2018, 192, 262–269. [Google Scholar] [CrossRef]
- Kamuk, B.; Haukohl, J. Waste to Energy in Low and Medium Income Countries; ISWA: Vienna, Austria, 2013. [Google Scholar]
- Rehan, M.; Nizami, A.-S.; Asam, Z.-U.-Z.; Ouda, O.K.; Gardy, J.; Raza, G.; Naqvi, M.; Ismail, I.M. Waste to Energy: A Case Study of Madinah City. Energy Procedia 2017, 142, 688–693. [Google Scholar] [CrossRef]
- Ouda, O.K.; Cekirge, H.M.; Raza, S.A. An assessment of the potential contribution from waste-to-energy facilities to electricity demand in Saudi Arabia. Energy Convers. Manag. 2013, 75, 402–406. [Google Scholar] [CrossRef]
- Hadidi, L.A.; Omer, M.M. A financial feasibility model of gasification and anaerobic digestion waste-to-energy (WTE) plants in Saudi Arabia. Waste Manag. 2017, 59, 90–101. [Google Scholar] [CrossRef]
- Sodeifian, G.; Raji, M.; Asghari, M.; Rezakazemi, M.; Dashti, A. Polyurethane-SAPO-34 mixed matrix membrane for CO2/CH4 and CO2/N2 separation. Chin. J. Chem. Eng. 2019, 27, 322–334. [Google Scholar] [CrossRef]
- Yaman, C.; Anil, I.; Alagha, O. Potential for greenhouse gas reduction and energy recovery from MSW through different waste management technologies. J. Clean. Prod. 2020, 264, 121432. [Google Scholar] [CrossRef]
- Visser, W.; McDonough, W.; Braungart, M. Cradle to Cradle; Greenleaf Publishing Limited: Sheffield, UK, 2013. [Google Scholar]
- Winans, K.; Kendall, A.; Deng, H. The history and current applications of the circular economy concept. Renew. Sustain. Energy Rev. 2017, 68, 825–833. [Google Scholar] [CrossRef]
- Liu, Z.; Adams, M.; Cote, R.P.; Chen, Q.; Wu, R.; Wen, Z.; Liu, W.; Dong, L. How does circular economy respond to greenhouse gas emissions reduction: An analysis of Chinese plastic recycling industries. Renew. Sustain. Energy Rev. 2018, 91, 1162–1169. [Google Scholar] [CrossRef]
- Iaquaniello, G.; Centi, G.; Salladini, A.A.; Palo, E.; Perathoner, S. Waste to Chemicals for a Circular Economy. Chem. A Eur. J. 2018, 24, 11831–11839. [Google Scholar] [CrossRef] [PubMed]
- Foden, M.; Browne, A.L.; Evans, D.M.; Sharp, L.; Watson, M. The water–energy–food nexus at home: New opportunities for policy interventions in household sustainability. Geogr. J. 2018, 185, 406–418. [Google Scholar] [CrossRef]


| Data (Symbol) | Description | Period | Unit | Source |
|---|---|---|---|---|
| CH4 emissions from municipal solid waste (MSW) | This includes CH4 emissions generated from municipal solid wastes in Saudi Arabia | 1970–2019 | Gigagram (Gg) | IPCC [3] |
| CH4 emissions from industrial solid waste (ISW) | This includes CH4 emissions generated from industrial solid wastes in Saudi Arabia | 1970–2019 | Gigagram (Gg) | IPCC [3] |
| Older population (OP) | This presents the total number of population at the age of 60 and over | 1970–2019 | Years | World Bank [38] |
| Literacy rate (LR) | This shows the percentage of people who can read and write in Saudi Arabia | 1970–2019 | % | World Bank [38] |
| Unemployment rate (UR) | This shows the share of Saudi Arabia’s labor force who are unemployed but seeking employment opportunities | 1970–2019 | % | World Bank [38] |
| Foreign direct investment inflows (FDI) | This presents the monetary value of inward direct investments made by non-resident investors in Saudi Arabia | 1970–2019 | Current USD | World Bank [38] |
| Urban population (UPOP) | The total number of population living in urban areas | 1970–2019 | Person | United Nations Statistics Division [39] |
| GDP per capita (GDPPC) | The monetary value of all domestic products produced in a year in Saudi Arabia, divided by the country’s population | 1970–2019 | US dollar (USD) | World Bank [38] |
| Parameters | Assumptions/Value/Time Series | Data Source |
|---|---|---|
| Starting year | 1970 | |
| Urban population (in millions) | 1970–2050 | United Nations [39] |
| Total gross domestic product (GDP) (at current USD) | 1970–2019 | World Bank [38] |
| 2020–2050 | Price Water Cooper [50] | |
| Period of methane calculation | 1970–2050 | |
| Per capita waste generation | 470 kg/capita/year | [3,53] |
| % MSW disposed to landfill | 96% | [3] |
| Fraction of methane in developed gas | 0.5 | |
| C to CH4 conversion factor | 16/12 | |
| Oxidation factor | 0 (for managed landfill) | |
| Methane correction factor | 0.6 | |
| Delay time | 6 months |
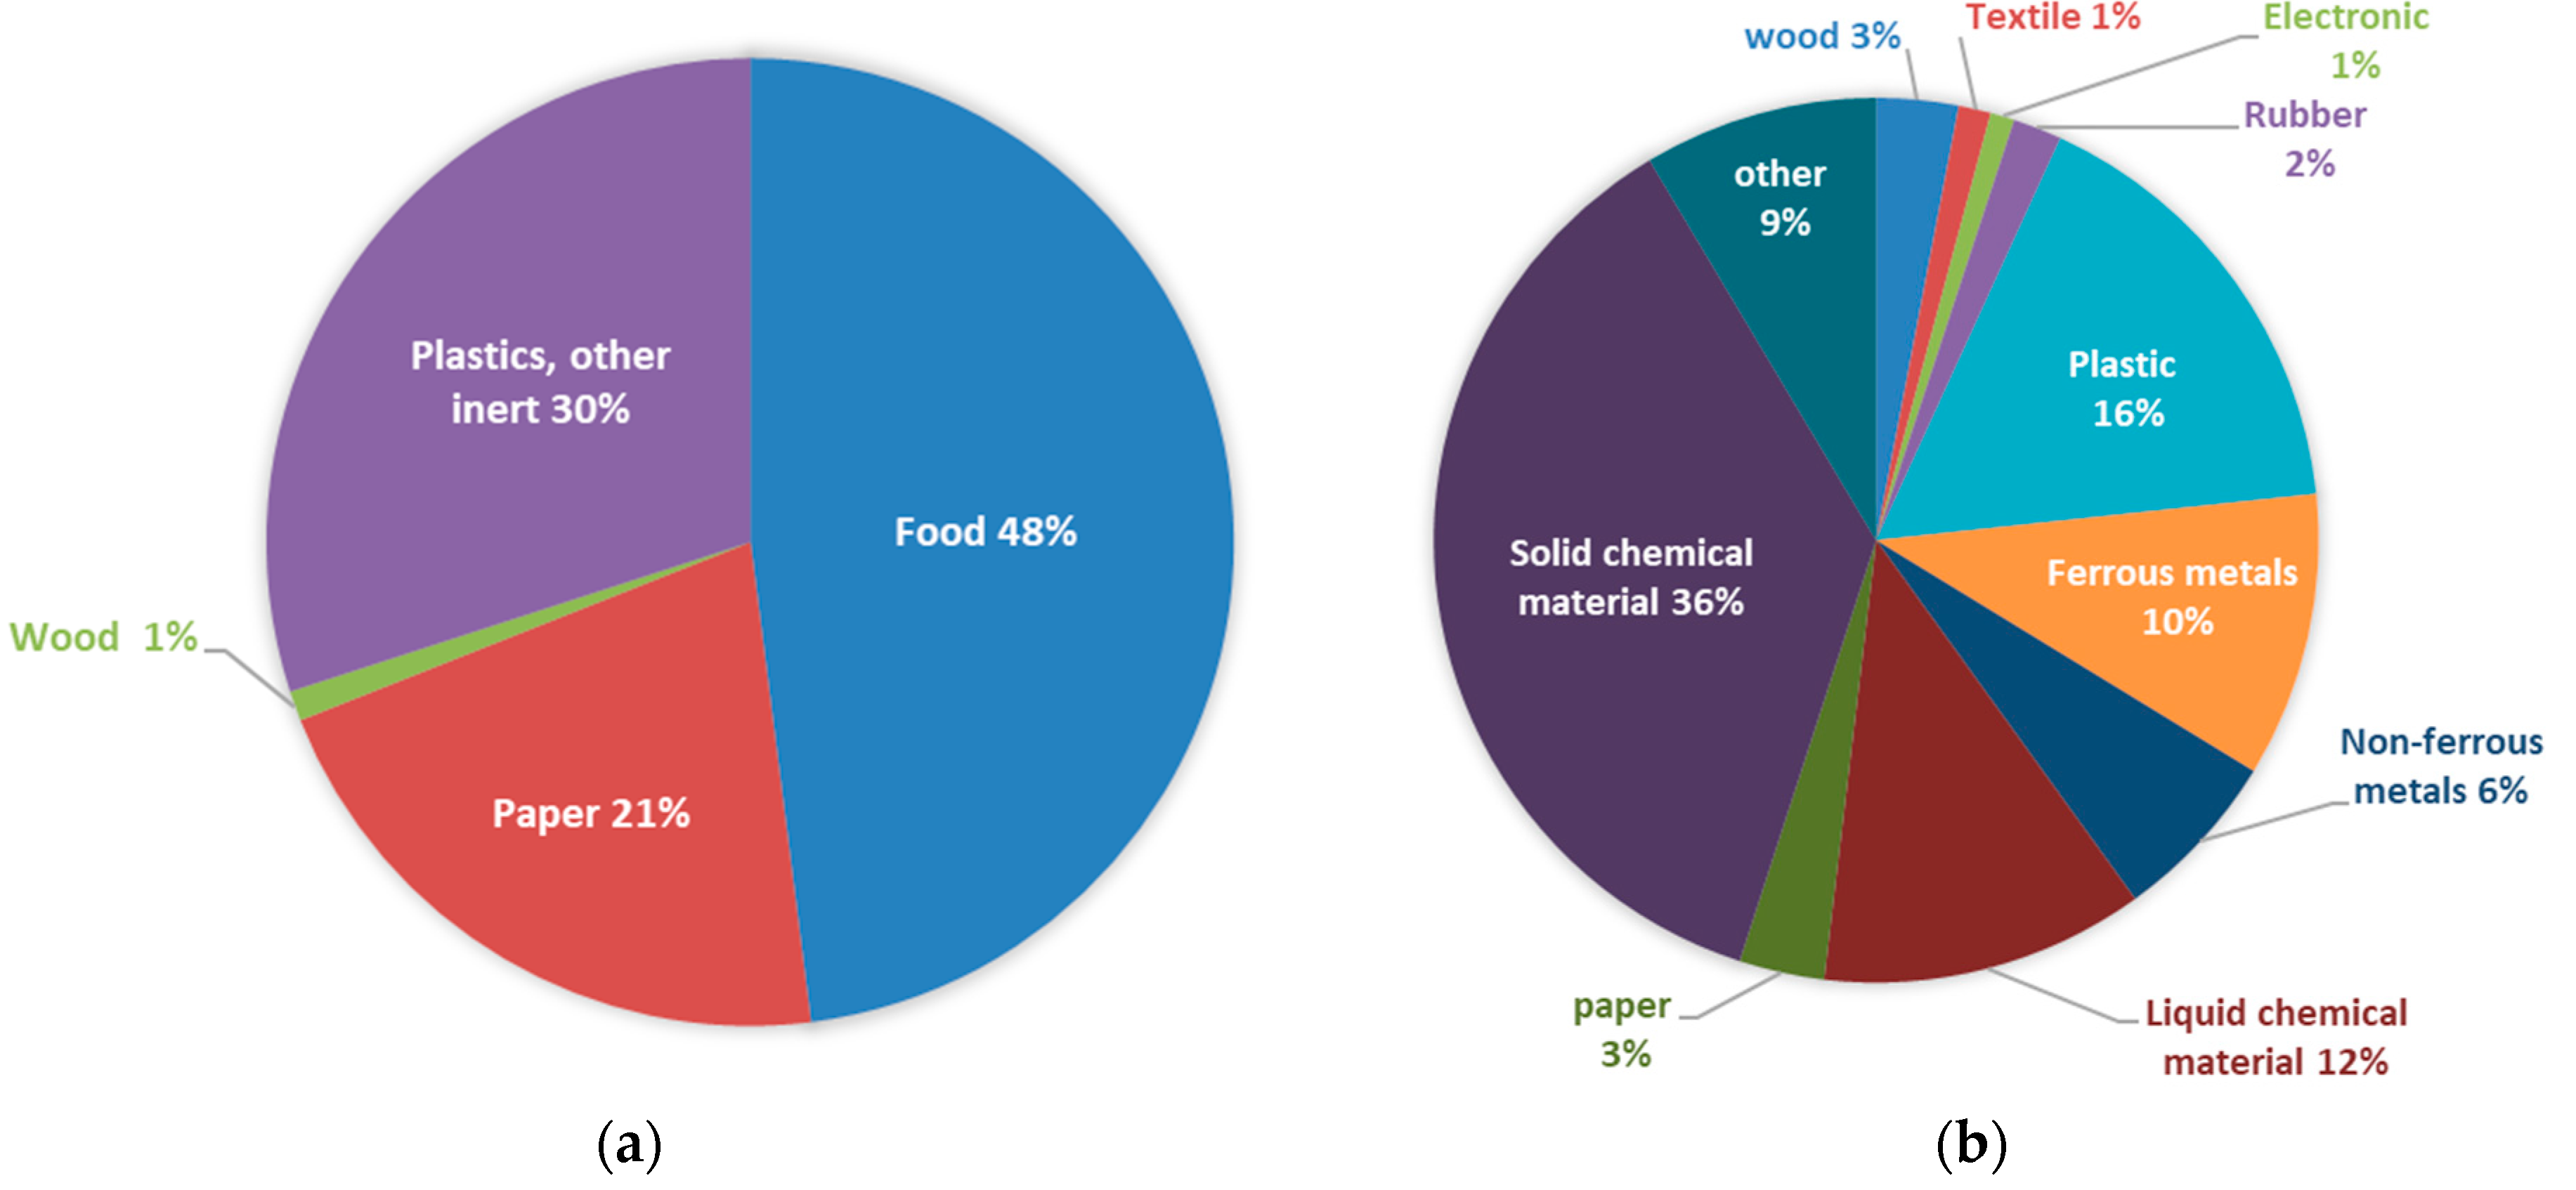
| Waste Composition | % Disposed to Landfill | Degradable Organic Carbon (DOC) | Fraction of DOC Decomposed (DOCf) | Rate of Reaction Constant (k) | Half-Life Time (t1/2) |
|---|---|---|---|---|---|
| Food | 48% | 0.15 | 0.7 | 0.085 | 8.2 |
| Paper | 21% | 0.4 | 0.5 | 0.045 | 15.4 |
| Wood | 1% | 0.43 | 0.1 | 0.025 | 27.7 |
| Plastics, other inert | 30% | 0 | |||
| Industrial waste | 100% | 0.150 | 0.7 | 0.065 | 10.7 |
| At Level | ADF Test (t-Statistics) | PP Test (t-Statistics) | ||
|---|---|---|---|---|
| Intercept (I) | Intercept and Trend (I&T) | Intercept (I) | Intercept and Trend (I&T) | |
| MSW | 7.88 (0) | −3.12 (0) | 5.35 (4) | −2.95 (2) |
| ISW | 0.96 (10) | −2.22 (10) | 2.24 (4) | −0.54 (4) |
| GDPPC | −0.96 (0) | −1.53 (0) | −1.09 (1) | −1.80 (2) |
| UPOP | 0.02 (1) | −2.69 (1) | 2.53 (5) | −1.56 (5) |
| FDI | −2.60 (1) | −2.56 (1) | −2.00 (2) | −1.85 (2) |
| OP | 2.02 (1) | 0.42 (1) | 6.66 (5) | 3.23 (4) |
| LR | −1.97 (0) | −1.39 (0) | −1.93 (1) | −1.39 (0) |
| UR | −2.3 (1) | −2.62 (1) | −2.00 (2) | −2.13 (3) |
| At First Difference | ||||
| MSW | −2.98 ** (0) | −5.44 ***(0) | −2.66 * (2) | −5.50 *** (3) |
| ISW | −1.55 (9) | −2.84 * (9) | −1.94 (3) | −1.69 (3) |
| GDPPC | −5.20 *** (0) | −5.15 *** (0) | −5.18 *** (2) | −5.13 *** (2) |
| UPOP | −2.04 (0) | −1.73 (0) | −2.96 * (3) | −1.99 (3) |
| FDI | −4.75 *** (0) | −4.72 *** (0) | −4.76 *** (2) | −4.73 *** (2) |
| OP | −0.52 (0) | −1.90 (0) | −0.51 (1) | −1.93 (1) |
| LR | −5.99 *** (0) | −6.37 *** (0) | −5.99 *** (1) | −6.36 *** (1) |
| UR | −4.87 *** (0) | −4.93 *** (0) | −4.87 *** (1) | −4.94 *** (1) |
| No. of Co-Integrating Equation (CE) | Hypothesis | Trace | Maximum Eigenvalue |
|---|---|---|---|
| r = 0 | No CE | 109.00 *** | 56.88 *** |
| r = 1 | At most 1 CE | 52.12 ** | 22.08 ** |
| r = 2 | At most 2 CE | 30.04 | 18.85 |
| r = 3 | At most 3 CE | 11.19 | 11.04 |
| r = 4 | At most 4 CE | 0.15 | 0.15 |
| No. of Co-Integrating Equation (CE) | Hypothesis | Trace | Maximum Eigenvalue |
|---|---|---|---|
| r = 0 | No CE | 86.47 *** | 32.69 * |
| r = 1 | At most 1 CE | 53.77 ** | 27.76 |
| r = 2 | At most 2 CE | 26.01 | 15.91 |
| r = 3 | At most 3 CE | 10.10 | 9.11 |
| r = 4 | At most 4 CE | 0.98 | 0.98 |
| Dependent Variable: MSW | |||
|---|---|---|---|
| R-Squared Value: 0.86 | |||
| Explanatory Variable | Coefficient | Standard Errors | t-Statistics |
| Constants | 4.85 | 0.92 | 5.29 |
| GDPPC | 0.0003 | 8.47 × 10⁻⁵ | 3.09 |
| UPOP | 5.07 × 10⁻⁶ | 1.39 × 10⁻⁶ | 3.66 |
| FDI | −1.22 × 10⁻¹⁰ | 3.91 × 10⁻¹¹ | −3.12 |
| LR | -0.096 | 0.08 | −1.15 |
| Dependent Variable: ISW | |||
|---|---|---|---|
| R-Squared Value: 0.90 | |||
| Explanatory Variable | Coefficient | Standard Errors | t-Statistics |
| Constants | −1.57 | 2.48 | −0.63 |
| GDPPC | 0.001 | 0.0003 | 3.96 |
| UPOP | 4.34 × 10⁻⁶ | 5.2 × 10⁻⁶ | 0.82 |
| FDI | 1.67 × 10⁻¹⁰ | 1.29 × 10⁻¹⁰ | 1.29 |
| UR | −1.18 | 1.69 | −0.69 |
| Short-Run GC–F Statistics | Long-Run GC-t Statistics | |||||
|---|---|---|---|---|---|---|
| Ln (MSW) | Ln (GDPPC) | Ln (UPOP) | Ln (FDI) | Ln (LR) | Error Correction Term (ECT) | |
| Ln (MSW) | - | 9.55 *** (0.003) | 13.37 (0.0007) | 9.72 (0.003) | 1.33 (0.26) | −2.36 ** (0.02) |
| Ln (GDPPC) | 1.30 (0.26) | - | 1.62 (0.21) | 1.38 (0.25) | 0.54 (0.47) | 3.09 *** (0.003) |
| Ln (UPOP) | 3.02 * (.09) | 4.07 ** (0.05) | - | 0.24 (0.63) | 0.39 (0.53) | 3.66 *** (0.001) |
| Ln (FDI) | 3.31 * (0.08) | 9.05 *** (0.004) | 1.50 (0.23) | - | 7.26 *** (0.01) | −3.12 *** (0.003) |
| Ln (LR) | 0.06 (0.81) | 0.45 (0.51) | 0.08 (0.79) | 0.09 (0.76) | - | −1.15 (0.26) |
| Short-Run GC–F Statistics | Long-Run GC-t Statistics | |||||
|---|---|---|---|---|---|---|
| Ln (ISW) | Ln (GDPPC) | Ln (UPOP) | Ln (FDI) | Ln (UR) | Error Correction Term (ECT) | |
| Ln (ISW) | - | 15.69 *** (0.0003) | 0.68 (0.41) | 1.66 (0.20) | 0.48 (0.49) | 12.45 *** (0.000) |
| Ln (GDPPC) | 0.24 (0.63) | - | 4.00 ** (0.05) | 4.36 ** (0.04) | 1.63 (0.21) | 3.96 *** (0.0003) |
| Ln (UPOP) | 0.59 (0.45) | 2.72 * (0.10) | - | 0.44 (0.51) | 3.76 * (0.06) | 0.82 (0.41) |
| Ln (FDI) | 4.15 ** (0.05) | 8.92 *** (0.004) | 1.80 (0.19) | - | 0.03 (0.87) | 1.29 (0.20) |
| Ln (UR) | 0.01 (0.91) | 0.25 (0.62) | 1.33 (0.25) | 1.09 (0.30) | - | −0.70 (0.49) |
Publisher’s Note: MDPI stays neutral with regard to jurisdictional claims in published maps and institutional affiliations. |
© 2021 by the authors. Licensee MDPI, Basel, Switzerland. This article is an open access article distributed under the terms and conditions of the Creative Commons Attribution (CC BY) license (http://creativecommons.org/licenses/by/4.0/).
Share and Cite
Rahman, M.M.; Rahman, S.M.; Rahman, M.S.; Hasan, M.A.; Shoaib, S.A.; Rushd, S. Greenhouse Gas Emissions from Solid Waste Management in Saudi Arabia—Analysis of Growth Dynamics and Mitigation Opportunities. Appl. Sci. 2021, 11, 1737. https://doi.org/10.3390/app11041737
Rahman MM, Rahman SM, Rahman MS, Hasan MA, Shoaib SA, Rushd S. Greenhouse Gas Emissions from Solid Waste Management in Saudi Arabia—Analysis of Growth Dynamics and Mitigation Opportunities. Applied Sciences. 2021; 11(4):1737. https://doi.org/10.3390/app11041737
Chicago/Turabian StyleRahman, Muhammad Muhitur, Syed Masiur Rahman, Mohammad Shahedur Rahman, Md Arif Hasan, Syed Abu Shoaib, and Sayeed Rushd. 2021. "Greenhouse Gas Emissions from Solid Waste Management in Saudi Arabia—Analysis of Growth Dynamics and Mitigation Opportunities" Applied Sciences 11, no. 4: 1737. https://doi.org/10.3390/app11041737
APA StyleRahman, M. M., Rahman, S. M., Rahman, M. S., Hasan, M. A., Shoaib, S. A., & Rushd, S. (2021). Greenhouse Gas Emissions from Solid Waste Management in Saudi Arabia—Analysis of Growth Dynamics and Mitigation Opportunities. Applied Sciences, 11(4), 1737. https://doi.org/10.3390/app11041737