1. Introduction
A microbubble pump (MBP) with a regenerative impeller is widely used in various fields, such as water treatment, medical industry, biogas refining, and fisheries [
1,
2]. The pump has the advantage of continuous micro-sized bubble generation. The regenerative impeller is composed of disk-shaped vanes and generates high pressure by rotating the impeller [
3]. Microbubbles are produced by the high-pressure mixing of water and air supplied by the pump inlet due to the strong swirling flow due to the rotating of the impeller and the vanes of the impeller blade [
4,
5]. A microbubble pump is used as a core part of water purification systems in public facilities, such as sewage treatment plants, and is often operated not only in the design flow condition but also in off-designed flow conditions, depending on the inflow rate.
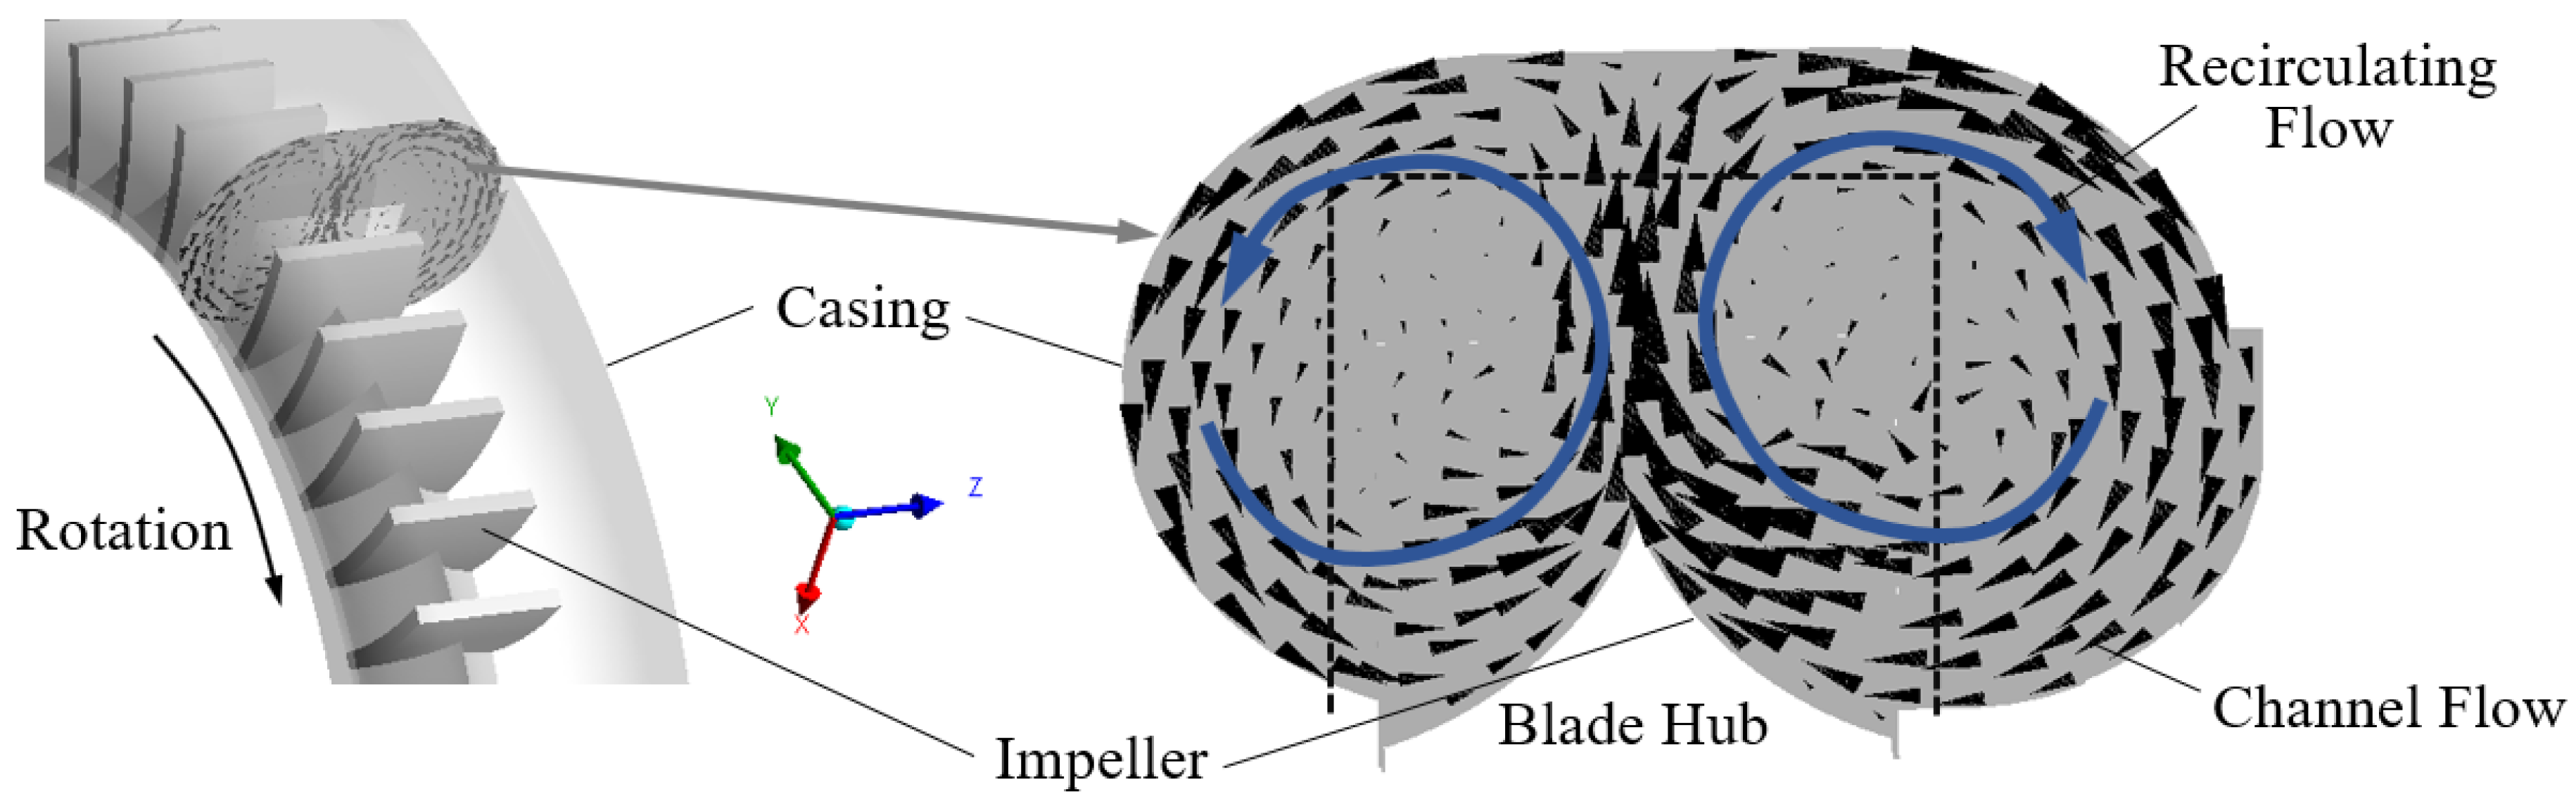
According to the shape of the impeller blades, regenerative impellers are classified into two types: open and side channel impellers. Open channel impellers are widely used in industrial fields due to relatively low manufacturing costs. Microbubble pumps with an open channel impeller have a disadvantage in that the durability is low in high pressure operating conditions because only one side of the blade is fixed to the impeller hub, forming a cantilever structure. In other words, in conventional open channel impellers, a pair of swirling flows are generated between rotating blades, as in the momentum exchange theory [
6], resulting in high pressure between the individual blades and large loads on blade surfaces.
Using experiments and numerical analysis, many researchers have investigated the effect of the regenerative impeller’s geometric parameters on pump performance. Choi et al. [
7] experimentally examined the effects of blade angle on the performance of an open-channel type pump impeller. They stated that a 30° chevron angle produces the best results in terms of efficiency and pressure increase. The difference between the tangential velocity of the incoming fluid and the rotational speed of the impeller was lowest in the case of a 30° chevron angle, which improved the momentum exchange between the flow through the blade space and the flow in the side channel. Pei et al. [
8] selected the blade wrapping angle as a design variable to analyze its effect on pump efficiency. They stated that a small vortex is formed at the blade tip due to the interaction between the incoming and internal flows formed near the inside wall of the pump casing. The vortex propagates from the inlet to the outlet, resulting in head loss. The vortex reduces the fluid tangential velocity, which dissipates the fluid energy needed to overcome the fluid friction and turbulence, thereby increasing pressure loss. Jeon et al. [
9] optimized impeller blades to enhance pump performance using two geometric design parameters: hub height and upper blade height. They showed that the vortex intensity at the pump outlet was reduced by optimizing the impeller blades. Heo et al. [
10] also performed a similar study that considered three different design variables: the ratio of blade height to the impeller diameter, the blade width to the impeller diameter, and the blade angle. Throughout blade optimization, a higher-velocity region formed near the pump inlet, and the outlet could be suppressed, increasing pump efficiency. Jang and Lee [
11] optimized the blade angle and number of blades for microbubble pump impellers for a building fuel cell system. Overall efficiency and pressure were chosen as objective functions to evaluate the new design’s performance, and the response surface method (RSM) was then adopted as the design methodology. They not only presented empirical values of the objective functions but also analyzed the internal flow conditions using pressure, velocity, and vorticity contours, as well as velocity streamlines and vectors at the design flow condition. They reported a 3.17% increase in pressure for the new design compared to the reference when operated under the same design flow condition. Badami and Mura [
12] carried out theoretical and experimental investigations for a regenerative blower used for hydrogen recirculation in an FEM fuel cell system. They proposed a theoretical model based on the momentum exchange theory for a side channel impeller and compared theoretical data to experimental data on blower performance. The pressure was relatively underestimated in the low-flow region compared to the high-flow region, and the results showed a difference of less than 10%. Jang and Han [
13] optimized the two-stage regenerative blower’s blade shape using experiments and numerical simulations. They selected two geometric parameters, blade angle and blade hub height, as the design variables for optimization using the response surface method. The optimized impeller showed better performance in terms of higher pressure and lower vorticity. The authors stated that reducing the vortical flow at the outlet and the symmetric flow at the inlet allowed for the increase of pressure, thus enhancing blower efficiency. Similarly, Isaev [
14] studied the effect of six different geometric parameters on the performance of a regenerative pump. The author tested multiple design combinations of all design variables and reported a 5 per cent increase in efficiency due to lower momentum and energy loss at the pump inlet. The new design was capable of keeping the fluid tangential velocity nearly constant at the inlet and around the blades, which is essential for avoiding vortex formation.
As mentioned above, in order to improve pump performance of a regenerative impeller, many researchers performed studies to improve the impeller through the optimization of geometric variables. In other words, there are many results concerning performance improvements and optimization for a regenerative pump impeller in the design flow condition; there are very few investigations of flow characteristics in the off-design flow conditions for regenerative pumps. Nejadrajabali et al. [
15] studied the internal flow characteristics of a regenerative pump impeller in terms of design and off-design flow conditions. They considered four different flow scenarios: i.e., two under design flow conditions, one in the design flow condition, and one over-design flow condition. They found that pressure loss increased as the flowrate decreased because larger vortical flow inside the blade passage was generated. Karanth et al. [
16] analyzed the internal flow of a regenerative pump in multiple flow conditions using numerical simulation. In lower-flow conditions, larger circulation flow was observed at the exit of the pump, which invoked a rotating stall in the blade passage. They showed that the circulation flow was found to be lower in strength in the design and higher-flow conditions. Quail et al. [
17] carried out a study at seven different flow rates to find the BEP for a regenerative pump using experimental measurements and numerical simulations. In the design flow condition, there were no high-pressure fluctuations from the pump. On the other hand, pressure exhibited a non-linear phenomenon at lower-flow conditions, whereas a larger vortex flow was formed at the pump inlet at higher flowrates.
Most of the research being conducted on pumps with a regenerative impeller focuses on modifying the geometric parameters of the pump impeller or analyzing the internal flow characteristics in the design flow condition only. It is noted that the performance analysis of the microbubble pumps in the design and off-design flow conditions are rare compared to other fluid machines. In real-world applications, pumps have to operate in a variety of operating conditions other than the design flow condition; therefore, it is crucial to analyze and compare the pump performance along with the internal flow conditions in design and off-design flow conditions.
In the present study, a microbubble pump with a novel ‘S-shape’ impeller is introduced to analyze the effects of flow conditions, including the design flow condition, on pump performance. The test pump, with continuously connected impeller blades, was designed and optimized by the authors [
4]. Pump performance was evaluated by three-dimensional numerical simulation and experimental measurements using a self-designed and fabricated pump test rig. Uncertainty and errors associated with the experimental data were analyzed and discussed in the design and off-design flow conditions. Detailed flow characteristics inside the pump impeller were also analyzed and compared.
2. Microbubble Pump with a Novel ‘S-Shape’ Impeller
The conventional microbubble pump has an open channel impeller due to the simple impeller structure and lower manufacturing cost. There are a few drawbacks to an open channel impeller, mostly related to the aerodynamic performance of the pump such as cavitation, early flow separation, corrosion, and rusting of the edges and tips.
The main reason for this problem is the discontinuity of pressure fluctuations due to the high-pressure recirculating flow between the impeller blades of the microbubble pump when operating at high pressure of 5 bar or more, as shown in
Figure 1.
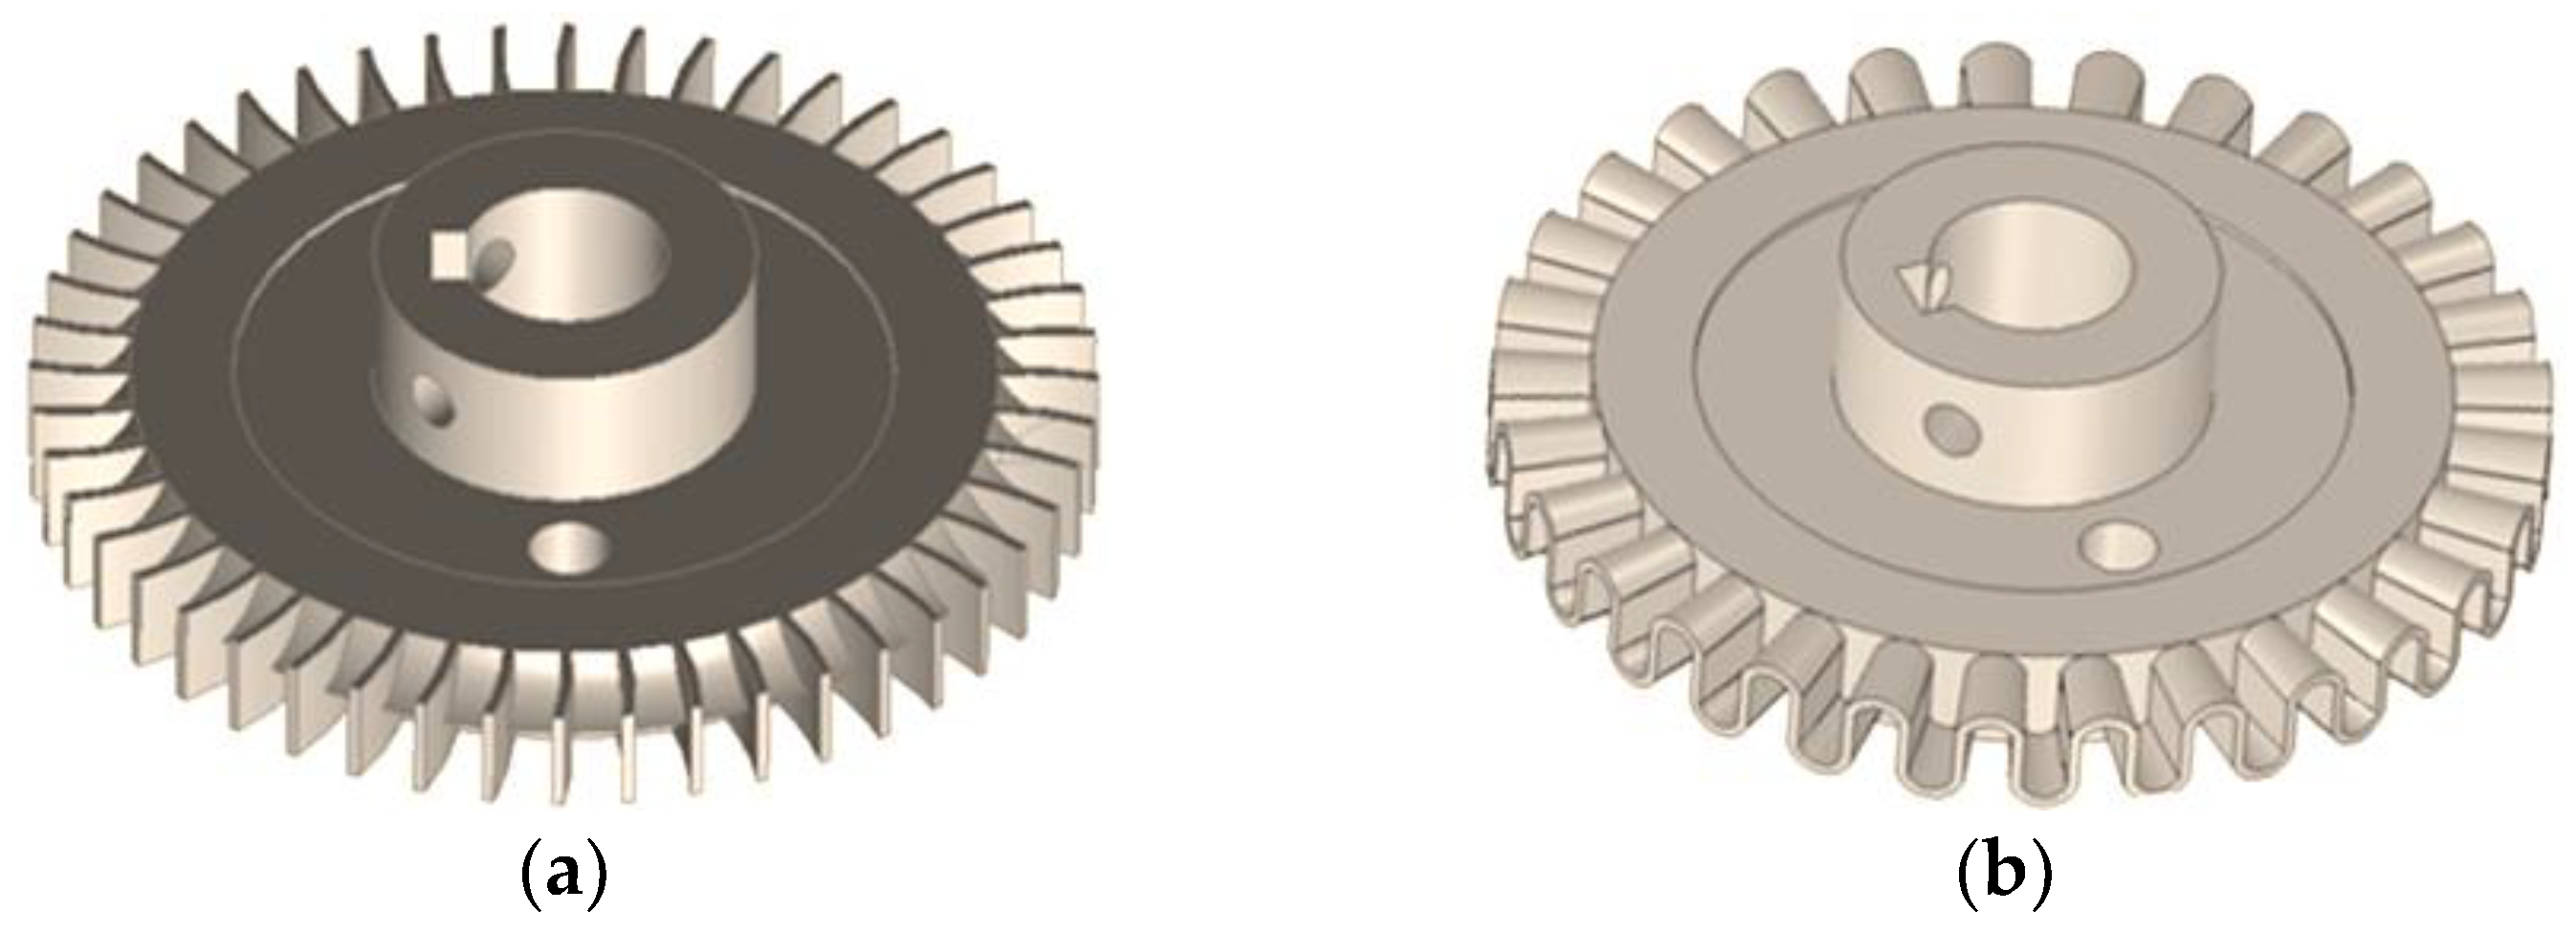
The conventional open channel impeller has a weakness in structural strength with its cantilever structure, in which only the blade hub is fixed, as shown in
Figure 2. In the present study, to improve the structural strength of the impeller blades and the pump performance, an impeller with so-called “S-shape” blades was connected in series, as shown in
Figure 2, and was developed with an optimal design method [
4].
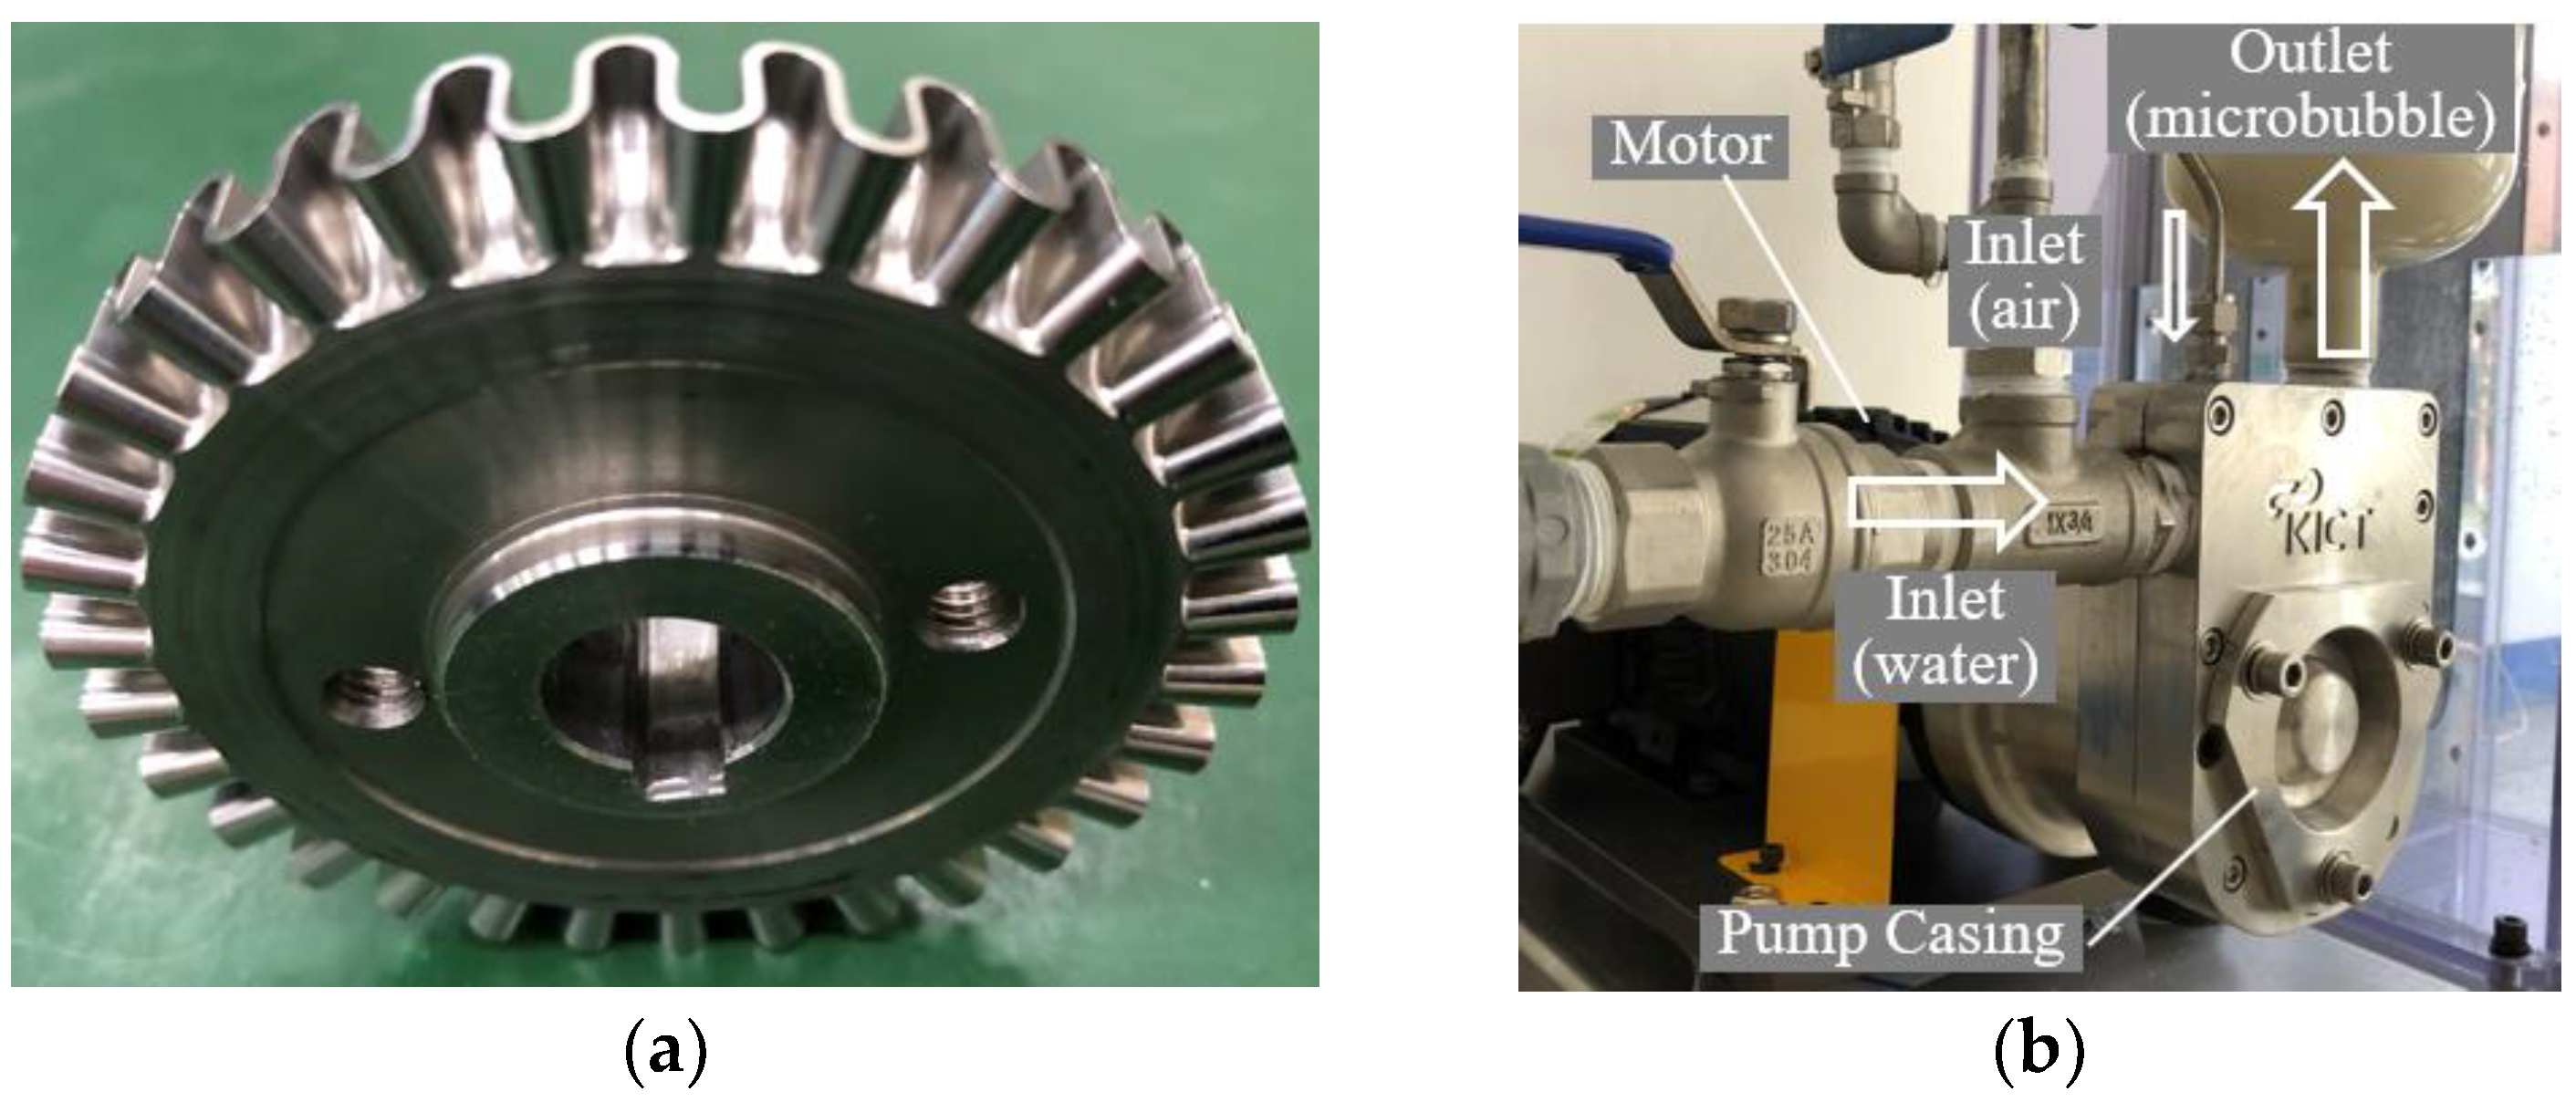
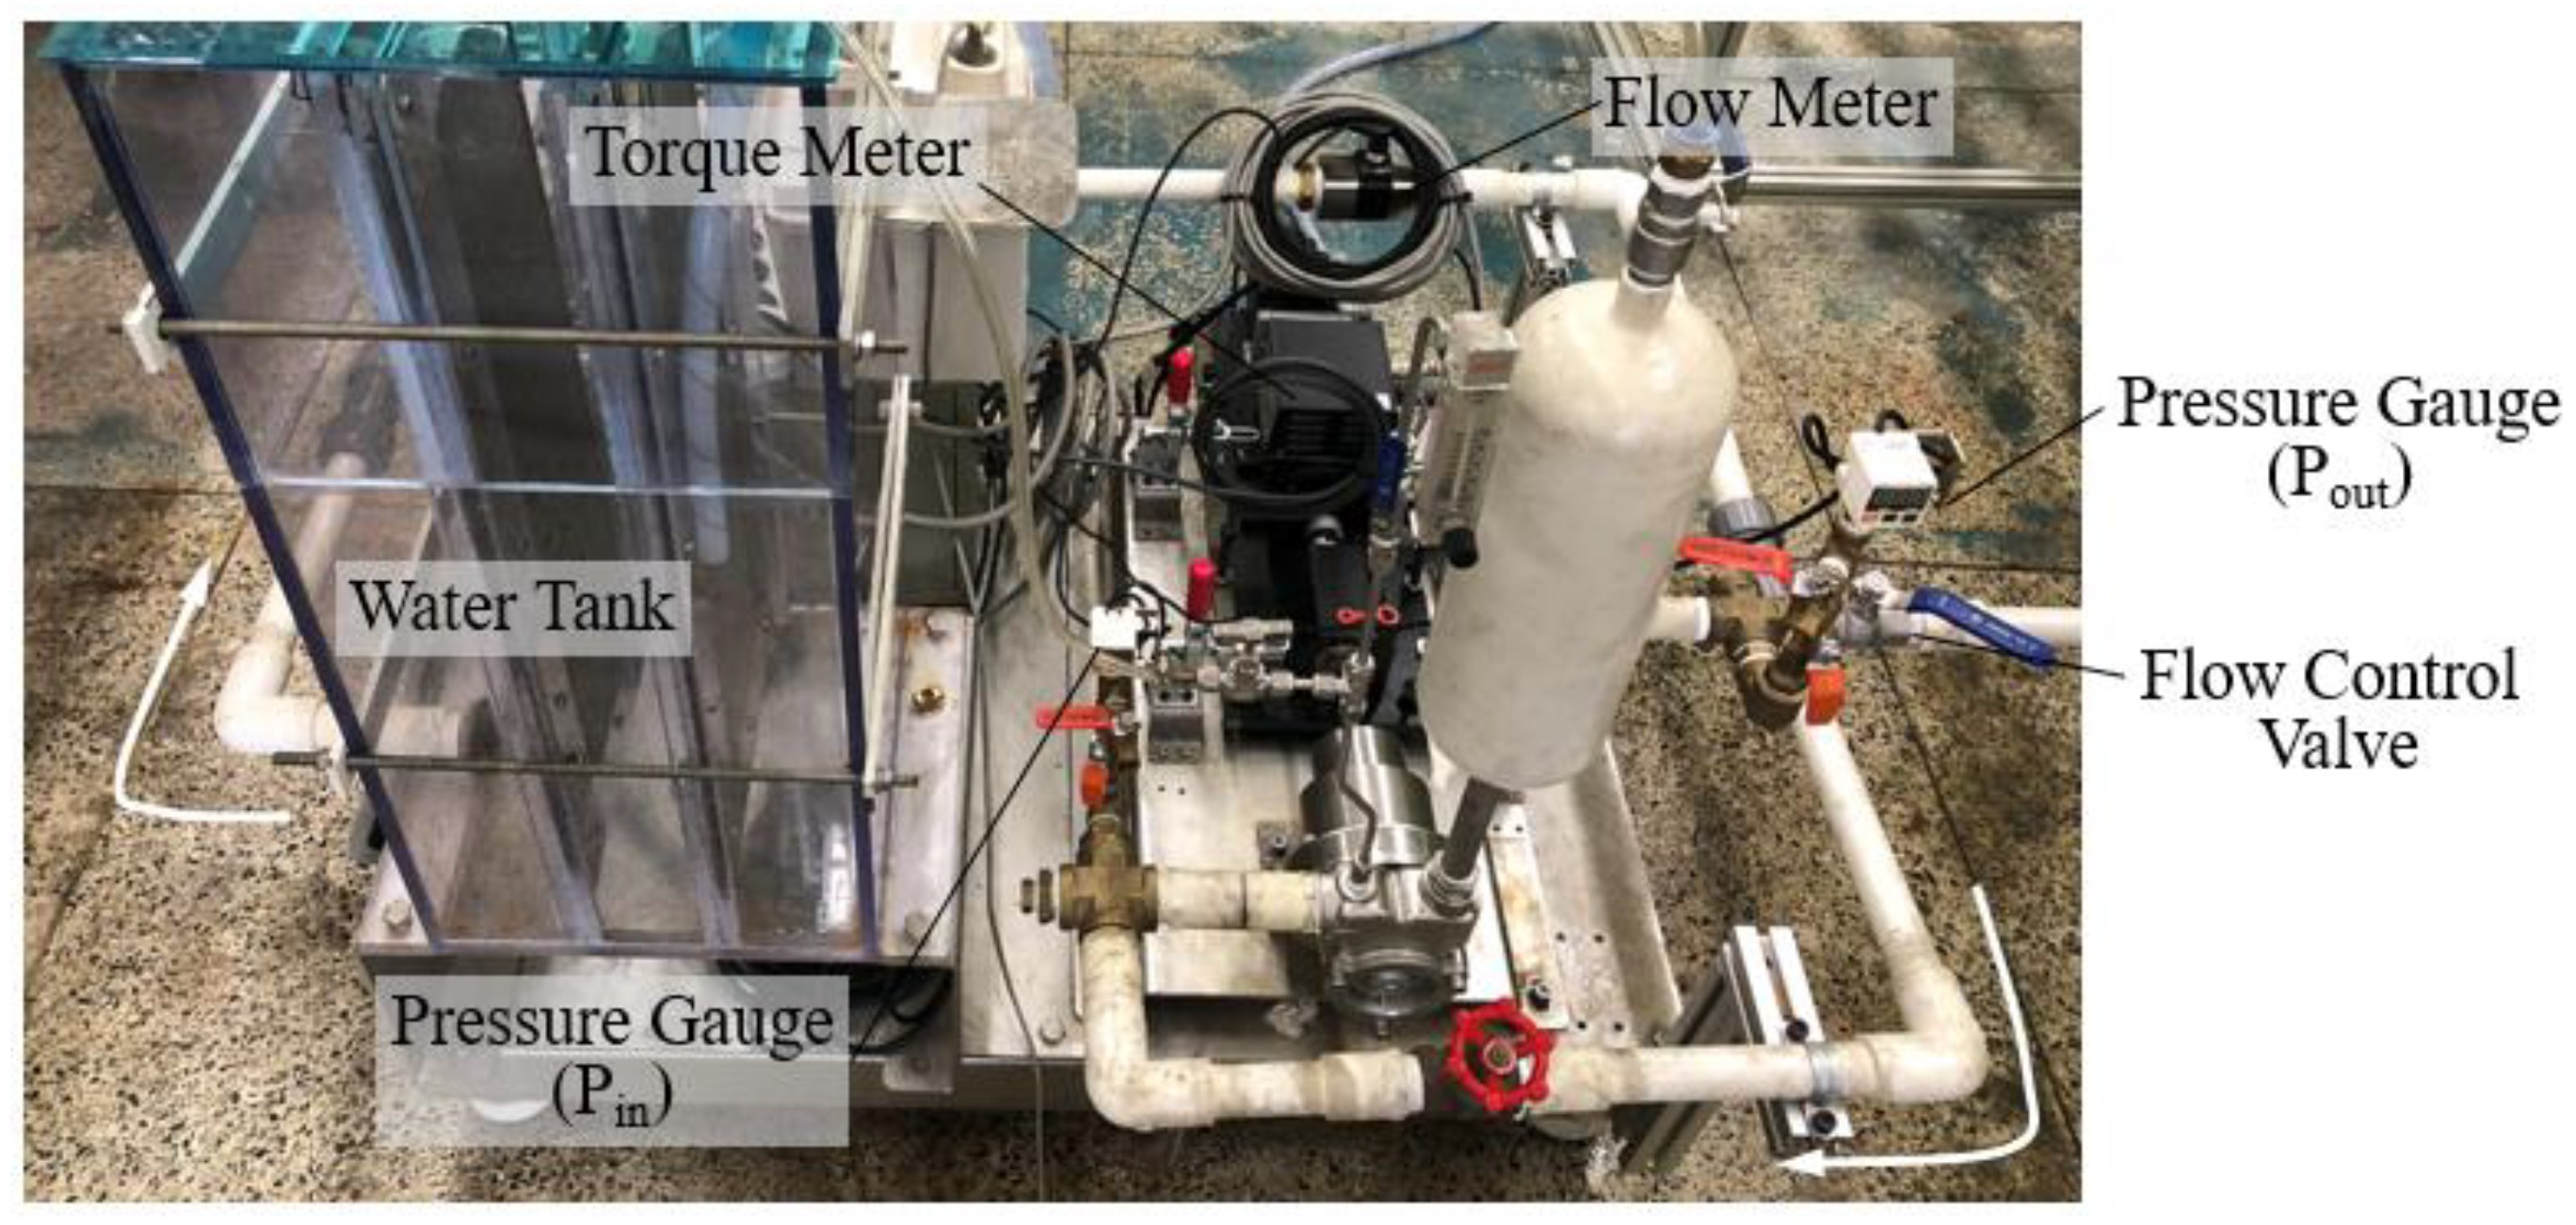
The optimally designed microbubble pump was manufactured, as shown in
Figure 3, to analyze flow field characteristics in the design and off-design flow conditions. Its rotational diameter is 72.6 mm, and it has 30 ‘S’ turns.
Table 1 summarizes all of the important details about the designed impeller.
Flow coefficient (
) and pressure coefficient (
) of the pump are defined as:
where
is the volumetric flow rate of water,
is the pressure rise,
is the impeller tip speed,
is the density, and
is the cross-sectional area of the outlet duct of the pump.
The pump efficiency (
) is defined as the work done by the pump impeller on the working fluid to raise its pressure divided by the power supplied to the pump. It is mathematically expressed as:
where
and
are the torque and the rotational speed acting on the impeller, respectively.
Similarly, specific speed (
) and specific dimeter (
) are two dimensionless parameters related to the operational specifications of the pump and can be defined as follows, respectively:
where
D is the tip diameter of the impeller,
g is the gravitational acceleration constant, and
H is the total head at the best efficiency point (BEP). The values of
and
along with other parameters of the pump are summarized in
Table 1.
4. Numerical Simulation
In order to physically visualize the flow conditions around the impeller blades of the microbubble pump and to analyze pump performance at the design and off-design conditions, three-dimensional numerical simulation is introduced. ANSYS CFX 18.2, a commercial software, was used to solve Reynolds-averaged Navier–Stokes equations (RANS) and continuity equation for incompressible fluid using the finite volume method. Diffusion and convection terms of all the governing equations were handled by adopting the central difference method and upwind differential scheme, respectively. A second-order upwind spatial discretization algorithm was introduced to solve all the equations related to turbulence, pressure, and momentum. Second-order algorithm is known for minimizing interpolation errors in numerical diffusions. As the convergence criteria of the numerical simulation, the residuals of the flow variables are set to 10−4. A shear stress transport (SST) model is used to address turbulence. The unique features of the SST model make it a good choice for modeling high turbulence, as it combines the k-ε and k-ω models. The first grid is put near the walls at y+ < 5.
Figure 6 shows the computational domain and boundary conditions used in the present study. Considering the wake flow formed downstream of the pump impeller, the distance between the pump outlet and the impeller is set at 10 times the duct diameter (D in
Figure 6). The length of the inlet duct is set to be 5 times the duct diameter.
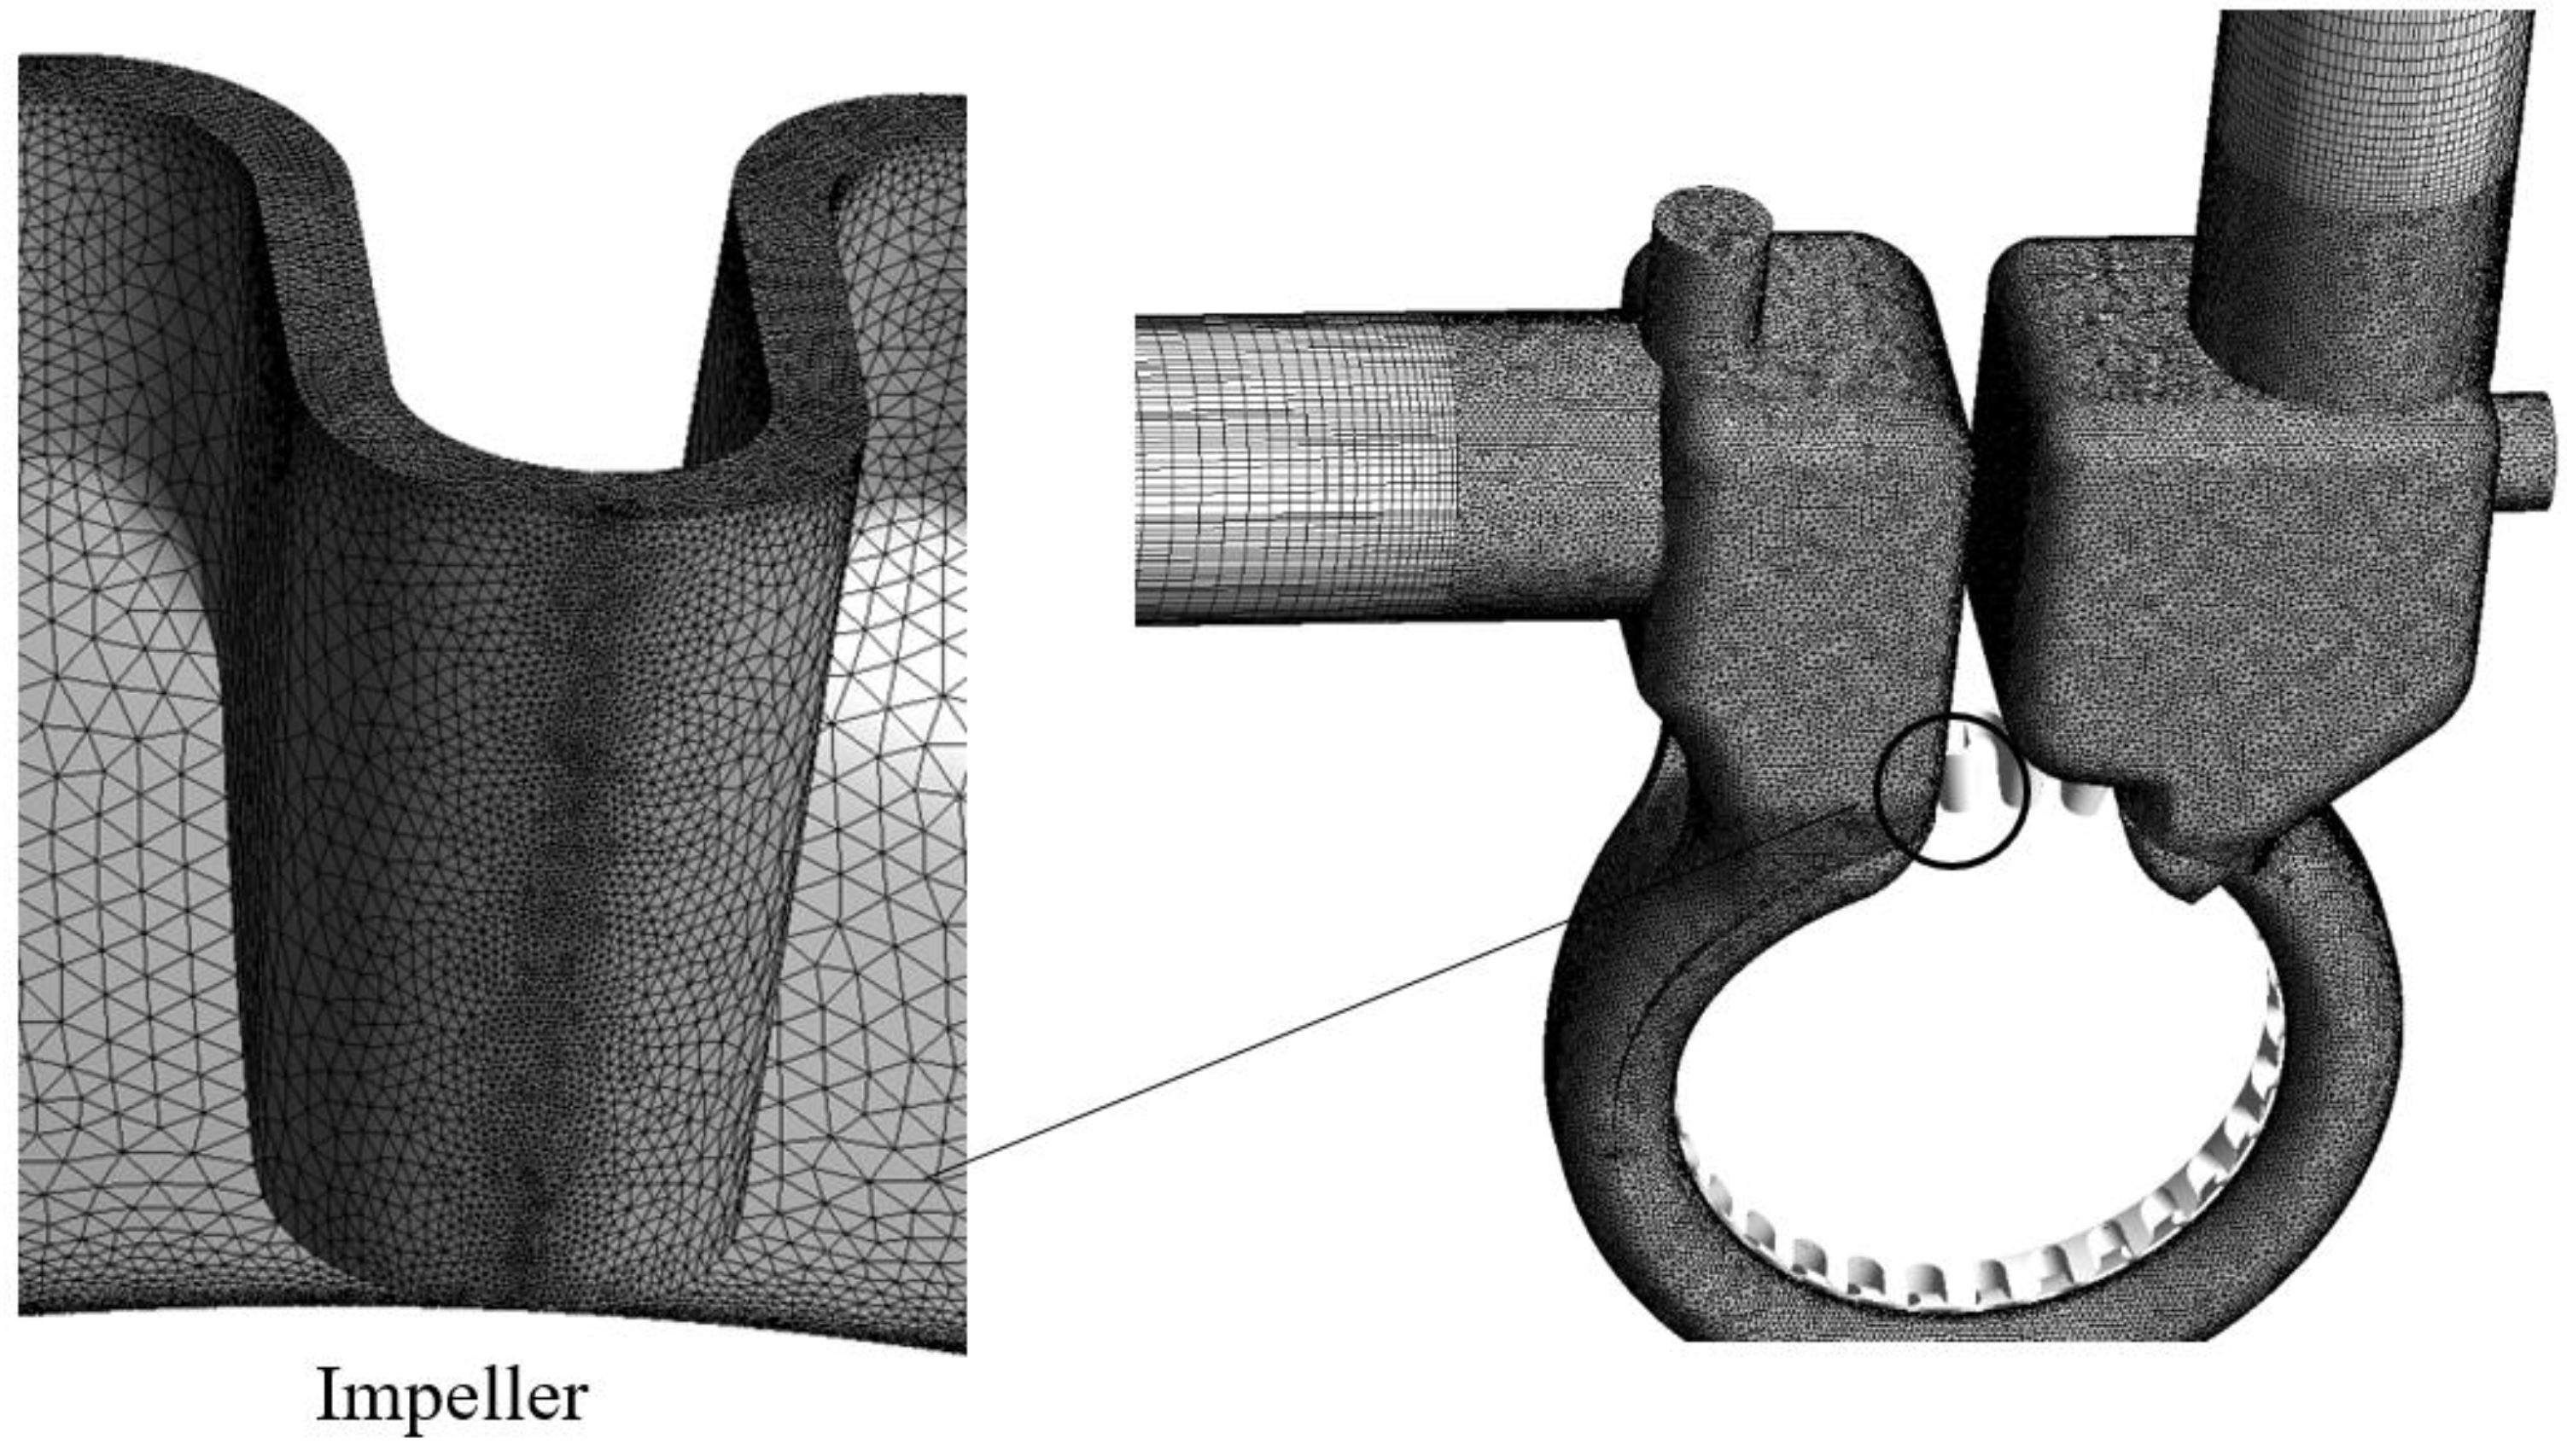
Figure 7 shows the computational grid system for the overall system, including the pump impeller and casing. The blade region operating in rotating frame of reference and casing region in stationary frame of reference are introduced separately. For the impeller and volute casing, tetrahedral elements are used, whereas a three-layer prism mesh is imposed near the walls. In order to decrease the overall number of mesh elements, hexahedral elements are used at the inlet, outlet, and connecting ducts.
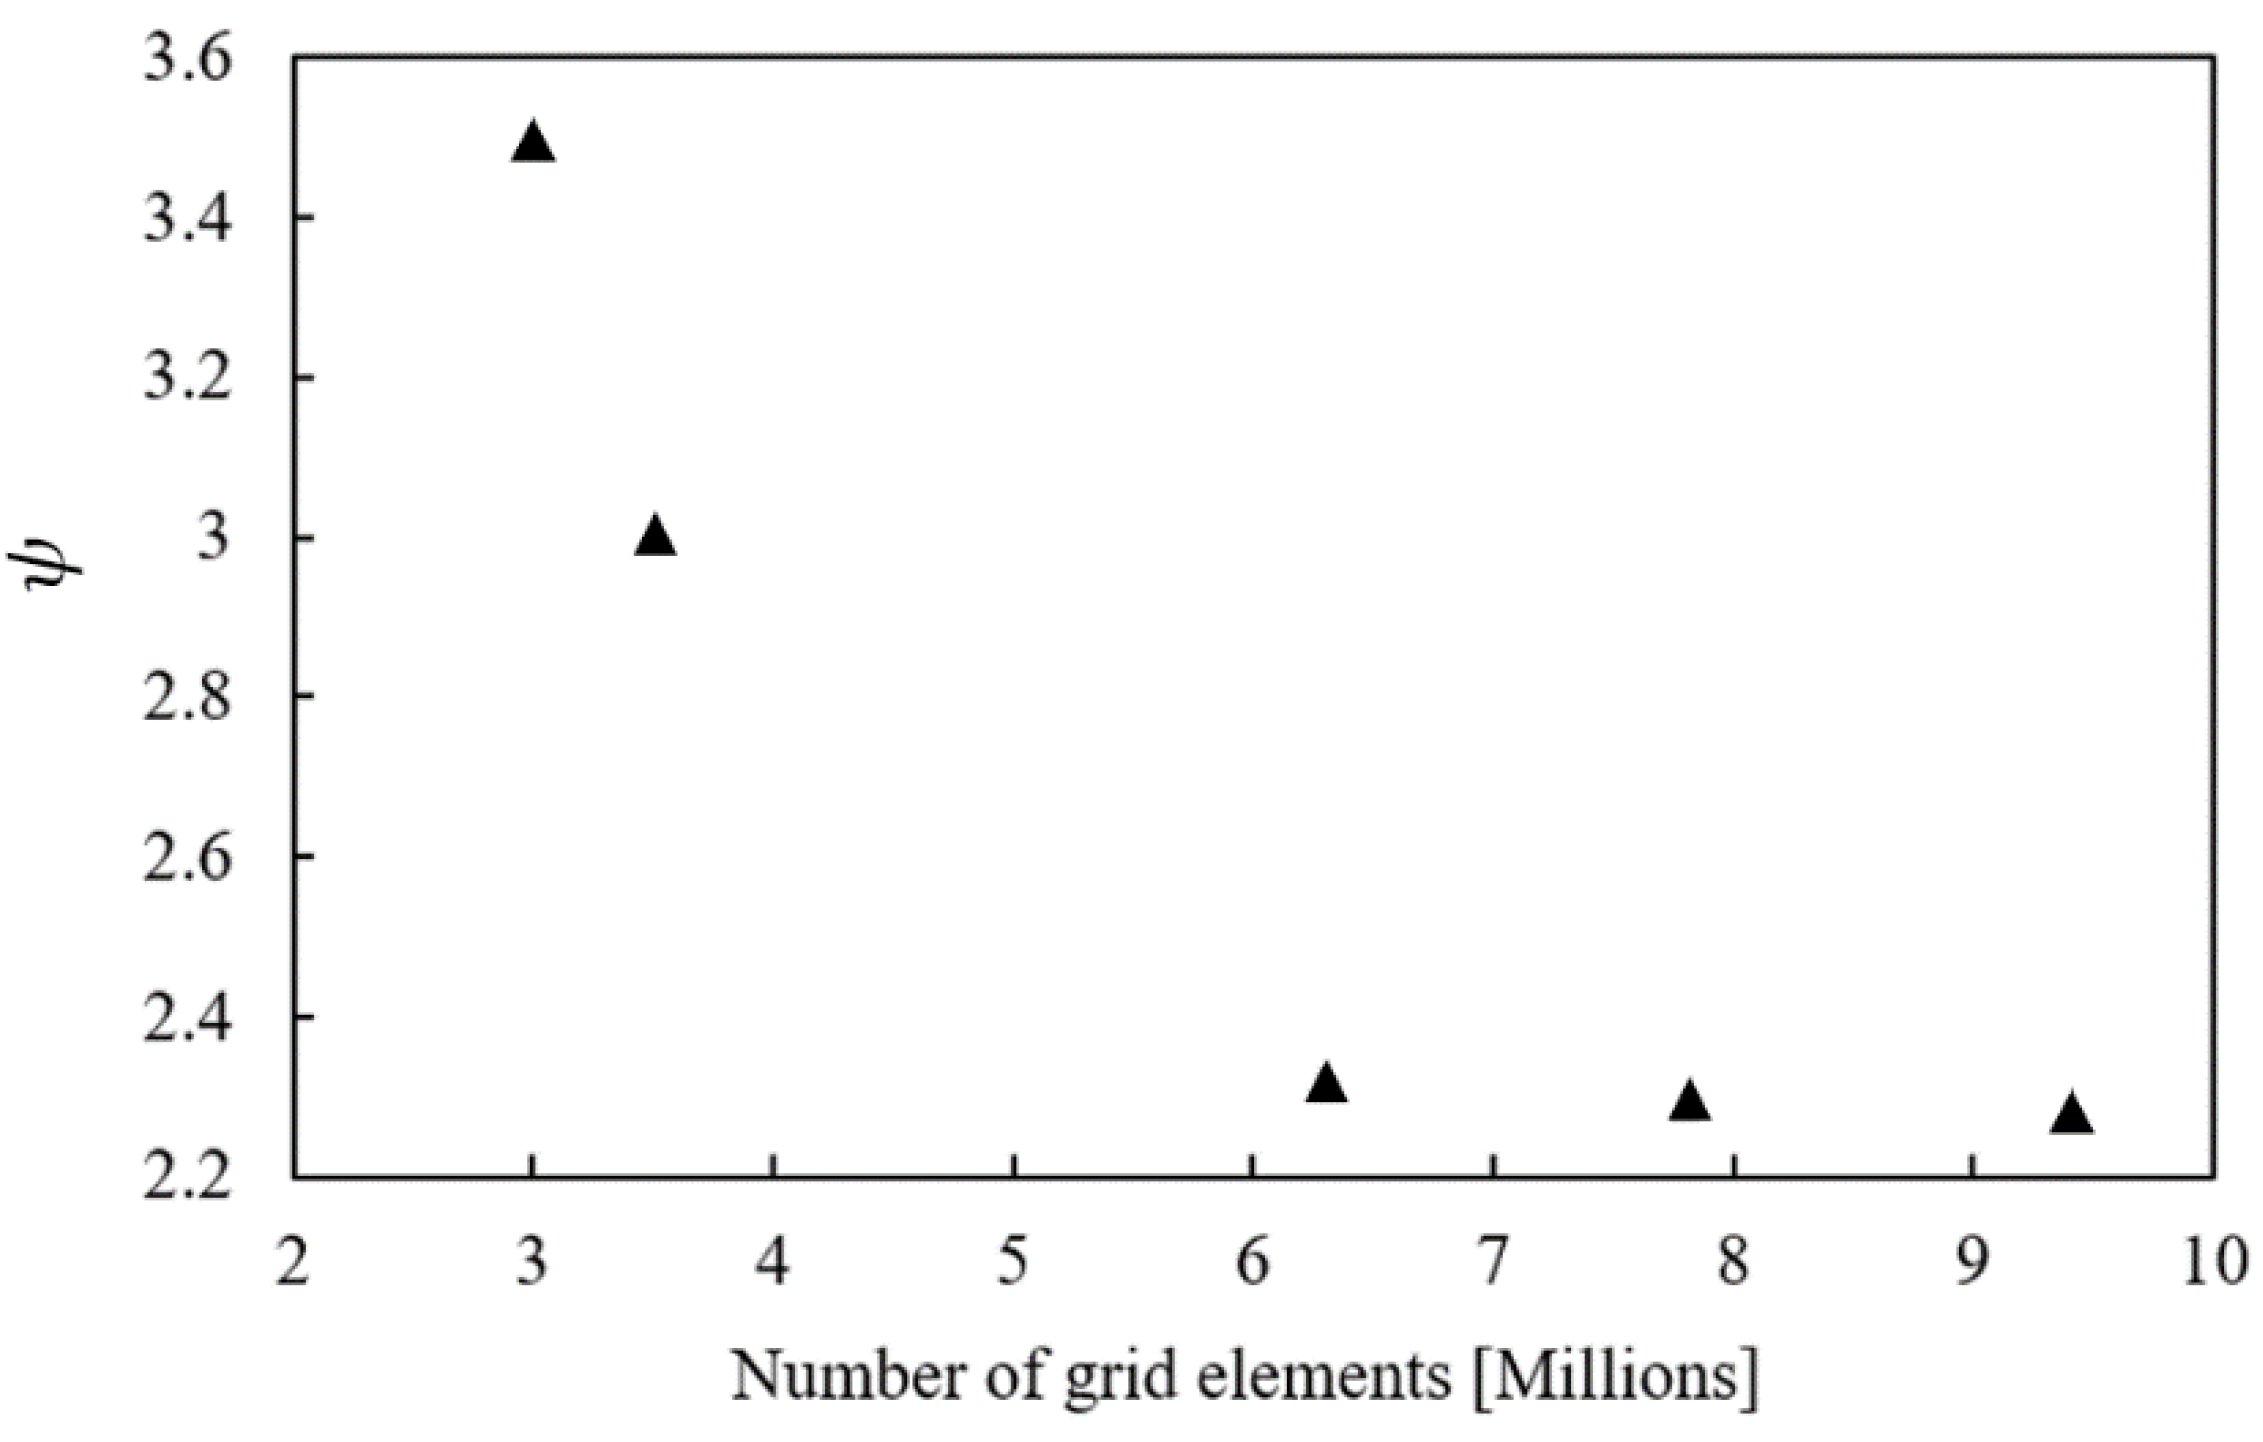
Figure 8 shows the grid dependency test results, which is conducted to determine the optimum number of grid elements for the overall domain. After 6.2 million elements, there is a very small change in the pressure coefficient value, so around 7 million elements are used as the number of elements in the present numerical simulation.
As boundary conditions, atmospheric pressure is specified at the inlet, flowrate at the outlet, and all walls (casing, impeller and hub surfaces) are declared no-slip and adiabatic.
5. Results and Discussion
Experiments and numerical analyses were performed to analyze the performance characteristics of the microbubble pump at the design and off-design flow conditions. Evaluating the pump performance was conducted without considering air inflow. Based on a previous study [
5], the pump performance difference would be negligible, less than 1.2%, depending on the air inflow.
5.1. Validation of Numerical Simulation with Experimental Data
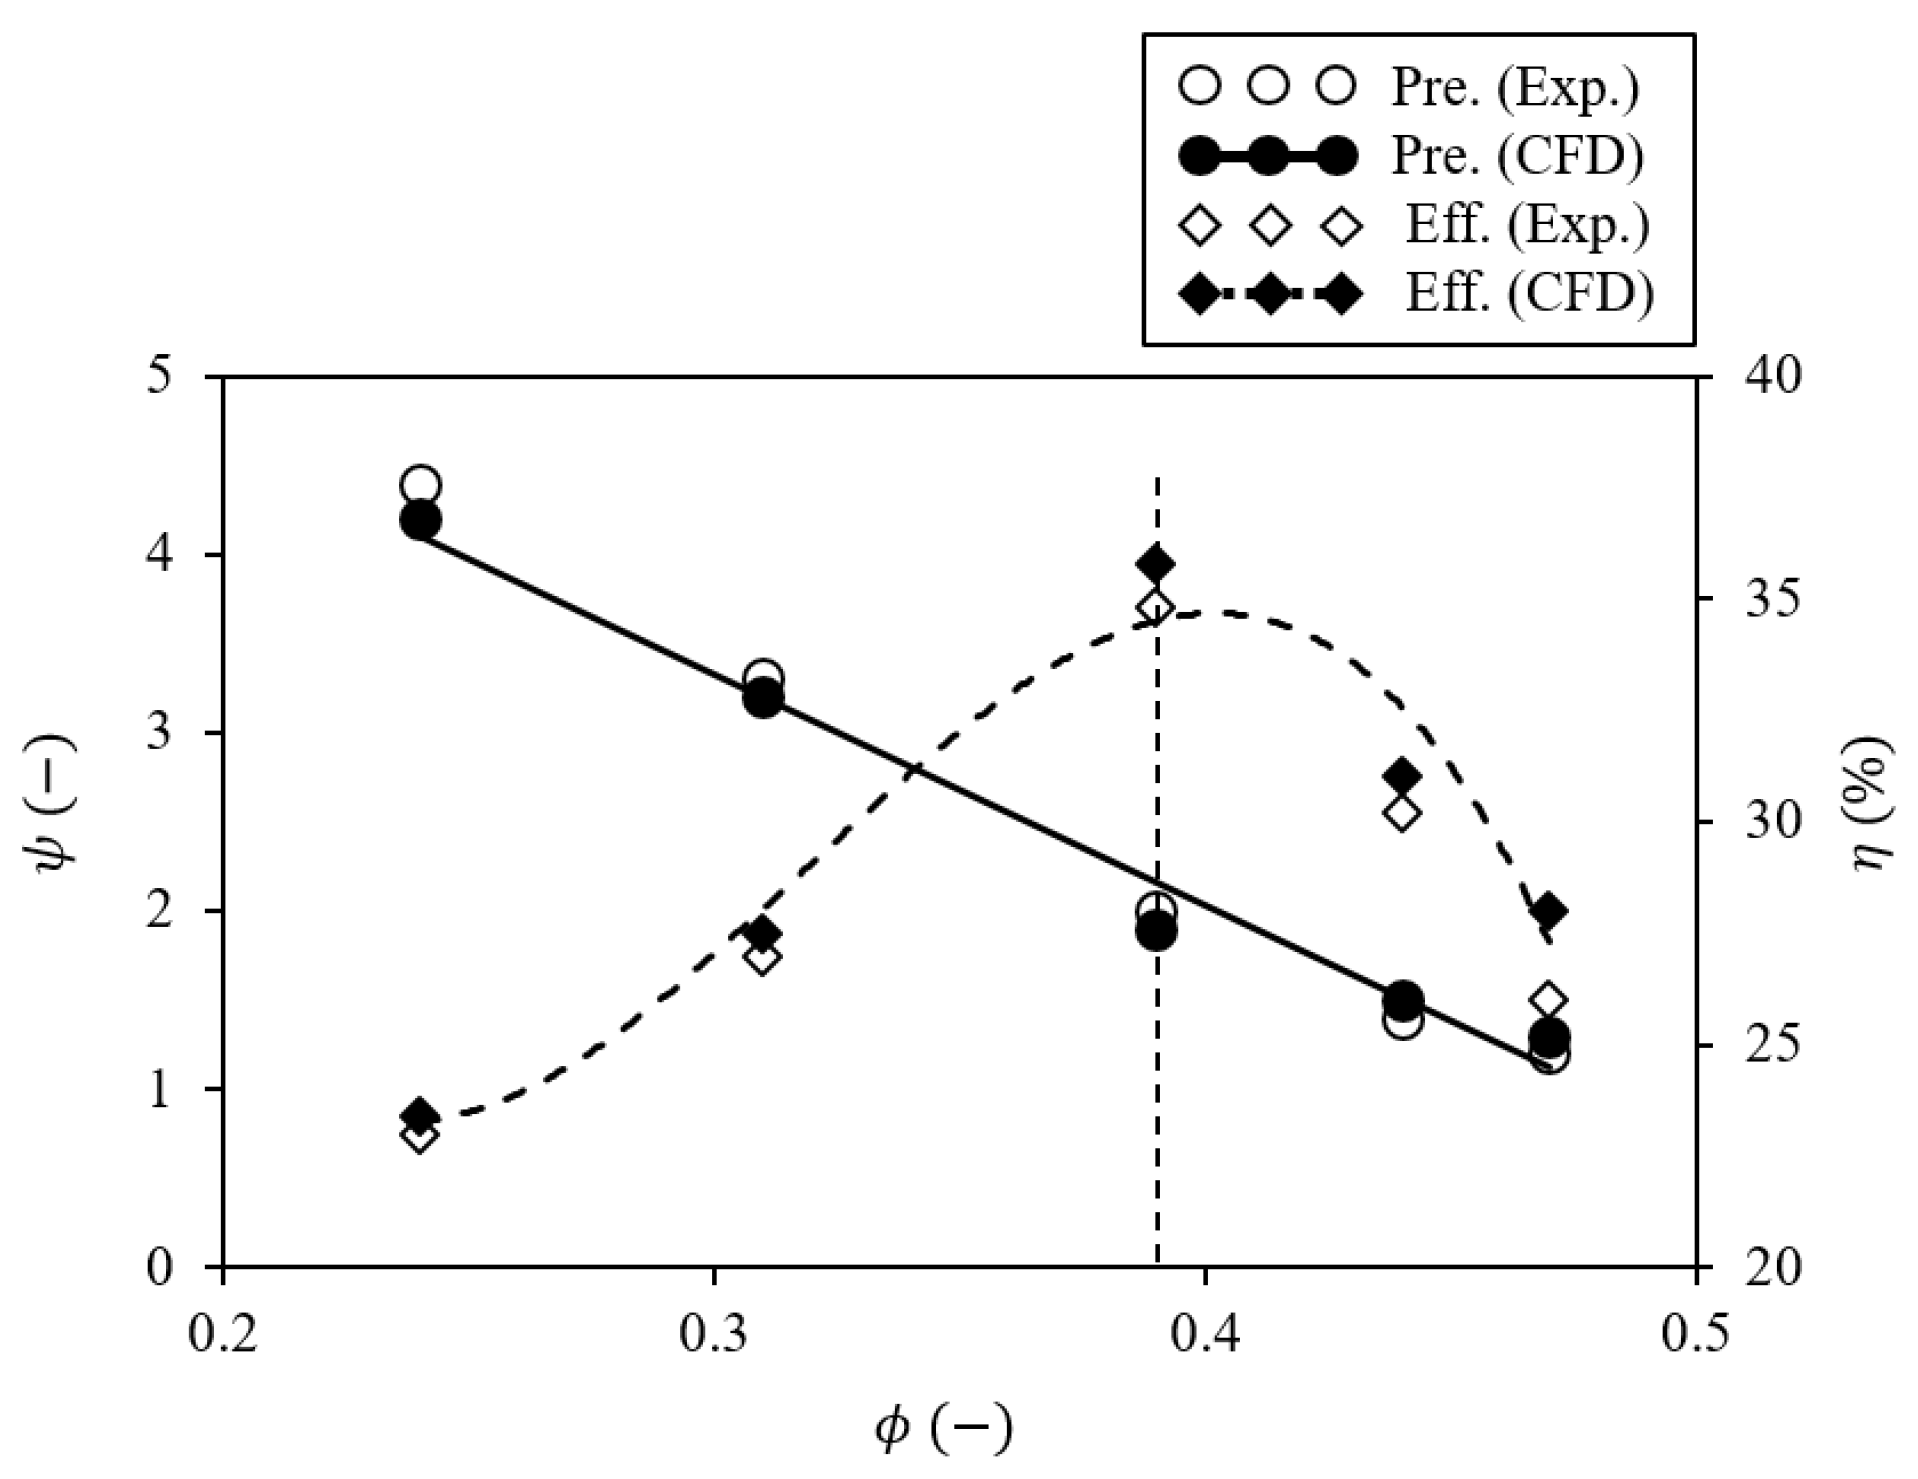
To validate the numerical solutions, the pressure and efficiency of the microbubble pump with a novel ‘S-shape’ impeller was compared to the experimental results of the flow rates, as shown in
Figure 9. The figure shows that the local pressure and efficiency obtained by numerical simulations match well with the experimental results. The computed pump efficiency and pressure had a maximum error of 4 per cent compared to the experimental data, except for the lowest flow coefficient of 0.07. It is noted that the pump efficiency obtained by experimental measurements and numerical simulations at the design flow coefficient of 0.39 are 34 and 36 percent, respectively. Throughout the comparisons of numerical analysis results and experimental data for the pump performance, it can be said that the pump efficiency was simulated correctly in the present numerical simulation.
5.2. Analysis of Uncertainty in On- and Off-Design Flow Conditions
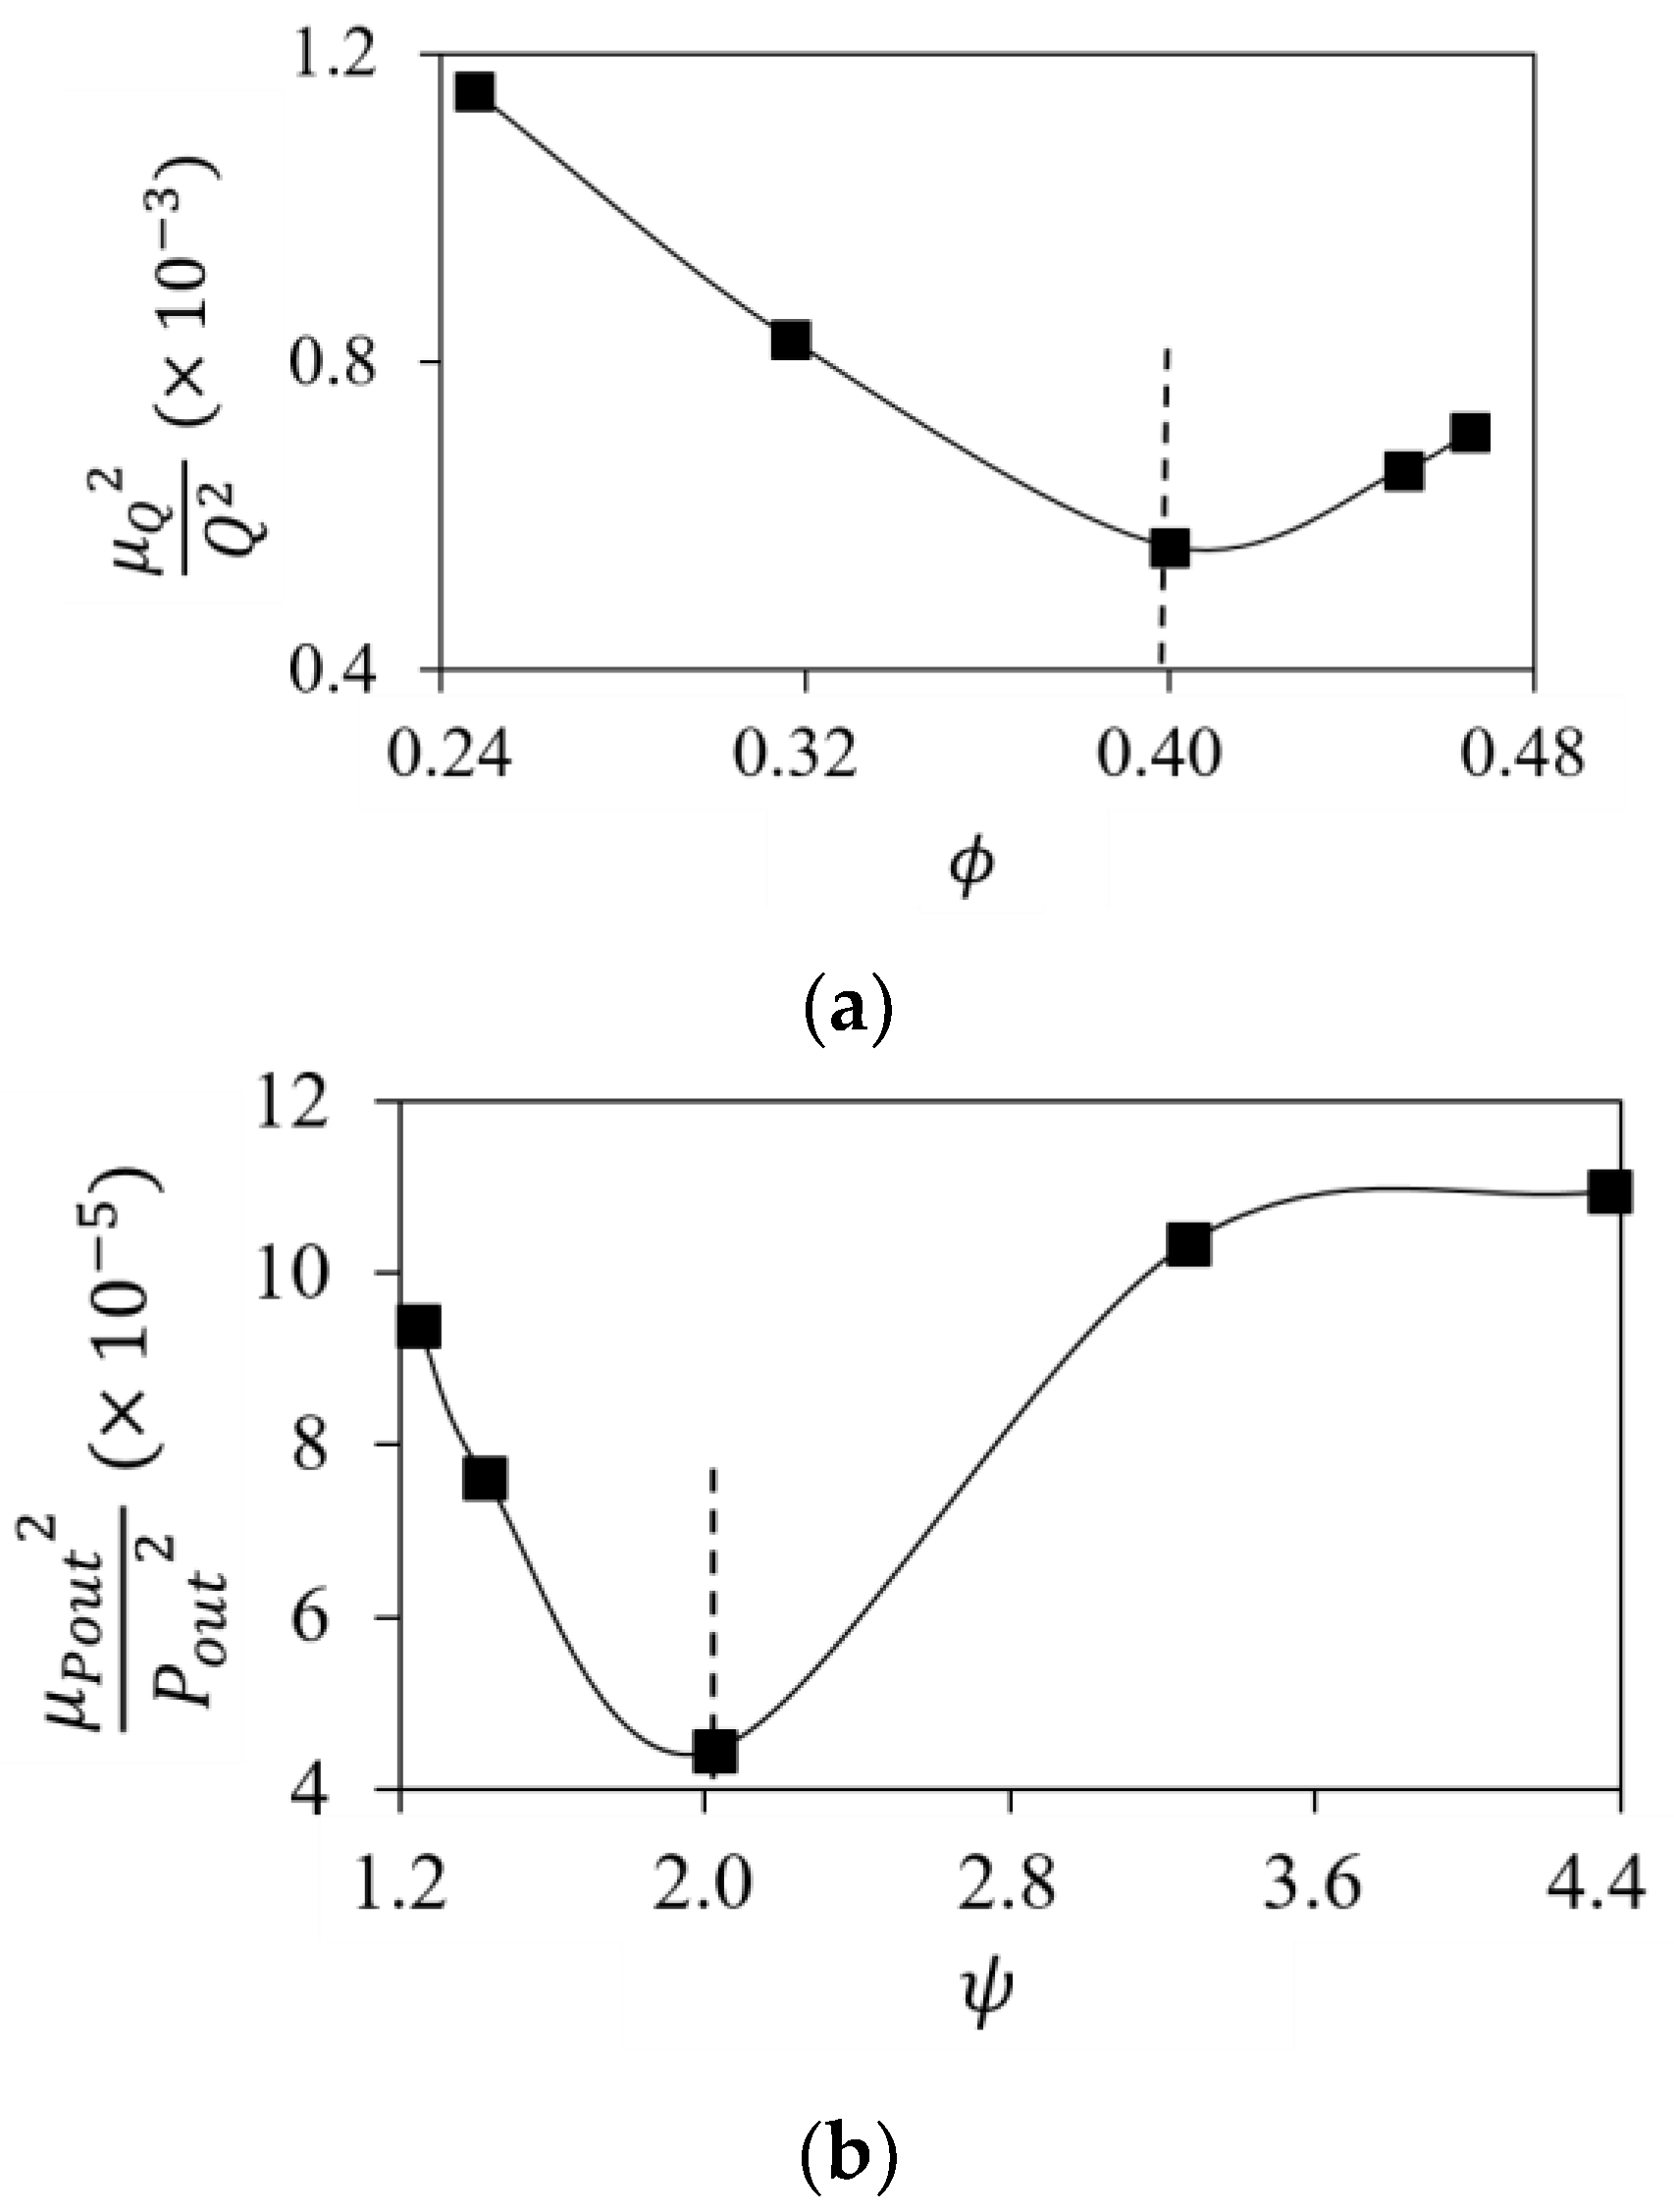
Figure 10 shows the relative uncertainty, indicating the amount of error present in the measured flowrate and outlet pressure, respectively. The figures are for the five flow conditions shown in
Table 2, whereas the vertical ‘dashed’ line represents the design flow condition. It is noted that relative uncertainty represents a more comprehensive and physical meaning of the data, while the absolute uncertainty depends on the numerical values of the data. For example, in the case of a lower flowrate (correspond to higher outlet pressure) absolute uncertainty has lower values compared to the higher flowrates, which can be misleading. It is obvious that uncertainty should be higher at the lower flowrate because the flow inside the pump is unstable and has high fluctuations compared to higher flowrate. To explain this contradiction, relative uncertainty has been introduced and estimated for the five flow conditions presented in
Table 2.
It was found that relative uncertainty has the lowest value at the design flow condition, as shown in
Figure 10a.
Figure 10b shows the relative uncertainty for the outlet pressure has the lowest value in the design flow condition.
5.3. Flow Analysis in Design and Off-Design Conditions
The flow characteristics related to vortical flow inside the blade passage of the microbubble pump were analyzed by three-dimensional numerical simulation in two off-design conditions (∅ = 0.31 and 0.47) and in the design condition (∅ = 0.39), as well.
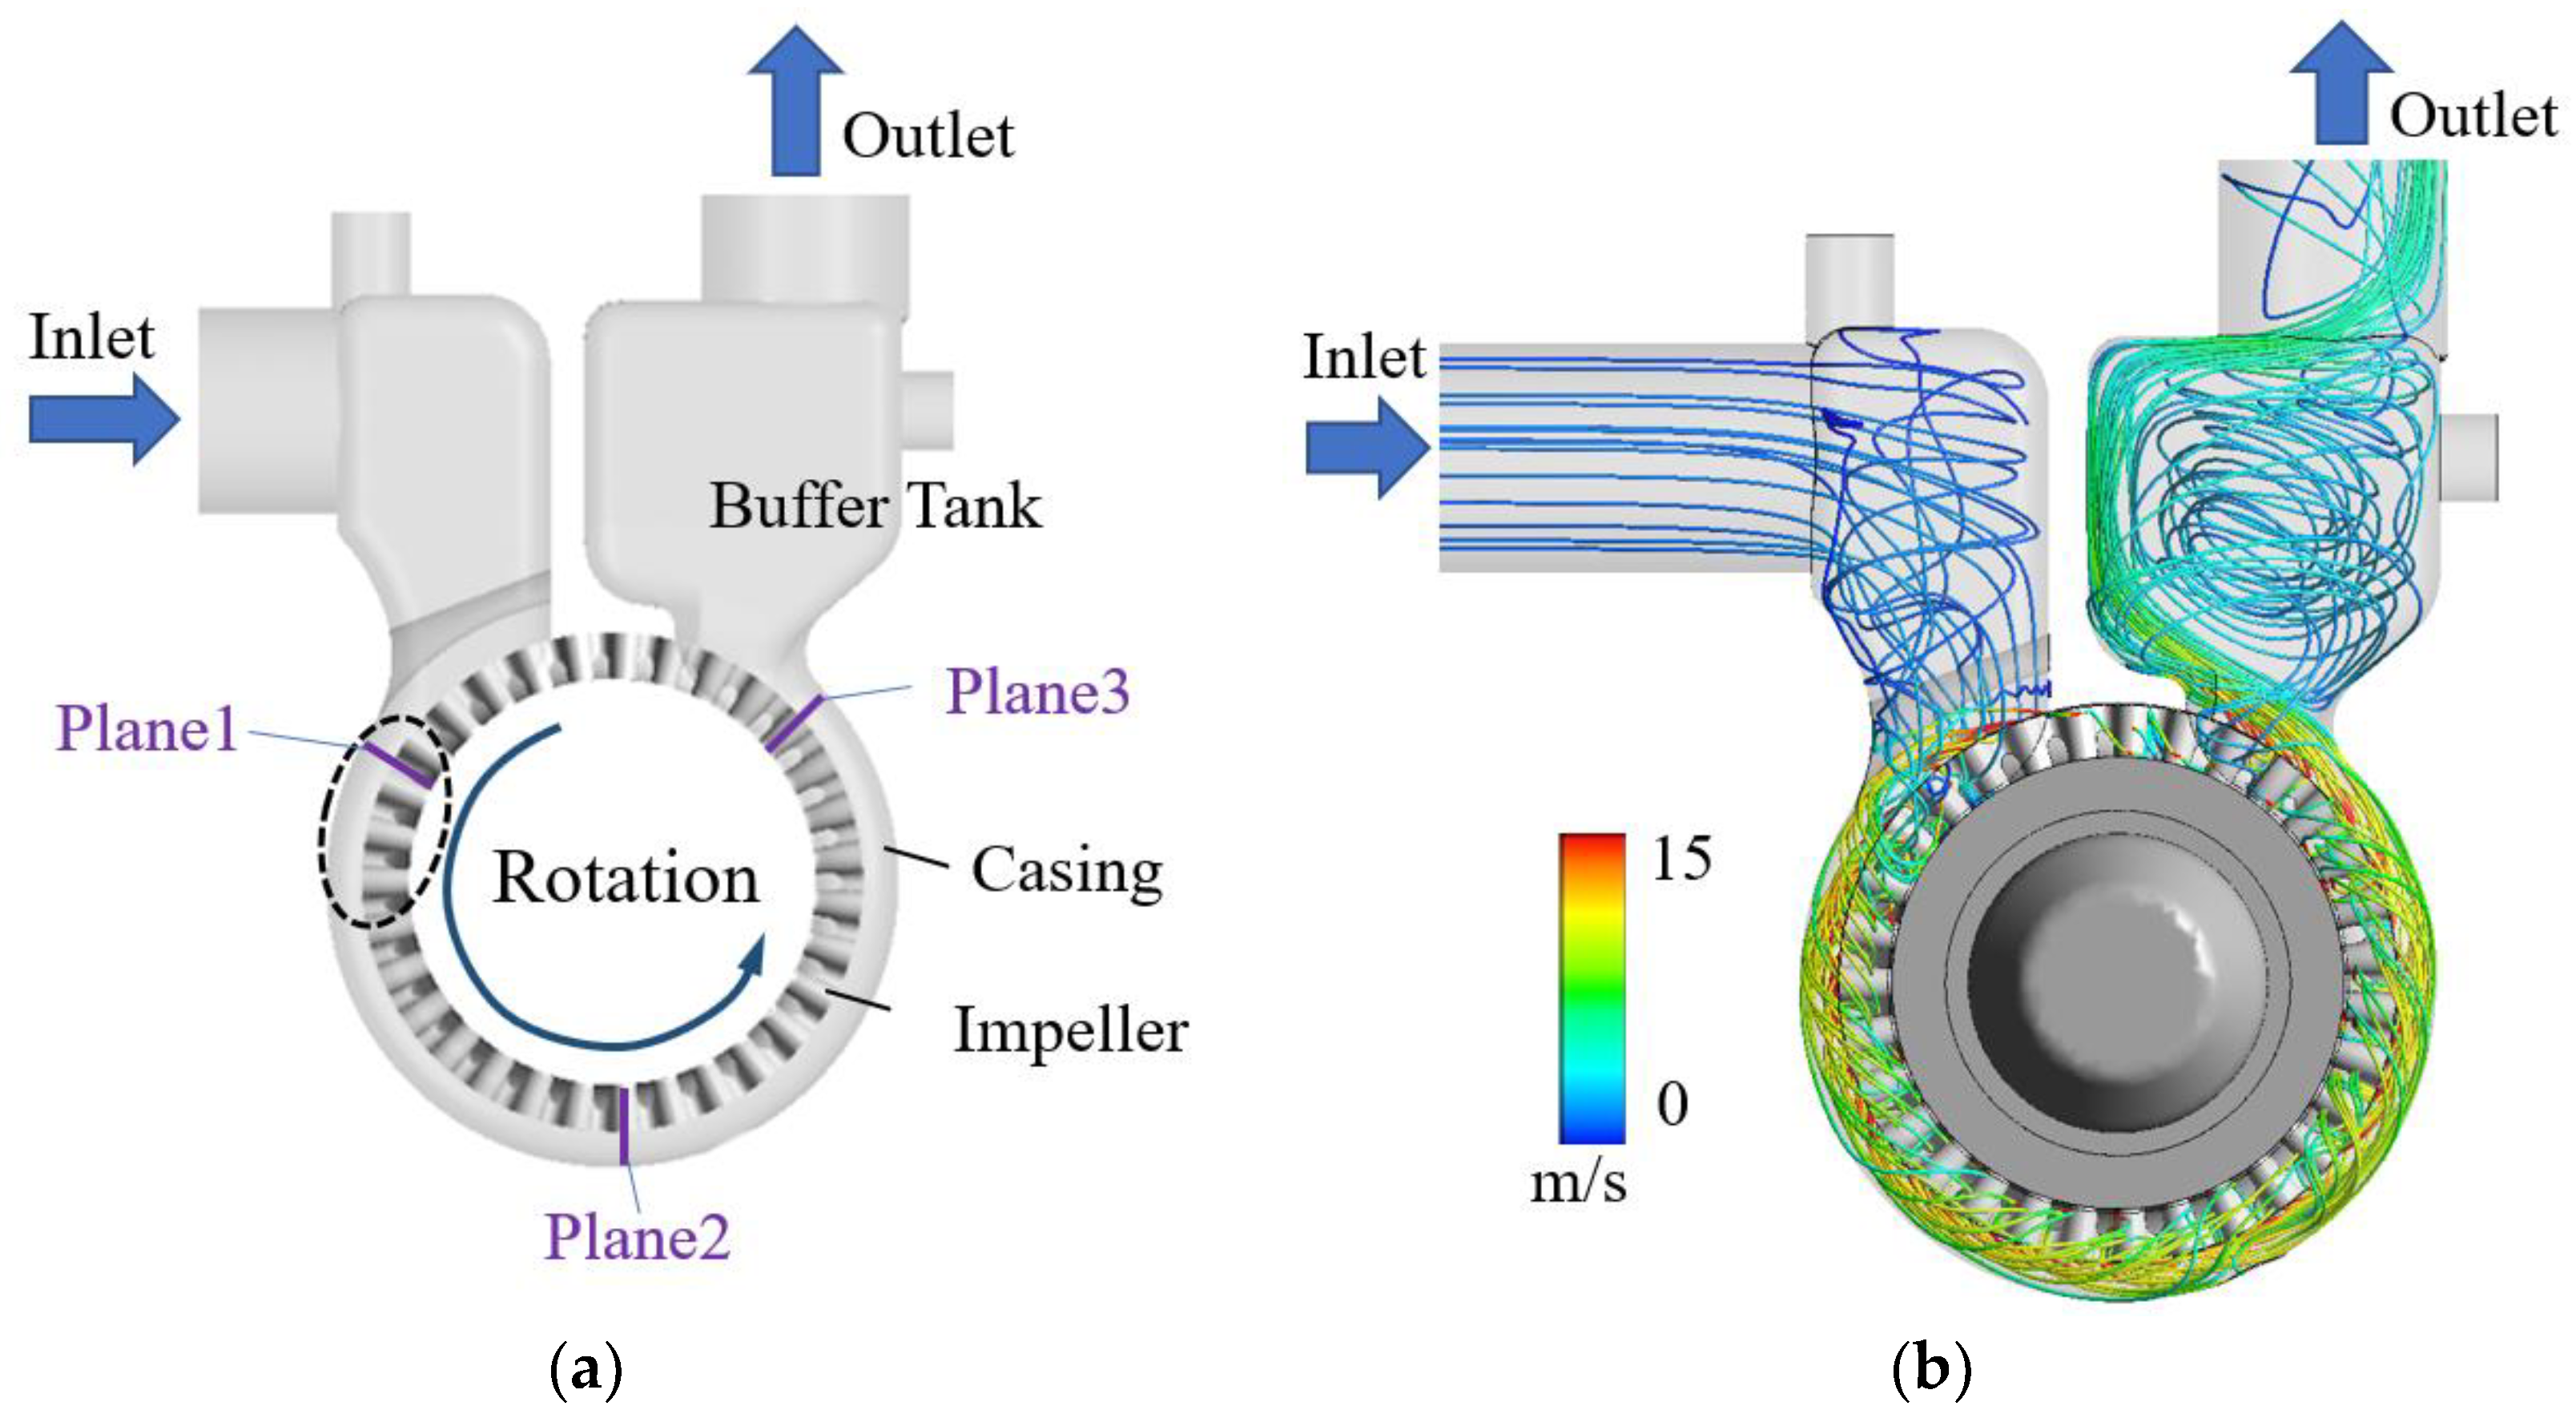
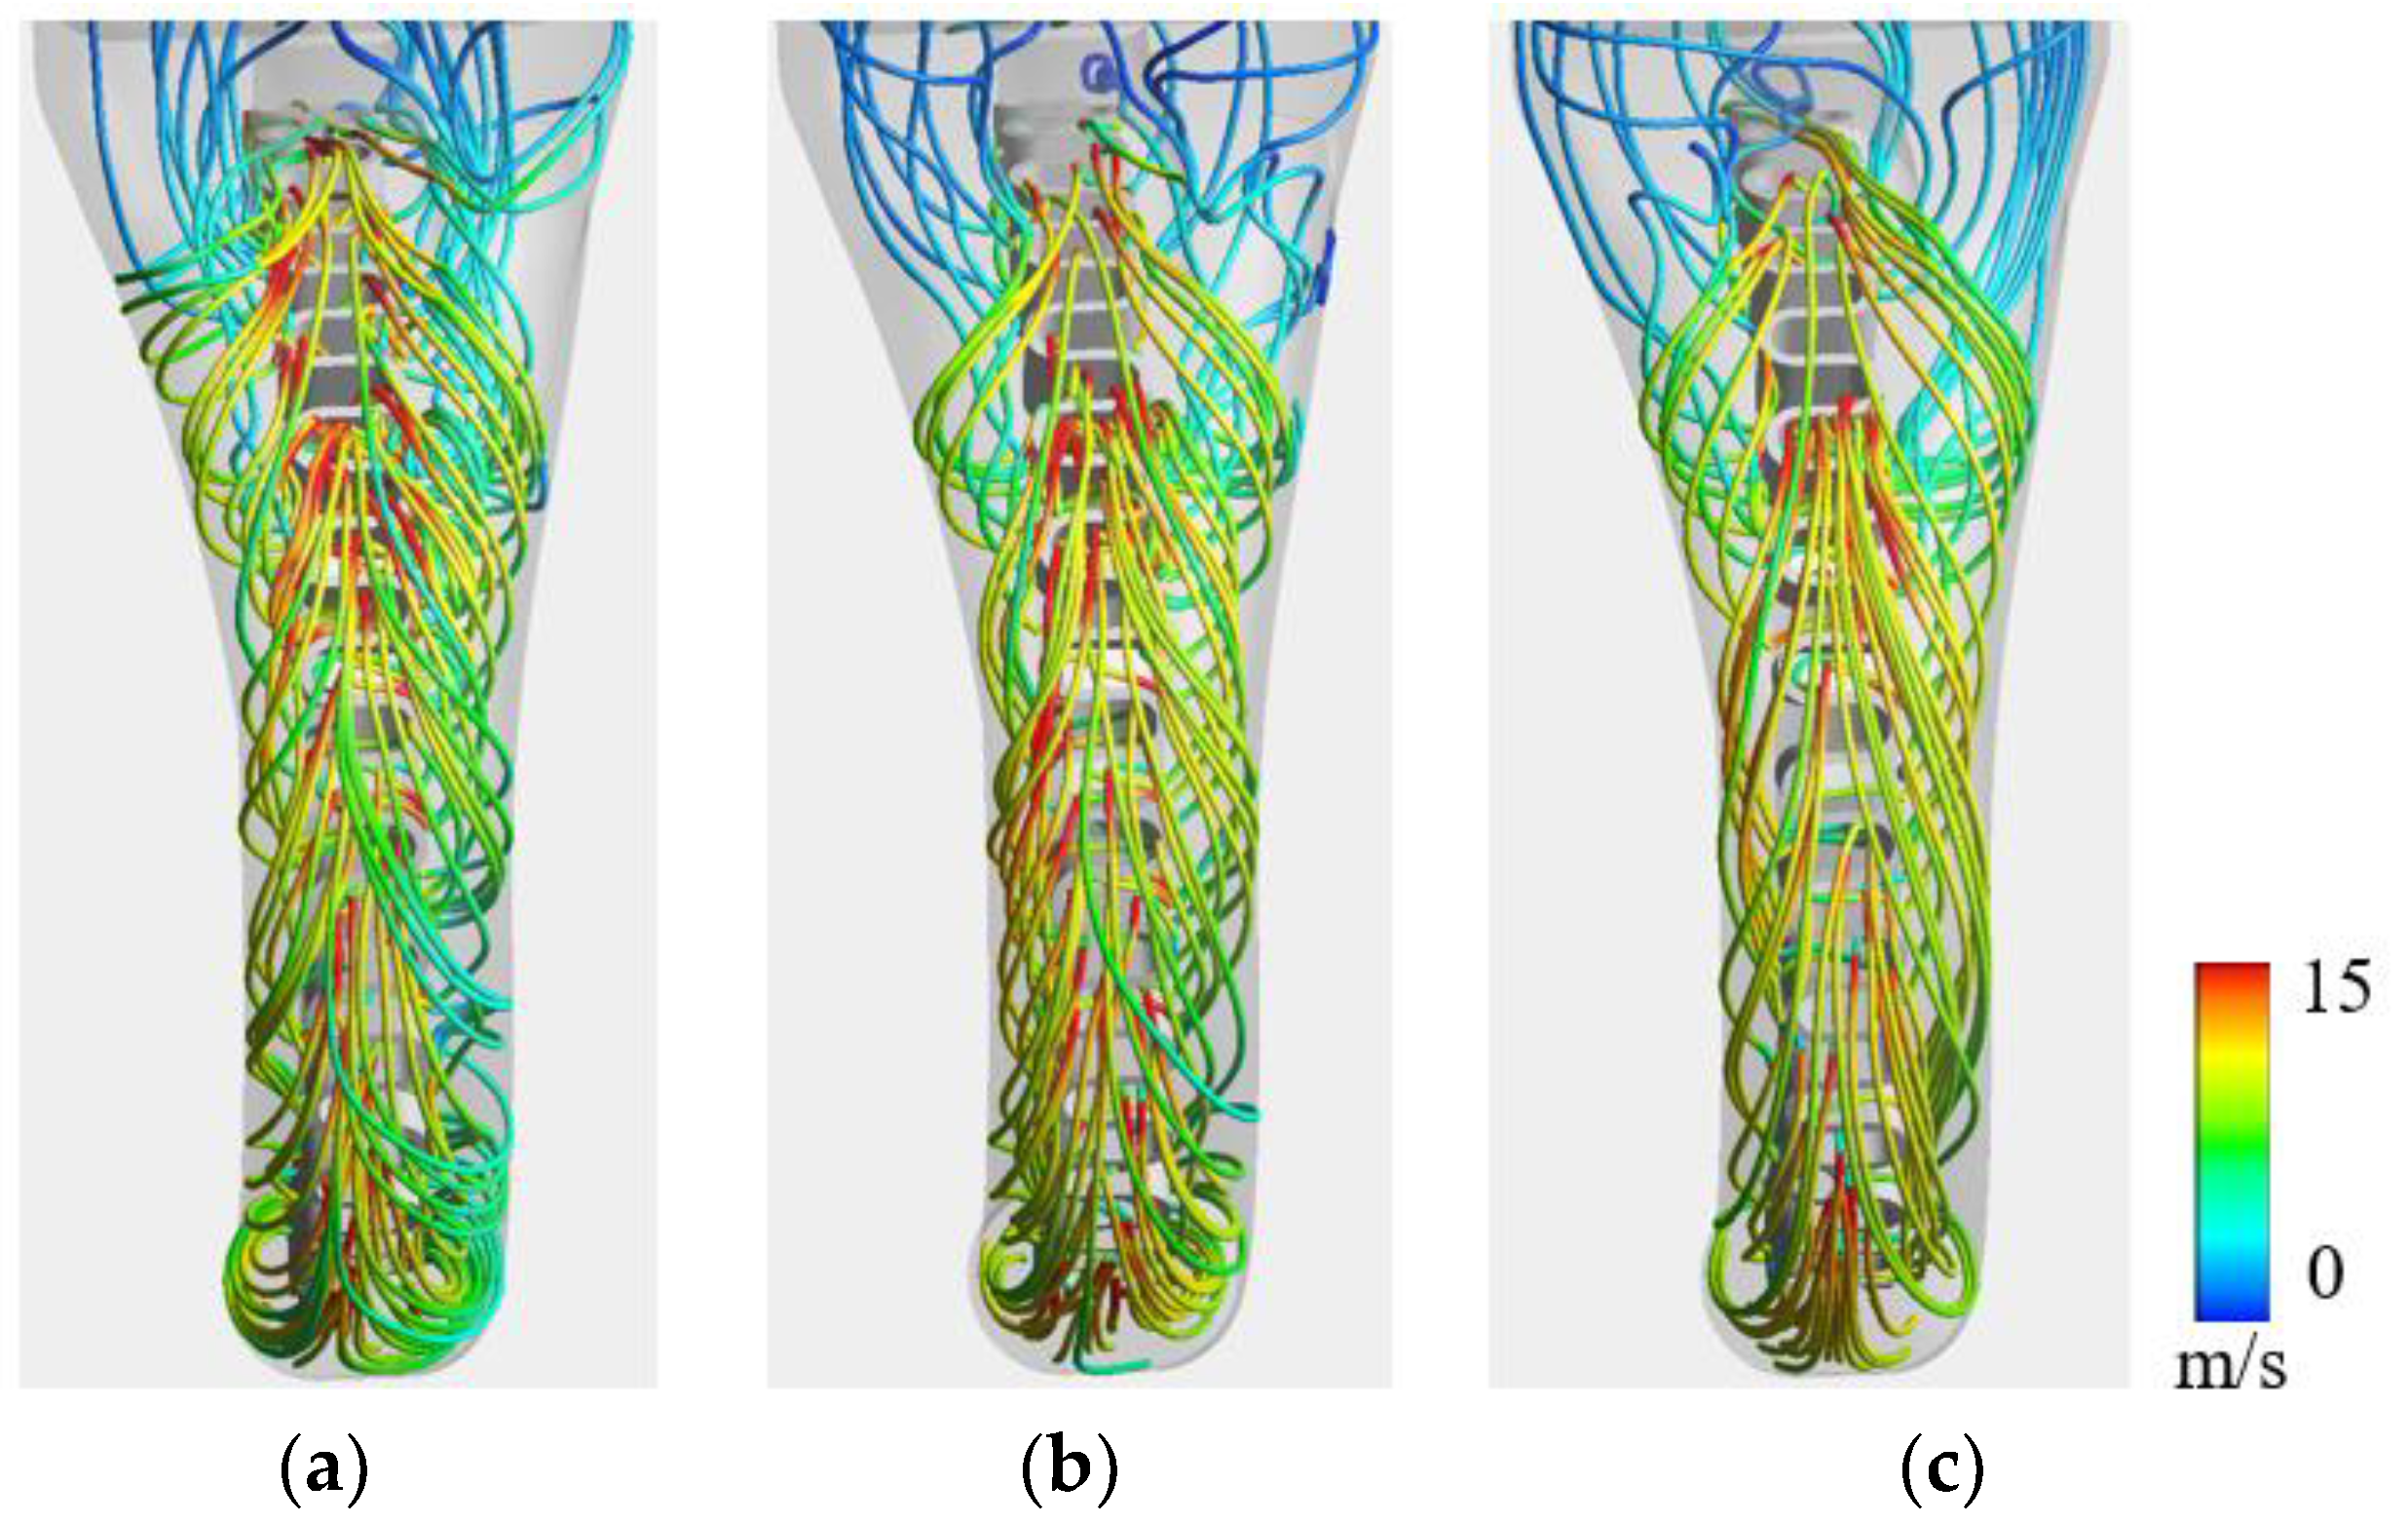
Figure 11 shows the streamlines inside the microbubble pump colored by velocity at the design operating condition. The flow comes through the inlet duct and is accelerated by the rotation of the impeller. The flow into the side of the 62 impeller blades is observed to be relatively fast at the blade tip due to the vortical flow generated inside each blade, as shown in
Figure 12. The velocity imparted by the blade tip is mixed and discharged in the buffer tank after passing through the impeller. It is noted that the behavior of the streamlines inside the blades is similar regardless of the flow conditions.
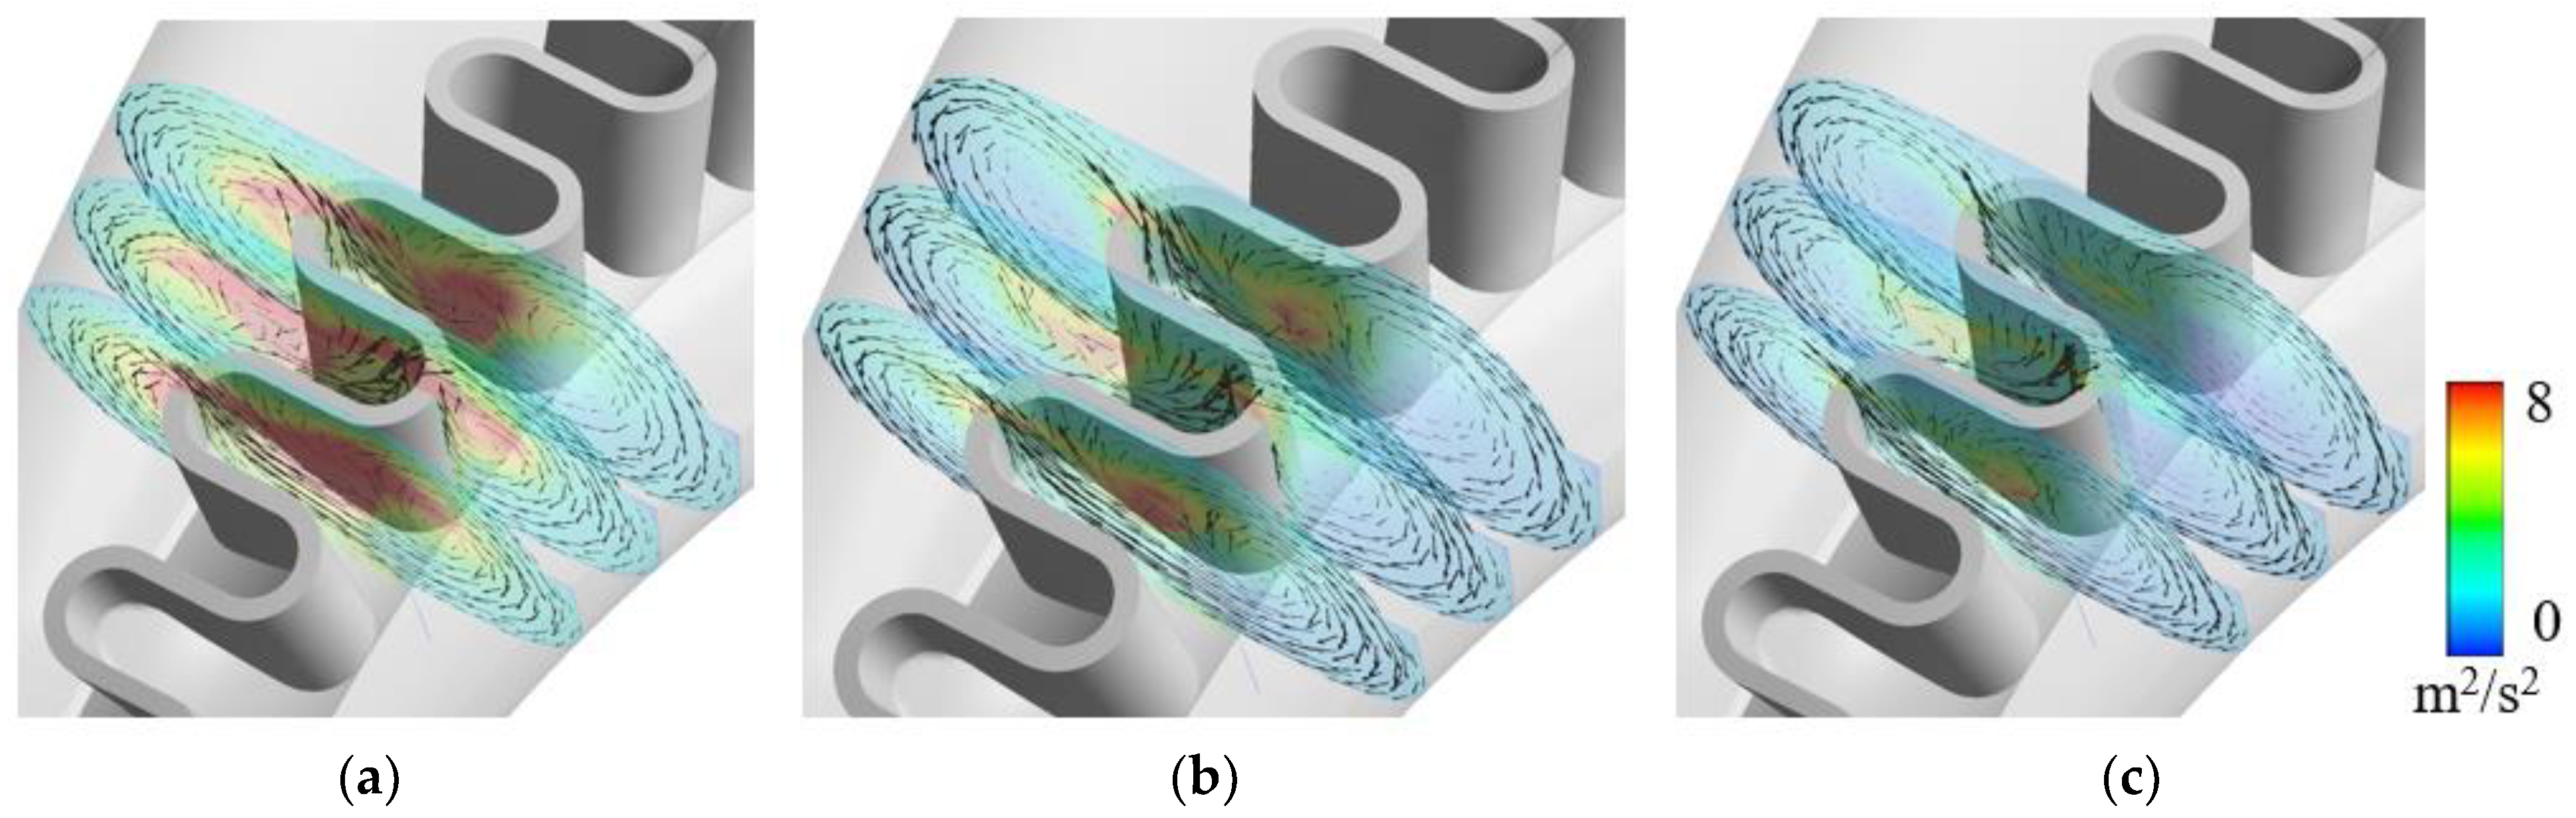
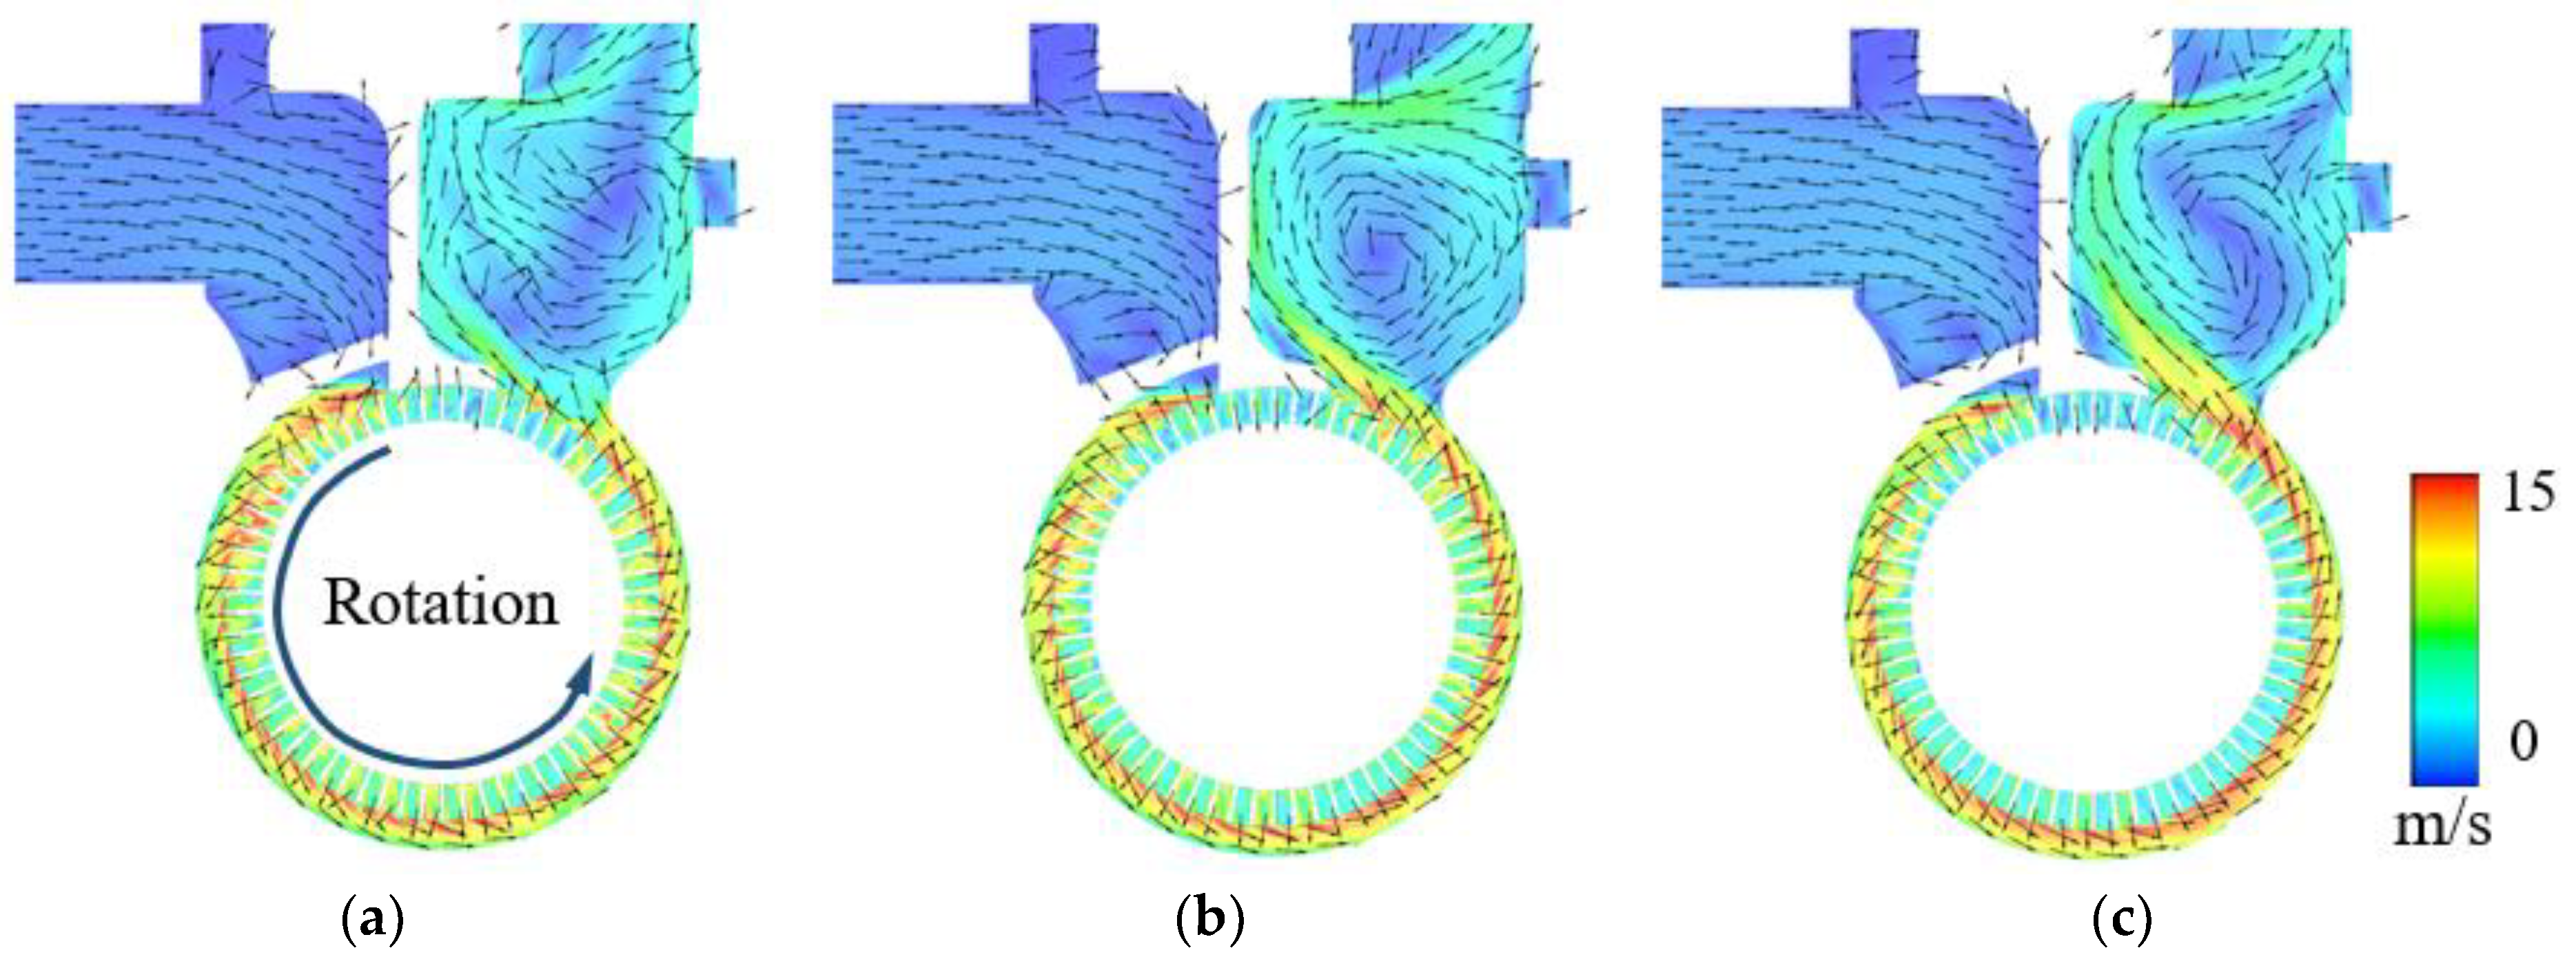
Figure 13 shows the turbulent kinetic energy and the tangential velocity vectors on the normal planes near the inlet region. The three planes are in the vicinity of the impeller after passing through the inlet duct at the location indicated by the dashed line in
Figure 11a. As shown in the figure, it can be seen that a large vortical flow is observed inside each impeller, which is the concave part of the ‘S-shape’ impeller. Turbulent kinetic energy has a higher value as the flowrate is relatively small compared to the design flow condition. It is noted that violent mixing between the internal flow inside the impeller and the channel flow increases turbulent kinetic energy. In the design flow condition, the highest magnitudes of the recirculating flow were observed as compared to the other two flow conditions. The highest recirculating flow observed in the design flow condition helps to achieve a better momentum exchange, thus increasing the overall efficiency of pump. The relatively high turbulent kinetic energy in lower-flow conditions corresponds to high relative uncertainty, as shown in
Figure 10a.
Figure 14 shows velocity and tangential velocity vectors on the mid-width plane of the pump impeller for the design and off-design operating conditions. As the flowrate increases, relatively high concentrated flow velocity distributions are observed in the direction of impeller rotation. It is noted that a relatively vital mixing flow at lower flow conditions is distributed inside the buffer tank due to high fluctuation. In the space between the pump casing and the tip of the impeller, the combined flow with the rotational and the normal direction of the impeller is observed. As Choi et al. [
7] reported, the angle between incoming fluid direction and blade is of key importance for the overall performance of the pump impeller in terms of lower vortex generation. The figure also demonstrates this statement at three different flow conditions. Due to the optimal design of the impeller with ‘S-shape’ blades, velocity vectors observed near the impeller are mostly in line with impeller blades.
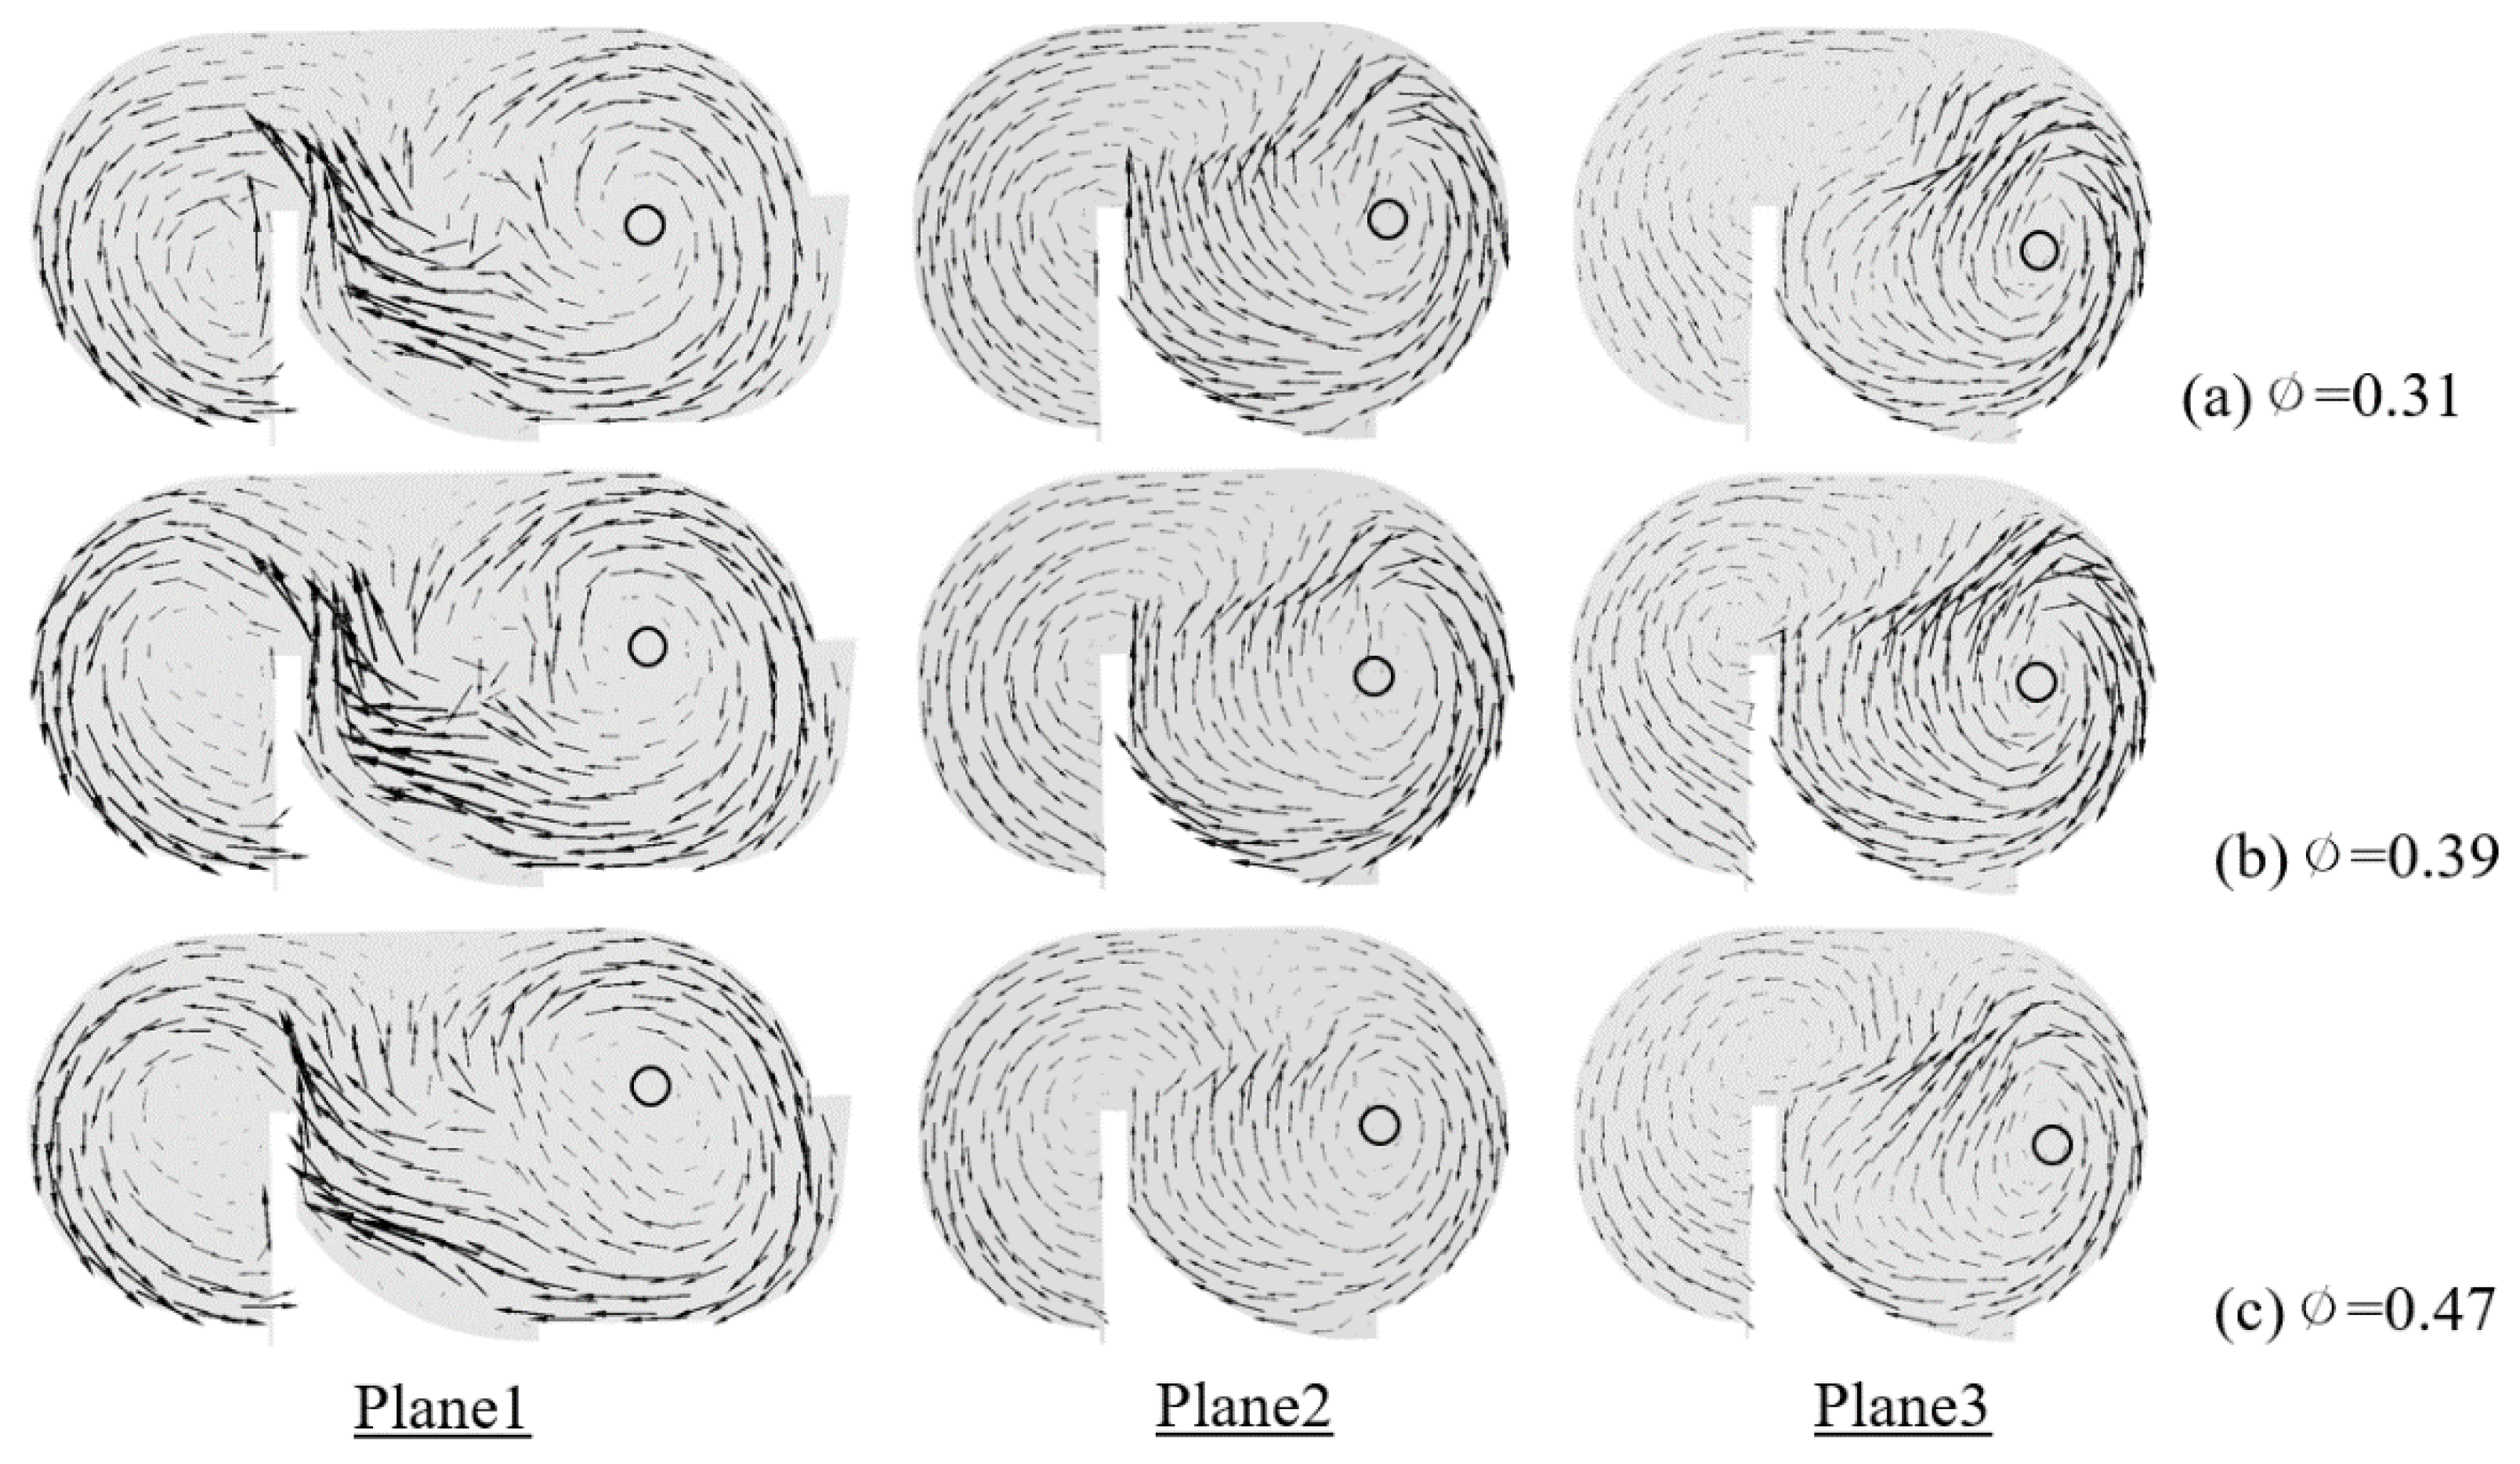
Figure 15 shows the tangential velocity vectors on the mid-width plane of the pump impeller shown in
Figure 11a for the design and off-design operating conditions. As shown in
Figure 11a, the three measuring positions correspond to the pump inlet (θ = 0°), middle (θ = 120°), and outlet (θ = 240°). The small circles in the figure represent the center of the recirculating flow. In pumps with a regenerative impeller, such as the ‘S-shape’ impeller, the flow inside the pump can be one of two types, tangential flow surrounded by the impeller and recirculating flow formed inside the impeller [
6]. The recirculating flow, including axial, radial, and tangential components, are responsible for the energy transport, which causes violent mixing between the internal flow inside the impeller and the channel flow.
In the design flow condition with a flow coefficient of 0.39, a relatively large circulating flow is observed compared to the other flow conditions. It is noted that a larger recirculation flow increases momentum exchange due to the higher tangential velocity, thus resulting in the high pump efficiency shown in
Figure 9. The recirculation flow formed in the concave region of the impeller blade is not sufficiently developed at the inlet of the pump (Plane 1), so it shows eccentricity. It develops a full circular shape at Plane 2 and decreases somewhat due to increased rotational force by high pressure near the pump outlet (Plane 3).
On the other hand, in off-design flow conditions, the formation of recirculating flow is relatively small compared to the design flow condition, the low-speed flow region increases at lower flow conditions. At the same time, the intensity of the rotational speed around the recirculation flow also decreases in the high-flow condition. It is no use to say that the increase in the magnitude and intensity of the circulation flow generated inside the blades contributes to the increase in pump efficiency by increasing the momentum energy.
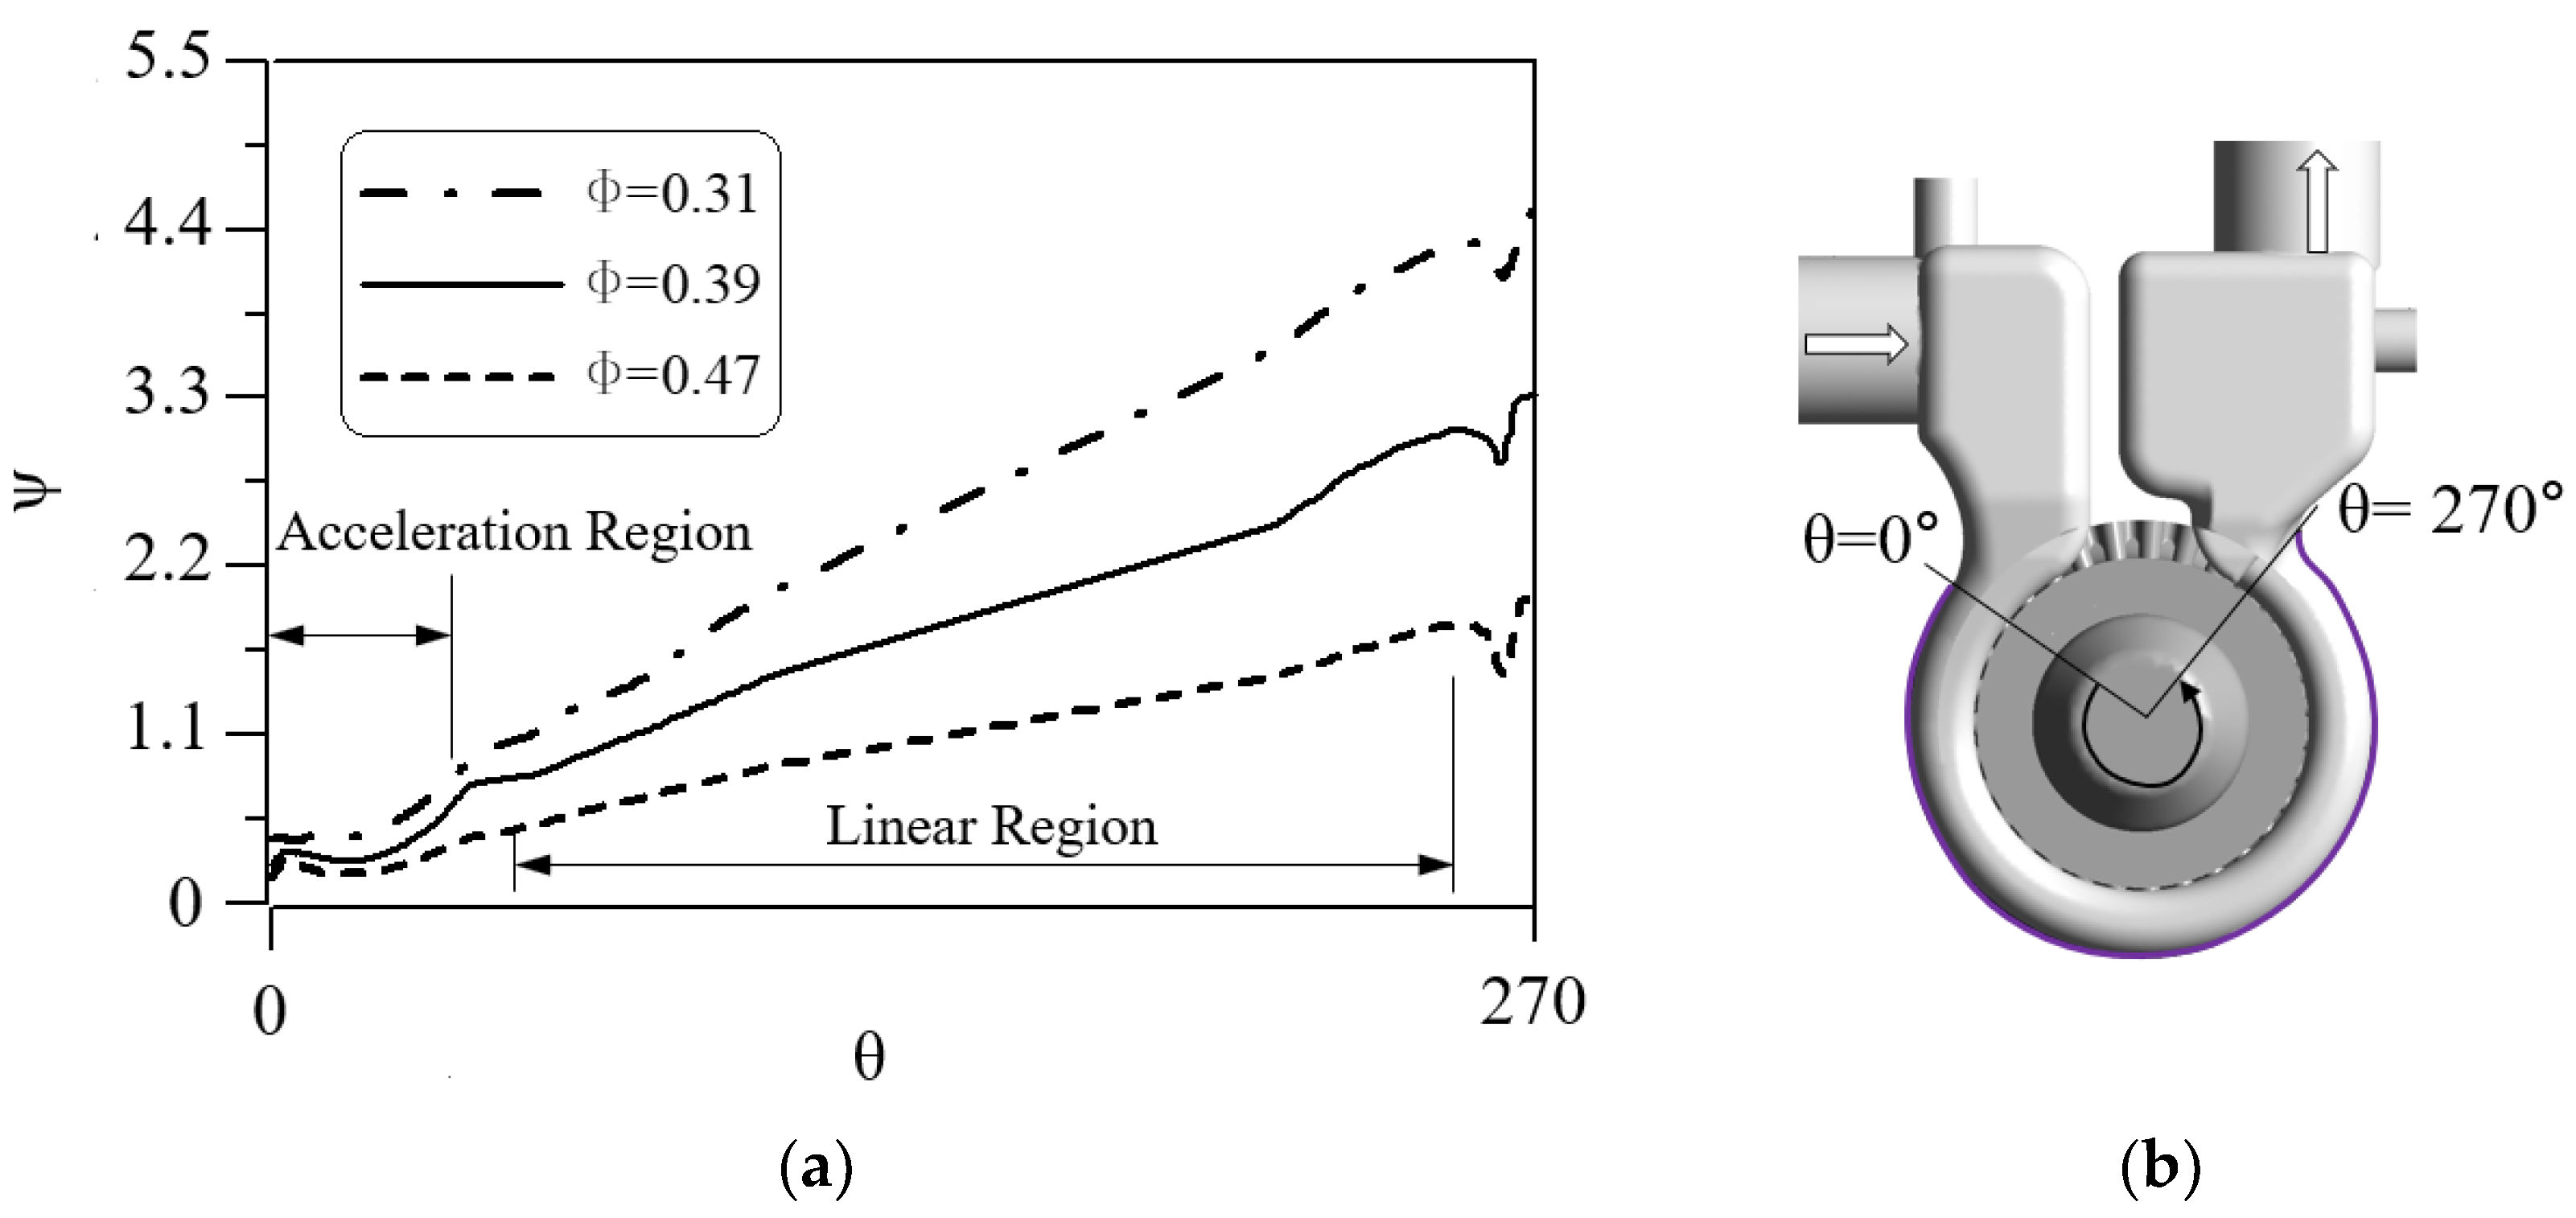
Figure 16 shows the pressure comparisons along the volute casing of the pump for the design and off-design operating conditions. The measuring position is indicated by a solid purple line, as shown in
Figure 16b. It is known that pressure along the pump casing is composed of an ‘acceleration–linear–deceleration’ pattern. It was found that there is an acceleration and a linear region of the pump in the three flow conditions, which shows the distinctive nature of the regenerative impeller. As shown in the figure, the pressure gradient increases as the flow rate increases in the linear region along the rotational direction of the impeller. Although the gradient of pressure-rise is almost similar for three flow conditions, flow characteristics such as velocity patterns and vortex generation are quite different, as shown in
Figure 14 and
Figure 15. Jeon et al. [
4] also reported similar findings related to such impellers.
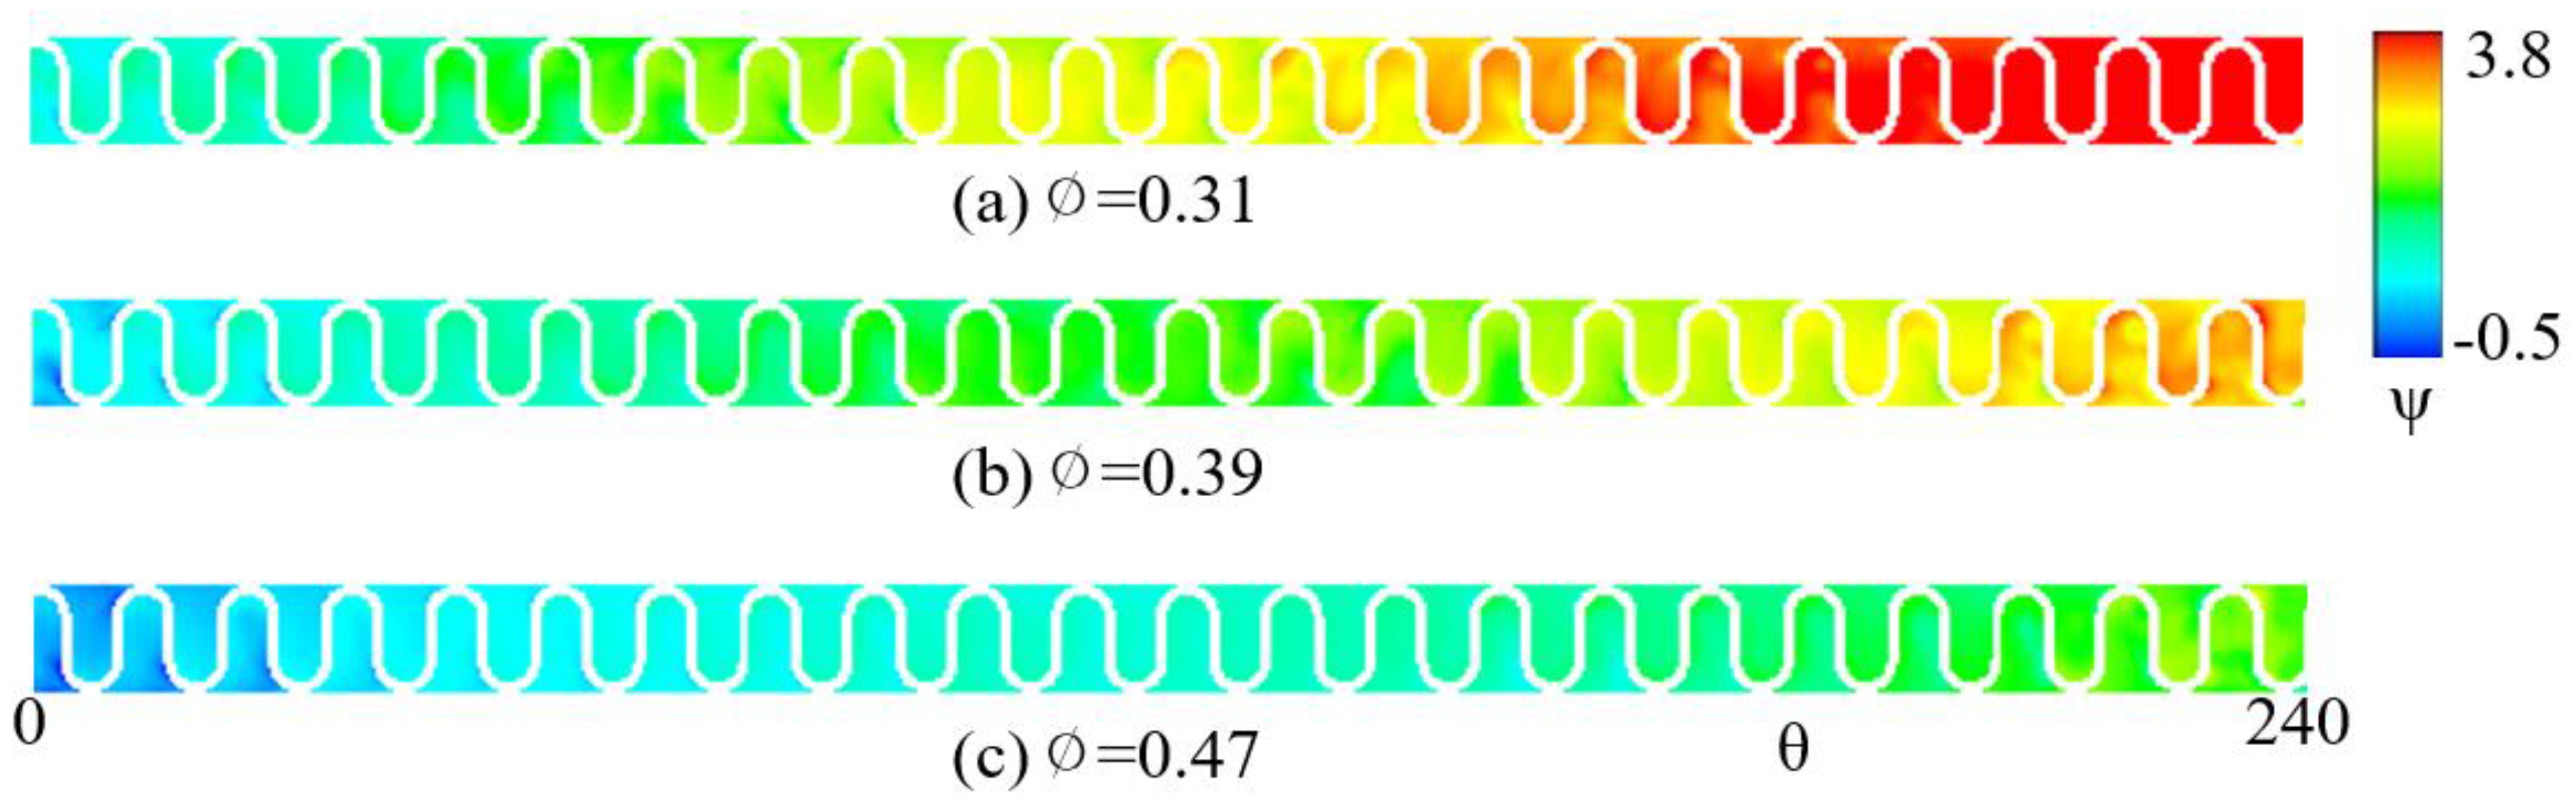
Figure 17 shows the pressure at the 90 percent span of the impeller for the design and off-design operating conditions. As shown in the figure, pressure increases with the rotation of the pump impeller, while relatively high pressure is observed as the flowrate decreases. The negative (suction) pressure at the inlet due to the rotation of the pump impeller increases as the flowrate increases, and the pressure at the pump outlet side increases as the flow rate decreases.
5.4. Limitations of the Present Study
There are a few limitations of the present study that must be mentioned in order to make the results more straightforward. Some of the limitations are as follows:
The uncertainty model for the measurement presented in Equation (4) is over-simplified. It does not consider random and bias type errors separately. It is more of a statistical tool rather than integrating all sources of error. However, it still provides accuracy up to an allowable limit in the case of pump experiments.
Generally, all sources of errors must be identified and their impact on accuracy must be calculated separately. However, in this study, such a procedure was not followed due to the limitation of equipment and other resources.
6. Conclusions
Internal flow characteristics in the microbubble pump with a novel ‘S-shape’ impeller in the design and off-design flow conditions were analyzed by three-dimensional numerical simulation and experimental measurements. Unlike a conventional regenerative impeller with a cantilever structure, the newly designed ‘S-shape’ impeller has a robust structure and higher performance. Relative uncertainty and statistical turbulence intensity were introduced for uncertainty and error analysis of the measured performance data of the pump acquired during experiments.
Using numerical simulations, internal flow characteristics according to flow conditions were compared and analyzed in the design and off-design flow conditions. Although the behavior of the streamlines inside the impeller blades is similar regardless of the flow conditions, turbulent kinetic energy has a higher value while the flowrate is relatively small. The increase in turbulent kinetic energy is mainly due to the violent mixing between the internal flow inside the impeller and the channel flow. The higher turbulent kinetic energy observed in the lower-flow condition corresponds to the higher relative uncertainty.
In pumps with a regenerative impeller, such as the ‘S-shape’ impeller, the recirculating flow, including axial, radial, and tangential components, is responsible for energy transport, which causes violent mixing between the internal flow inside the impeller and the channel flow. In the design flow condition, the highest magnitudes of the recirculating flow are observed, as compared to the other two flow conditions. It is noted that such recirculating flow helps to achieve a better momentum exchange by increasing the overall efficiency of pump. Pressure increases along the pump casing exhibit an ‘acceleration–linear–deceleration’ pattern. In the present numerical simulation, the pressure gradient increases as the flow rate increases along the rotational direction of the impeller.


