Abstract
This work aims at investigating the reduction/oxidation (redox) reaction kinetics on iron oxide pellets under different operating conditions of thermochemical hydrogen storage. In order to reduce the iron oxide pellets (90% Fe2O3, 10% stabilizing cement), hydrogen (H2) is applied in different concentrations with nitrogen (N2), as a carrier gas, at temperatures between between and , thus simulating the charging phase. The discharge phase is triggered by the flow of a mixture out of steam (H2O) and N2 at different concentrations in the same temperature range, resulting in the oxidizing of the previously reduced pellets. All investigations were carried out in a thermo-gravimetric analyzer (TGA) with a flow rate of . To describe the obtained kinetic results, a simplified analytical model, based on the linear driving force model, was developed. The investigated iron oxide pellets showed a stable redox performance of 23.8% weight reduction/gain, which corresponds to a volumetric storage density of , also after the 29 performed redox cycles. Recalling that there is no H2 stored during the storage phase but iron, the introduced hydrogen storage technology is deemed very promising for applications in urban areas as day-night or seasonal storage for green hydrogen.
1. Introduction
Recently, the adverse effects of climate change have become more and more obvious [1]. The reason behind this development is identified in the global energy-related greenhouse and CO2 gas emissions. Although these are periodically flattening out, they have increased by an average of 1% per year over the last ten years [2]. In order to counteract this development, constructive approaches are needed to implement a global transformation of the energy systems dominated by fossil fuels. By an intelligent combination of wind, solar, as well as bio energy with efficient energy storage along with an effective power recovery system, a decentralized “green” energy supply can be realized. Hereby, different energy sectors of industrial plants and urban residential areas can be supplied with “green” energy [3,4]. Hydrogen as an energy carrier offers ideal conditions for such a cross-sectoral “green” energy supply, since in addition to stationary energy applications, it can also contribute to the decarbonization of the transport sector [4,5]. Furthermore, hydrogen, as a clean energy carrier, has the potential to provide the much-needed flexibility to power systems, acting as a buffer to non-dispatchable renewable energy generation, and can, therefore, play a key role in seasonal balancing of renewable generation by storing large amounts of hydrogen [2].
Indeed, the efficient and safe storage of hydrogen is still a technical challenge. Problems here include the embrittlement and diffusion with a variety of constructions materials, including most plastics and mild steel. In addition, hydrogen requires special safety regulations and has a low volumetric energy storage density (ESD). The gravimetric chemical ESD of hydrogen, of , is, however, the highest of all gases, but under normal conditions, it has only 30% of the volumetric ESD of natural gas (≈); namely, [4]. The most common H2 storage technologies, to increase its volumetric ESD, are compression and the liquefaction. For compressed gas storage of hydrogen (CGH2), the gas is usually compressed to pressures between 20 and , in the mobility range up to [5]. This increases the ESD from () at to () at [5,6]. However, approximately 9 to 12% of the final energy provided is consumed for the compression of hydrogen from atmospheric pressure to or , respectively [7]. For the seasonal long-term storage of large quantities of hydrogen via pressure storage, various concepts with underground caverns are being investigated and implemented [4,8,9]. Depending on the specifications and technical feasibility, they can be constructed at depths until , having geometric volumes of up to 1,000,000 m, typical heights of 300 to , and diameters of 50 to . They can be operated at pressures of up to or even above , depending on the depth [8]. This technology is simple and inexpensive, but there are limitations due to the low volumetric ESD and the high risk of accidents. In case of an accident, hydrogen is released instantaneously over time, which remarkably enhances the risk of explosion [10].
Another H2 storage technology is the liquefaction of hydrogen. Using cryogenic systems, the gas is cooled down to at ≈. Thereby, ESDs of up to () are achieved ([6,9]). The required energy to liquefy H2 lies, however, between 20% and 50% of the lower heating value of hydrogen, depending on the plant size [11].
A combination of the compression and liquefaction techniques is the cryo-compressed hydrogen (CcH2) storage. Hydrogen is stored in an insulated tank that can resist cryogenic temperatures () and high pressure (at least ). The fact that the tank, in contrast to LH2, is able to withstand high pressures extends the time until evaporation losses begin. Furthermore, with an increase in density from () for CGH2 and () for LH2 to () for CcH2, larger amounts of hydrogen can be stored [6,12].
In addition to the described hydrogen storage options, various research institutions around the world are working on further physical and or chemical sorption storage systems in liquids [9,11,13,14] or solids [15,16,17,18,19,20,21,22]. Under specific temperature and pressure conditions, hydrogen can be stored via a sorption process in organic, as well as inorganic materials. Such reversible processes offer some advantages in volumetric ESD and safety compared to physical storage. Organic carrier systems, e.g., dibenzyltoluene (HDBT)/perhydro dibenzyltoluene (HDBT), are also known as liquid organic hydrogen carriers (LOHCs) [9]. Charging and discharging take place by means of a catalytic hydrogenation and dehydrogenation. During hydrogenation, the reaction takes place typically at temperatures around and and in discharge at up to and a slight overpressure [11]. The resulting hydrogenated liquid has physico-chemical properties comparable to diesel and can, therefore, be stored and transported easily [23]. This provides the main advantage of LOHC technology: hydrogen can be safely stored and transported in a chemically bound form under ambient conditions [9]. Furthermore, an ESD of up to of hydrogen related to the total weight of the carrier is possible, whereby a volumetric ESD of up to is reachable [14,23]. One of the challenges of LOHC technology is still the thermal management of the process. For efficient process design, heat, arising during the exothermic hydrogenation, must be reused during the endothermic dehydrogenation process [9]. Additionally, a purification of the hydrogen released from the carrier is needed after the discharge process [11].
Inorganic hydrogen carriers are also available in a solid state such as nanostructured materials and metal hydrides [7,24,25]. Nanostructured materials such as carbon nanotube and metal organic framework (MOF) systems can store hydrogen on materials with a high specific surface area by adsorption processes. MOFs are porous crystalline materials with a specific internal surface area of up to . They consist of organic linkers and inorganic metal oxide units with zirconium oxide [26]. Such an MOF may exhibit a theoretical ESD of up to [9]. Up to now, no system can be tested at a demonstration scale, as the technology is still in the laboratory stage [27].
Compared to nanostructured materials, metal hydrides store hydrogen chemically by an exothermic absorption processes. Since the desorption is endothermic, an intelligent thermal control system is necessary. Research and development activities are still going on to improve the kinetics and stability of materials, as well as reducing the metal hydrides’ costs [28,29].
A promising approach for hydrogen storage is the thermochemical reduction and oxidation of metals (M)/metal oxides () [11,15,30], which can be generally described by:
In contrast to previous systems, the solid material does not work as a carrier material for hydrogen. The solid mass acts as a kind of catalyst for the oxidation of hydrogen to steam and backwards for the reduction of steam to hydrogen. Various metals, like Ce, Cu, Fe, Mn, Ni, and W, have been tested as the reaction mass [31]. From the holistic consideration of the material parameters—availability, costs, kinetics, and ESD—iron has been found to be the most adequate oxide carrier material [15,31,32]. The basis of the iron redox process was developed at the beginning of the 20th Century for the production of hydrogen, whereby the process also received its name “steam iron process” [33,34].
The current research and development activities are focusing mainly on increasing the hydrogen production rates, e.g., by reducing the sintering tendency of the iron-based active material [16]. During the repeated redox process, the pure metals undergo an aging process, which decreases the reaction behavior and long-term mechanical stability. To avoid aging, different inert components, e.g., Al2O3, CaO, SiO2, and/or ZrO2, can be used as stabilizers to improve both the chemical and mechanical properties [16,31].
The endothermic charging phase, in which the simplified reduction of magnetite (Fe3O4) to Fe is shown, can be described as:
Hydrogen reduces Fe3O4 first to wustite (simplified with FeO) and then to Fe. Hereby, H2 reacts to steam. The corresponding oxidation reaction, which follows also the two-stage reactions, is given by:
Based on the mass ratio of H2 to Fe in Equations (2) and (3), a theoretical maximum storage of hydrogen in iron of can be achieved, which results in a gravimetric ESD of . Depending on the composite ingredients (iron/stabilizer material) and the material geometry, the volumetric ESD varies considerably. A mixture of 90%-wt. iron oxide and 10%-wt. stabilizer material in a spherical geometry with leads to a theoretical volumetric ESD of up to . Due to the fact that the spherical storage masses are to be operated later in a tubular reactor, it is reasonable to assume a fixed bed porosity of 36%. Accordingly, the expected volumetric ESD amounts to .
Table 1 presents a summary of the volumetric storage densities for the discussed hydrogen storage technologies so far.

Table 1.
Summary of the most widely used hydrogen storage systems with their volumetric energy storage densities (ESDs). CGH2, compressed gas storage of hydrogen; CcH2, cryo-compressed hydrogen; LOHC, liquid organic hydrogen carrier.
The resulting high ESD of the redox storage process, as well as the low-cost advantage of the storage material “iron oxide” provide an excellent basis for the development of an efficient thermochemical energy storage concept. For these reasons, various research groups have been dealing with this type of hydrogen storage. One focus of the research work so far is the intermediate storage of hydrogen in a rechargeable oxide battery (ROB) [17,35]. To this aim, different small-scale samples (approximately thick rectangular tape-cast form) have been developed and investigated in gas mixtures consisting of a H2O/H2 ratio of 1:4 during fuel cell mode and 4:1 during electrolyzer mode at an operating temperature of . Different additive materials like Al2O3, CaCO3, Cuo, MgO, ZrO2, and 8YSZ have been applied to enhance the cyclic stability under the described process parameters. The best stability results of 200 cycles, each having a duration, could be obtained by applying 30% of 8YSZ to the iron oxide form, however at the cost of sharply reducing the ESD from to due to the excessive amount of additive needed. Here, the ESD is related to the higher heat value, as well as to the educt side of Equation (3). Furthermore, 8YSZ is extremely expensive, so that the authors, themselves, recommended not to apply it in future work [16]. In further publications, they focused on the application of clearly less expensive additives like CaCO3 [30].
One of the main challenges in the storage process via the steam iron process is to develop an iron oxide mixture that is capable of sustaining long-term thermal and reactive cycling processes between and . On the other hand, the redox storage of H2 could offer high storage performance due to the strong binding of hydrogen and the high ESD [26,27]. Furthermore, hydrogen is not stored directly, which provides a considerable safety advantage against, e.g., hydrogen compression storage. Finally, the storage principle offers promising integration possibilities with industrial processes working at elevated temperatures like hydrogen pyrolysis [36] or H2 production/combustion via solid oxide fuel cell technologies [37].
The overall goal of our research group is to develop a redox storage technology based on promising iron oxide pellets [38] as a stand-alone renewable energy storage and supply system for urban quarters and industry premises. Figure 1 depicts a schematic of the redox-storage integration in one possible complete system. During the charging phase, water is split into H2 and O2 in an electrolyzer with the help of the surplus renewable electricity. The produced green hydrogen flows into the redox reactor, where it reduces iron oxide to iron and water vapor according to Equation (2). The heat demand shall be supplied by the waste heat of the electrolyzer. During the storage time, only iron exists inside the reactor. During the discharge phase, water vapor is introduced into the redox reactor, which oxidizes iron to iron oxide again, and hydrogen is released according to Equation (3). H2 flows into the fuel cell together with O2 out of its storage to cover both electricity and heat demands. Thermal energy storage shall be introduced inside the redox reactor or outside it to deliver the heat for the endothermic reduction of iron oxide and to store it during the exothermic oxidation of iron.
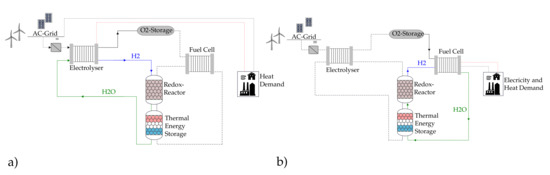
Figure 1.
Schematic of a renewable energy storage and supply system based on the redox concept. (a) Charging phase and (b) discharging phase (inspired by [39]).
In order to design the redox reactor and its thermal management system, the first development task, to be carried out, is to establish and validate a dynamic simulation model for the combined heat and mass transfer in such a reactive system. To this aim, the reaction kinetics of both the reduction and oxidation phases shall be measured under different boundary conditions. This work presents, therefore, an experimental study on the redox reaction kinetics of single iron oxide pellets [38] under different process parameters applying a thermo-gravimetric analyzer (TGA). The redox reactions are experimentally investigated at the reaction temperatures of , , and . In addition, the effect of the reactant gas composition at a reactant gas flow rate of is investigated. Moreover, the effect of the pellet diameter on the redox reactions’ kinetics is investigated. Finally, the kinetic performance of the investigated pellets is checked after 29 redox cycles in comparison with the start of life performance. To evaluate the structure of the investigated iron oxide pellets before and after repeated redox cycles, a micro-computer tomography (μCT) unit is applied.
2. Materials and Methods
The reaction kinetics of the iron oxide samples were determined by the setup, depicted schematically in Figure 2, in which a hydrogen conform thermo-gravimetric analyzer device (STA 449-F3, Netzsch) builds the main component. The accuracy of the TGA device in weighting the samples amounts to , while the accuracy in adjusting the sample temperature is better than . For the reduction reaction, a gas mixture of N2 and H2 in different concentrations can be prepared by the applied mass flow controllers (MFCs) and fed into the TGA device, where the iron oxide pellets are placed. By means of the MFC, the concentrations can be adjusted by the flow of the reacting gas to ±0.5% in the range of 0 to . The oxidation of the previously reduced samples takes place with a H2O-N2 mixture. Steam is produced in a dedicated steam generator (DV2MK, ADROP). With a resolution of , a maximum steam flow rate of with an accuracy of 1% of the final value can be achieved. A vacuum pump is applied to evacuate the experimental setup after each experiment as a safety precaution. The measured values of the TGA system are stored locally on the measuring PC with a sampling rate of 200 points/min. To investigate the structure of the samples, a tomographic examination before and after the TGA experiments is performed using a μCT (v|tome|x s 240/180, GE Sensing & Inspection Technologies GmbH).
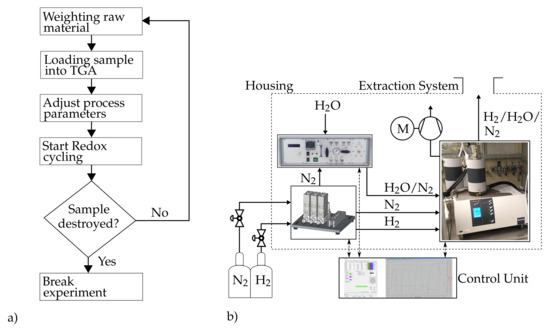
Figure 2.
(a) Flowchart for the experimental procedure; (b) TGA setup for the experimental investigation of the kinetics of the redox reactions.
The investigated samples, based on the recipe of [38], were acquired from the German company, Nacompex GmbH, Karl-Marx-Damm 85, 15526 Bad Saarow, Germany. The almost spherical sample consists of a mixture of 90% hematite (Fe2O3) and 10% support material of high-alumina cement [40]. After mixing and shaping processes, the pellets were dried for 28 days under ambient conditions, before they were sintered at for .
During the test campaign (see Figure 2), the reaction kinetics were measured at the gas mixture flow rates of . The molar concentration of the reducing and oxidizing gas mixtures was changed according to Table 2 for the different redox runs (ro–ro).
Table 2.
Influx molar concentrations of the reducing and oxidation gas mixtures during the four redox experiments ro to ro.
The redox reactions can take place between and , with the risk of sintering the iron composites at higher temperatures and the associated damage of the redox performance. Accordingly, the upper temperature limit at which sintering can take place was tested here. The reduction/oxidation processes were carried out at isothermal conditions of , , or . Additionally, two sizes of the iron oxide pellets were investigated, the first sample (S1) with and a mass of , as well as the second sample (S2) with and a mass of .
The oxidation atmosphere of 80/20 vol.% results from the maximum allowed steam concentration in the TGA reactor. At higher concentrations, undesired condensation may take place inside the weighing section of the TGA.
In order to evaluate the redox reaction kinetics, the instantaneous reduction/oxidation fraction is defined by Equation (4) as the instantaneous mass change of the sample relative to its initial mass, divided by the final (or maximum) mass change reached after the given reaction time.
with as the sample weight at time t, as the starting or smallest weight, and as the highest or final weight during the respective reduction/oxidation phase. To evaluate the obtained reaction kinetic curves, the time needed to achieve an oxidation fraction of or a reduction fraction of is chosen.
3. Results
At the beginning of this section, the principles of both redox reactions, as well as the phase of the iron oxide after the first redox cycle are presented and discussed based on the obtained kinetic results over three successive redox cycles. The second subsection introduces the effect of the composition of the reacting gas flow during the reduction and oxidation phases according to Table 2 on the reaction kinetics. Based on the obtained results, two analytical models for describing the kinetics of both reduction and oxidation reactions are developed, and their validity in predicting the reaction kinetics is assessed. The next subsection deals with the effect of the pellet size on both reactions’ kinetics. Afterwards, the effect of the temperature on both reactions’ kinetics is introduced. Finally, the effect of 29 redox cycles on the structure change of the investigated pellet S1 is presented.
3.1. Redox Principle
Figure 3 presents the temporal relative mass change or the reduction and oxidation fractions of the pellet sample S1 over three successive redox cycles (reduction+oxidation) at and a reactive gas flow rate of with the concentrations (cf. Table 2). After the first redox cycle, a relative mass change of 3.2% is observed. Cycles 2 and 3 show, however, a reversible relative mass change of ≈23.8%. The obtained relative mass reduction/increase represents, indeed, the mass of oxygen removed or gained upon reduction or oxidation of the iron mass in the pellet, respectively. The raw sample S1, before the very first reduction, consists of ≈90% of Fe2O3, which is reduced to Fe. In the subsequent reaction, Fe is oxidized, however to Fe3O4, as explained by Equation (3).
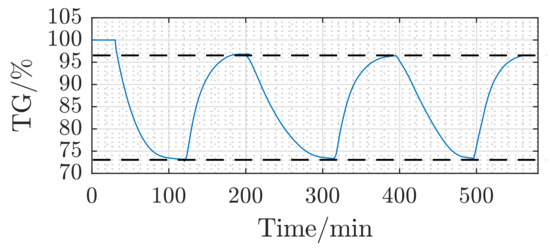
Figure 3.
Reaction behavior of Sample 1 (S1) at and with the gas concentration as defined in Table 2.
According to Equation (5), the difference between the mass of the same number of moles (12Fe) included in 4Fe3O4 or 6Fe2O3 corresponds to the mass of one mole of oxygen.
Recalling that the mole mass of Fe2O3 and Fe3O4 amounts to and , respectively, the relative mass reduction of Fe2O3 upon changing to Fe3O4 equals , which is the mole mass of O2. Being divided by the mass of six moles of Fe2O3 results in a relative mass change of 3.34%. With an ≈90%-wt. ratio of Fe2O3 inside the raw pellets, the net relative change of mass expected shall be in the order of 3%. The obtained experimental results in Figure 3, namely a relative mass change of about 3.2% between the first and the subsequent redox cycles, puts in evidence that Fe2O3 disappears after the first reduction and that the reversible reactions taking place afterwards are those defined by Equations (2) and (3).
As depicted in Figure 3, after the first oxidization of Fe to Fe3O4, the two successive redox cycles exhibit exactly the same relative mass change based on Equations (2) and (3). Figure 4 is introduced to give further evidence that Fe2O3 cannot be formed again under the experimental boundary conditions chosen in this work. It illustrates the oxygen’s partial pressure limits needed for the different reduction/oxidation reactions at different temperatures [41,42]. The upper solid line shows the oxygen partial pressure levels needed for the transition between Fe3O4 and Fe2O3, which lies completely outside the oxygen partial pressure limit curves (dashed lines), which correspond to the limit concentrations of the reactive gas mixtures (cf. Table 2). Accordingly, Fe cannot be oxidized back to Fe2O3 under the investigated boundary conditions.
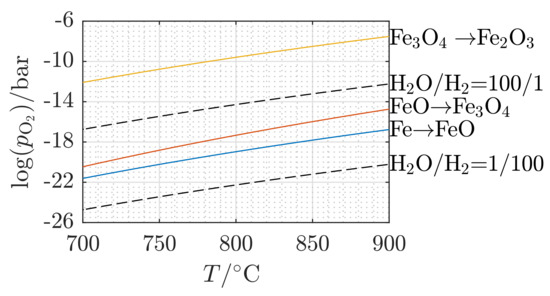
Figure 4.
Equilibrium partial pressure of oxygen in H2O/H2 mixtures as a function of temperature (dashed lines) compared to the dissociation pressures of the different iron oxide reactions (solid lines) (calculated on the basis of [42]).
The relative mass change between 3Fe in Fe3O4 and 3Fe according to Equations (2) and (3) amounts to the mass of two oxygen moles or . The expected relative mass change shall be 27.64% in case the pellets are made of 100% Fe2O3. Again with ≈90%-wt. of Fe2O3 in the pellets, a relative mass change upon reduction/oxidation is expected to be in the order of 24.88%. Figure 3 proves with a 23.8% relative mass change that the redox reactions after the first cycle do follow Equations (2) and (3). The obtained mass change of 23.8% corresponds to a volumetric hydrogen ESD of , based on the investigated S1 pellet geometry and a packed bed porosity of 36%. This ESD matches exactly with the estimated value in Table 1 based on the redox Equations (2) and (3).
3.2. Effect of the Process Gas Composition
Figure 5a depicts the relative reduction fractions of the investigated pellet S1 over the reduction cycles with different H2/N2 concentrations (cf. Table 2) at . The corresponding oxidation fractions at different H2O/N2 concentrations are illustrated in Figure 5b. The time needed to achieve a reduction of 80% of the maximum possible reduction () decreases to less than 10%, from down to as the H2 concentration in the reactive gas mixture increases from 10 to 100 vol.%, respectively. This result is in phase with the observations of [43]. The time needed for the oxidation reaction to reach decreases by 86% (from down to ) upon increasing the concentration of H2O in there active gas mixture from 10 to 80% (cf. Table 2). It can be also concluded that the reduction reactions are slower than the oxidation reactions. S1 requires to reach at a concentration of , while only are necessary to reach the equivalent oxidation fraction at the same oxidizing gas concentration ().
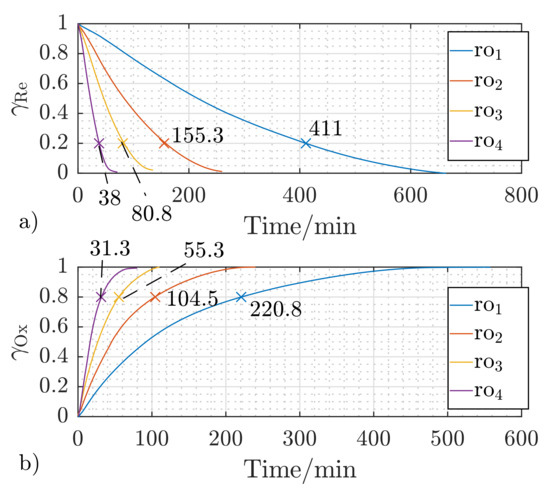
Figure 5.
Effect of the gas concentration to (cf. Table 2) on the temporal reduction (a) and oxidation (b) fractions of S1 at a reactant flow rate of and the reaction temperature of .
3.3. Analytical Model
As can be seen in Figure 5a,b, the relative mass changes of reduction and oxidation show almost a linear rise followed by flattening gradients down to zero. This temporal behavior can be approximated by the linear driving force (LDF) model [44], which is described by Equation (6).
Herein, the rate constant depends, among other factors, on the concentration. The LDF model simply describes the averaged mass change rate , resulting from the difference between the equilibrium mass and the averaged mass over the entire pellet volume ([45]).
Thereby, describes the initial relative mass change at , which shall decay with time according to the exponential Equation (7). In analogy to the parameterization of common adsorption models [46], the effective mass transfer coefficient k can be described with the reciprocal value of the characteristic time constant . Analyzing the obtained reaction kinetic curves of the investigated iron oxide pellets reveals that the oxidation kinetics do follow this rule quite well. Therefore, the effective mass transfer coefficient for the oxidation reactions is expressed as , and the temporal change of the oxidation fraction is accurately described by the exponential Equation (8), with the time constant as the time to reach () or of the final oxidation fraction.
In order, however, to best fit the obtained temporal change of the reduction fraction, the exponential term should be modified as described in Equation (9). First, the effective mass transfer and reduction reaction coefficient is described by , where a is a concentration-dependent parameter. Here, is the time required for the temporal reduction fraction to reach or of its maximum fraction (one at zero time). Second, the time variable t is raised to the exponent .
The estimated parameters for Equations (8) and (9) to best fit the experimental results obtained for the redox experiments to (cf. Table 2) are listed in Table 3.
The comparison between the experimental (E-) and analytical (A-) reduction and oxidation results is shown in Figure 6a,b. A very good agreement between the mathematical model in Equations (8) and (9) and the experimental results is achieved, which is indicated by an average deviation of less than 3%.
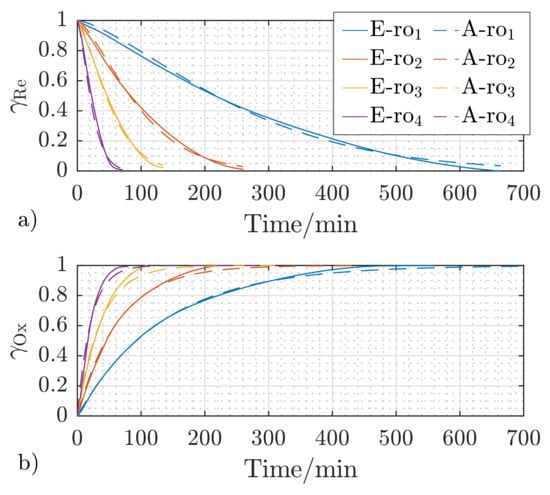
Figure 6.
Experimental (E-) and analytical (A-) reaction behavior of S1 at and for the gas concentrations to (cf. Table 2) for reduction (a) and oxidation (b).
3.4. Effect of the Pellet Size
In order to explore the effect of the pellet size on the redox reaction kinetics, dedicated measurements were carried out on samples S1 (, ) and S2 (, ). Figure 7 depicts the obtained reaction kinetic results for both samples at a temperature of , a reactant gas mixture flow rate of , and the gas concentration according to of Table 2. Reducing the sample diameter by 23% results in a decreasing of the reduction time at of 39% (from for S1 ( size) down to for S2 ( size)). The temporal change of the oxidation fraction shows almost the same trend with varying the pellet size. The time needed to reach an oxidation fraction of drops from with S1 down to with S2, implying a decrease of the oxidation time of 36%, as illustrated in Figure 7. Indeed, increasing the pellet size results in slowing down the solid state diffusion and, consequently, the reaction kinetics [43,47].
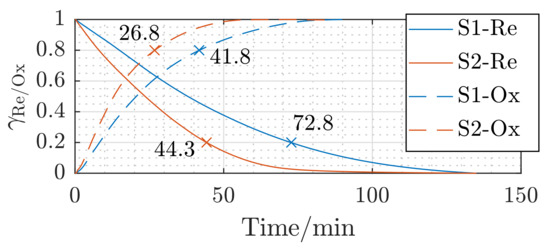
Figure 7.
Effect of the pellet size of S1 () and S2 () on the temporal reduction (–) and oxidation (- -) fractions at a reactant flow rate of and the gas concentration (cf. Table 2).
3.5. Effect of the Process Temperature
Another important parameter for controlling the energy storage process is the process temperature. Figure 8 presents the temporal reduction and oxidation fractions of sample S1, which were measured at the process temperatures of , , and applying a reactive gas mixture flow rate of and the reactant gas concentration according to Table 2.
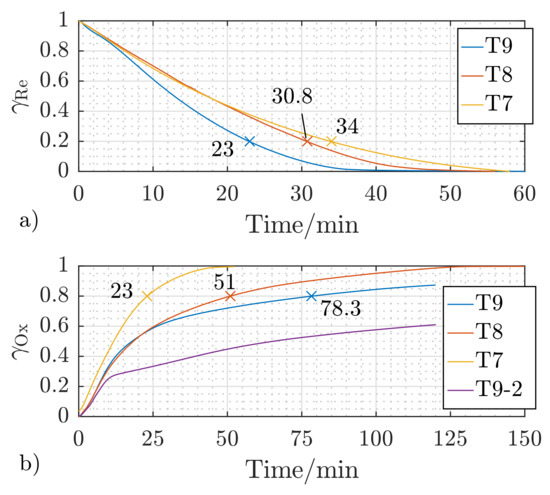
Figure 8.
Effect of the reaction temperature on the temporal reduction (a) and oxidation (b) fractions of S1 at a reactant flow rate of and the gas concentration as defined in Table 2; T7 = reaction temperature , T8 = reaction temperature , T9 = reaction temperature , Cycle 1, T9-2 = reaction temperature , Cycle 2.
As the oxidation is an exothermic reaction, it is expected that enhancing the reaction temperature would imply slowing down the reaction kinetics, which is indeed observed in Figure 8b. Increasing the reaction temperature of S1 from to leads to an increase in the time needed for the oxidation fraction to reach from 23 to (221.7%).
It can be concluded that the reduction reaction gets faster with increasing the reaction temperature, which is common for such an endothermic reaction [43,48,49]. To reach a reduction fraction of for the investigated S1 pellet (Figure 8a), the reaction time is reduced by 9.4% (from 34 to ) by increasing the temperature from to . Increasing the temperature further to results in additional acceleration of the reduction reaction by 25.3% (from to ). Figure 8b presents the effect of the temperature on the temporal change of the oxidation fraction for the sample S1. The first oxidation run at (T9) follows the same trend, namely a further increase of the time to reach 80% of the final oxidation fraction by 153.5%. Repeating the oxidation reaction at (T9-2) shows, however, a substantial degradation in the oxidation performance of the sample S1. Recalling that the oxidation is an exothermic reaction, it is obvious that a partial sintering of S1 took place, which defines as a limiting temperature for oxidation reactions. Dedicated oxidation runs follow to exactly define the upper temperature limit for oxidation operation, in order to avoid such performance deterioration.
Figure 9 presents a comparison between the temporal redox behavior of sample S1 in Cycles 2 and 29 at a reactant gas flow rate of , a temperature of , and the gas concentration (cf. Table 2). The relative mass change and the time needed to reach 100% reduction or oxidation were not changed between the two presented redox cycles. Moreover, a slight increase in the redox kinetics of about 5% was observed to reach 80% of the final redox performance. This increase results from the structural change of the pellet due to the repeated redox reactions, which was observed through the CT analysis carried out on the raw and the investigated S1-pellet after 29 redox cycles, which will be discussed in the following subsection.
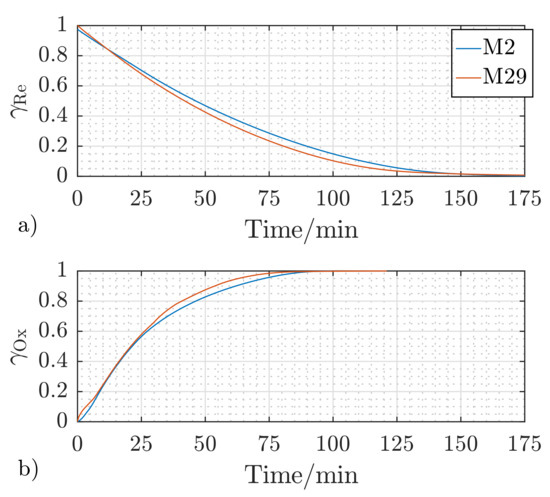
Figure 9.
Reaction behavior of S1 after two (M2) and 29 (M29) redox cycles at a reactant flow rate of , reaction temperature of , and the gas concentration (cf. Table 2) for reduction (a) and oxidation (b).
3.6. Structural Change of the Pellet
Figure 10 depicts the results of the CT analysis of S1 before the first redox reaction (a) and after 29 cycles (b). The gray pictures in the figure illustrate the shaded volume of the pellet, while the colored pictures the corresponding hollow volume (volume of the internal porous structure). The raw S1 pellet showed a total volume of and a hollow volume of 2.75%. Analyzing the obtained CT results showed an increase in the hollow volume after the 29 redox cycles to 9.04%. This is obviously the reason behind the increased diffusion rate and, consequently, the observed enhancement in the reaction rates in Figure 9.
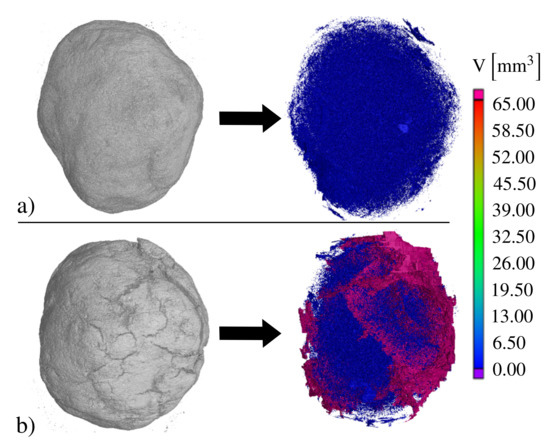
Figure 10.
CT-images of S1 (a) complete image and blank volume before the TGA investigations and (b) complete image and blank volume after 29 redox cycles.
Indeed, the reduction of Fe3O4 to Fe takes place in two steps, first to FeO (wustite) and then to Fe, and vice versa during the oxidation process. The emergence of the cracks can be attributed to the oxidation reaction. Compared to Fe, wustite (FeO) has a higher molar volume, which exposes the resulting FeO layer to compressive stress. These stresses are reduced by plastic deformation, leading to the closure of pores and cracks, which are necessary for effective gas transport. As the oxidation reaction progresses further, a second oxidation layer of Fe3O4 is formed, first on the outer surface. The resulting tensile stresses in the outer and brittle Fe3O4 layer are compensated by crack formation, which enhances, obviously, the gas exchange along the cracks and increases the reaction rate [41,50].
4. Conclusions
In this work, the results of an experimental study to investigate the redox behavior of iron oxide pellets under different temperatures and reactant gas concentrations are presented and discussed. The obtained results indicate that the redox reactions starting from the second cycle and after 29 cycles can be considered reversible. Moreover, a slight enhancement in the redox kinetics of about 5% was observed between the fifth and 29th cycles for reaching 80% of the final redox performance. With the higher concentration of the active reduction (H2) or oxidation (H2O) gas in the inlet gas mixture (with N2 as a carrier gas), the relative mass change rate can be significantly increased. Additionally, the sample shows an increase in the reaction rate of 39% by reducing the pellet diameter from to at a reaction temperature and a reactive gas flow rate of . An analytical model, based on the linear driving force model, to best fit the obtained redox reaction kinetic results was introduced along with the estimated empirical coefficients, showing a deviation of less than 3%. It can be concluded that the reduction reactions become faster if the reaction temperature increases. The oxidation reactions showed exactly the opposite trend. A significant degradation of the sample performance was observed after being oxidized twice at , which is attributed to a sintering process due to the release of the heat of reaction, defining this temperature as an upper operation limit.
The obtained mass change of the iron oxide pellets of 23.8% upon reduction/oxidation is equivalent to a volumetric energy storage capacity of . This is quite promising for different applications of the introduced hydrogen storage technology, for example in urban and industrial applications, where the increased safety measures for other H2 storage technologies become a handicap against the utilization of green hydrogen.
Author Contributions
Conceptualization, B.G. and B.D.; methodology, B.G. and B.D.; software, B.G.; validation, B.G. and B.D.; formal analysis, B.G. and B.D.; investigation, B.G.; resources, B.G. and B.D.; data curation, B.G. and B.D.; writing—original draft preparation, B.G.; writing—review and editing, B.G., M.G. and B.D.; visualization, B.G.; supervision, M.G. and B.D.; All authors have read and agreed to the published version of the manuscript.
Funding
The authors would like to acknowledge the project funding by the German Federal Ministries of Education and Research (BMBF) and Economics and Energy (BMWi), Project Number 03SBE113D.
Institutional Review Board Statement
Not applicable.
Informed Consent Statement
Not applicable.
Data Availability Statement
The data presented in this study are available on request from the first author.
Acknowledgments
The first author would like to acknowledge the German Research Foundation for the CT investigations (Project number INST 102/11-1 FUGG). In addition, he would like to acknowledge the support of the Regensburg Center of Energy and Resources (RCER) of OTH Regensburg, the Technology and Science Network Oberpfalz (TWO) and the BayWISS Joint Academic Partnership “Energy”.
Conflicts of Interest
The authors declare no conflict of interest.
References
- US National Aeronautics and Space. Climate Change Evidence: How Do We Know? Global Climate Change Vital Signs of the Planet. 2020. Available online: https://climate.nasa.gov/evidence/ (accessed on 9 February 2021).
- International Renewable Energy Agency. Global Renewables Outlook: Energy Transformation 2050; International Renewable Energy Agency: Abu Dhabi, United Arab Emirates, 2020. [Google Scholar]
- Thess, A.; Trieb, F.; Wörner, A.; Zunft, S. Herausforderung Wärmespeicher. Phys. J. 2015, 14/2, 33–39. [Google Scholar]
- Sterner, M.; Stadler, I. Handbook of Energy Storage; Springer: Berlin/Heidelberg, Germany, 2019. [Google Scholar] [CrossRef]
- Klell, M.; Eichlseder, H.; Trattner, A. Wasserstoff in der Fahrzeugtechnik: Erzeugung Speicherung Anwendung, 4. aufl. 2018 ed.; ATZ/MTZ-Fachbuch; Springer Fachmedien Wiesbaden: Wiesbaden, Germany, 2018. [Google Scholar]
- Barthelemy, H.; Weber, M.; Barbier, F. Hydrogen storage: Recent improvements and industrial perspectives. Int. J. Hydrogen Energy 2017, 42, 7254–7262. [Google Scholar] [CrossRef]
- Adolf, J.; Balzer, C.H.; Louis, J.; Schabla, U.; Fischedick, M.; Arnold, K.; Pastowski, A.; Schüwer, D. Energy of the Future?: Sustainable Mobility through Fuel Cells and H2; Shell Hydrogen Study. Technical report; Shell Deutschland Oil: Hamburg, Germany, 2017. [Google Scholar]
- Michalski, J.; Bünger, U.; Crotogino, F.; Donadei, S.; Schneider, G.S.; Pregger, T.; Cao, K.K.; Heide, D. Hydrogen generation by electrolysis and storage in salt caverns: Potentials, economics and systems aspects with regard to the German energy transition. Int. J. Hydrogen Energy 2017, 42, 13427–13443. [Google Scholar] [CrossRef]
- Reuß, M.; Grube, T.; Robinius, M.; Preuster, P.; Wasserscheid, P.; Stolten, D. Seasonal storage and alternative carriers: A flexible hydrogen supply chain model. Appl. Energy 2017, 200, 290–302. [Google Scholar] [CrossRef]
- Chilev, C.; Lamari, F.D. Hydrogen storage at low temperature and high pressure for application in automobile manufacturing. Int. J. Hydrogen Energy 2016, 41, 1744–1758. [Google Scholar] [CrossRef]
- Müller, K. Technologies for the Storage of Hydrogen Part 1: Hydrogen Storage in the Narrower Sense. Chem. Ing. Tech. 2019, 91, 383–392. [Google Scholar] [CrossRef]
- Kunze, K.; Kircher, O. Cryo-Compressed Hydrogen Storage. 2012. Available online: https://docplayer.net/53367956-Cryo-compressed-hydrogen-storage.html (accessed on 9 February 2021).
- Adametz, P.; Müller, K.; Arlt, W. Energetic evaluation of hydrogen storage in metal hydrides. Int. J. Energy Res. 2016, 40, 1820–1831. [Google Scholar] [CrossRef]
- Niermann, M.; Beckendorff, A.; Kaltschmitt, M.; Bonhoff, K. Liquid Organic Hydrogen Carrier (LOHC)—Assessment based on chemical and economic properties. Int. J. Hydrogen Energy 2019, 44, 6631–6654. [Google Scholar] [CrossRef]
- Lorente, E.; Peña, J.A.; Herguido, J. Cycle behaviour of iron ores in the steam-iron process. Int. J. Hydrogen Energy 2011, 36, 7043–7050. [Google Scholar] [CrossRef]
- Berger, C.M.; Tokariev, O.; Orzessek, P.; Hospach, A.; Fang, Q.; Bram, M.; Quadakkers, W.J.; Menzler, N.H.; Buchkremer, H.P. Development of storage materials for high-temperature rechargeable oxide batteries. J. Energy Storage 2015, 1, 54–64. [Google Scholar] [CrossRef]
- Jin, X.; Zhao, X.; White, R.E.; Huang, K. Heat Balance in a Planar Solid Oxide Iron-Air Redox Battery: A Computational Analysis. J. Electrochem. Soc. 2015, 162, F821–F833. [Google Scholar] [CrossRef]
- Voitic, G.; Nestl, S.; Lammer, M.; Wagner, J.; Hacker, V. Pressurized hydrogen production by fixed-bed chemical looping. Appl. Energy 2015, 157, 399–407. [Google Scholar] [CrossRef]
- Ariharan, A.; Viswanathan, B.; Nandhakumar, V. Hydrogen storage on boron substituted carbon materials. Int. J. Hydrogen Energy 2016, 41, 3527–3536. [Google Scholar] [CrossRef]
- Endo, N.; Matsumura, K.; Kawakami, Y.; Ishida, M.; Maeda, T. Operation of metal hydride hydrogen storage systems for hydrogen compression using solar thermal energy. J. Int. Counc. Electr. Eng. 2016, 6, 65–71. [Google Scholar] [CrossRef]
- Brack, P.; Dann, S.E.; Wijayantha, K.G.U.; Adcock, P.; Foster, S. An assessment of the viability of hydrogen generation from the reaction of silicon powder and sodium hydroxide solution for portable applications. Int. J. Energy Res. 2017, 41, 220–228. [Google Scholar] [CrossRef]
- Goncharov, A.; Guglya, A.; Kalchenko, A.; Solopikhina, E.; Vlasov, V.; Lyubchenko, E. Nanocrystalline Porous Hydrogen Storage Based on Vanadium and Titanium Nitrides. J. Nanotechnol. 2017, 2017, 1–10. [Google Scholar] [CrossRef]
- Teichmann, D.; Arlt, W.; Wasserscheid, P.; Freymann, R. A future energy supply based on Liquid Organic Hydrogen Carriers (LOHC). Energy Environ. Sci. 2011, 4, 2767. [Google Scholar] [CrossRef]
- Hirscher, M. (Ed.) Handbook of Hydrogen Storage; WILEY-VCH: Weinheim, Germany, 2010. [Google Scholar] [CrossRef]
- Shashikala, K. Hydrogen Storage Materials. In Functional Materials; Banerjee, S., Tyagi, A.K., Eds.; Elsevier Insights, Elsevier: Amsterdam, The Netherlands, 2012; pp. 607–637. [Google Scholar] [CrossRef]
- Rusman, N.; Dahari, M. A review on the current progress of metal hydrides material for solid-state hydrogen storage applications. Int. J. Hydrogen Energy 2016, 41, 12108–12126. [Google Scholar] [CrossRef]
- Müller, K. Technologies for the Storage of Hydrogen Part 2: Irreversible Conversion and Comparison. Chem. Ing. Tech. 2019, 91, 393–402. [Google Scholar] [CrossRef]
- Abe, J.O.; Popoola, A.; Ajenifuja, E.; Popoola, O.M. Hydrogen energy, economy and storage: Review and recommendation. Int. J. Hydrogen Energy 2019, 44, 15072–15086. [Google Scholar] [CrossRef]
- Hadjixenophontos, E.; Dematteis, E.M.; Berti, N.; Wołczyk, A.R.; Huen, P.; Brighi, M.; Le, T.T.; Santoru, A.; Payandeh, S.; Peru, F.; et al. A Review of the MSCA ITN ECOSTORE—Novel Complex Metal Hydrides for Efficient and Compact Storage of Renewable Energy as Hydrogen and Electricity. Inorganics 2020, 8, 17. [Google Scholar] [CrossRef]
- Berger, C.M.; Mahmoud, A.; Hermann, R.P.; Braun, W.; Yazhenskikh, E.; Sohn, Y.J.; Menzler, N.H.; Guillon, O.; Bram, M. Calcium-Iron Oxide as Energy Storage Medium in Rechargeable Oxide Batteries. J. Am. Ceram. Soc. 2016, 99, 4083–4092. [Google Scholar] [CrossRef]
- Voitic, G.; Hacker, V. Recent advancements in chemical looping water splitting for the production of hydrogen. RSC Adv. 2016, 6, 98267–98296. [Google Scholar] [CrossRef]
- Thaler, M.; Hacker, V. Storage and separation of hydrogen with the metal steam process. Int. J. Hydrogen Energy 2012, 37, 2800–2806. [Google Scholar] [CrossRef]
- Lane, H. Apparatus for Producing Hydrogen Gas. US Patent 1,028,366, 4 June 1912. [Google Scholar]
- Messerschmitt, A. Process of Producing Hydrogen. US Patent 971,206, 27 September 1910. [Google Scholar]
- Braun, W.; Erfurt, V.; Thaler, F.; Menzler, N.H.; Spatschek, R.; Singheiser, L. Kinetic Study of Iron Based Storage Materials for the Use in Rechargeable Oxide Batteries (ROB). ECS Trans. 2017, 75, 59–73. [Google Scholar] [CrossRef]
- Williams, P.T. Pyrolysis of waste tyres: A review. Waste Manag. (N.Y.) 2013, 33, 1714–1728. [Google Scholar] [CrossRef]
- Posdziech, O.; Schwarze, K.; Brabandt, J. Efficient hydrogen production for industry and electricity storage via high-temperature electrolysis. Int. J. Hydrogen Energy 2019, 44, 19089–19101. [Google Scholar] [CrossRef]
- Betsch, K.; Knauf, G.; Kobow, C.; Martin, H.; Petzold, D.; Ufer, J.; Wolf, B. Verfahren zur Erzeugung von Wasserstoff oder wasserstoffreichen Gasen, 1972. DD 000,000,094,984, 1 March 1972. [Google Scholar]
- Roß, T.; Heine, A. Der Verbrennungsmotor-ein Antrieb mit Vergangenheit und Zukunft; Springer Fachmedien Wiesbaden: Wiesbaden, Germnay, 2018. [Google Scholar] [CrossRef]
- DIN EN 14647:2005. Calcium Aluminate Cement—Composition, Specifications and Conformity Criteria, (EN 14647:2005); Beuth Verlag GmbH: Berlin, Germany, 2007. [Google Scholar]
- Ketteler, G. Preparation and Characterisation of Epitaxial Oxide Films for Model Catalytic Investigations. Ph.D. Thesis, Freie Universität Berlin, Berlin, Germany, 2003. [Google Scholar]
- Young, D.J. High Temperature Oxidation and Corrosion of Metals, 2nd ed.; Elsevier: Amsterdam, The Netherlands; Boston, MA, USA; Heidelberg, Germany; London, UK, 2016. [Google Scholar]
- Beheshti, R.; Moosberg-Bustnes, J.; Kennedy, M.W.; Aune, R.E. Reduction of commercial hematite pellet in isothermal fixed bed—Experiments and numerical modelling. Ironmak. Steelmak. 2016, 43, 31–38. [Google Scholar] [CrossRef]
- Schüth, F. Handbook of Porous Solids; WILEY-VCH: Weinheim, Germany, 2002. [Google Scholar] [CrossRef]
- Schönbucher, A. Thermische Verfahrenstechnik: Grundlagen und Berechnungsmethoden für Ausrüstungen und Prozesse; mit 103 Tabellen; Springer: Berlin, Germnay, 2002. [Google Scholar]
- Aristov, Y.; Dawoud, B.; Glaznev, I.S.; Elyas, A. A new methodology of studying the dynamics of water sorption/desorption under real operating conditions of adsorption heat pumps: Experiment. Int. J. Heat Mass Transf. 2008, 51, 4966–4972. [Google Scholar] [CrossRef]
- Beheshti, R.; Moosberg-Bustnes, J.; Aune, R.E. Modeling and Simulation of Isothermal Reduction of a Single Hematite Pellet in Gas Mixtures of H2. In Proceedings of the Minerals, Metals & Material Society (TMS): 143rd Annual Meeting & Exhibition, San Diego, CA, USA, 16–20 February 2014; pp. 495–502. [Google Scholar] [CrossRef]
- Tsay, Q.T.; Ray, W.H.; Szekely, J. The modeling of hematite reduction with hydrogen plus carbon monoxide mixtures: Part I. The behavior of single pellets. AIChE J. 1976, 22, 1064–1072. [Google Scholar] [CrossRef]
- El-Geassy, A.A. Gaseous reduction of Fe2O3 compacts at 600 to 1050 °C. J. Mater. Sci. 1986, 21, 3889–3900. [Google Scholar] [CrossRef]
- Mitchell, T.E.; Voss, D.A.; Butler, E.P. The observation of stress effects during the high temperature oxidation of iron. J. Mater. Sci. 1982, 17, 1825–1833. [Google Scholar] [CrossRef]
Publisher’s Note: MDPI stays neutral with regard to jurisdictional claims in published maps and institutional affiliations. |
© 2021 by the authors. Licensee MDPI, Basel, Switzerland. This article is an open access article distributed under the terms and conditions of the Creative Commons Attribution (CC BY) license (http://creativecommons.org/licenses/by/4.0/).