
Evaluation of Waste Blends with Sewage Sludge as a Potential Material Input for Pyrolysis


 ,
,  ,
,
Abstract
1. Introduction
2. Materials and Methods
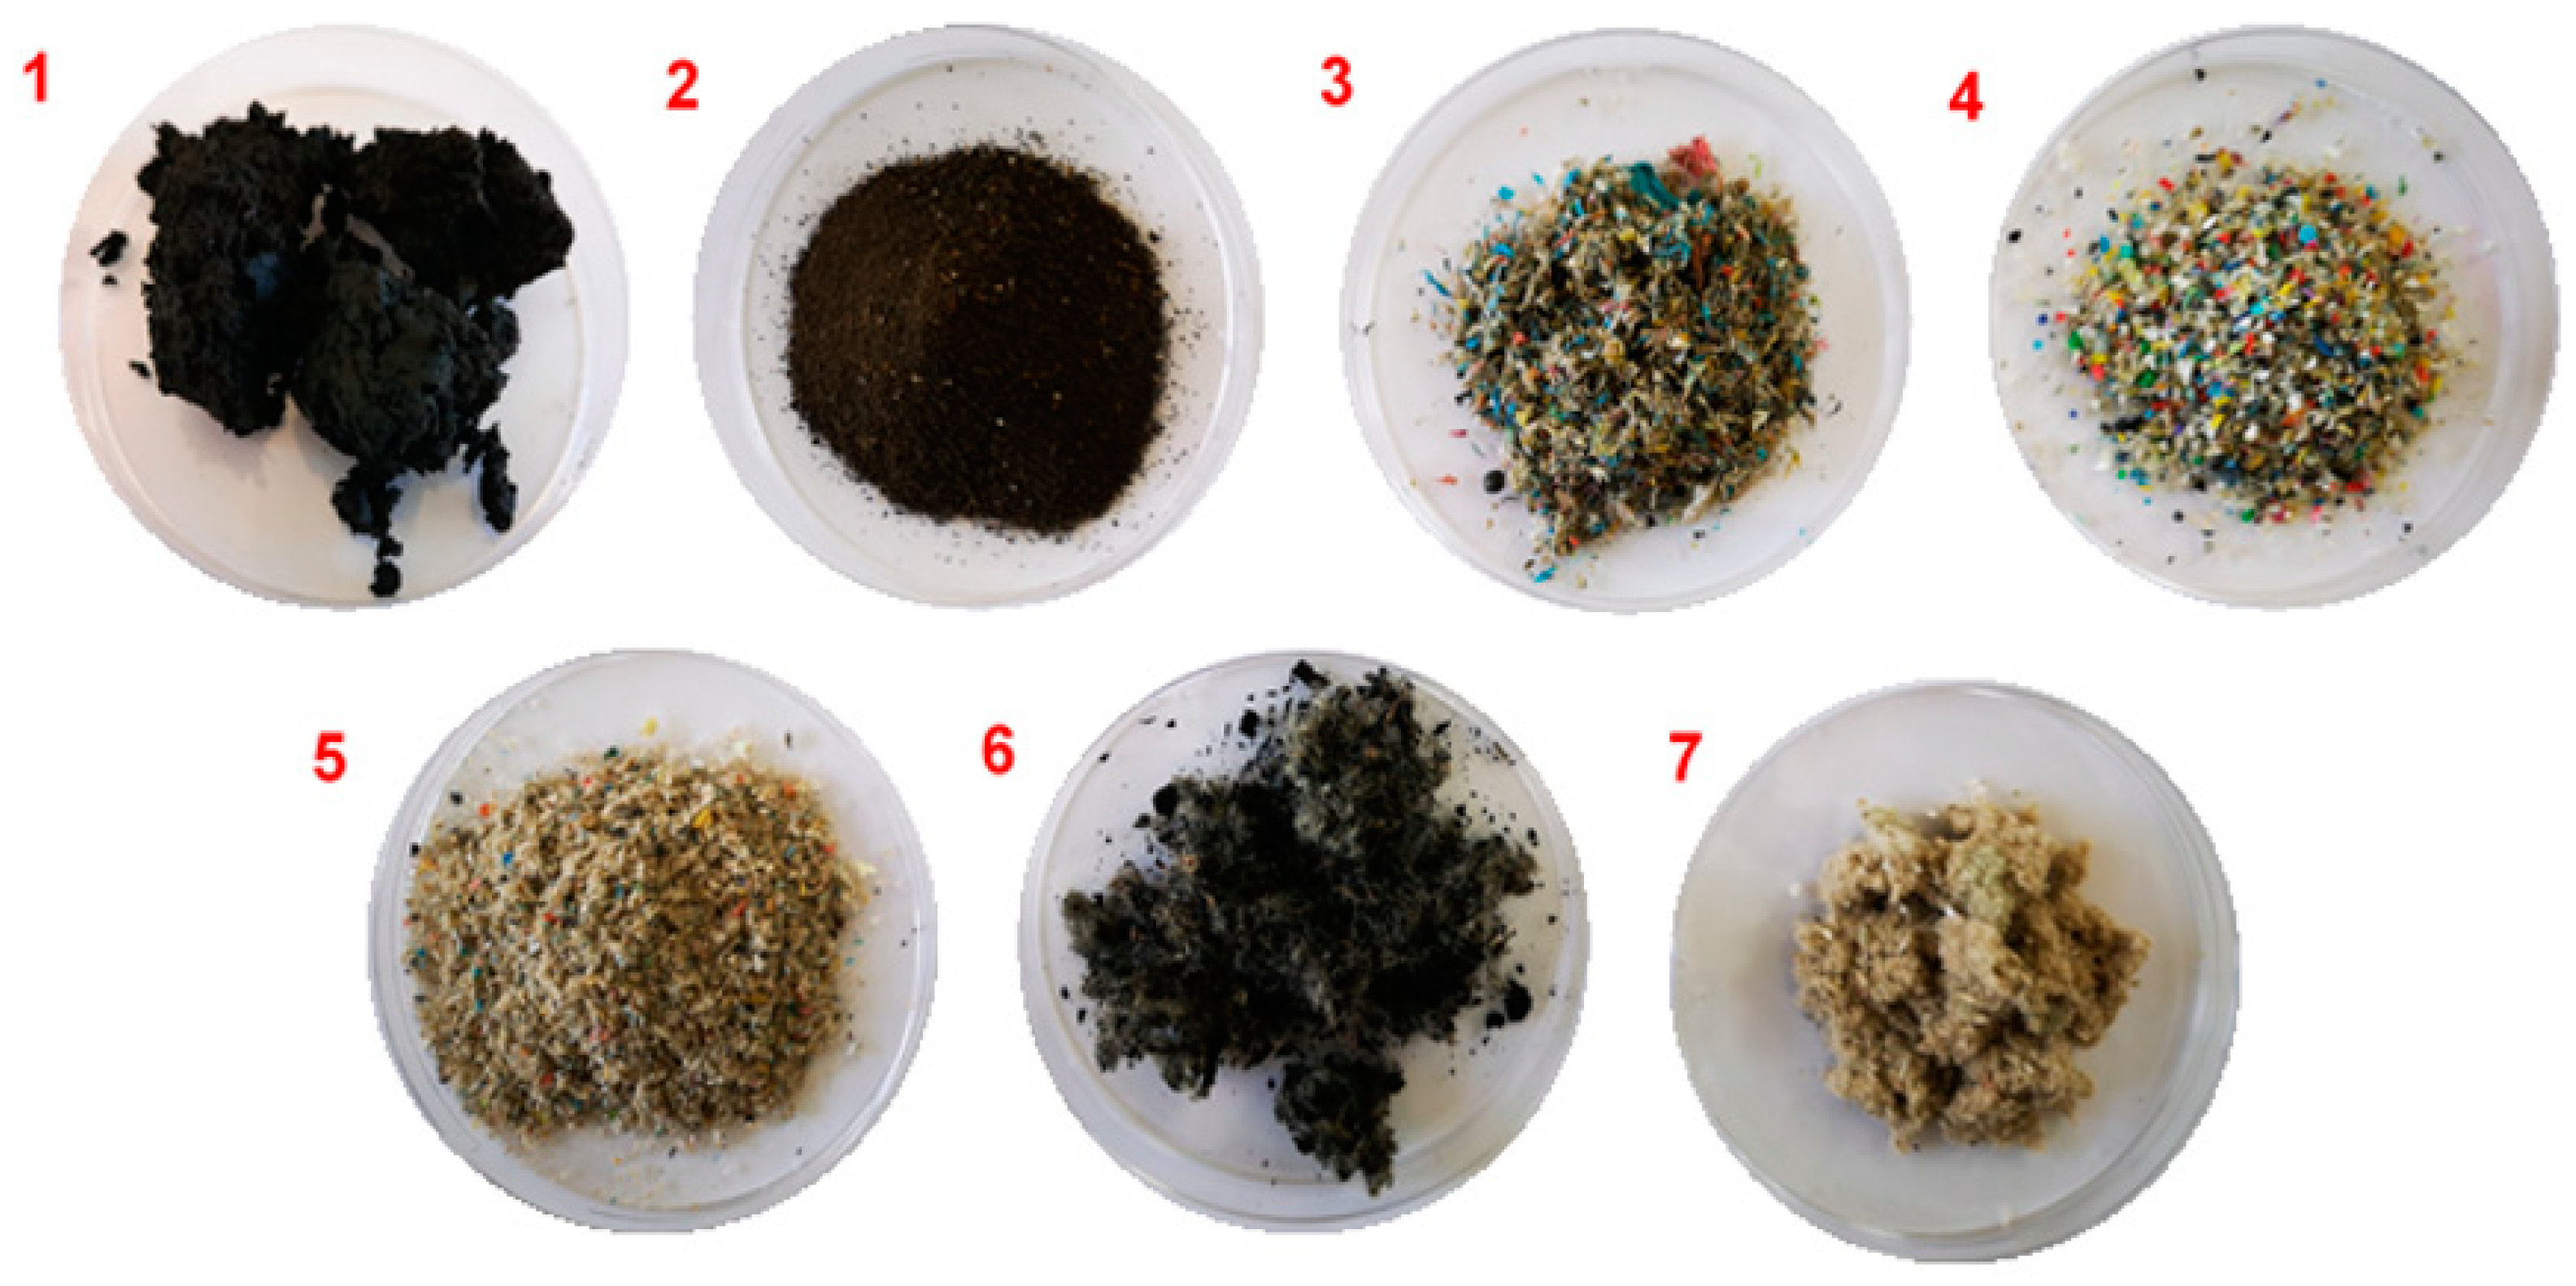
2.1. Description and Physical Appearance of Input Waste
- 1, 2—SS—sewage sludge from the municipal wastewater treatment plant, which is anaerobically stabilized, blackish-brown in color, lumpy, with an earthy odor, and very wet. The projected WWTP capacity is 207,000 PT (population total), and HRT (hydraulic retention time) is in the range of 26–32 days depending on temperature;
- 3—LDPE—recycled LDPE from separated collection and sorting lines. This material was wet during processing. It is a flexible (even soft) material, but it is also tough and hard to grind;
- 4—TP—a mixture of crushed sorted hard thermoplastics. Colored materials (mixture of PP and PE) have a low weight, are tenacious and strong, and are easy to grind;
- 5—RDF—polyethylene foils, bags and sorted municipal solid waste (MSW) without PET and hardened plastics. This material was rather wet, contained impurities (clay etc.) and was hard to grind due to its consistency;
- 6—PES—polyester waste (PES) from tire processing contains crushed pieces of tire (styrene–butadiene rubber) and PES textile fiber in the form of small fluffy clumps up to 20 mm in size. It is a loose, non-sticky material that is easy to handle and has a grey color;
- 7—PR—paper rejects with a composition of paper and plastic in the ratio of 50:50. It consists of small plastic particles and paper pulp (cellulose). These fibers are simply bonded under pressure to form solid shapes, and have medium humidity and a light brown color.
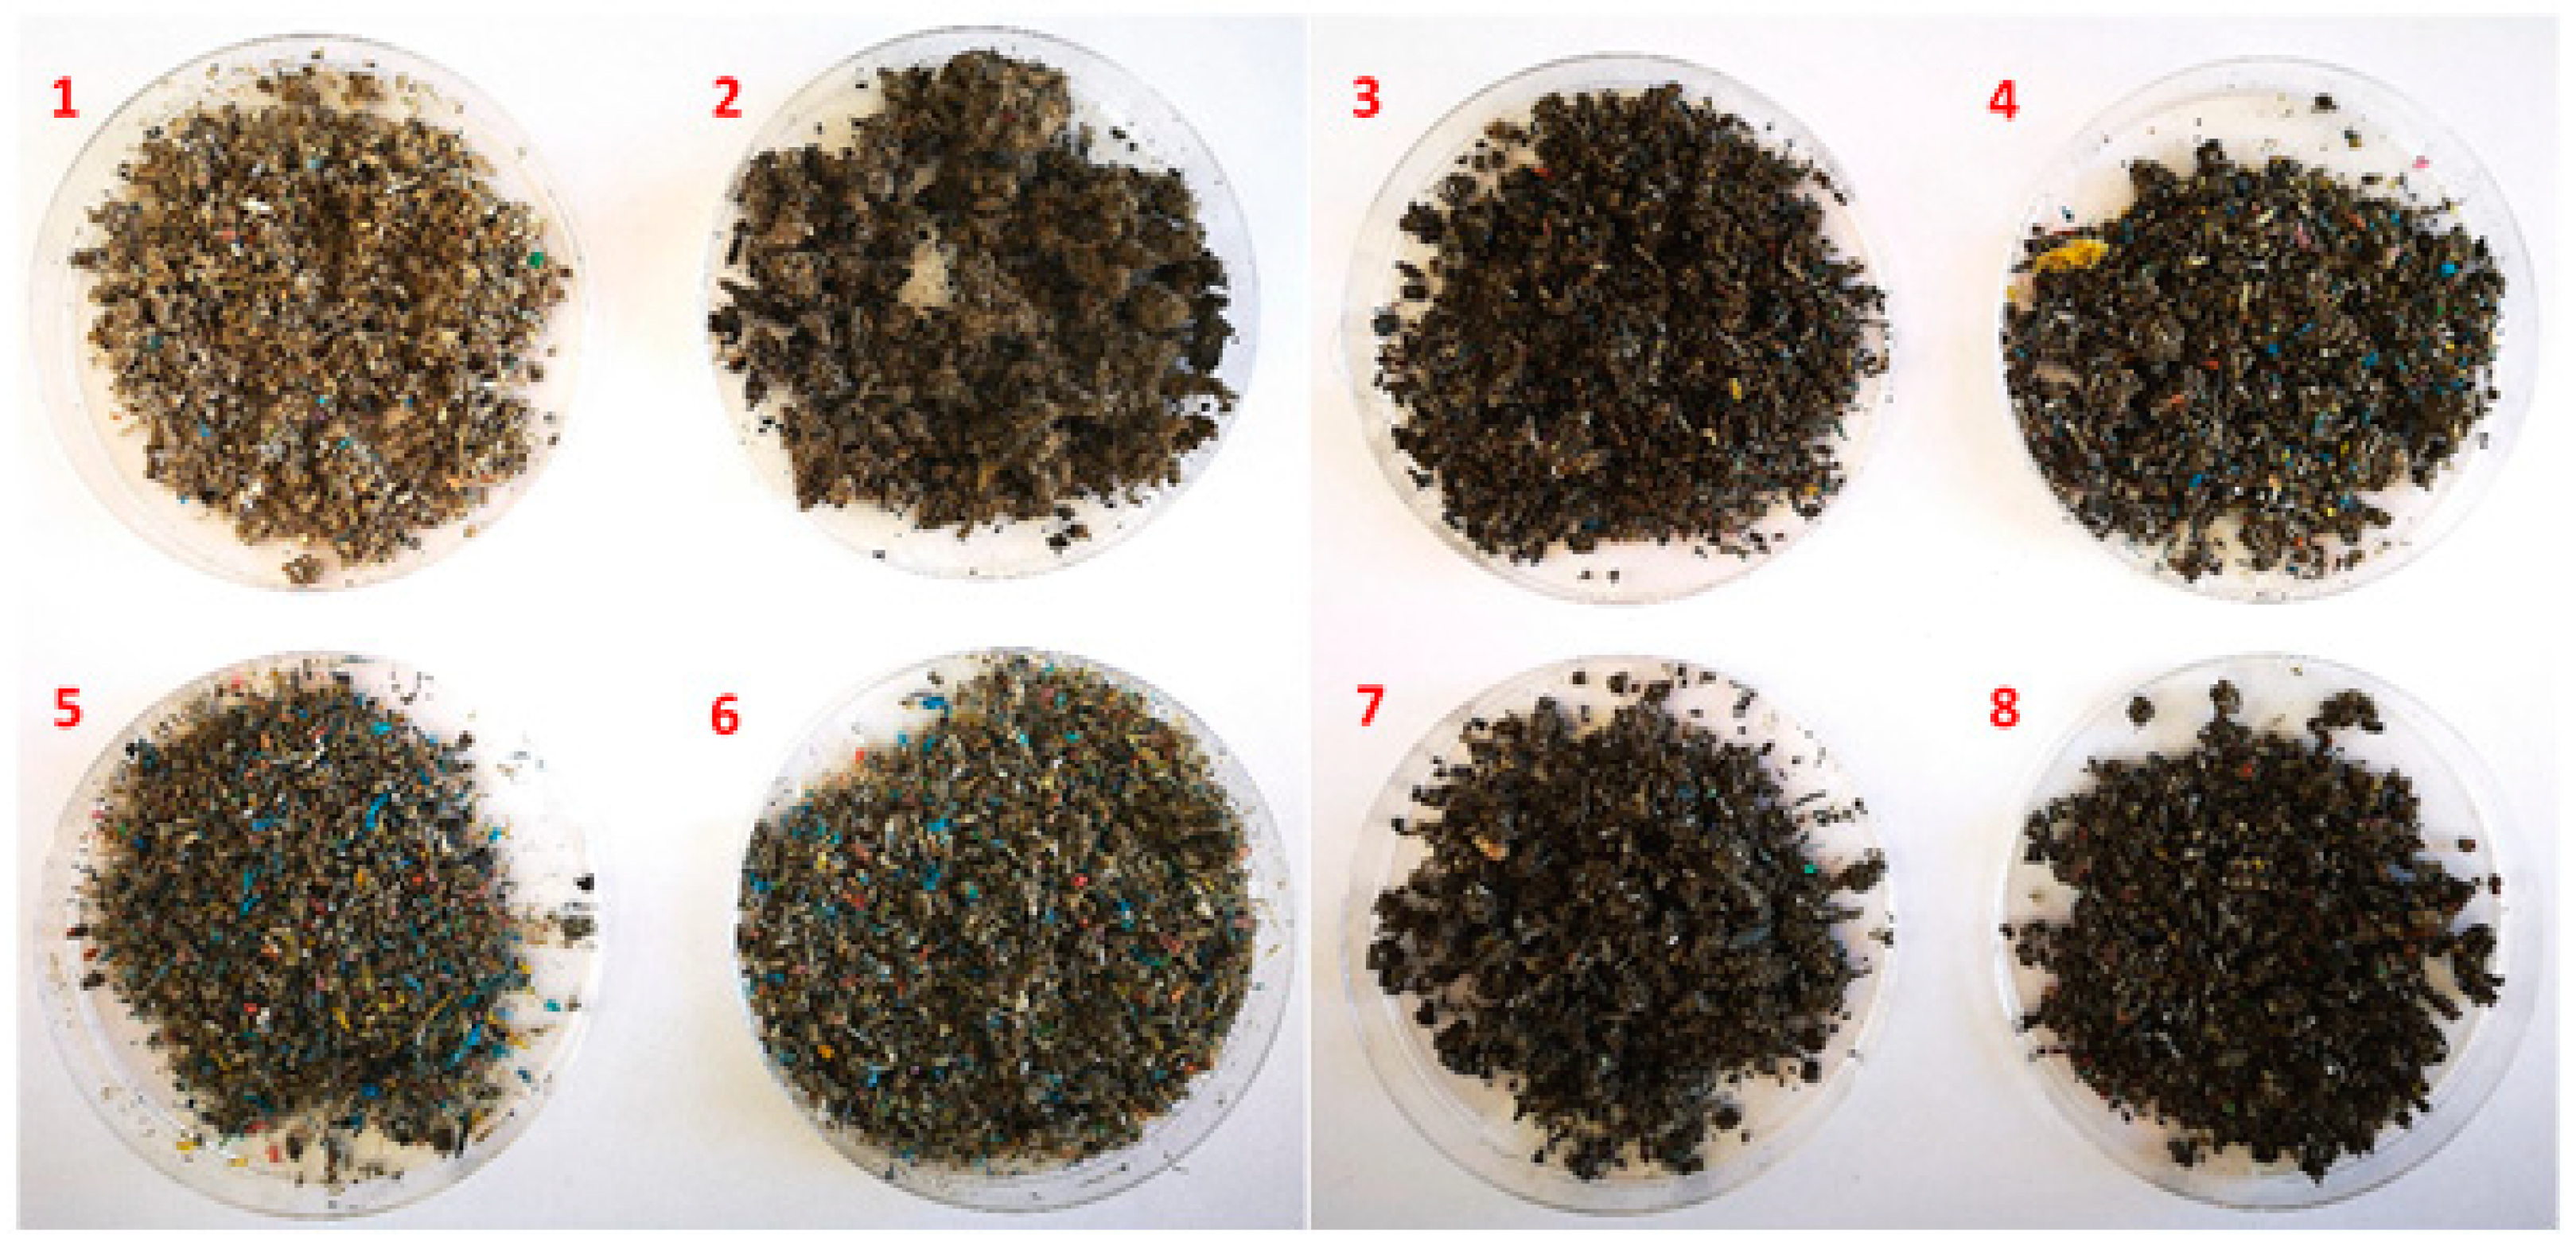
2.2. Waste Blends Preparation
- The 3RDF:SS:PR blend was light brown in color with a slight odor. The material was light.
- The 3PES:SS:PR blend was grey with a slight odor. The material was not compact. It consisted of separate pieces of rubber and fluffy PES fibers mixed with sludge.
- The 4LDPE:SS blend had a good structure. It was slightly damp. LDPE formed a compact mass with sewage sludge.
- The 4LDPE:2SS:PR blend was well workable and was light black in color. It was slightly damp. Small pieces of LDPE can be seen in the mixture. LDPE formed a compact mass with sewage sludge.
- The 6LDPE:SS blend was rather dry and did not form a compact mass. Due to the large proportion of LDPE, small colored pieces were visible in the mixture. The mixture was blackish brown in color with a musty smell.
- The 3LDPE:SS:PR blend was rather dry and did not form a compact mass. The mixture was dark brown in color with a slight odor.
- The RDF:SS blend was very moist with a strong odor. The mixture was hard to mix together. The individual grains stuck together and formed a lumpy structure.
- The 3TP:SS blend was very moist with a slight specific odor. The discrete grains stuck together and formed a lumpy structure.
2.3. Analyses of Physical Properties
2.3.1. Proximate Analysis
2.3.2. Ultimate Analysis
2.3.3. High and Low Heating Values (HHV, LHV)
2.4. Thermogravimetric Analysis
2.5. Statistical Analysis
3. Results and Discussion
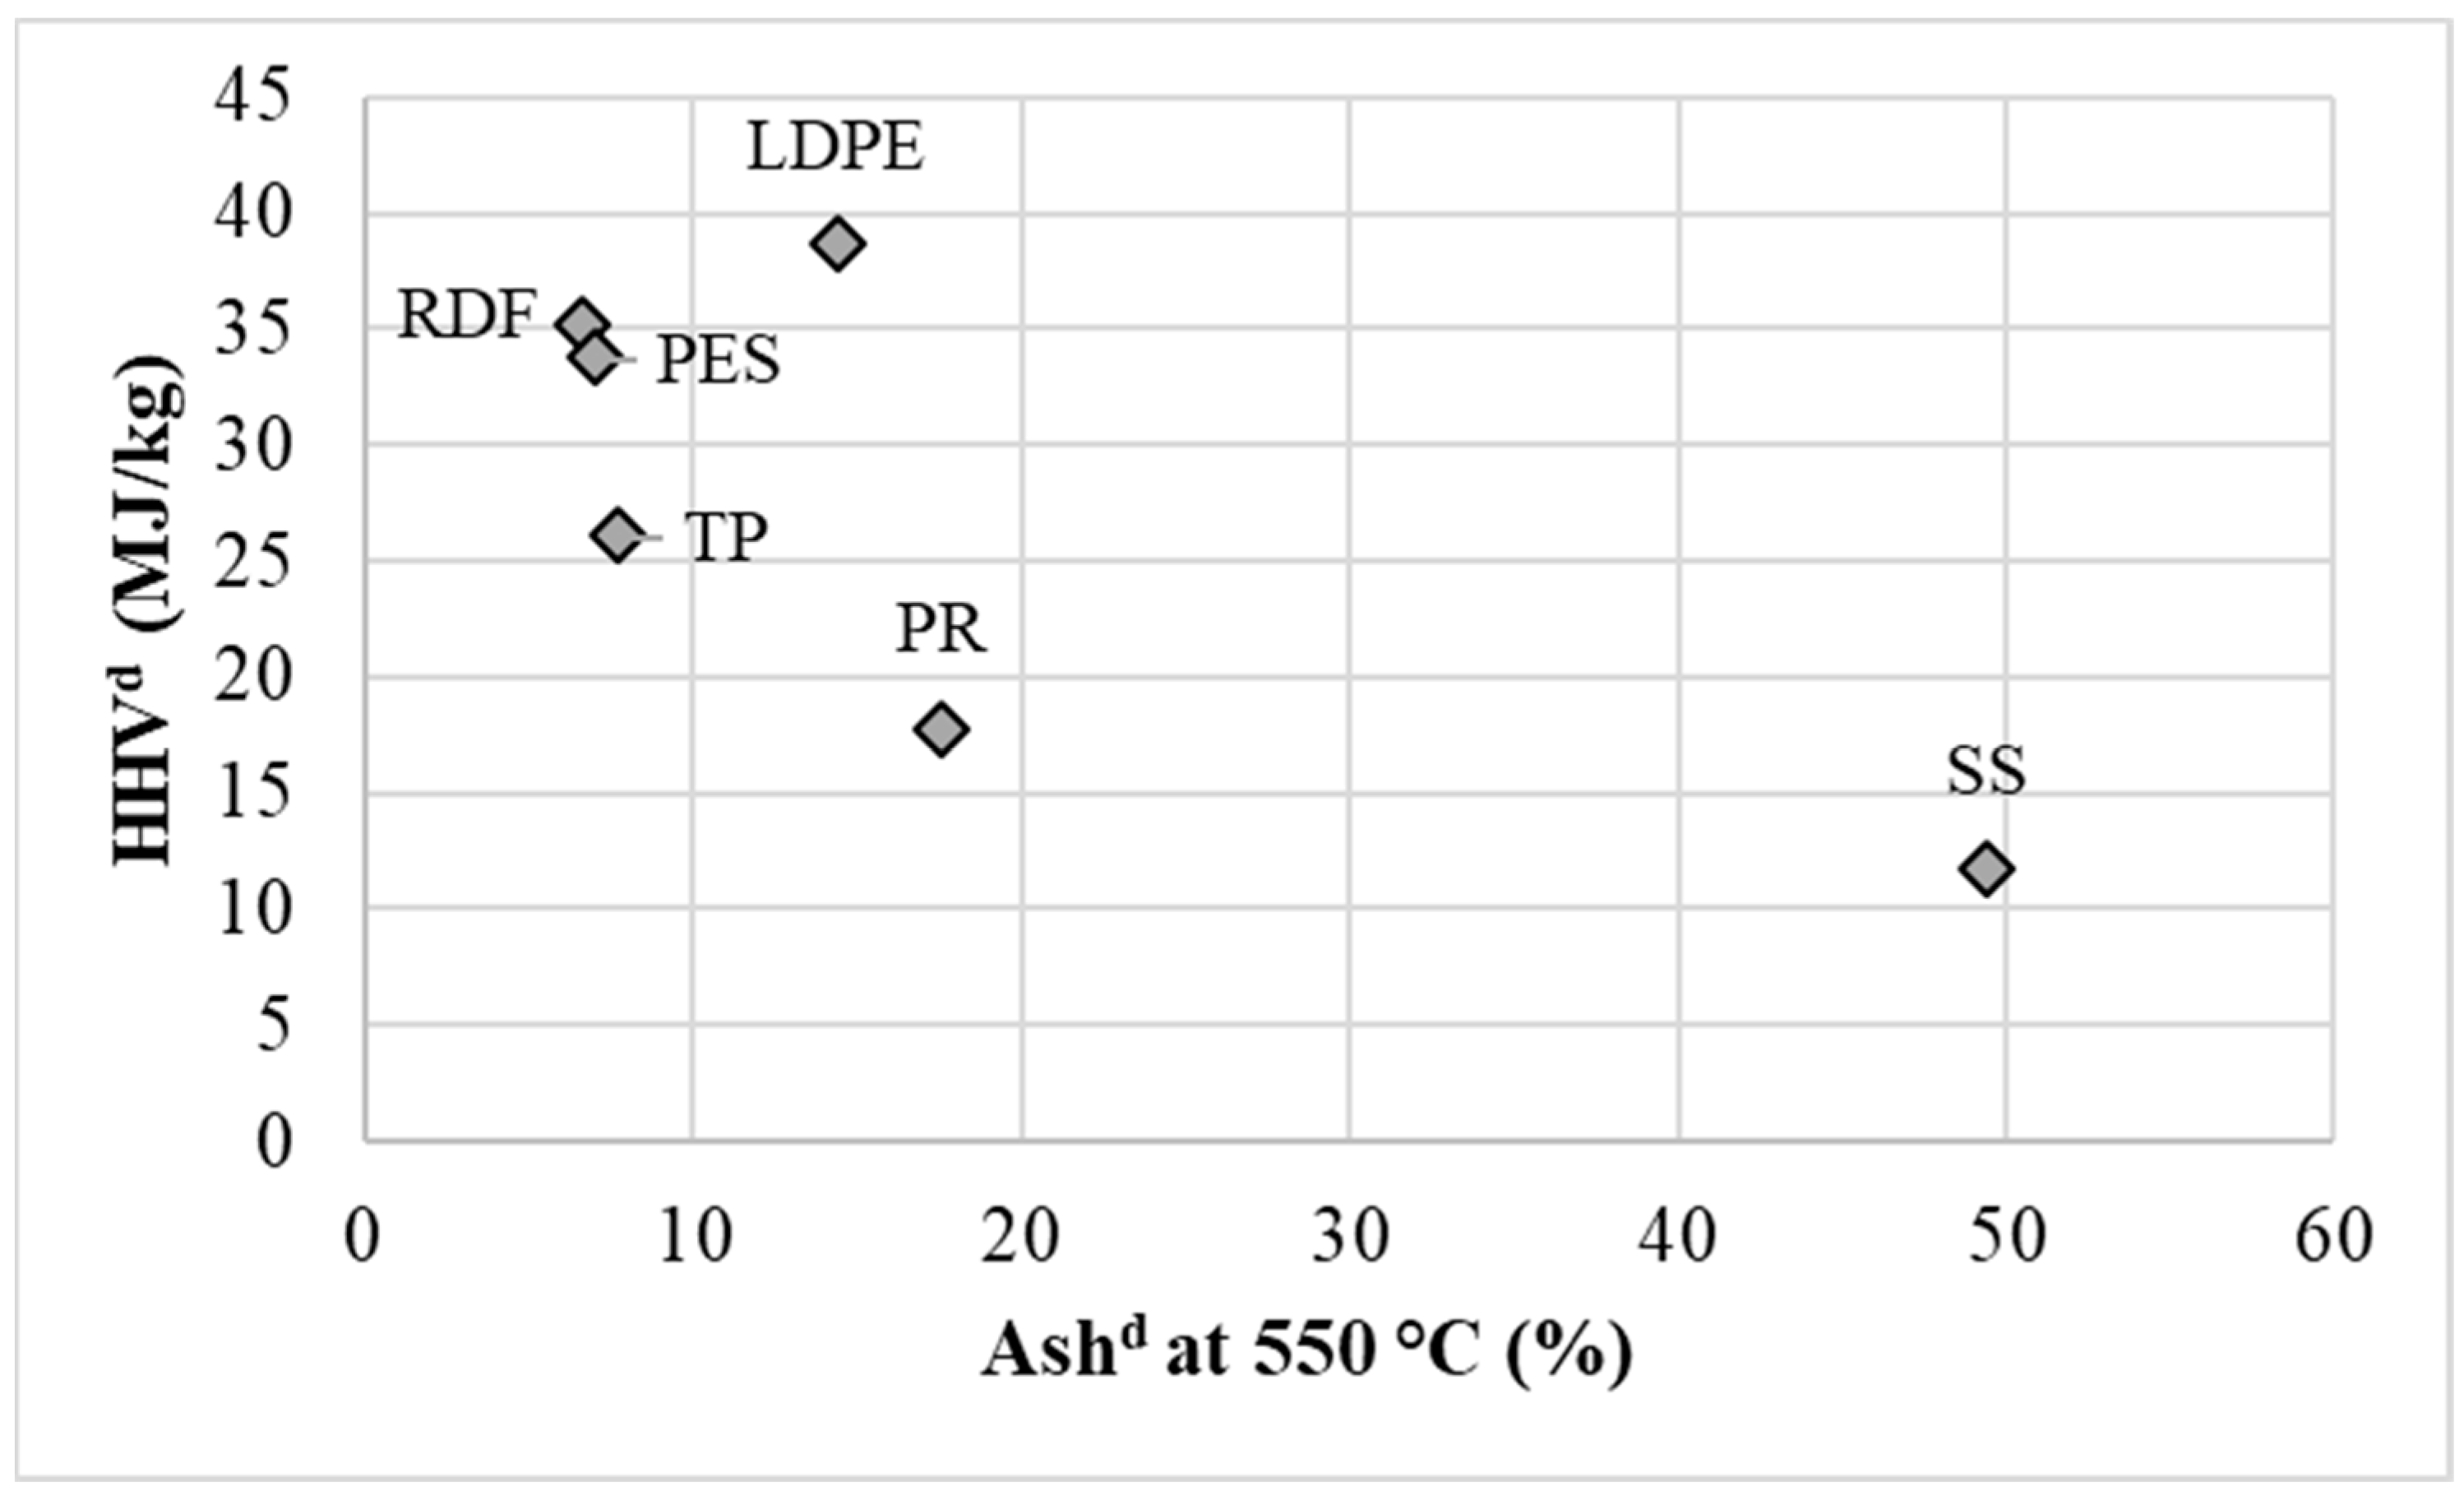
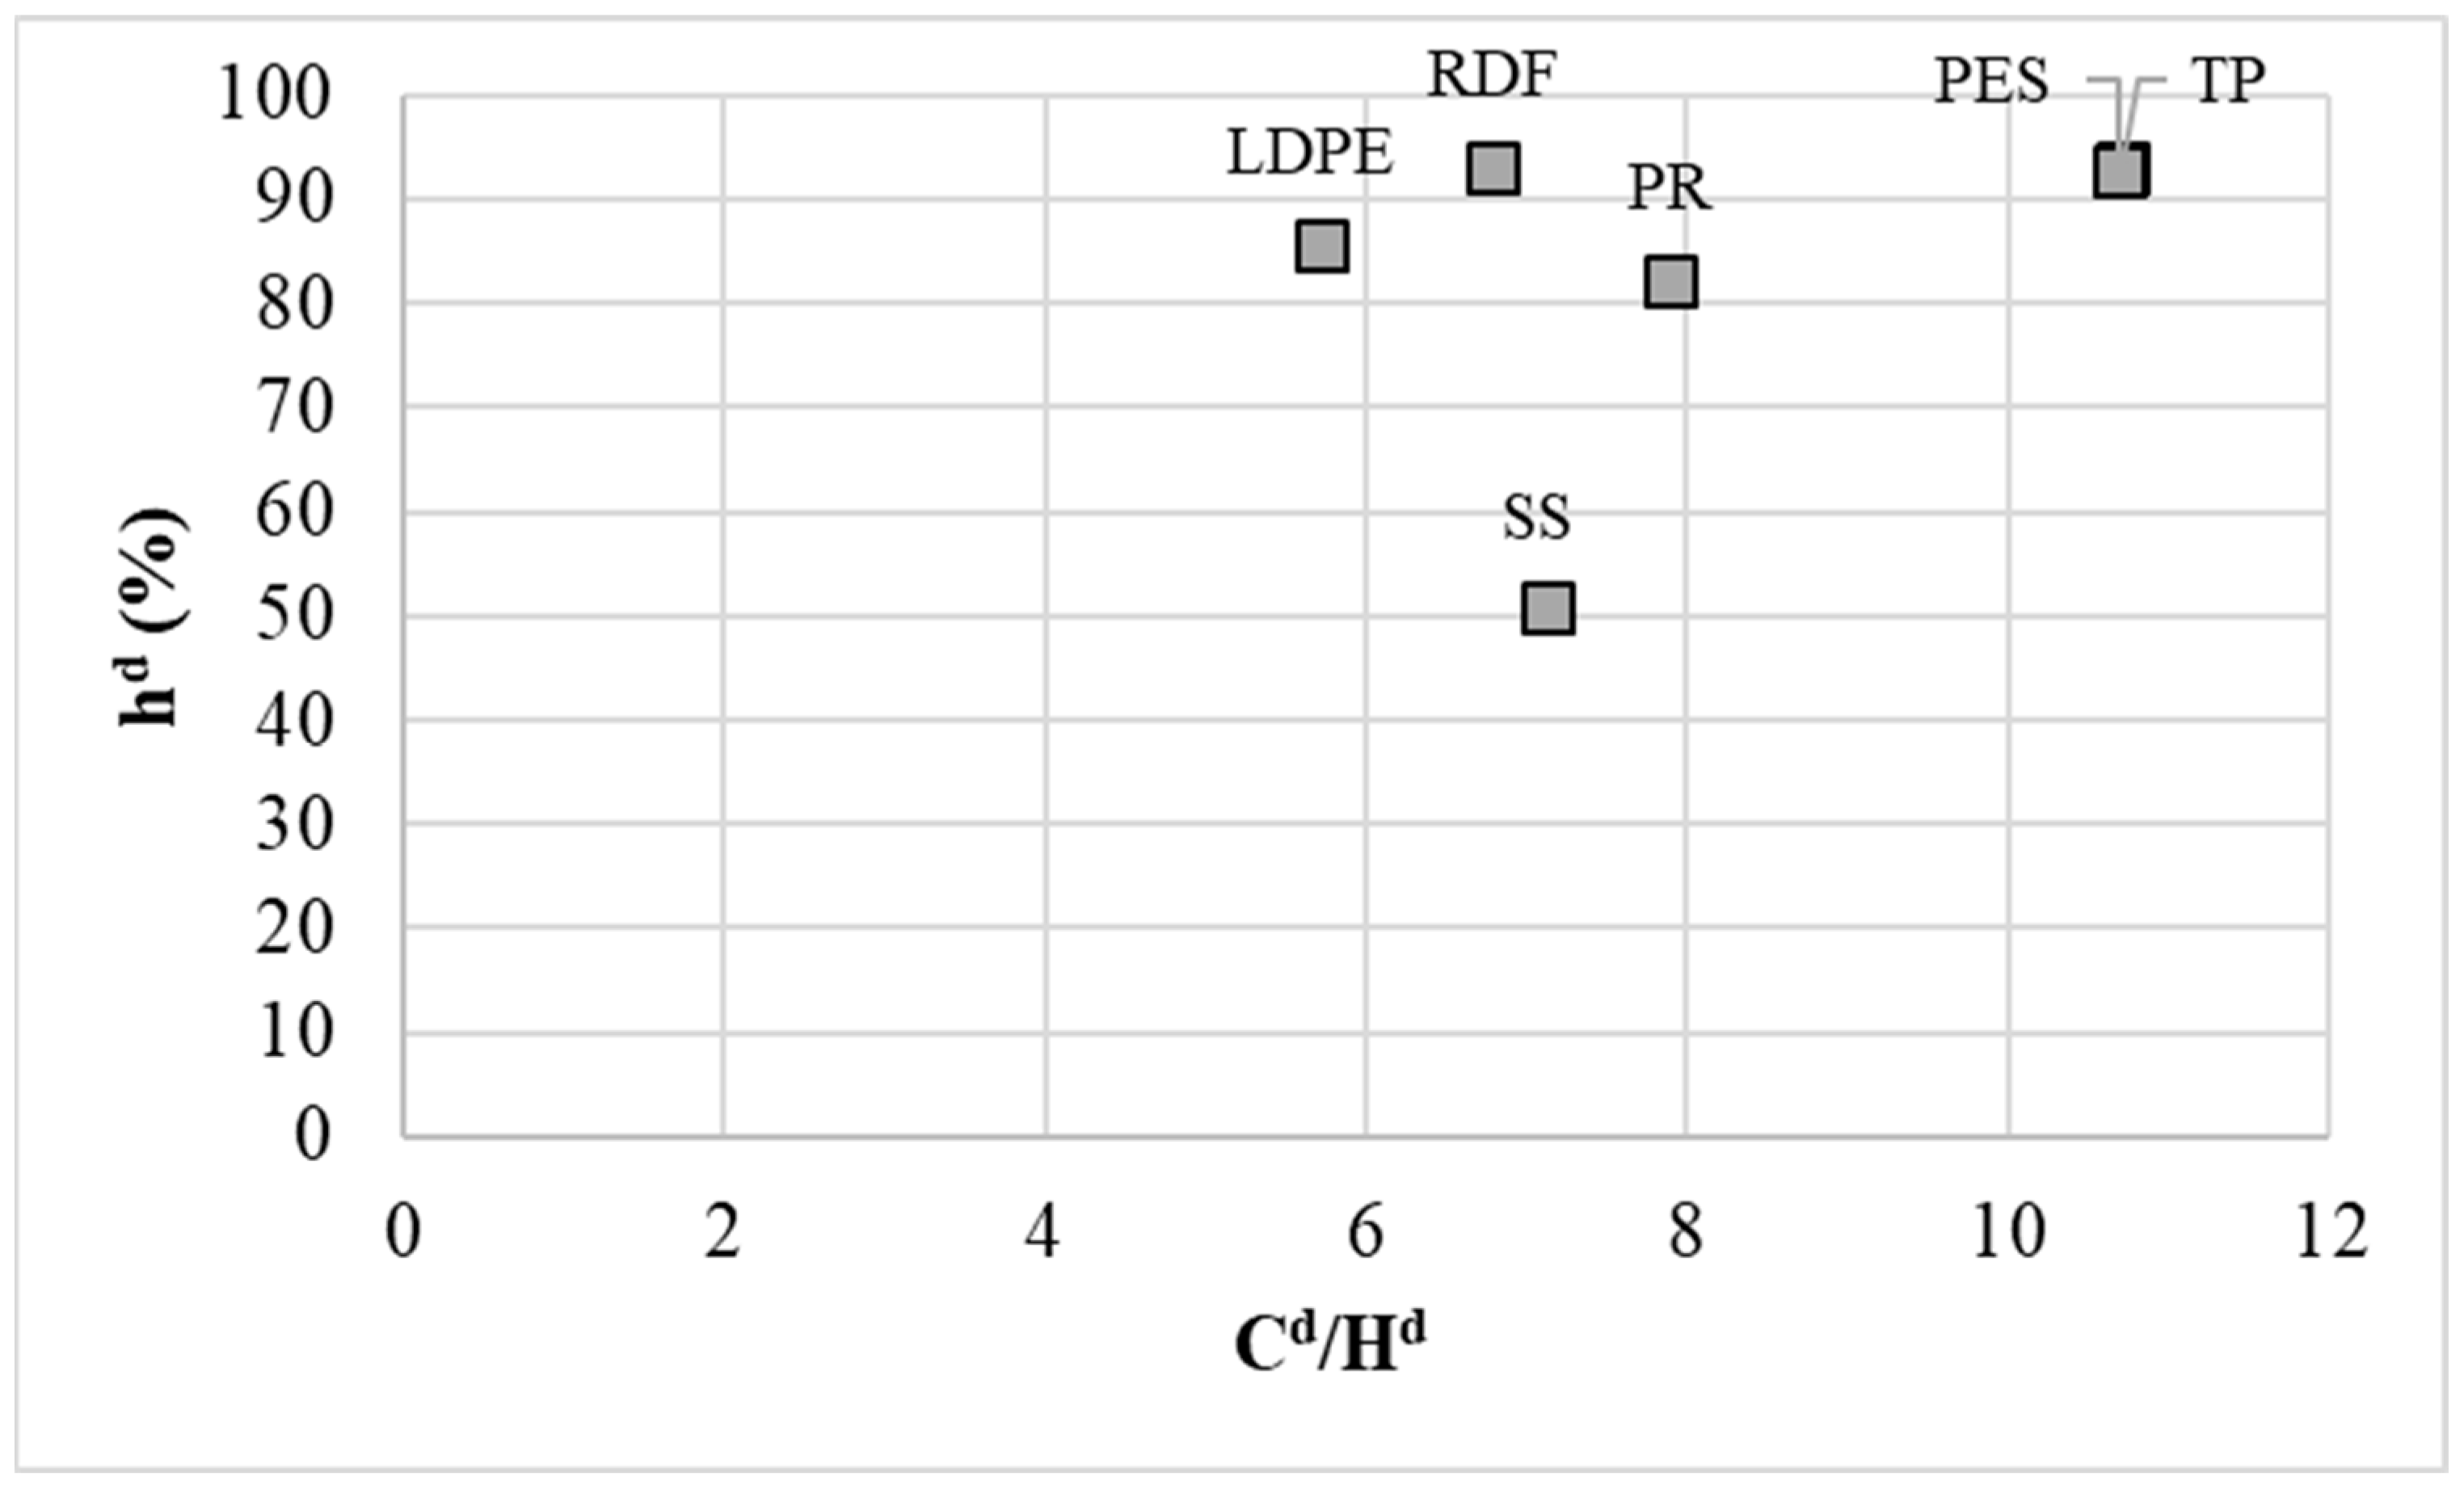
3.1. Analysis of Input Waste
3.2. Composition of Waste Blends and Results of Physical Properties of Waste Blends
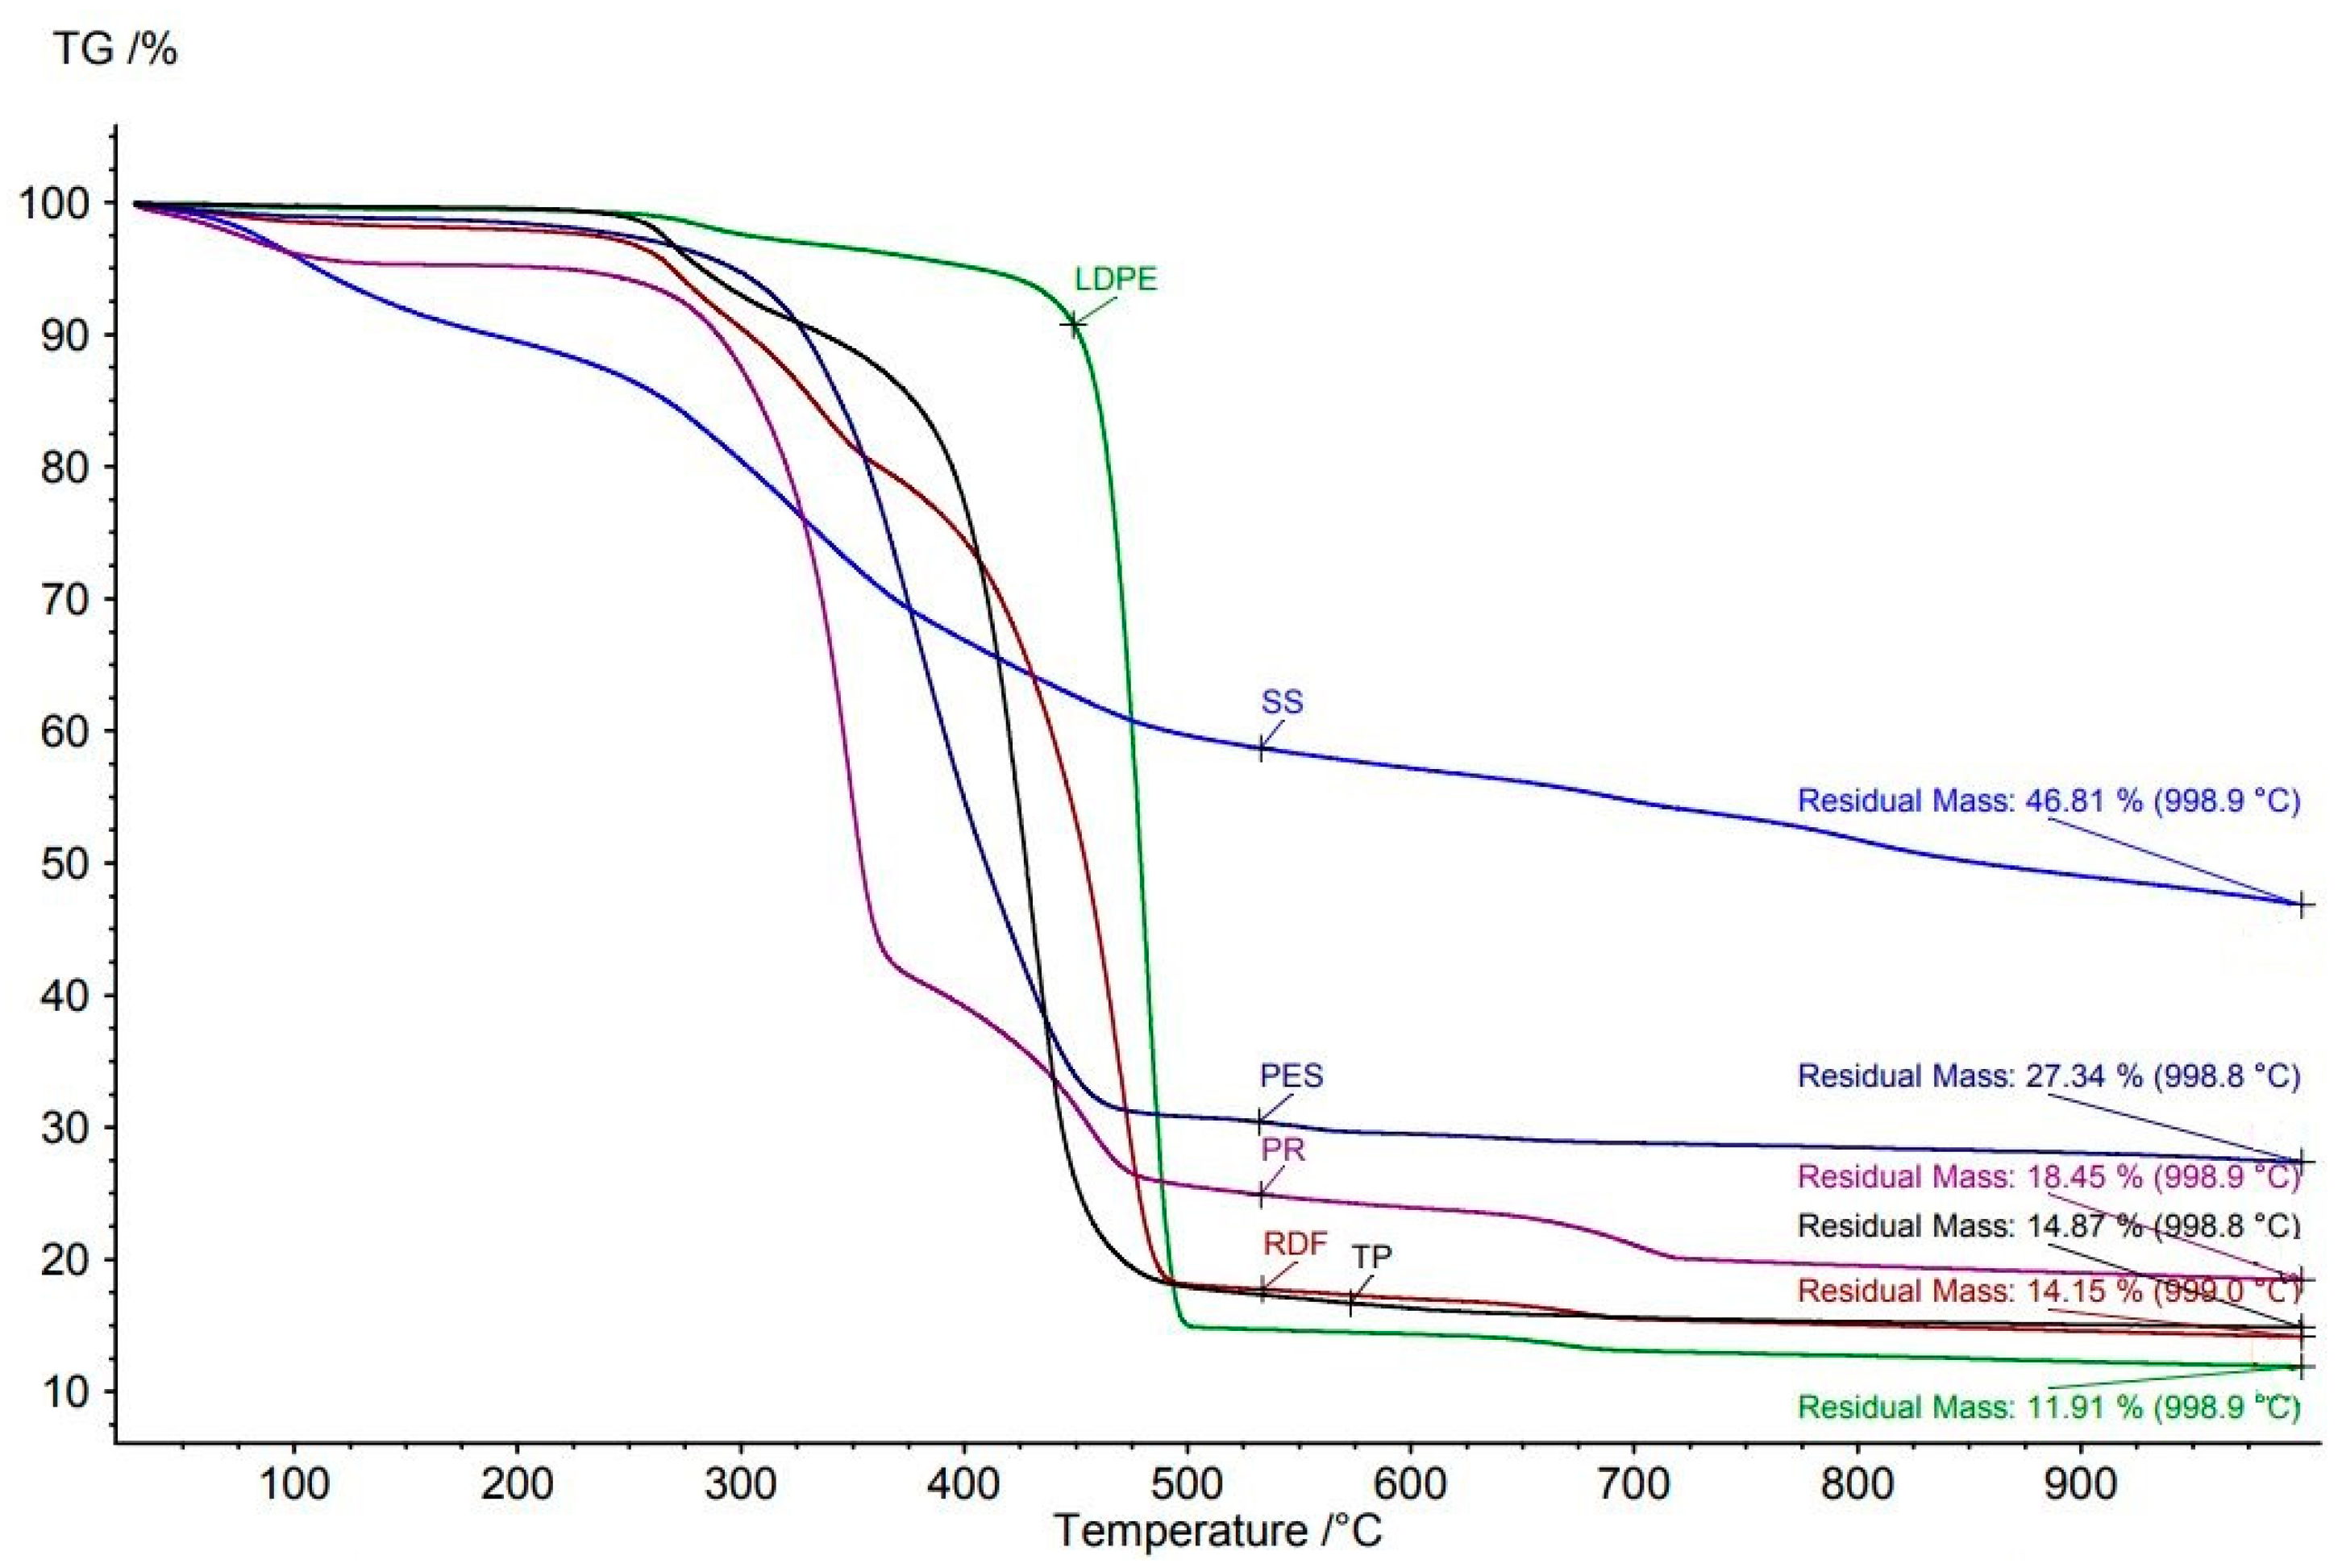
3.3. Thermogravimetric Analysis of Wastes and Their Blends
3.3.1. Input Materials
Sewage Sludge
Plastics
Paper Rejects
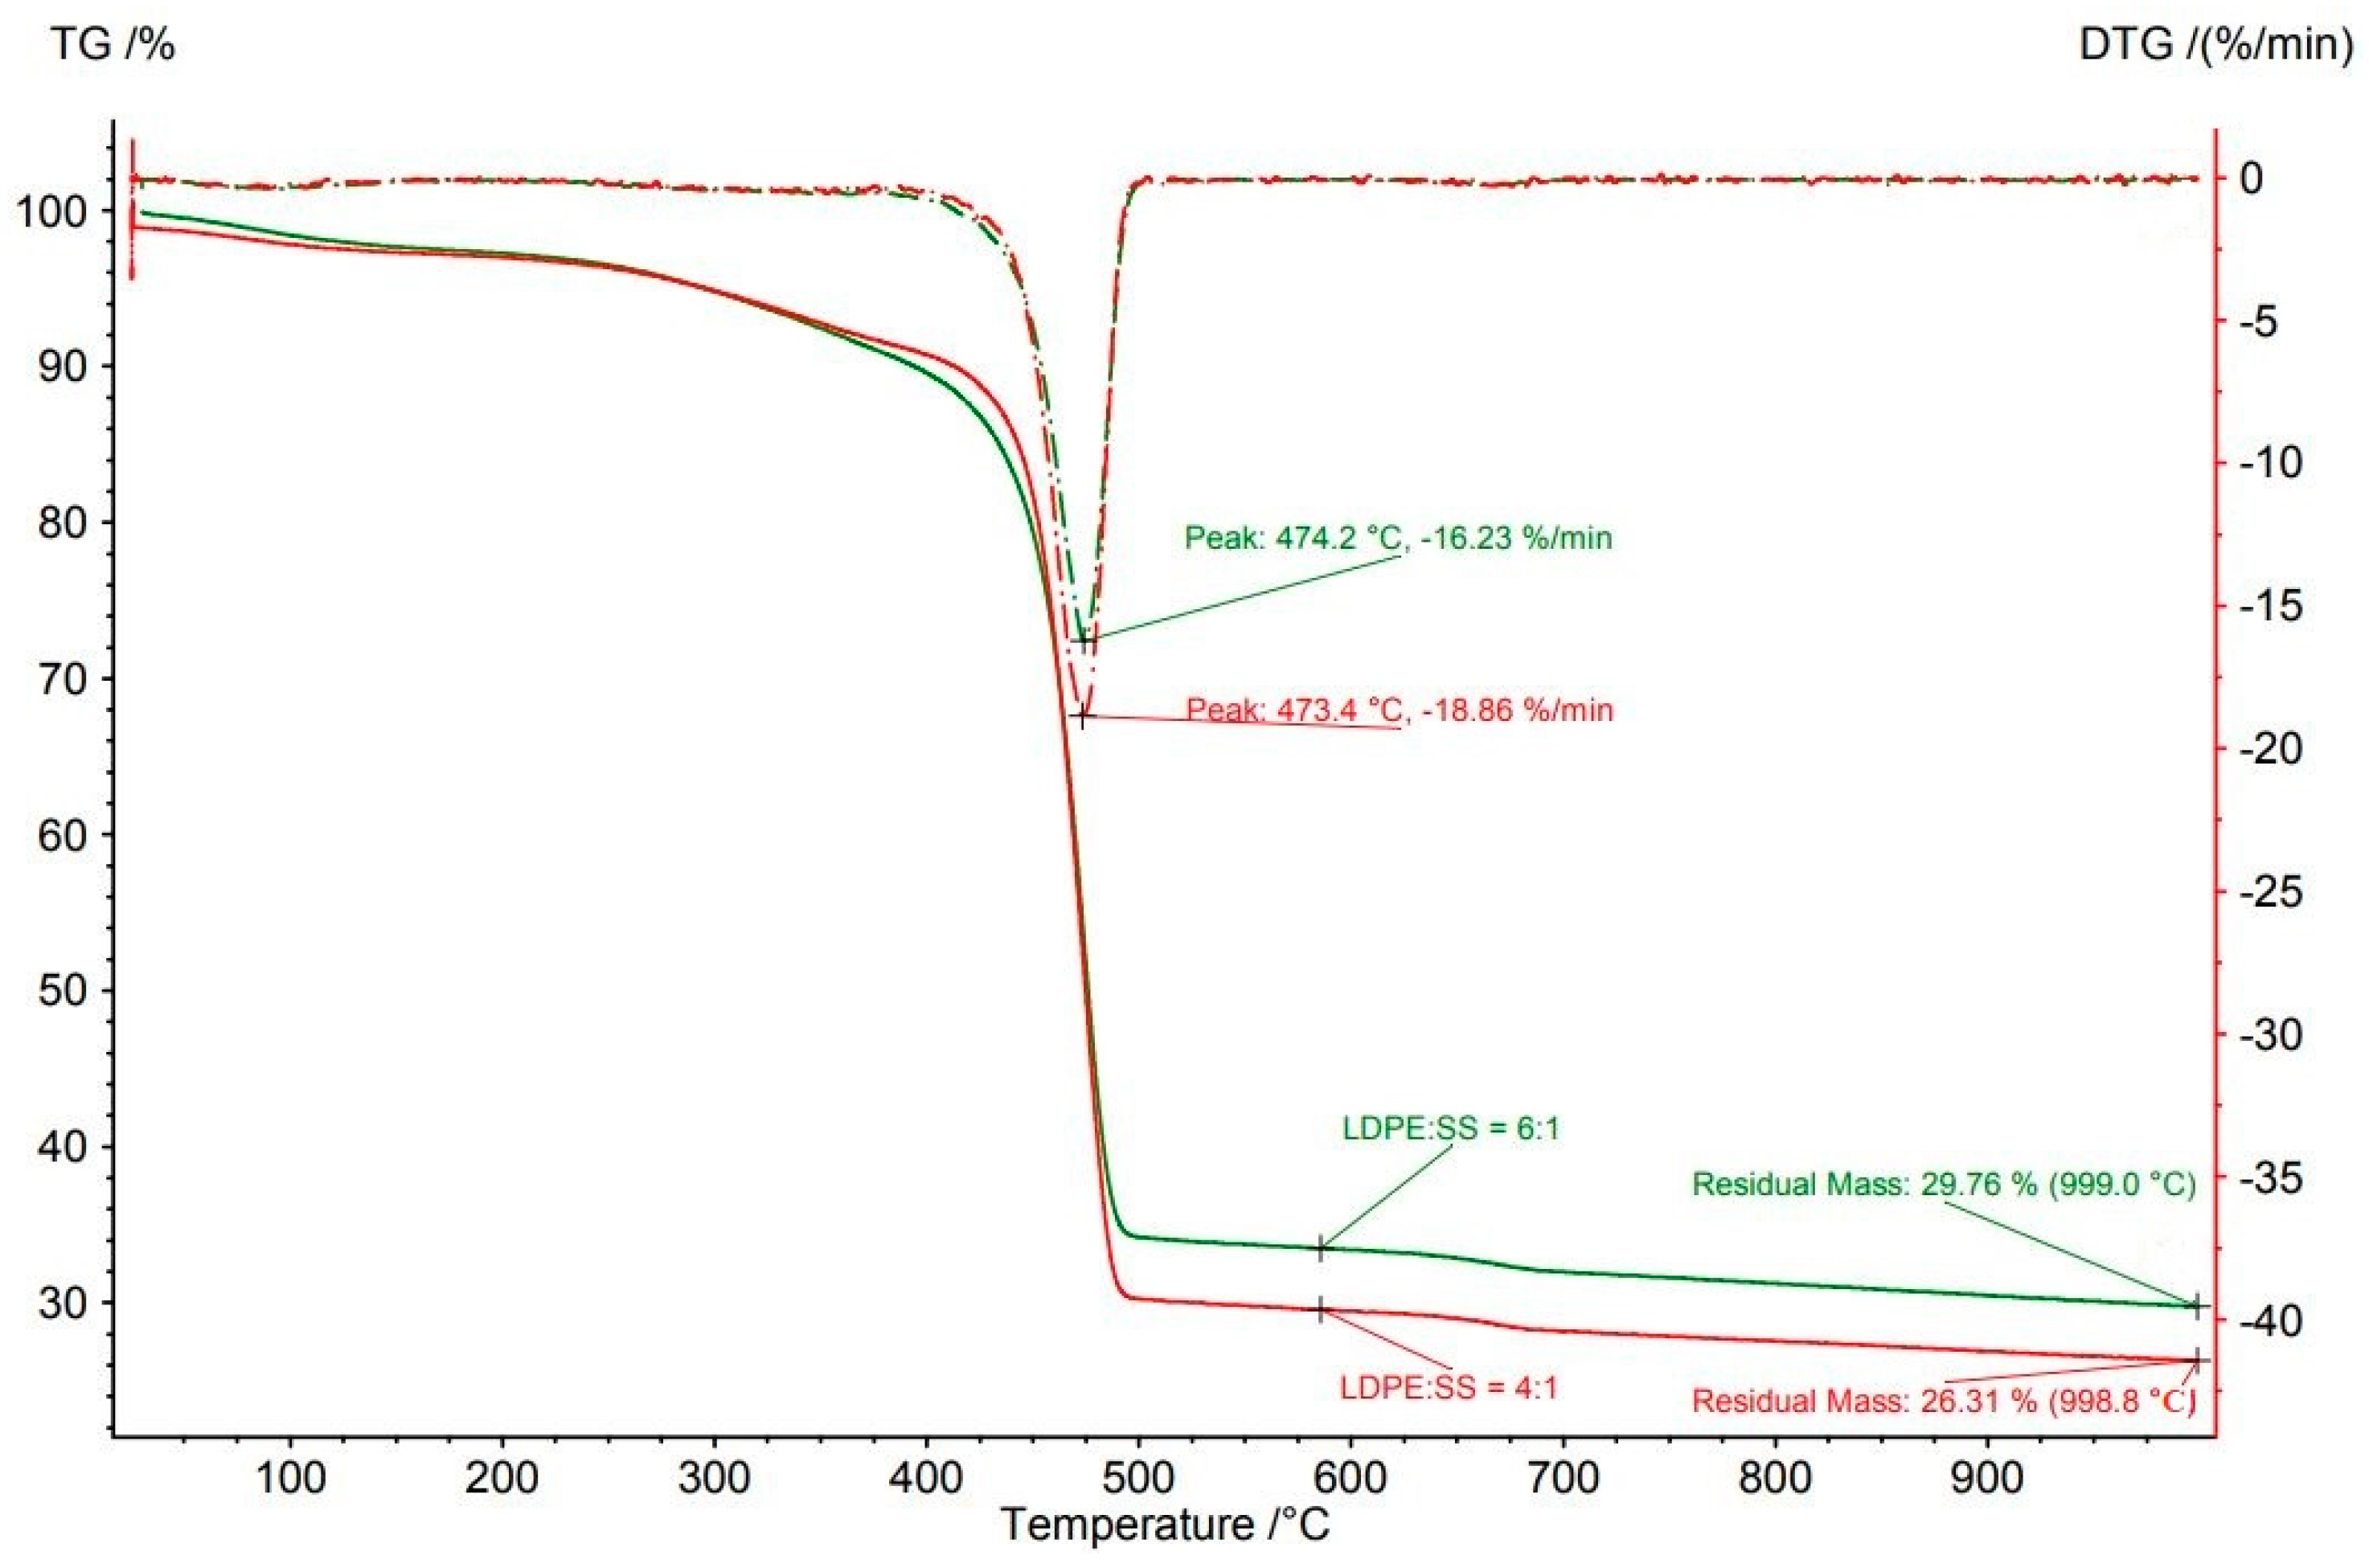
3.3.2. Waste Blends
Sewage Sludge
Plastics
Paper Rejects
3.3.3. Comparison of TG with Weight Loss at 900 °C (Gravimetric Analysis)
3.3.4. Statistical Evaluation
4. Conclusions
Supplementary Materials
Author Contributions
Funding
Institutional Review Board Statement
Informed Consent Statement
Acknowledgments
Conflicts of Interest
Abbreviations
| EU | European Union |
| HHV | high heating value |
| HRT | hydraulic retention time |
| LDPE | low density polyethylene |
| LHV | low heating value |
| MSW | municipal solid waste |
| OLR | organic loading rate |
| PES | polyester |
| PR | paper rejects |
| PT | population total |
| RDF | residual derived fuel (polyethylene foils, bags and sorted municipal solid waste) |
| SS | sewage sludge |
| TG | thermogravimetric |
| TP | thermoplastics (non-specified) |
References
- Baggio, P.; Baratieri, M.; Gasparella, A.; Longo, G.A. Energy and environmental analysis of an innovative system based on municipal solid waste (MSW) pyrolysis and combined cycle. Appl. Therm. Eng. 2008, 28, 136–144. [Google Scholar] [CrossRef]
- Letcher, T.M.; Vallero, D.A. Waste: A Handbook for Management; Elsevier: New York, NY, USA, 2011. [Google Scholar]
- EP. Directive 2019/904/EC of the European Parliament and of the Council of 5 June 2019 on the Reduction of the Impact of Certain Plastic Products on the Environment; European Parliament: Brussels, Belgium, 2019; p. 19. [Google Scholar]
- EP. Directive 2018/2001/EC of the European Parliament and of the Council of 11 December 2018 on the Promotion of the Use of Energy from Renewable Sources; European Parliament: Brussels, Belgium, 2018; pp. 82–209. [Google Scholar]
- Smol, M.; Duda, J.; Czaplicka-Kotas, A.; Szołdrowska, D. Transformation towards circular economy (CE) in municipal waste management system: Model solutions for poland. Sustainability 2020, 12, 4561. [Google Scholar] [CrossRef]
- EP. Directive 91/271/EEC of 21 May 1991 Concerning Urban Waste-Water Treatment; European Parliament: Brussels, Belgium, 1991. [Google Scholar]
- EP. Directive 99/31/EC of 26 April 1999 on the Landfill of Waste; European Parliament: Brussels, Belgium, 1999. [Google Scholar]
- EP. Directive 2000/60/EC of the European Parliament and of the Council of 23 October 2000 on Water Protection (Water Framework Directive); European Parliament: Brussels, Belgium, 2000. [Google Scholar]
- Bianchini, A.; Bonfiglioli, L.; Pellegrini, M.; Saccani, C. Sewage sludge management in Europe: A critical analysis of data quality. Int. J. Environ. Waste Manag. 2016, 18, 226–238. [Google Scholar] [CrossRef]
- Gao, N.; Kamran, K.; Quan, C.; Williams, P.T. Thermochemical conversion of sewage sludge: A critical review. Progress Energy Combust. Sci. 2020, 79, 100843. [Google Scholar] [CrossRef]
- Wanner, F. Treatment of Sewage Sludge in the Czech Republic; Sovak: Prague, Czech Republic, 2019; p. 23. [Google Scholar]
- Raheem, A.; Sikarwar, V.S.; He, J.; Dastyar, W.; Dionysiou, D.D.; Wang, W.; Zhao, M. Opportunities and challenges in sustainable treatment and resource reuse of sewage sludge: A review. Chem. Eng. J. 2018, 337, 616–641. [Google Scholar] [CrossRef]
- Mills, N.; Pearce, P.; Farrow, J.; Thorpe, R.B.; Kirkby, N.F. Environmental & economic life cycle assessment of current & future sewage sludge to energy technologies. Waste Manag. 2014, 34, 185–195. [Google Scholar] [CrossRef] [PubMed]
- Tic, W.J.; Guziałowska-Tic, J.; Pawlak-Kruczek, H.; Woźnikowski, E.; Zadorożny, A.; Niedźwiecki, Ł.; Wnukowski, M.; Krochmalny, K.; Czerep, M. Novel concept of an installation for sustainable thermal utilization of sewage sludge. Energies 2018, 11, 748. [Google Scholar] [CrossRef]
- Winkler, M.K.H.; Bennenbroek, M.H.; Horstink, F.H.; van Loosdrecht, M.C.M.; van de Pol, G.J. The biodrying concept: An innovative technology creating energy from sewage sludge. Bioresour. Technol. 2013, 147, 124–129. [Google Scholar] [CrossRef] [PubMed]
- Fuwape, J.A. Charcoal and fuel value of agroforestry tree crops. Agroforest. Syst. 1993, 22, 175–179. [Google Scholar] [CrossRef]
- Openshaw, K. Energy values of unprocessed biomass, charcoal and other biomass fuels and their role in greenhouse gas mitigation and energy use. In Proceedings of the Advances in Environmental Science and Energy Planning, Canary Islands, Spain, 10–12 January 2015; pp. 30–40. [Google Scholar]
- Praspaliauskas, M.; Pedišius, N. A review of sludge characteristics in Lithuania’s wastewater treatment plants and perspectives of its usage in thermal processes. Renew. Sustain. Energy Rev. 2017, 67, 899–907. [Google Scholar] [CrossRef]
- Cao, Y.; Pawłowski, A. Sewage sludge-to-energy approaches based on anaerobic digestion and pyrolysis: Brief overview and energy efficiency assessment. Renew. Sustain. Energy Rev. 2012, 16, 1657–1665. [Google Scholar] [CrossRef]
- Kasar, P.; Sharma, D.K.; Ahmaruzzaman, M. Thermal and catalytic decomposition of waste plastics and its co-processing with petroleum residue through pyrolysis process. J. Clean. Prod. 2020, 265, 121639. [Google Scholar] [CrossRef]
- EP. Directive 2008/98/EC of the European Parliament and of the Council of 19 November 2008 on Waste; European Parliament: Brussels, Belgium, 2008; pp. 3–30. [Google Scholar]
- Singhabhandhu, A.; Tezuka, T. The waste-to-energy framework for integrated multi-waste utilization: Waste cooking oil, waste lubricating oil, and waste plastics. Energy 2010, 35, 2544–2551. [Google Scholar] [CrossRef]
- Diaz-Silvarrey, L.S.; McMahon, A.; Phan, A.N. Benzoic acid recovery via waste poly(ethylene terephthalate) (PET) catalytic pyrolysis using sulphated zirconia catalyst. J. Anal. Appl. Pyrol. 2018, 134, 621–631. [Google Scholar] [CrossRef]
- Osborn, P. Handbook of Energy Data and Calculations; Butterworth–Heinemann: London, UK, 1985. [Google Scholar]
- Choi, G.-G.; Oh, S.-J.; Kim, J.-S. Scrap tire pyrolysis using a new type two-stage pyrolyzer: Effects of dolomite and olivine on producing a low-sulfur pyrolysis oil. Energy 2016, 114, 457–464. [Google Scholar] [CrossRef]
- Gopal, P.M.; Sivaram, N.M.; Barik, D. Chapter 7—Paper industry wastes and energy generation from wastes. In Energy from Toxic Organic Waste for Heat and Power Generation; Barik, D., Ed.; Woodhead Publishing: Cambridge, UK, 2019; pp. 83–97. [Google Scholar]
- Pokhrel, D.; Viraraghavan, T. Treatment of pulp and paper mill wastewater—A review. Sci. Total Environ. 2004, 333, 37–58. [Google Scholar] [CrossRef] [PubMed]
- Dobrotă, D.; Dobrotă, G. An innovative method in the regeneration of waste rubber and the sustainable development. J. Clean. Prod. 2018, 172, 3591–3599. [Google Scholar] [CrossRef]
- Naqvi, S.R.; Hameed, Z.; Tariq, R.; Taqvi, S.A.; Ali, I.; Niazi, M.B.K.; Noor, T.; Hussain, A.; Iqbal, N.; Shahbaz, M. Synergistic effect on co-pyrolysis of rice husk and sewage sludge by thermal behavior, kinetics, thermodynamic parameters and artificial neural network. Waste Manag. 2019, 85, 131–140. [Google Scholar] [CrossRef]
- Wang, Z.; Liu, K.; Xie, L.; Zhu, H.; Ji, S.; Shu, X. Effects of residence time on characteristics of biochars prepared via co-pyrolysis of sewage sludge and cotton stalks. J. Anal. Appl. Pyrol. 2019, 142, 104659. [Google Scholar] [CrossRef]
- Chen, Q.; Liu, H.; Ko, J.; Wu, H.; Xu, Q. Structure characteristics of bio-char generated from co-pyrolysis of wooden waste and wet municipal sewage sludge. Fuel Process. Technol. 2019, 183, 48–54. [Google Scholar] [CrossRef]
- Yang, X.; Yuan, C.; Xu, J.; Zhang, W. Potential method for gas production: High temperature co-pyrolysis of lignite and sewage sludge with vacuum reactor and long contact time. Bioresource Technol. 2015, 179, 602–605. [Google Scholar] [CrossRef] [PubMed]
- CEN/TS. Solid Recovered Fuels—Determination of Bulk Density; CEN: Brussels, Belgium, 2010; Volume CEN/TS 15401:2010. [Google Scholar]
- EN. Characterization of Sludges—Determination of Dry Residue and Water Content; EN: Brussels, Belgium, 2000; Volume EN 12880:2000. [Google Scholar]
- EN. Characterization of—Sampling of Waste Materials—Framework for the Preparation and Application of a Sampling Plan; EN: Brussels, Belgium, 2005; Volume EN 14899:2005. [Google Scholar]
- CEN/TS. Solid Recovered Fuels—Determination of Moisture Content Using the Oven Dry Method—Part 2: Determination of Total Moisture Content by a Simplified Method; CEN: Brussels, Belgium, 2010; Volume CEN/TS 15414-2:2010. [Google Scholar]
- EN. Solid Recovered Fuels—Determination of Moisture Content Using the Oven Dry Method—Part 3: Moisture in General Analysis Sample; EN: Brussels, Belgium, 2011; Volume EN 15414-3:2011. [Google Scholar]
- EN. Solid Recovered Fuels—Determination of Ash Content; EN: Brussels, Belgium, 2011; Volume EN 15403:2011. [Google Scholar]
- EN. Solid Recovered Fuels—Determination of the Content of Volatile Matter; EN: Brussels, Belgium, 2011; Volume EN 15402:2011. [Google Scholar]
- EN. Solid Recovered Fuels—Methods for the Determination of Carbon (C), Hydrogen (H) and Nitrogen (N) Content; EN: Brussels, Belgium, 2011; Volume EN 15407:2011. [Google Scholar]
- ISO. Solid Mineral Fuels—Determination of Sulfur by IR Spectrometry; International Organization for Standardization: Geneva, Switzerland, 2006; Volume ISO 19579. [Google Scholar]
- ISO. Solid Biofuels—Conversion of Analytical Results from One Basis to Another; ISO: Geneva, Switzerland, 2016; Volume ISO 16993:2016. [Google Scholar]
- EN. Solid Recovered Fuels—Determination of Calorific Value; EN: Brussels, Belgium, 2011; Volume EN 15400:2011. [Google Scholar]
- Fonts, I.; Gea, G.; Azuara, M.; Ábrego, J.; Arauzo, J. Sewage sludge pyrolysis for liquid production: A review. Renew. Sustain. Energy Rev. 2012, 16, 2781–2805. [Google Scholar] [CrossRef]
- Magdziarz, A.; Werle, S. Analysis of the combustion and pyrolysis of dried sewage sludge by TGA and MS. Waste Manag. 2014, 34, 174–179. [Google Scholar] [CrossRef]
- Calvo, L.F.; Otero, M.; Jenkins, B.M.; García, A.I.; Morán, A. Heating process characteristics and kinetics of sewage sludge in different atmospheres. Thermochim. Acta 2004, 409, 127–135. [Google Scholar] [CrossRef]
- Hu, X.; Guo, H.; Gholizadeh, M.; Sattari, B.; Liu, Q. Pyrolysis of different wood species: Impacts of C/H ratio in feedstock on distribution of pyrolysis products. Biomass Bioenergy 2019, 120, 28–39. [Google Scholar] [CrossRef]
- Fetene, Y.; Addis, T.; Beyene, A.; Kloos, H. Valorisation of solid waste as key opportunity for green city development in the growing urban areas of the developing world. J. Environ. Chem. Eng. 2018, 6, 7144–7151. [Google Scholar] [CrossRef]
- Folgueras, M.B.; Alonso, M.; Díaz, R.M. Influence of sewage sludge treatment on pyrolysis and combustion of dry sludge. Energy 2013, 55, 426–435. [Google Scholar] [CrossRef]
- Das, P.; Tiwari, P. Thermal degradation kinetics of plastics and model selection. Thermochim. Acta 2017, 654, 191–202. [Google Scholar] [CrossRef]
- Chowlu, A.C.K.; Reddy, P.K.; Ghoshal, A.K. Pyrolytic decomposition and model-free kinetics analysis of mixture of polypropylene (PP) and low-density polyethylene (LDPE). Thermochim. Acta 2009, 485, 20–25. [Google Scholar] [CrossRef]
- Marcilla, A.; García-Quesada, J.C.; Sánchez, S.; Ruiz, R. Study of the catalytic pyrolysis behaviour of polyethylene–polypropylene mixtures. J. Anal. Appl. Pyrol. 2005, 74, 387–392. [Google Scholar] [CrossRef]
- Anene, A.F.; Fredriksen, S.B.; Sætre, K.A.; Tokheim, L.-A. Experimental study of thermal and catalytic pyrolysis of plastic waste components. Sustainability 2018, 10, 3979. [Google Scholar] [CrossRef]
- Grigiante, M.; Ischia, M.; Baratieri, M.; Dal Maschio, R.; Ragazzi, M. Pyrolysis analysis and solid residue stabilization of polymers, waste tyres, spruce sawdust and sewage sludge. Waste Biomass Valorizat. 2010, 1, 381–393. [Google Scholar] [CrossRef]
- Acevedo, B.; Fernández, A.M.; Barriocanal, C. Identification of polymers in waste tyre reinforcing fibre by thermal analysis and pyrolysis. J. Anal. Appl. Pyrol. 2015, 111, 224–232. [Google Scholar] [CrossRef]
- Arenales Rivera, J.; Pérez López, V.; Ramos Casado, R.; Sánchez Hervás, J.-M. Thermal degradation of paper industry wastes from a recovered paper mill using TGA. Characterization and gasification test. Waste Manag. 2016, 47, 225–235. [Google Scholar] [CrossRef] [PubMed]
- Zaker, A.; Chen, Z.; Zaheer-Uddin, M.; Guo, J. Co-pyrolysis of sewage sludge and low-density polyethylene—A thermogravimetric study of thermo-kinetics and thermodynamic parameters. J. Environ. Chem. Eng. 2020, 104554. [Google Scholar] [CrossRef]
- Hu, D.H.; Chen, M.Q.; Huang, Y.W.; Wei, S.H.; Zhong, X.B. Evaluation on isothermal pyrolysis characteristics of typical technical solid wastes. Thermochim. Acta 2020, 688, 178604. [Google Scholar] [CrossRef]
- Chan, W.P.; Wang, J.-Y. Comprehensive characterisation of sewage sludge for thermochemical conversion processes—Based on Singapore survey. Waste Manag. 2016, 54, 131–142. [Google Scholar] [CrossRef] [PubMed]
- Honus, S.; Kumagai, S.; Fedorko, G.; Molnár, V.; Yoshioka, T. Pyrolysis gases produced from individual and mixed PE, PP, PS, PVC, and PET—Part I: Production and physical properties. Fuel 2018, 221, 346–360. [Google Scholar] [CrossRef]
- Quan, C.; Gao, N.; Song, Q. Pyrolysis of biomass components in a TGA and a fixed-bed reactor: Thermochemical behaviors, kinetics, and product characterization. J. Anal. Appl. Pyrol. 2016, 121, 84–92. [Google Scholar] [CrossRef]
- Zhou, H.; Wu, C.; Onwudili, J.A.; Meng, A.; Zhang, Y.; Williams, P.T. Influence of process conditions on the formation of 2–4 ring polycyclic aromatic hydrocarbons from the pyrolysis of polyvinyl chloride. Fuel Process. Technol. 2016, 144, 299–304. [Google Scholar] [CrossRef]


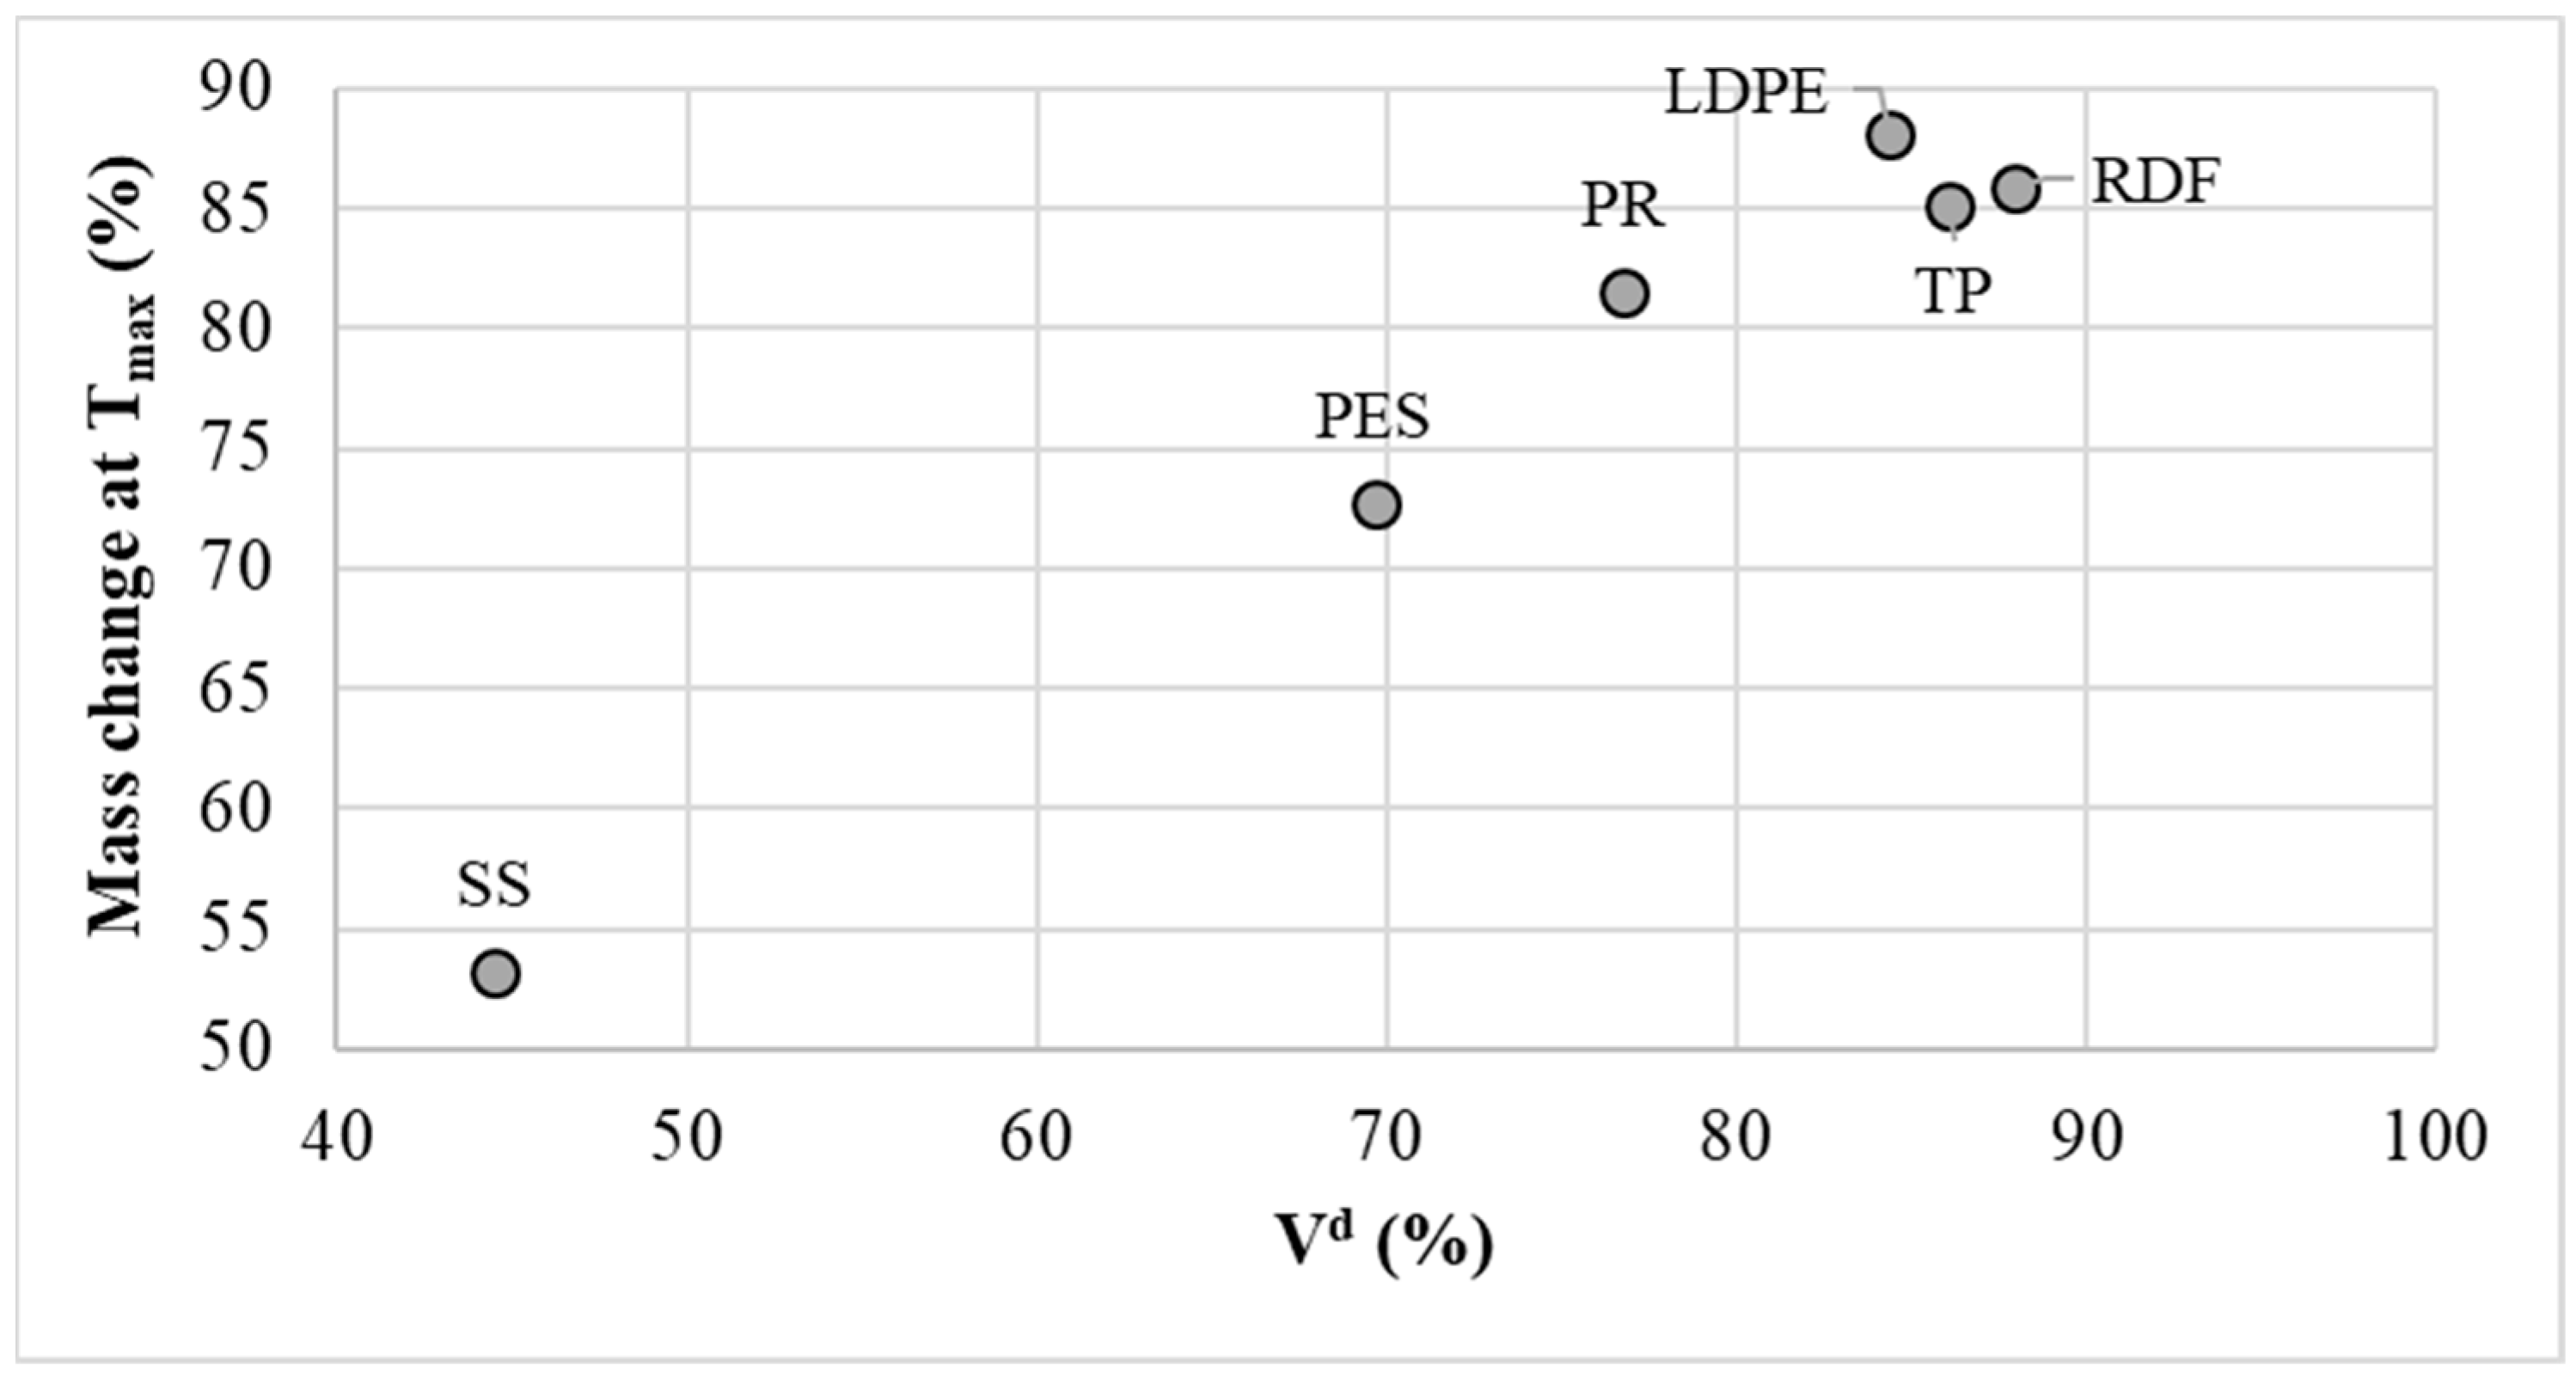
| Inlet Material | Tmax | Mass Change at Tmax | T1 | Weight Loss Rate at T1 |
|---|---|---|---|---|
| °C | % | °C | %/min | |
| LDPE | 998.9 | 88.09 | 479.9 | 26.98 |
| RDF | 999.0 | 85.85 | 469.1 | 11.73 |
| TP | 998.8 | 85.13 | 429.3 | 13.77 |
| PR | 998.9 | 81.55 | 348.1 | 11.85 |
| PES | 998.8 | 72.66 | 378.6 | 6.16 |
| SS | 998.9 | 53.19 | 325.2 | 1.62 |
| Waste Blend | Volume Ratio | Tmax | Mass Change at Tmax | T1 | Mass Change at T1 | Weight Loss Rate at T1 |
|---|---|---|---|---|---|---|
| °C | % | °C | % | %/min | ||
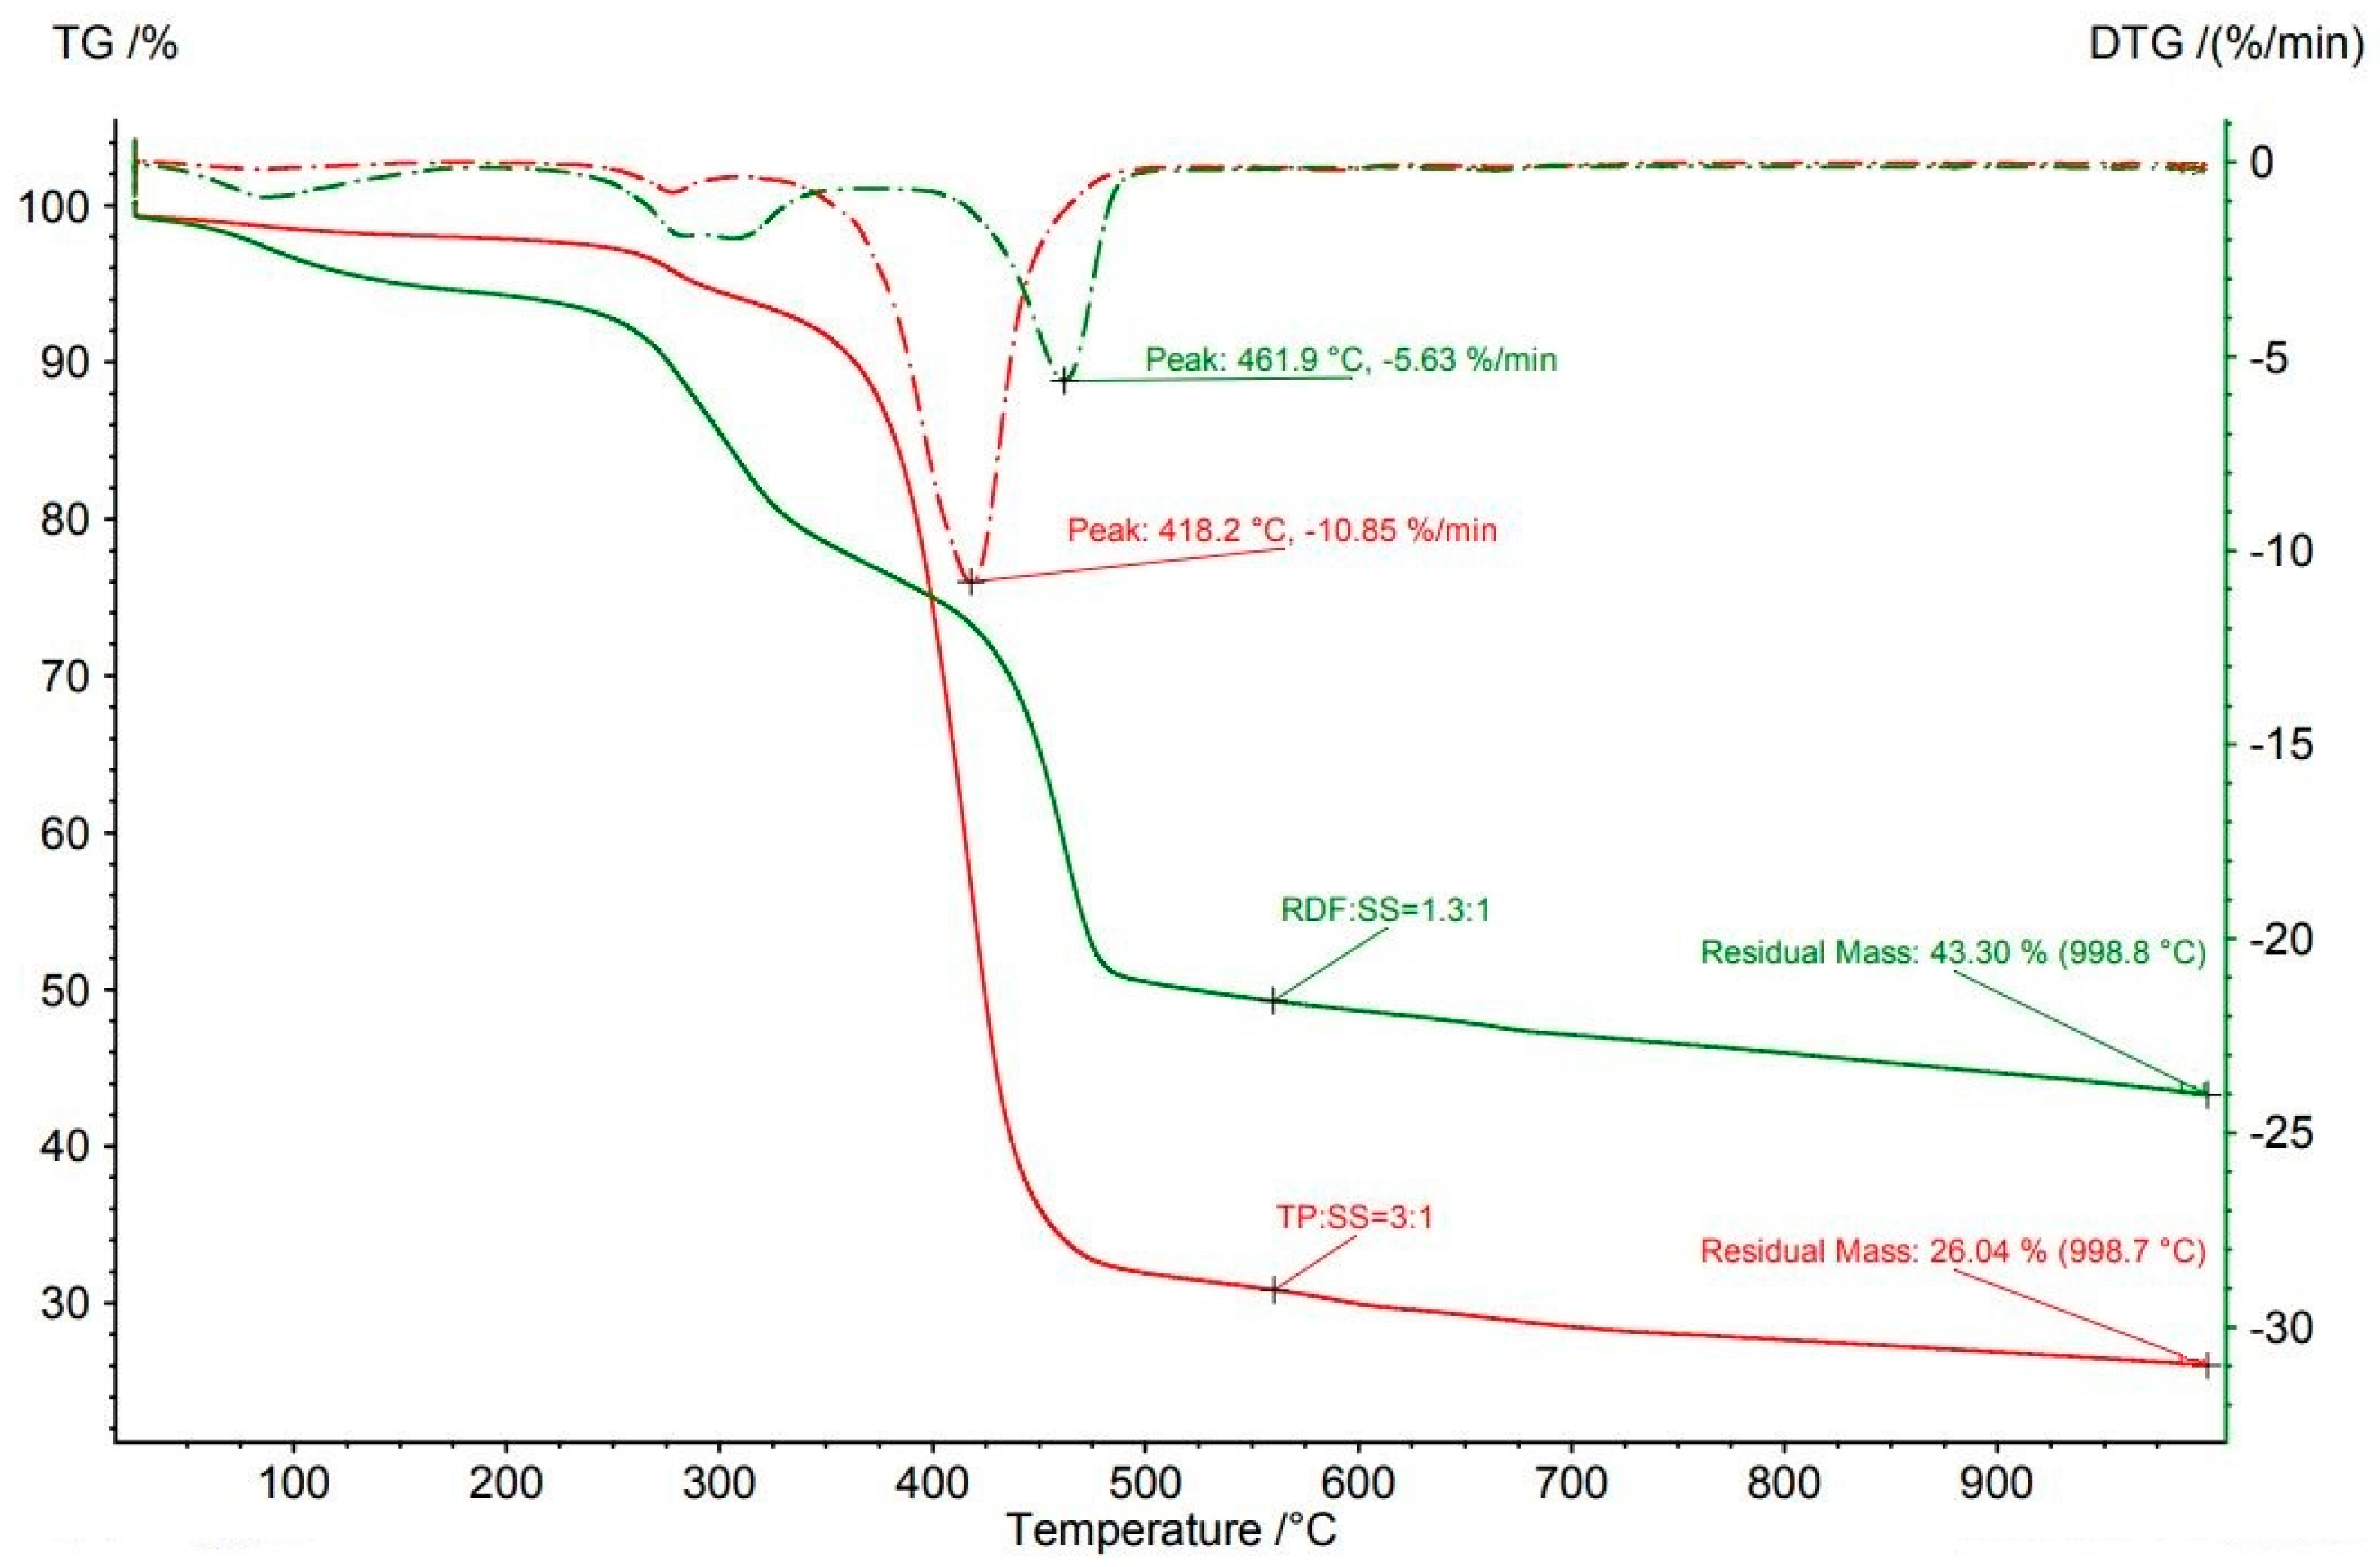
| TP:SS | 3:1 | 998.7 | 74.0 | 418.2 | 67.0 | 10.9 |
| LDPE:SS | 4:1 | 998.8 | 73.7 | 473.4 | 72.7 | 18.9 |
| LDPE:SS | 6:1 | 998.9 | 70.2 | 474.2 | 67.8 | 16.2 |
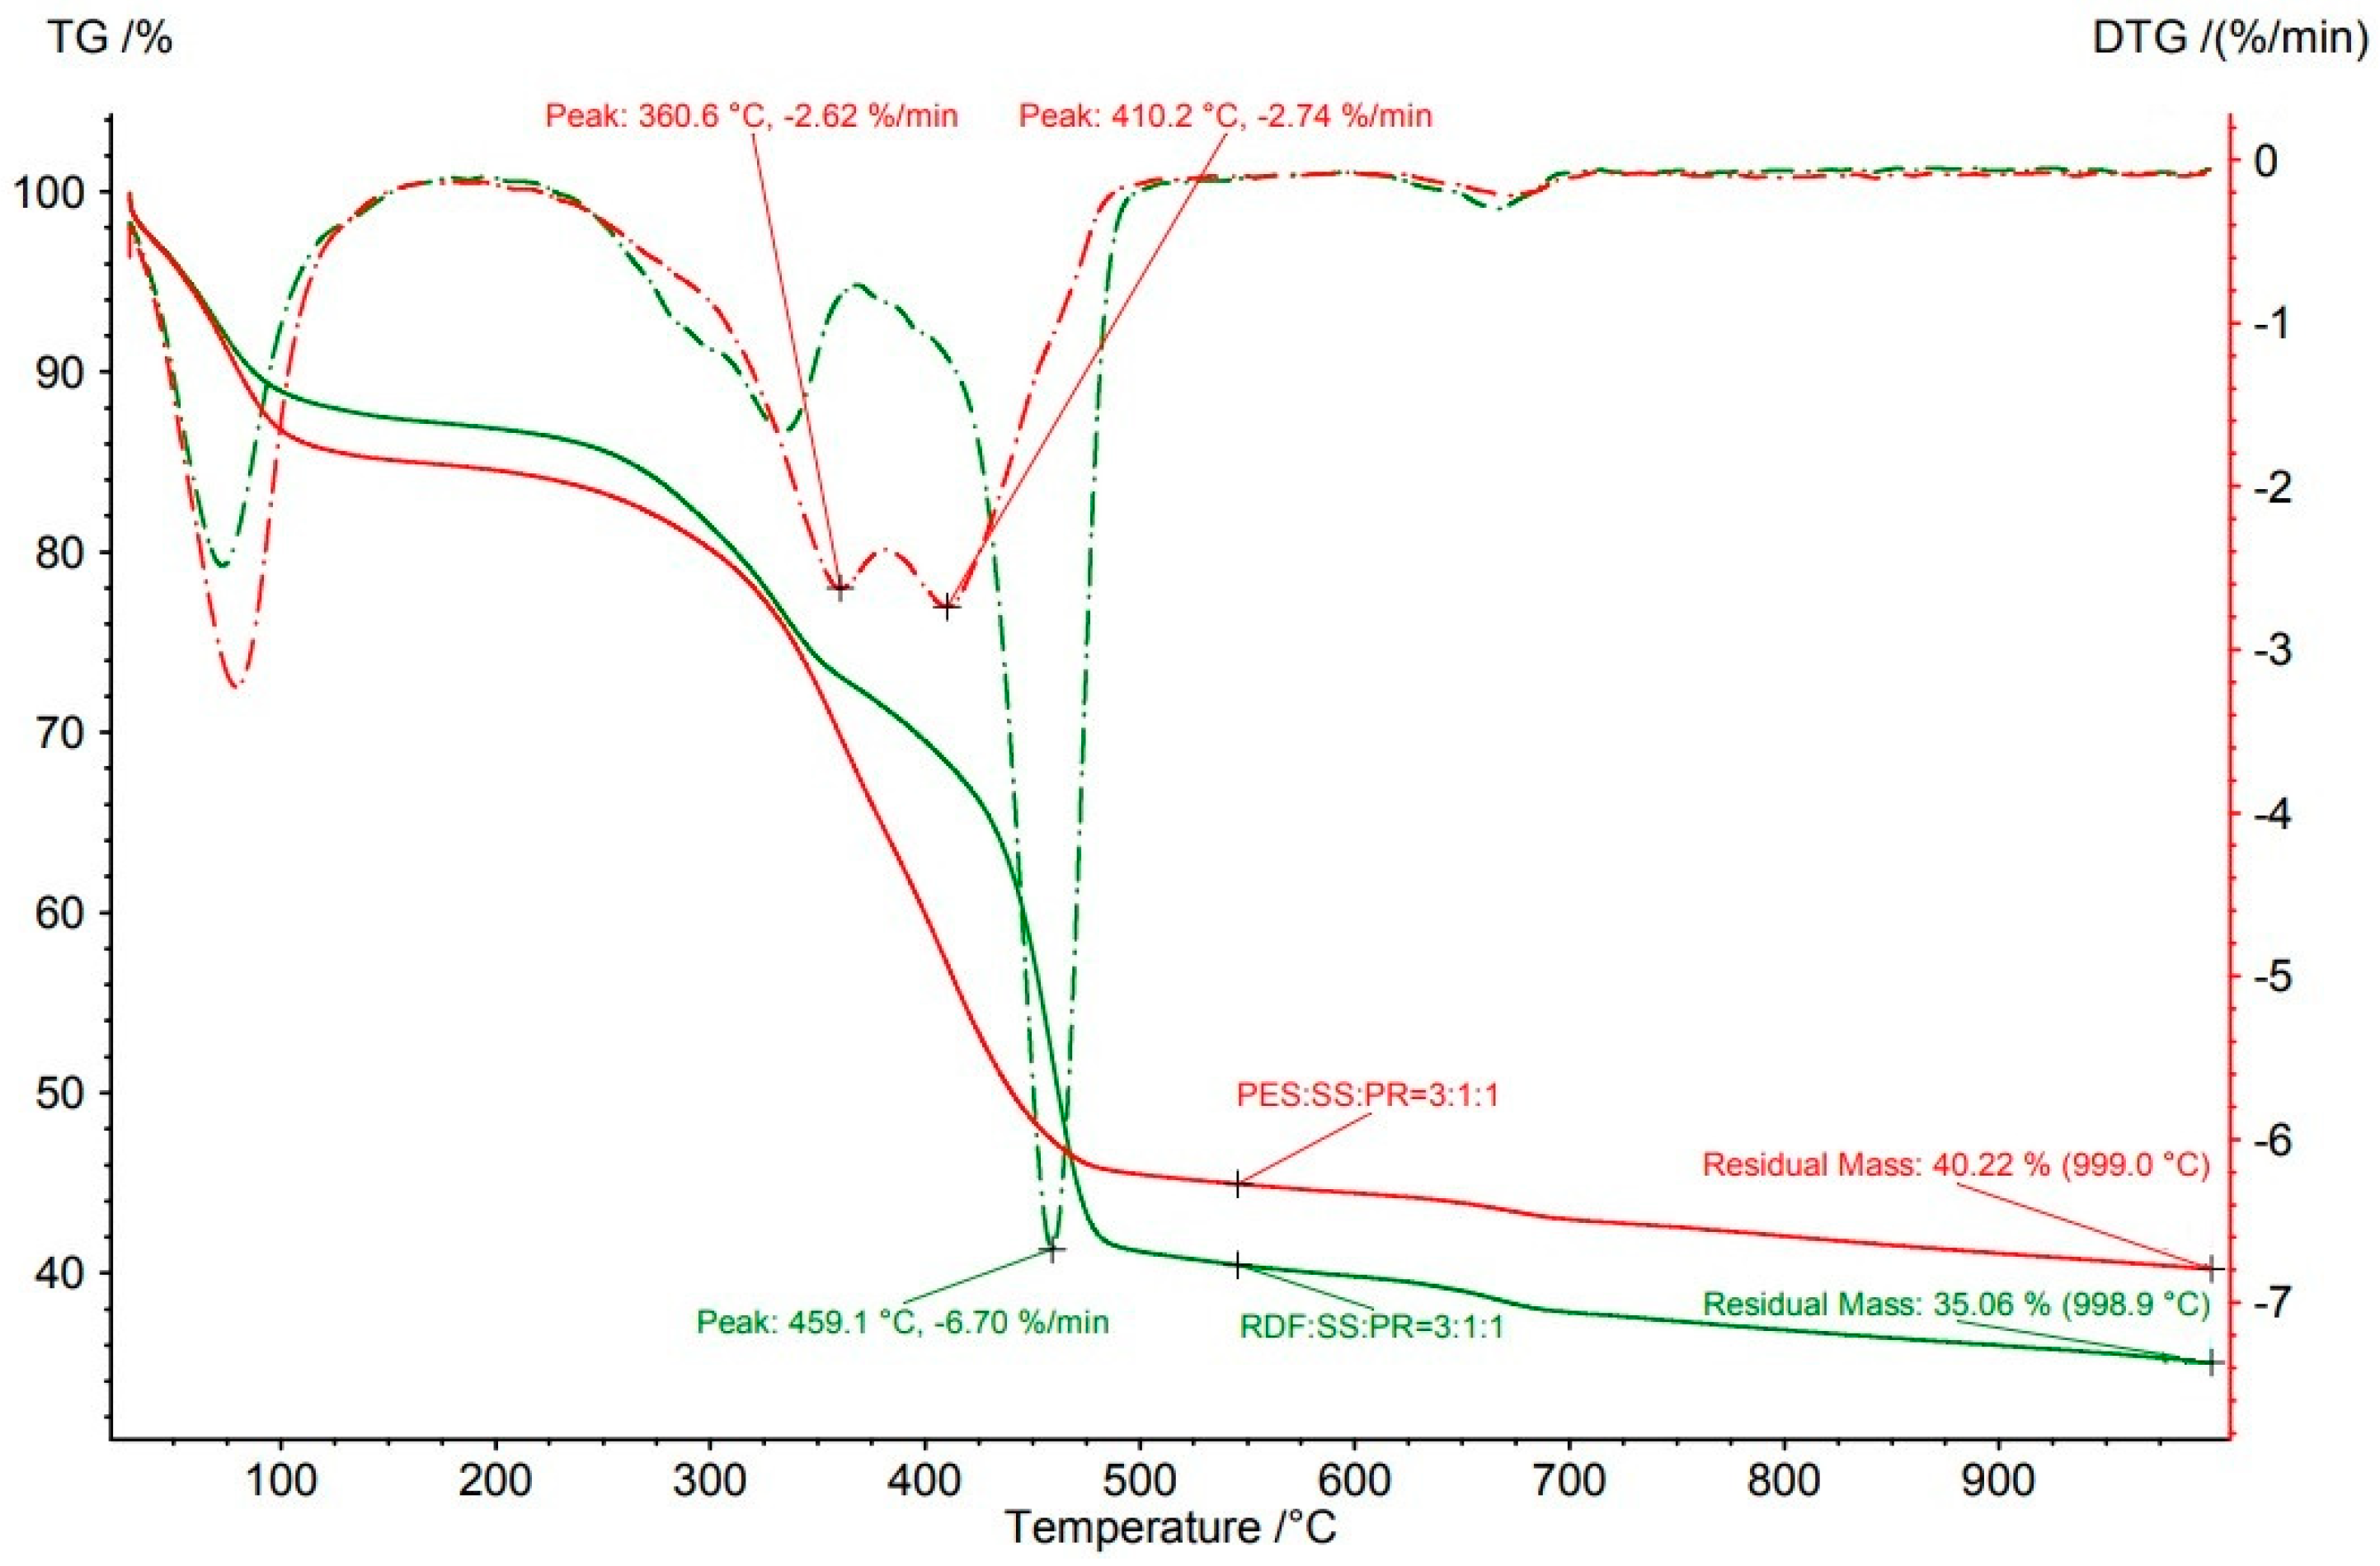
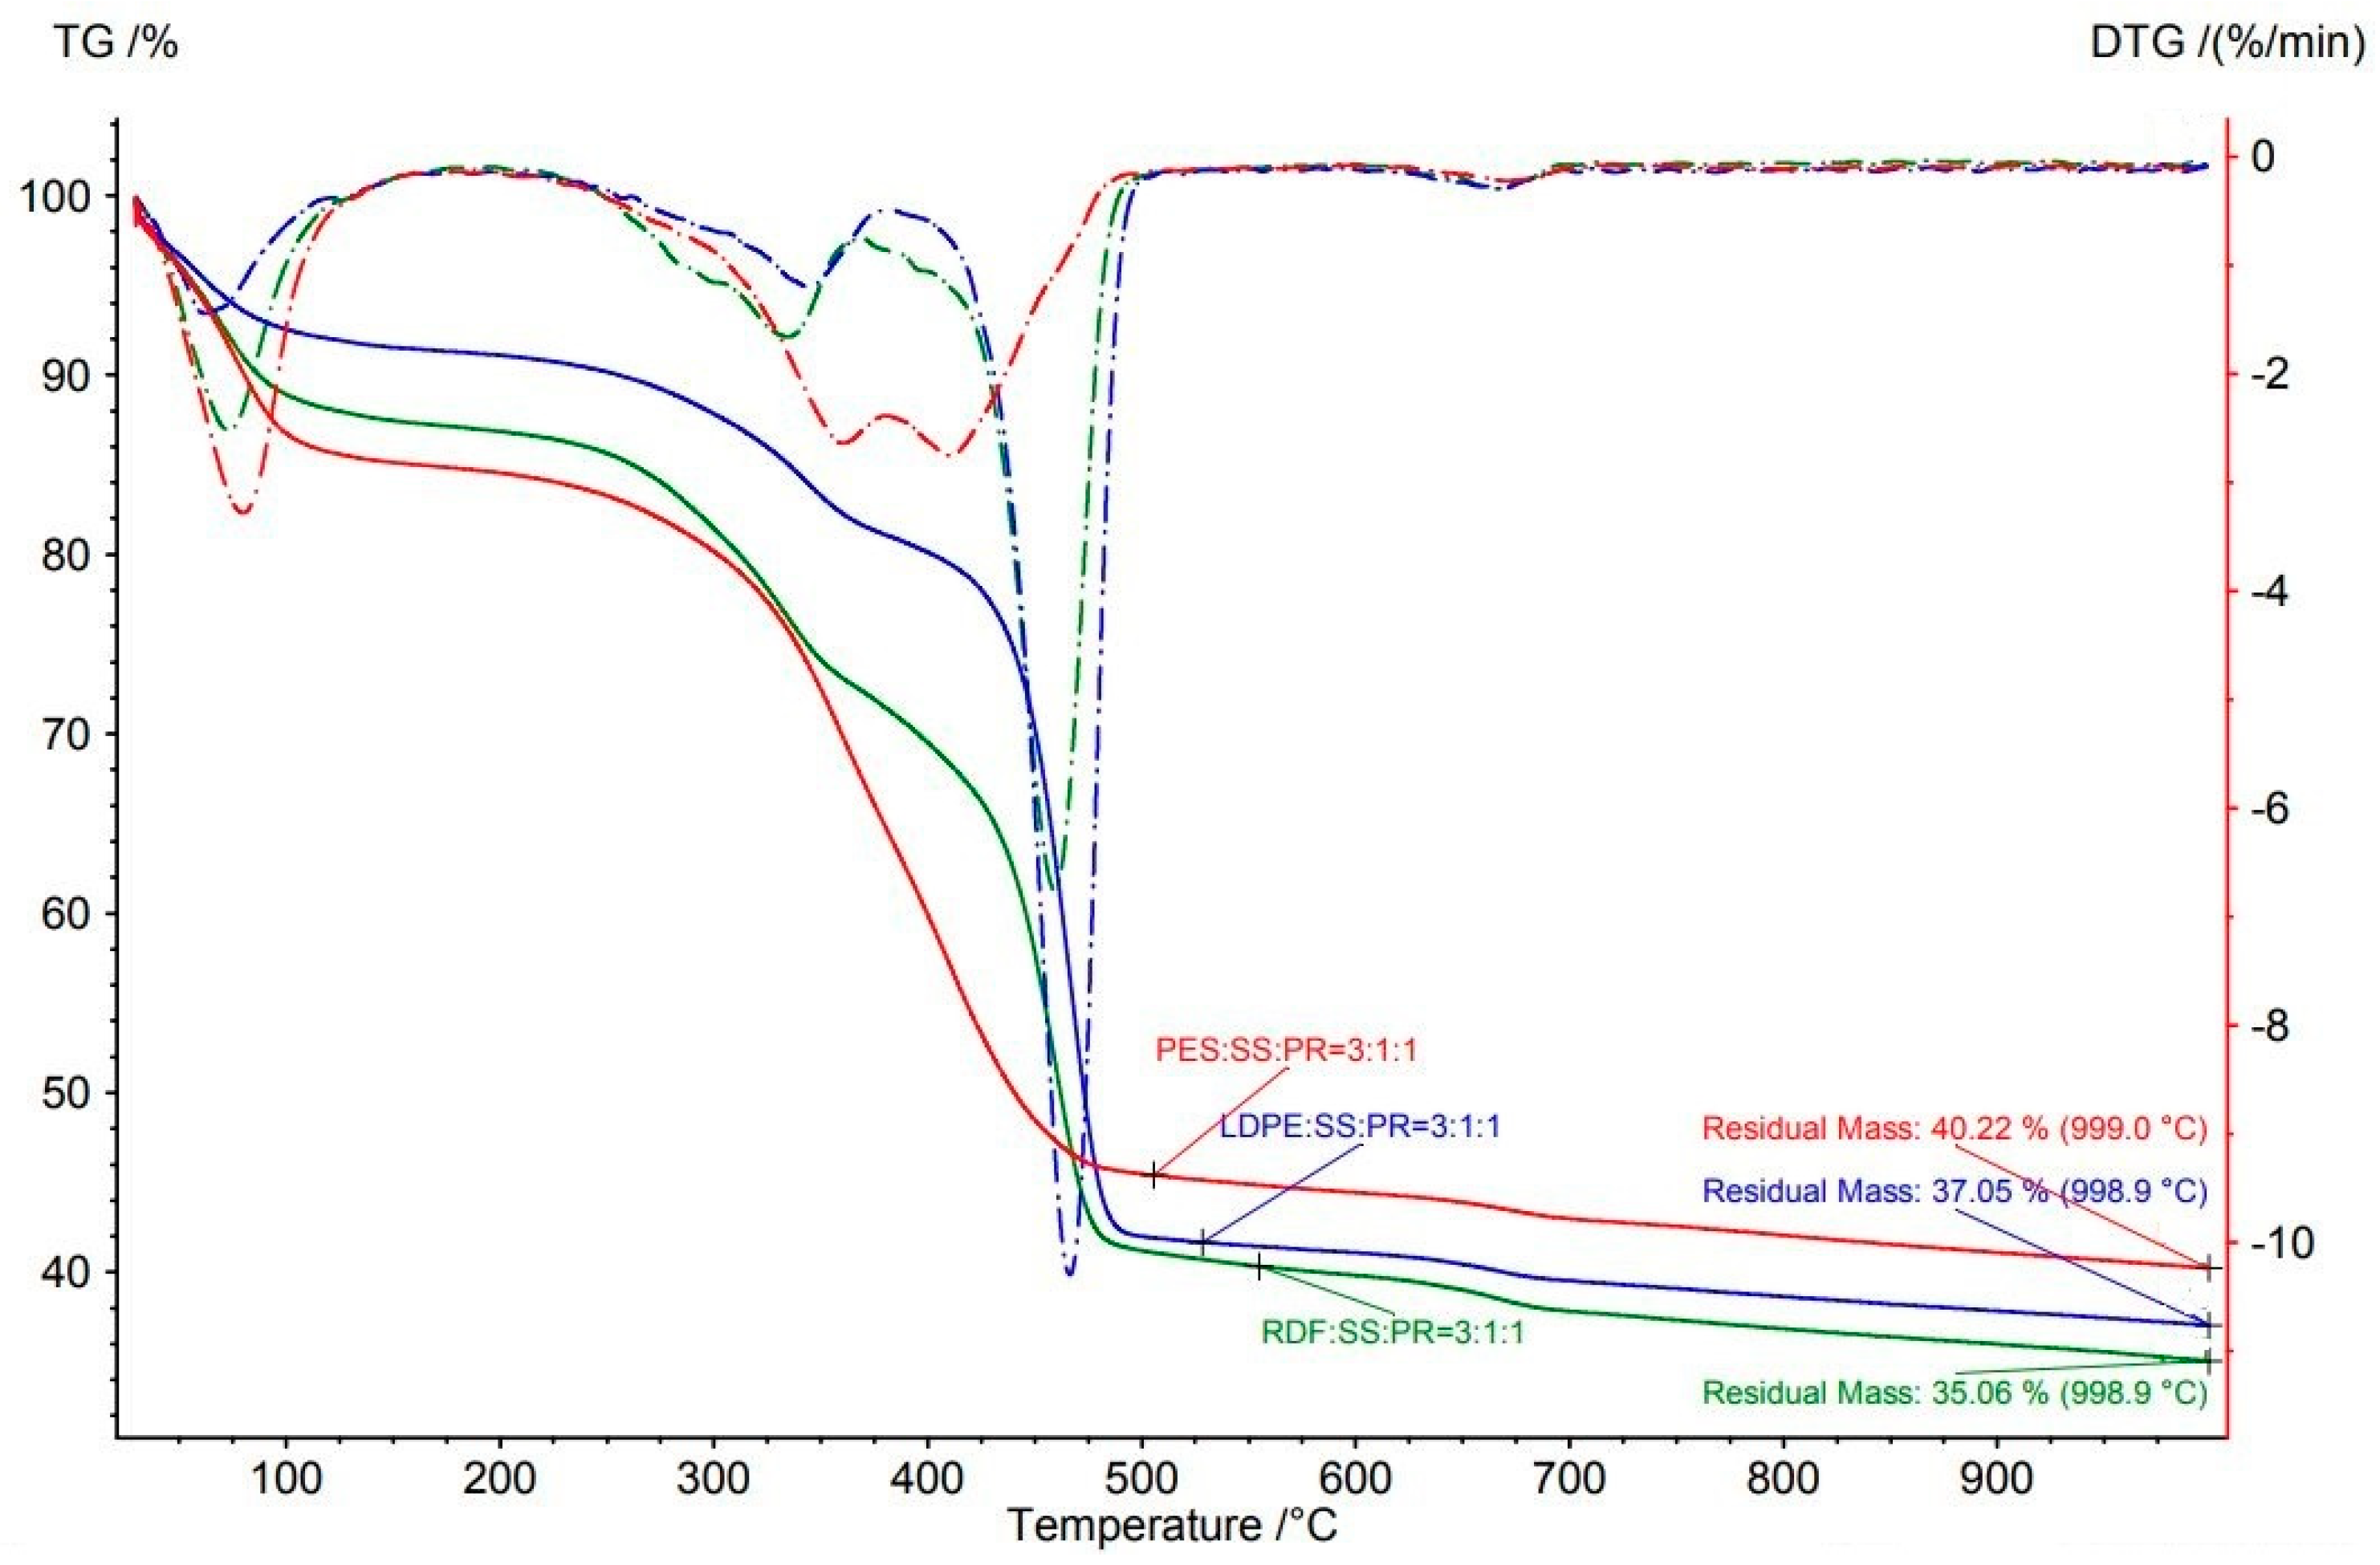
| RDF:SS:PR | 3:1:1 | 998.9 | 64.9 | 459.1 | 32.6 | 6.7 |
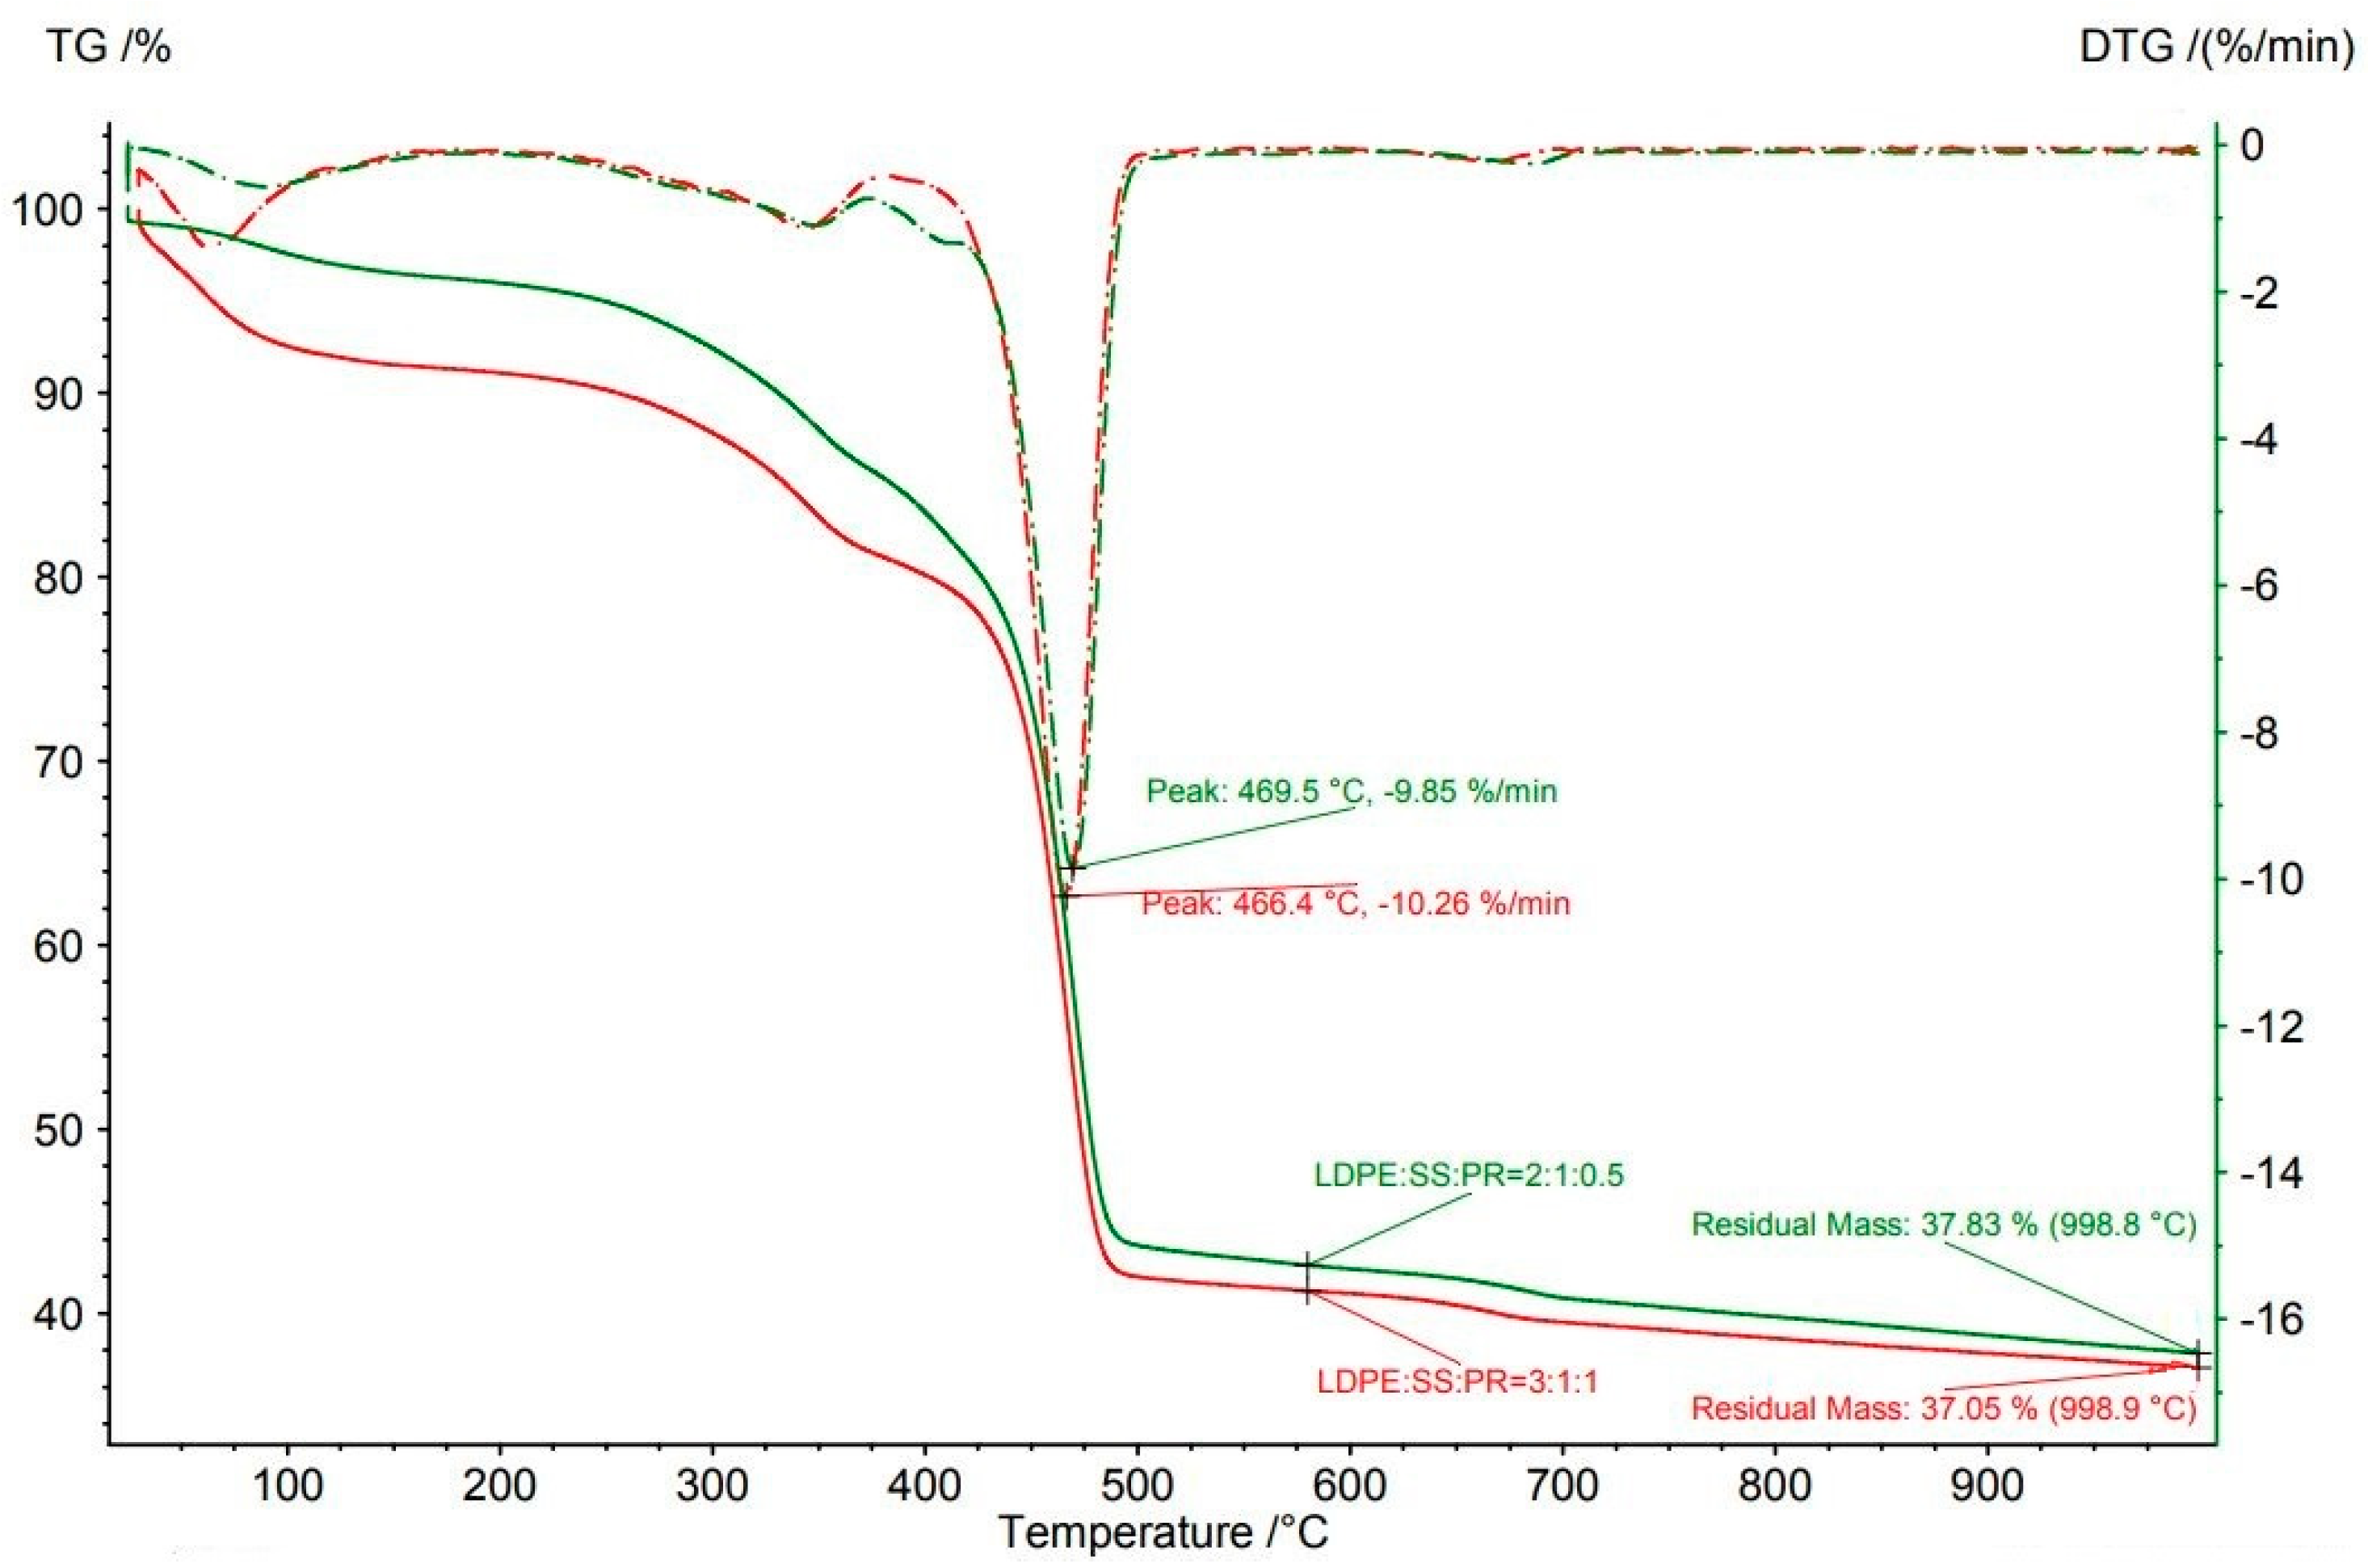
| LDPE:SS:PR | 3:1:1 | 998.9 | 63.0 | 466.4 | 39.4 | 10.3 |
| LDPE:SS:PR | 4:2:1 | 998.8 | 62.2 | 469.5 | 48.1 | 9.9 |
| PES:SS:PR | 3:1:1 | 999.0 | 59.8 | 360.6 * | 2.6 | |
| PES:SS:PR | 3:1:1 | 999.0 | 59.8 | 410.2 * | 39.7 | 2.7 |
| RDF:SS | 1.3:1 | 998.8 | 56.7 | 461.9 | 31.7 | 5.6 |
Publisher’s Note: MDPI stays neutral with regard to jurisdictional claims in published maps and institutional affiliations. |
© 2021 by the authors. Licensee MDPI, Basel, Switzerland. This article is an open access article distributed under the terms and conditions of the Creative Commons Attribution (CC BY) license (http://creativecommons.org/licenses/by/4.0/).
Share and Cite
Kubonova, L.; Janakova, I.; Malikova, P.; Drabinova, S.; Dej, M.; Smelik, R.; Skalny, P.; Heviankova, S. Evaluation of Waste Blends with Sewage Sludge as a Potential Material Input for Pyrolysis. Appl. Sci. 2021, 11, 1610. https://doi.org/10.3390/app11041610
Kubonova L, Janakova I, Malikova P, Drabinova S, Dej M, Smelik R, Skalny P, Heviankova S. Evaluation of Waste Blends with Sewage Sludge as a Potential Material Input for Pyrolysis. Applied Sciences. 2021; 11(4):1610. https://doi.org/10.3390/app11041610
Chicago/Turabian StyleKubonova, Lenka, Iva Janakova, Petra Malikova, Silvie Drabinova, Milan Dej, Roman Smelik, Pavel Skalny, and Silvie Heviankova. 2021. "Evaluation of Waste Blends with Sewage Sludge as a Potential Material Input for Pyrolysis" Applied Sciences 11, no. 4: 1610. https://doi.org/10.3390/app11041610
APA StyleKubonova, L., Janakova, I., Malikova, P., Drabinova, S., Dej, M., Smelik, R., Skalny, P., & Heviankova, S. (2021). Evaluation of Waste Blends with Sewage Sludge as a Potential Material Input for Pyrolysis. Applied Sciences, 11(4), 1610. https://doi.org/10.3390/app11041610