Article

Cyber Attack Detection Scheme for a Load Frequency Control System Based on Dual-Source Data of Compromised Variables

1
Key Laboratory of Measurement and Control of CSE, School of Automation, Southeast University, Nanjing 210096, China
2
School of Electrical and Power Engineering, China University of Mining and Technology, Xuzhou 221266, China
*
Author to whom correspondence should be addressed.
Appl. Sci. 2021, 11(4), 1584; https://doi.org/10.3390/app11041584
Submission received: 9 January 2021 / Revised: 3 February 2021 / Accepted: 7 February 2021 / Published: 10 February 2021

Abstract

:
Cyber attacks bring key challenges to the system reliability of load frequency control (LFC) systems. Attackers can compromise the measured data of critical variables of the LFC system, making the data received by the defender unreliable and resulting in system frequency fluctuation or even collapse. In this paper, to detect potential attacks on measured data, we propose a novel attack detection scheme using the dual-source data (DSD) of compromised variables. First, we study the characteristics of the compromised LFC system considering potentially vulnerable variables and different types of attack templates. Second, by designing a variable observer, the relationship between the known security variables and the variables which are at risk of being compromised in the LFC system is established. The features of the data obtained by the observer can reflect those of the true data. Third, a Siamese network (SN) is designed to quantify the distance between the characteristics of measured data and that of observed data. Finally, an attack detection scheme is designed by analyzing the similarity of the DSD. Simulation results verify the feasibility of the detection scheme studied in this paper.

1. Introduction

Power systems with high integration of information technologies are being challenged by increasing cyberhacking activities [1]. In December 2015, the Ukraine Electric Grid Hack caused almost 225,000 customers to lose power for at least 6 h [2]. During the incident, varieties of critical data of power systems were compromised by cyber attacks. As an essential component of the power system, the LFC system needs to utilize varieties of measured data to maintain the stability of system frequency. Sophisticated attackers can compromise the measured data by launching cyber attacks to force the load frequency controller to issue incorrect instructions, which can lead to unpredictable frequency fluctuation. Therefore, it is necessary to detect the compromised data as a first step to mitigate cyber attacks.
The two main types of cyber attacks against power systems are false data injection (FDI) attacks and denial of service (DoS) attacks [3]. In [4], Liu first studied false data injection attacks targeting static state estimation (SE). It is proved that the compromised data meeting certain rules can bypass bad data detection. It is difficult for defenders to judge whether the measured data are reliable. To protect power systems from FDI attacks, the defense strategies are studied from many aspects including impact of cyber attacks, detection schemes, and mitigation strategies. In [5], attack and defense mechanisms are discussed using the method of bad data detection. Detection method and mitigation strategy of cyber attacks on substation automation systems are studied in [6]. The impacts of cyber attacks on supervisory control and data acquisition (SCADA) systems are studied by considering different attack scenarios [7]. In [8], a dynamic state dynamics is introduced to achieve risk mitigation against FDI attacks. In [9], the isolation of FDI attacks for smart grids using state observer is studied. In [2], known-secured phasor measurement unit (PMU) measurement is used to detect malicious attacks on power grids. As for DoS attacks, the existing literature shows that the opening of communication channels can be used to achieve attacked targets [10,11,12]. DoS attacks can disrupt the data exchange in multi-area power systems and lead to packet losses directly. Compared with FDI attacks, DoS attacks can achieve the attacked target without maintaining concealment, which makes it important to study the mitigation strategies for DoS attacks. The strategies to suppress DoS attacks have been extensively studied. Adopting appropriate communication protocol and event-triggered control scheme can effectively mitigate the impacts of DoS attacks [13,14]. Compared to DoS attacks, FDI attacks could easily manipulate the normal actions of a control center by compromising the data of vulnerable variables.
Analysis of cyber attacks on a LFC system is different from that on other systems in power systems [15]. A LFC system, which depends on the dynamic evolution rather than general SE, is designed to maintain the active power balance of power system. As is discussed in [15], unlike static state estimation, which estimate the state of power systems once every five minutes based on the ISO/RTO standard, the control center of LFC system should generate command data once every five seconds. As a result, it is difficult for a detection scheme of cyber attacks on a LFC system to benefit from current SE-based attack detection schemes. Ref. [15] proposes FDI attack templates matching the features of load frequency control system and evaluates the attack impact from aspects in frequency fluctuation and financial settlement. In [16], the model of optimal FDI attacks on the sensors of a LFC system is proposed to guide the defense of sensor data. In [17], authors introduce a priori knowledge of FDI attacks for studying more targeted detection methods, by analyzing four attack strategies targeting frequency collapse. Considering the concealment of the FDI attack and the accuracy of the attack detection, an optimal defense strategy is studied using game theory model [18]. Ref. [3] proposes an event-triggering control strategy to mitigate the impacts of cyber attacks on a LFC. Ref. [19] proposes the resilient load frequency control considering cyber attacks and communication delay.
Detection methods of cyber attacks against LFC systems should focus on dynamic features in vulnerable variables. In current literature, designing observers and using machine learning algorithms are two important methods to extract the dynamic features of variables [20,21,22]. In [23], the disturbance of active power is tracked using a second-order sliding mode in an LFC system. In [24], the fault signals in the LFC system are observed using the sliding mode observer.
The existing methods for detecting FDI attacks on LFC systems have the following defects:
(1) The current data-driven methods are not sufficient to detect attacks in specific conditions. The features of historical operation data are exploited based on data in multiple operating conditions. Attackers can inject false data with the features of historical data in the LFC system. For example, in one operating condition, attackers can use historical data to generate attack signals that satisfy the features of the variables in other conditions.
(2) Due to the communication delay and noise, there exists a difference between the observed data and the true data. Defenders cannot set the reasonable threshold of the difference. Improper setting of threshold will lead to misjudgment.
Considering that the attacker is compromising the relationship between measured data and true data, we propose a detection scheme for FDI attacks on a load frequency control system based on dual-source data of compromised variables. Different from the methods of learning the features of historical data, we measure the relationship between observed data and measured data. The relationship between the two includes the difference caused by communication delay and noise.
The main contributions of the paper are three fold:
(1) The attack detection scheme using dual-source data of compromised variables in an LFC system is proposed. Dual-source data can be used as a basis for defenders to detect false data injection attacks.
(2) Based on known-secure variables in an LFC system, an observer of tie-line power is designed considering uncertainties parameters in the LFC system. With this observer, defenders can obtain dual-source data (the observed data and the measured data) to assess whether the system is compromised.
(3) Considering the communication delay and noise of the dual-source data in the process of transmission to the defense center, the Siamese network is used to quantify the similarity of the dual-source data.
The remainder of this paper is organized as follows: in Section 2, the dynamic modeling of a compromised load frequency control system is studied. In Section 3, we design an observer for detecting tie-line power considering uncertainties in an LFC system. The FDI attack detection for the LFC system is designed in Section 4. In Section 5, simulation and analysis are carried out. Finally, Section 6 states conclusions.

2. Modeling of Compromised LFC System and False Data Injection Attacks

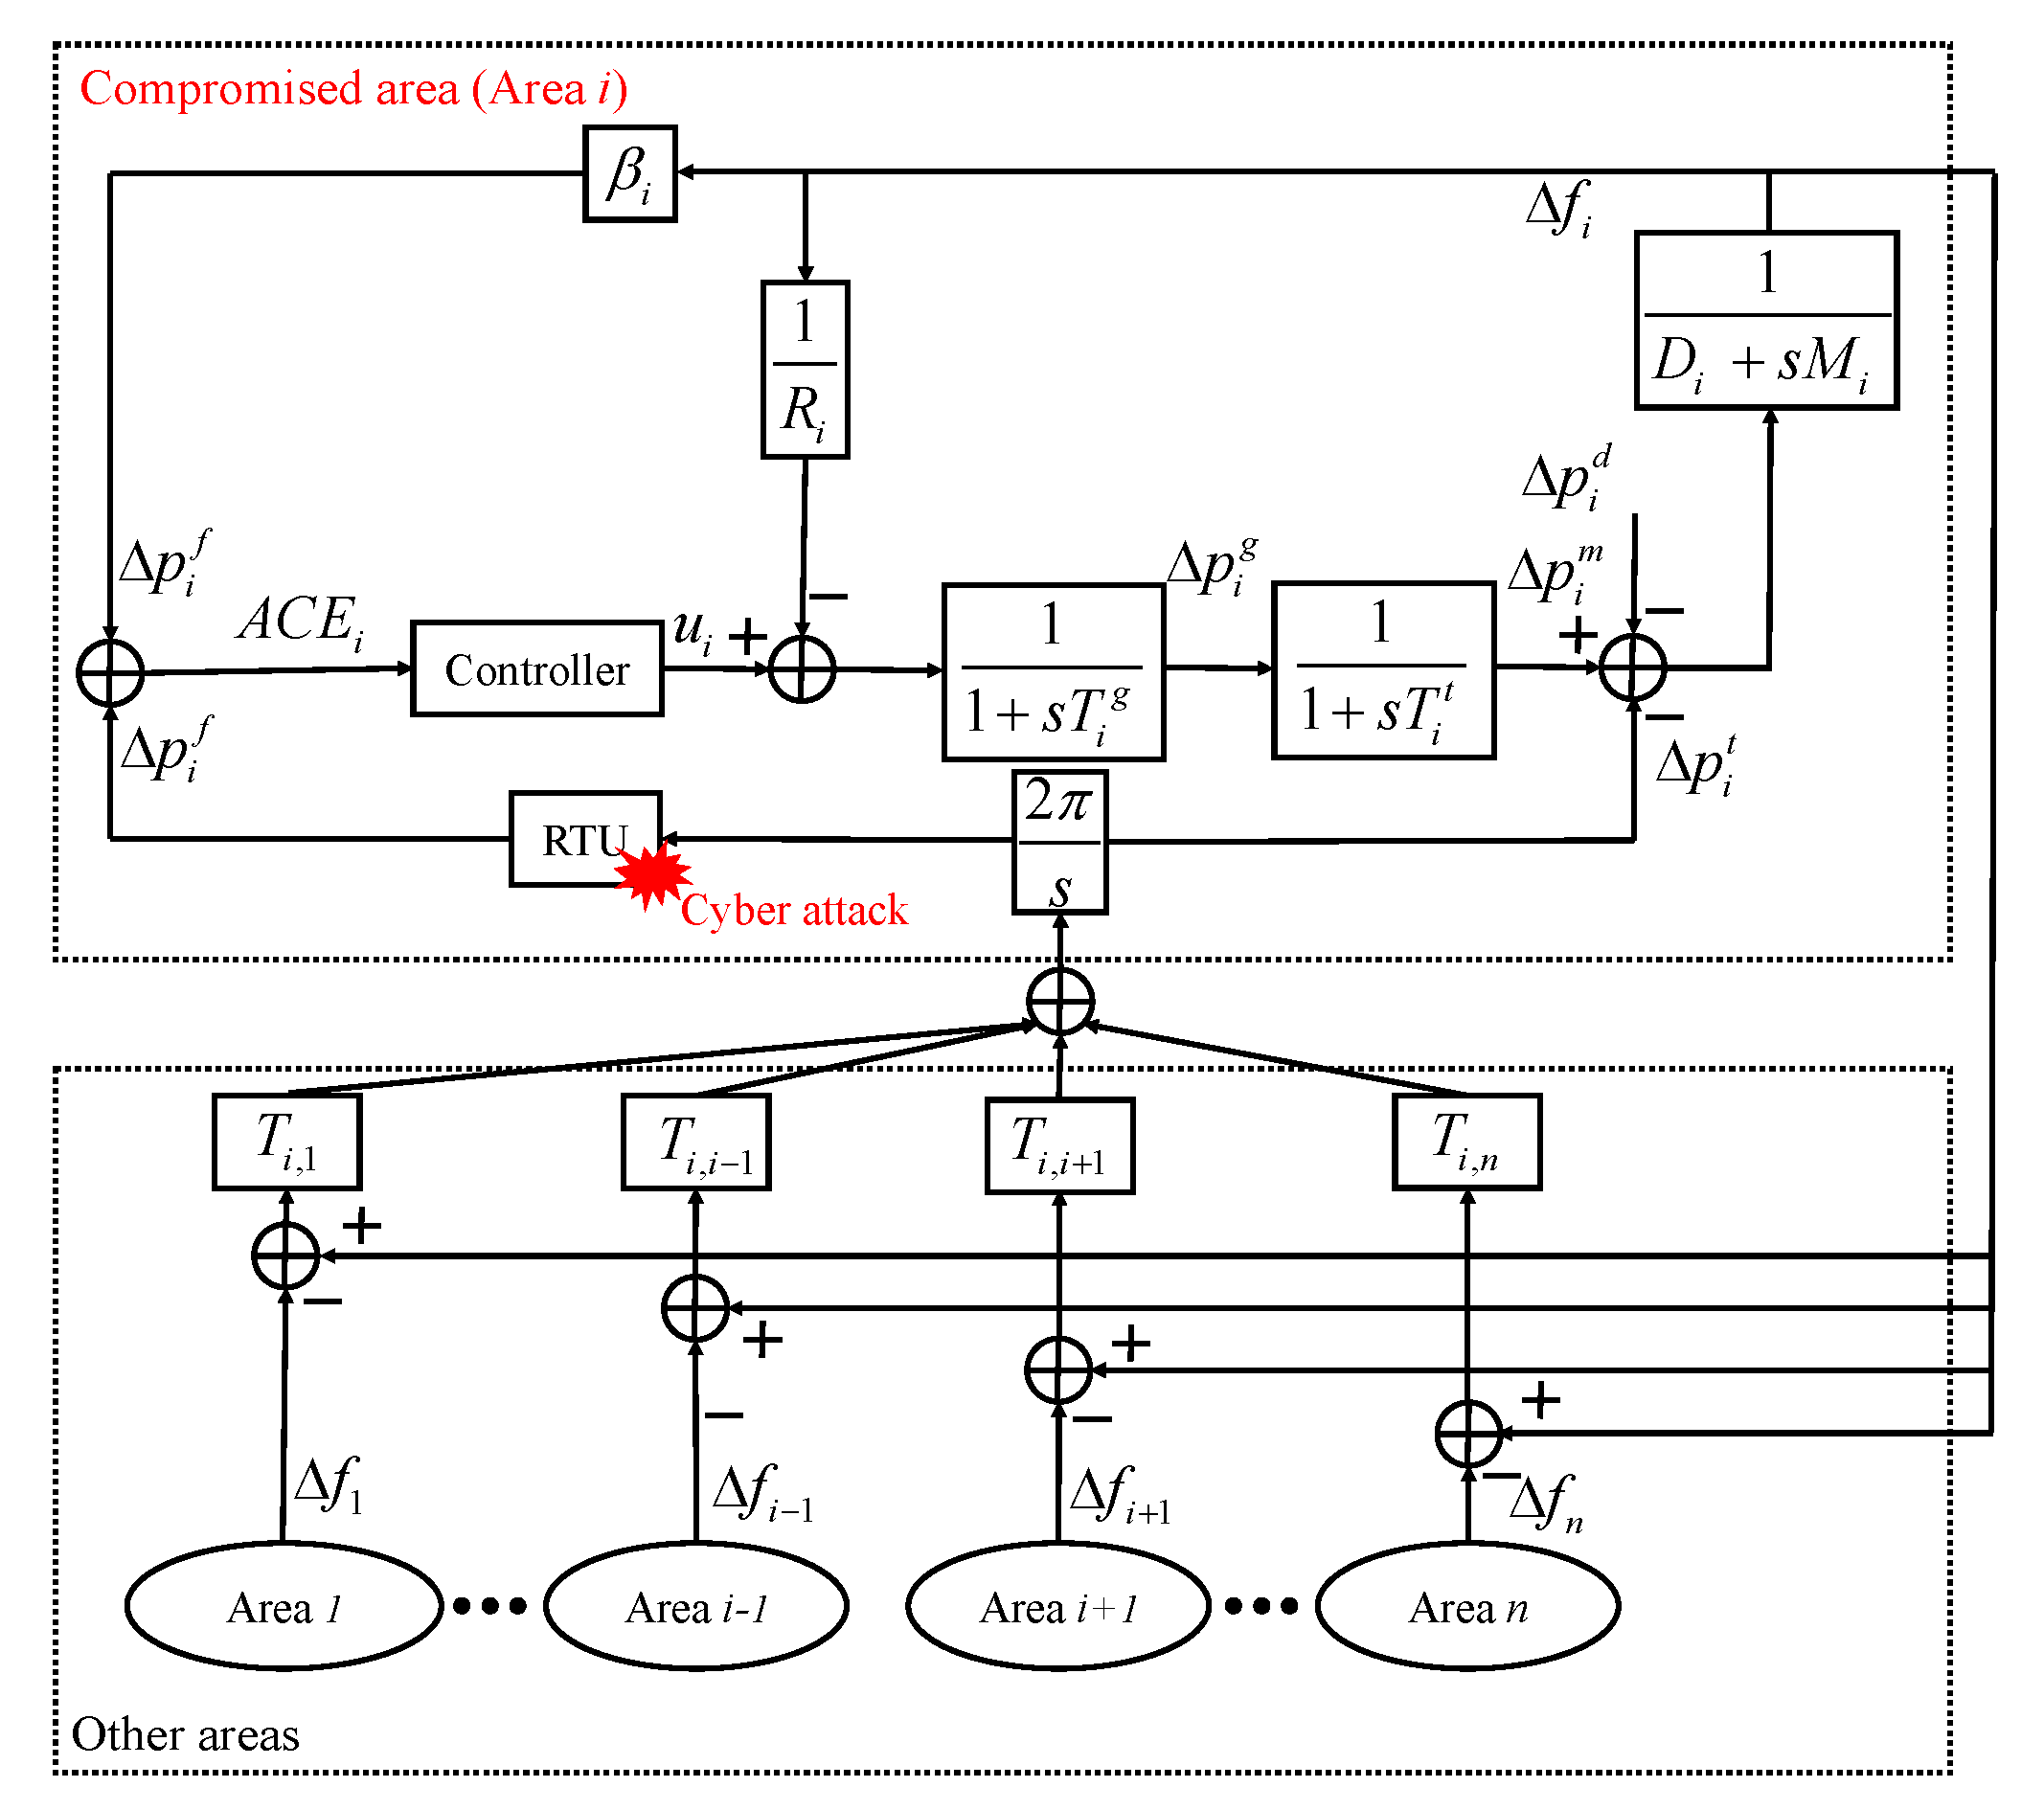
2.1. Basics of a Compromised LFC System

The diagram of a typical multi-area LFC system is depicted in Figure 1. The system consists of n areas. The attacker randomly selects one area (Area i ) to launch cyber attacks. Other normal areas are represented by area ( j ( j = 1 , , i 1 , i + 1 , , n ) ). The attack target is the remote terminal unit (RTU) of the compromised area. RTU is used to collect tie-line power data. Since RTU is compromised, tie-line data cannot be correctly transmitted to the control center, so that area control error (ACE) cannot be correctly calculated. Through the proportion integral differential (PID) controller, the wrong ACE signals produce the wrong control command. Based on the relationships between control command and active power (the relationships are represented by the transfer functions in Figure 1), incorrect control command could lead to power imbalance. Then, power imbalance leads to the fluctuation of system frequency, which endangers the stability of the power system.
The dynamic model of the compromised system is:
x i ˙ ( t ) = ( A i + Δ A i ( t ) ) x i ( t ) + ( B i + Δ B i ( t ) ) u i ( t ) + E i j Δ f j ( t ) + F i Δ P i d y i ( t ) = C i x i ( t ) + G i ω i ( t )
where
x i = [ Δ P i g Δ P i m Δ f i Δ P i t ] T
y i = Δ p i f
with
A i = 1 T i g 0 1 R i T i g 0 1 T i t 1 T i t 0 0 0 1 M i D i M i 1 M i 0 0 2 π j = 1 , j i n T i j 0
B i = 1 T i g 0 0 0 , E i j = 0 0 0 2 π j = 1 , j i n T i j , F i = 0 0 1 M i 0
C i = 0 0 β i 0
where Δ P i g and Δ P i m represent the deviation of the governor valve position and the generator output power, respectively; β i represents the frequency bias coefficient; Δ f i represents the deviation of frequency. Δ P i t and Δ P i d represent the deviation of the tie-line power and the load fluctuation, respectively; D i , R i , and M i represent the generator unit damping coefficient, the speed drop, and the inertia of the synchronous machine, respectively; T i j is the synchronizing coefficient between area i and area j; T i t and T i g represent the time constants of the turbine and the governor, respectively; G i is a constant known matrix representing the distribution matrix of the bounded measurement noise ω i ( t ) . Notice that the generating units are transformed into an equivalent unit in order to reduce the model complexity. A model fitting method can be used to transform the multi-unit into an equivalent unit. The details of the model fitting are given in [25] and omitted here due to space limitations. The time-varying uncertainties of A i and B i satisfy
Δ A i ( t ) = Φ σ ( t ) Ψ a
Δ B i ( t ) = Φ σ ( t ) Ψ b
σ ( t ) T σ ( t ) I
where Φ , Ψ a , and Ψ b are the distribution matrix of the variation vector σ ( t ) . In this paper, we only focus on the situations in which ( A i + Δ A i ( t ) ) is asymptotically stable.
Based on the area control error (ACE), the commands of the Area i of the LFC system are generated using the following equation:
u i = K P i A C E i K I i A C E i
A C E i = Δ p i f + Δ P i t m
where K P i and K I i are the proportional and integral gains of the controller, respectively; Δ P i t m represents the measured data uploaded by the RTU of tie-line power; and Δ p i f represents the data of the equivalent active power deviation caused by f i . Attackers can mislead the controller by compromising the input data of the ACE. Considering the fact that the compromised Δ p i f can be rapidly detected by cross-checking the data with other normal ones, we only focus on FDI attacks on Δ P i t m in this paper.

2.2. Attack Templates of FDI Attacks on LFC

In this subsection, we discuss different types of false data injection attack on an LFC system. The typical fixed FDI attacks can be categorized into two types: [17]:
  • Exogenous attack:
    Δ P i t m = Δ P i t + D p
    where D p represents the value of the data injection added to the measurements of tie-line power.
  • Scaling attack:
    Δ P i t m = K p Δ P i t
    where K p is the scaling attack parameter.
Due to the fixed parameters of typical FDI attacks, the features of compromised data can be exploited. Based on the classifier, defenders can distinguish the compromised data from the normal ones. In fact, sophisticated attackers can adjust injection parameters flexibly to achieve attack targets. In this paper, we further study flexible FDI attacks on Δ P i t m , which can be written as:
Δ P i t m = k p ( t ) Δ P i t + d p ( t )
where k p ( t ) and d p ( t ) are time-varying variables. By launching the proposed FDI attacks, the attacker can tamper the data of Δ P i t m in the current operating condition into the false data with characteristics of real data in other operating situations. Thus, the controller can be misled to issue control commands that are not applicable to the current operating situation. It is necessary to relate the true data of tie-line power to accessible known-secured variables under the current operating situation.

3. Design of an Observer for Detecting Tie-Line Power Considering Uncertainties

In this section, an observer is designed to detect tie-line power based on accessible known-secured variables. Since system frequency is a global variable, the frequency of each position in the area is the same. When the attackers compromise the frequency measurement device in one place, the defender can cross verify the frequency measurement value in other places. Therefore, we utilize the system frequency as a known-secured variable and establish the following observer:
z ˙ i = W i z i + T i B i u i + T i E i j Δ f j + Y i y i x ^ i = z i + N i y i
where z represents the state vector of the dynamic system (10); x i ^ represents the observation of x i ; and W i , T i , Y i and N i are the gain matrices with appropriate dimensions.
Let e = x i x i ^ , and using the output equation in (10), we have
e = x i x ^ i = x i z i N i C i x i N i G i ω i = ( I n N i C i ) x i z i N i G i ω i
Using (1), (10), and (11), we can derive
e ˙ = ( I n N i C i ) x ˙ i z ˙ i N i G i ω ˙ i = ( I n N i C i ) ( A i x i + B i u i + E i j Δ f j + F i Δ P i d ) + ( I n N i C i ) Δ A i x i + Δ B i u i W i z i + T i B i u i + T i E i j Δ f j + ( Y i 1 + Y i 2 ) y i N i G i ω ˙ i = ( A i N i C i A i ) x i Y i 1 C i x i W i z i Y i 2 y i + ( I n N i C i ) B i T i B i u i + ( I n N i C i ) E i j T i E i j Δ f j + ( I n N i C i ) F i Δ P i d Y i 1 G i ω i N i G i ω ˙ i + ( I n N i C i ) Δ A i x i + Δ B i u i
where Y i = Y i 1 + Y i 2 ; I n is an n-dimensional identity matrix.
Considering that x i = e + x ^ i = e + z i + N i y i , (12) can be expressed as
e ˙ = ( A i N i C i A i Y i 1 C i ) e + ( A i N i C i A i Y i 1 C i W i ) z i + [ ( A i N i C i A i Y i 1 C i ) N i Y i 2 ] y i + [ ( I n N i C i ) B i T i B i ] u i + [ ( I n N i C i ) E i j T i E i j ] Δ f j + ( I n N i C i ) F i Δ P i d Y i 1 G i ω i N i G i ω ˙ i + ( I n N i C i ) Δ A i x i + Δ B i u i
If the following relationships can be held:
Ξ i = ( I n N i C i )
W i = I n N i C i A i Y i 1 C i
( I n N i C i ) F i = 0
( I n N i C i ) = T i
Y i 2 = ( ( I n N i C i ) A i Y i 1 C i ) N i
we can derive the following observation error:
e ˙ = I n N i C i A i Y i 1 C i e + 0 · z i + 0 · y i + 0 · B i u i + 0 · E i j Δ f j + 0 · Δ P i d Y i 1 G i ω i N i G i ω ˙ i + ( I n N i C i ) Δ A i x i + Δ B i u i = ( Ξ i A i Y i 1 C i ) e Y i 1 G i ω i N G i ω ˙ i + Ξ i Δ A i x + Ξ i Δ B i u i
Based on the theory proposed in [26], the necessary and sufficient conditions for the existence of the observer are as follows: (1) rank ( C i F i ) = rank( F i ). The special solution is N i s = F i [ ( C i F i ) T ( C i F i ) ] 1 ( C i F i ) T . (2) ( C i , Ξ i A i ) is a detectable pair.
Theorem 1.
There exists a sub-optimal robust observer for the LFC system discussed in this paper when the following two conditions are satisfied:
(1) There exists γ > 0 such that
sup α 0 e α < γ
where α = [ u i T ω i T ω ˙ i T Δ f j Δ P i d ] T .
(2) There exists a positive definite matrix P and Q, such that
Γ 11 0 Γ 13 0 0 Γ 16 Γ 17 Γ 22 0 Γ 24 Γ 25 0 0 Γ 33 0 0 0 0 Γ 44 0 0 0 Γ 55 0 0 Γ 66 0 Γ 77 < 0
where
Γ 11 = P A i + A i T P + 2 δ a Ψ a T Ψ a + δ a 1 P Φ Φ T P + δ b 1 P Φ Φ T P
Γ 22 = Q ( Ξ i A i Y i 1 C i ) + ( Ξ i A i Y i 1 C i ) T Q + I + δ a 1 Q ( Ξ i Φ ) ( Ξ i Φ ) T Q + δ b 1 Q ( Ξ i Φ ) ( Ξ i Φ ) T Q
Γ 33 = γ 2 I + 2 δ b Ψ b T Ψ b
Γ 44 = Γ 55 = Γ 66 = Γ 77 = γ 2 I
Γ 13 = P B i , Γ 16 = P E i j , Γ 17 = P F i
Γ 24 = Q Y i 1 G i , Γ 25 = Q N i G i , δ a > 0 , δ b > 0
Proof. 
Taking the following Lyapunov function:
V ( t ) = x i T ( t ) P x i ( t ) + e T ( t ) Q e ( t )
Using (1)–(4), (19) and (22), we can derive
V ˙ = x i T ( P A i + A i T P ) x i + 2 x i T P B i u i + 2 x i T P E i j Δ f j + 2 x i T P F i Δ P i d 2 e T Q Y i 1 G i ω i 2 e T Q N i G i ω ˙ i + e T ( Q ( Ξ i A i Y i 1 C i ) + ( Ξ i A i Y i 1 C i ) T Q ) e + 2 x i T P Φ σ Ψ a u i + 2 x i T P Φ σ Ψ b u i + 2 e T Q Ξ i Φ σ Ψ a x i + 2 e T Q Ξ i Φ σ Ψ b u i x i T ( P A i + A i T P ) x i + 2 x i T P B i u i + 2 x i T P E i j Δ f j + 2 x i T P F i Δ P i d 2 e T Q Y i 1 G i ω i 2 e T Q N i G i ω ˙ i + e T ( Q ( Ξ i A i Y i 1 C i ) + ( Ξ i A i Y i 1 C i ) T Q ) e + δ a 1 x i T P Φ Φ T P x i + δ a 1 x i T Ψ a T Ψ a x i + δ b 1 x i T P Φ Φ T P x i + δ b 1 u i T Ψ b T Ψ b u i + δ a 1 e T Q ( Ξ Φ ) ( Ξ Φ ) T Q e + δ a 1 x i T Ψ a T Ψ a x i + δ b 1 e T Q ( Ξ Φ ) ( Ξ Φ ) T Q e + δ b 1 u i T Ψ b T Ψ b u i
where δ a and δ b are positive scalars.
Letting β = [ x i e α T ] T , we can derive:
V ˙ β T Γ β + γ 2 α T α e T e
where
Γ = Γ 11 0 Γ 13 0 0 Γ 16 Γ 17 Γ 22 0 Γ 24 Γ 25 0 0 Γ 33 0 0 0 0 Γ 44 0 0 0 Γ 55 0 0 Γ 66 0 Γ 77
If the aforementioned two requirements are satisfied, the system satisfies the Lyapunov stability criteria. The proof is completed. □
Based on the proposed observer, we can derive the observation value Δ p i t o of the tie-line power Δ P i t . Considering uncertain communication delay and noise in the process of transmission to the defense center, there is deviation between the measured data and the observed data received by the defender, which can be written as
d i f f ( t ) = Δ P i t m ( t ) Δ P i t d ( t ) = Δ P i t m ( t ) ( Δ P i t o ( t τ ) + N d ( t τ ) )
where d i f f ( t ) represents the deviation between the measured data and the observed data; Δ P i t d ( t ) is the observed data received by defender; τ is the communication delay; and N d ( t ) is the communication noise. This deviation also exists when the system is not compromised. Defenders cannot judge if this deviation is caused by the observer or the FDI attacks. Therefore, the similarity between the observed and real data should be further considered before applying the observed data for attack detection. In the next section, the similarity is studied.

4. Siamese-Network-Based Attack Detection for FDI Attacks on LFC

Considering the communication delay and noise, the proposed attack detection scheme is realized by comparing the signal similarity between the observed data and the measured data. In this section, a Siamese network is adopted to extract features for the similarity between measured data and observed data.

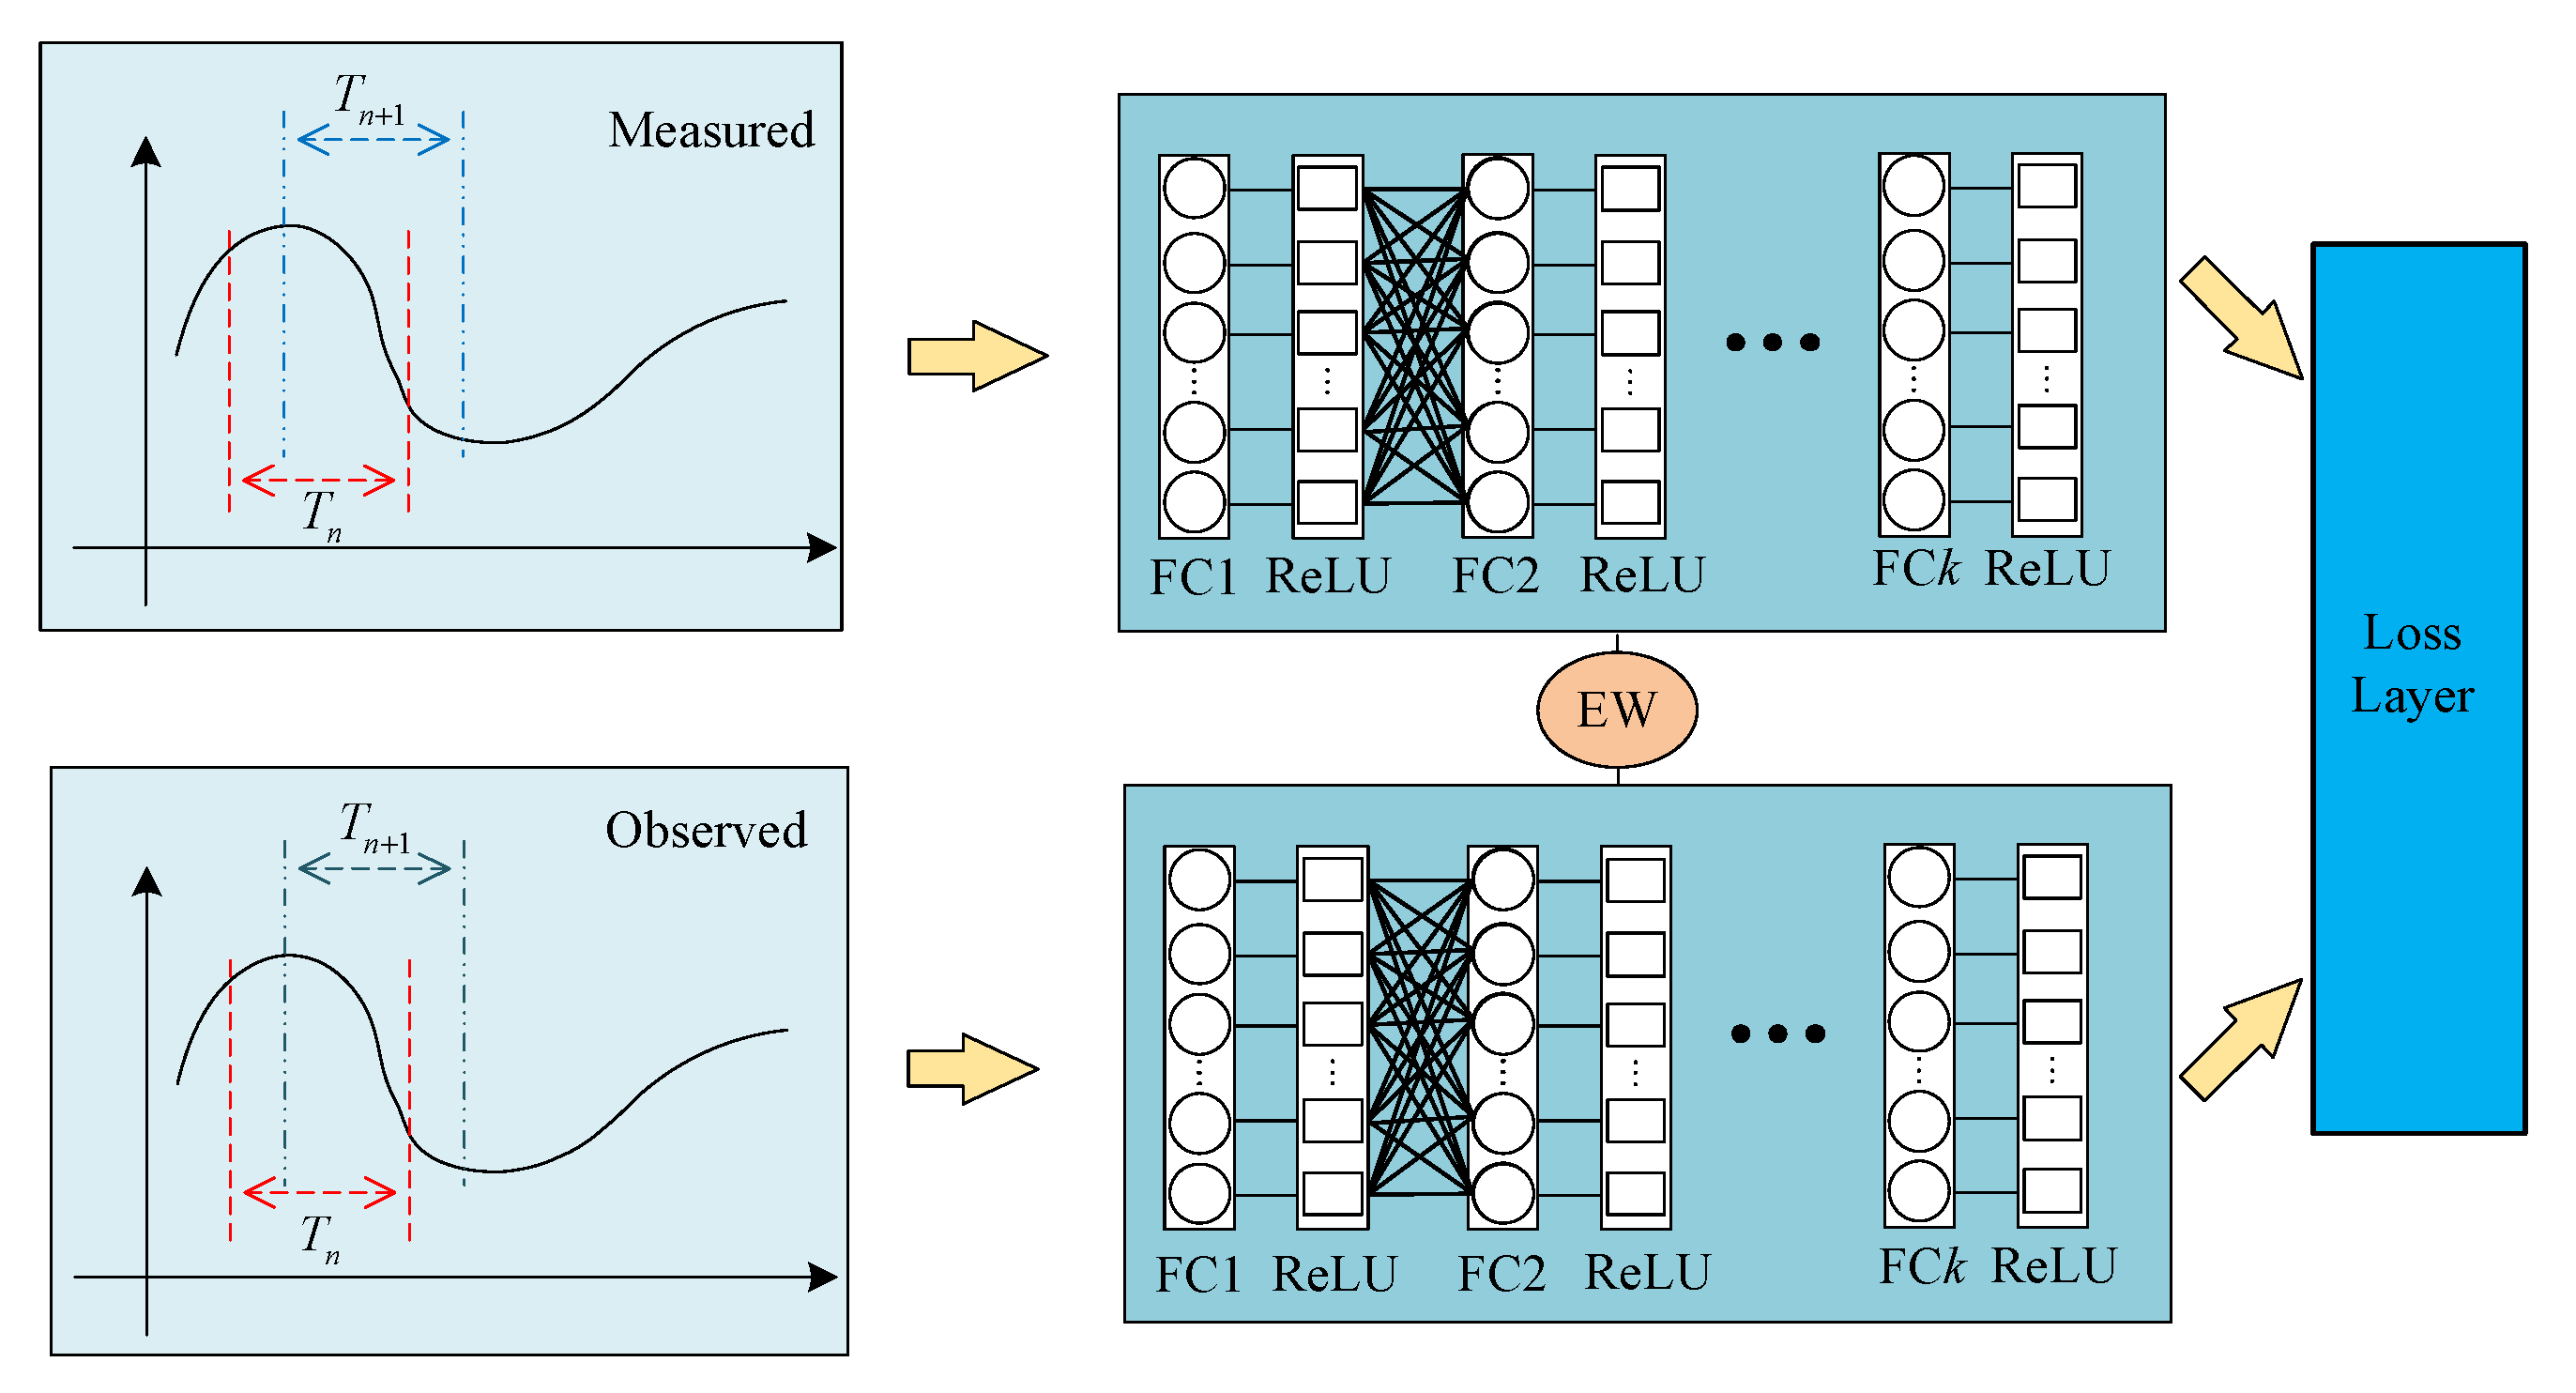
4.1. Network Structure

The structure of the proposed Siamese network for attack detection is depicted in Figure 2.
The Siamese network consists of two symmetrical branches that share equal weights (EW). Sharing equal weights can effectively reduce the training parameters in the training process. The structure of each branch consists of four full connect (FC) layers and rectified linear units (ReLUs). The function of FC layers is to map the original data to the hidden layer feature space. The output produced by the FC layer is the hidden feature of the sample data. We use many neurons to fit the features of the input data. Generally, single-layer FC does not have the ability of nonlinear expression. Therefore, we increase the number of layers of FC to enhance its nonlinear expression ability. In each FC layer, the number of elements is equal to the dimension of sample data. The ReLUs, which can alleviate the over fitting problem of the Siamese network, are defined as
f ( a ) = max ( 0 , a )
After that, the input data (measured data and observed data) are transformed into two sets of feature vectors. Then, the two sets of vectors are transmitted to the loss layer to quantify the distance.
We input the observed data and the true data into the Siamese network as the input pair. When it is a positive sample, the calculated distance of the input pair should be smaller than that of the negative input pair. Due to the equal weights and ReLUs, the features caused by communication delay and noise can be mitigated during the training process.

4.2. Cluster-Based Loss Function

The loss function in the loss layer is designed to calculate the distance between the features of the observed data and that of the measured data. The distance can be further output as positive label or negative label through binary constraints. The distance with a positive label represents the similarity of the positive pairs (observed data and normal data). The distance with negative label represents the similarity of the negative pairs (observed data and compromised data). The distance between observed data and normal data should be less than that between observed data and compromised data, which can be written as:
d ( a o , a n ) d ( a o , a c )
where a o is the observed data; a n is the normal data; and a c is the compromised data. Therefore, differences lie in the positive pairs and the negative pairs should be fully exploited in the loss function.
Therefore, differences lie in the positive pairs (observed data and normal data) and the negative pairs (observed data and compromised data) should be fully exploited in the loss function. Notice that the observed data and normal data are usually highly correlated when the load disturbance occurs, which makes it possible to cluster the positive pairs. In this paper, we focus on the cluster of positive pairs when designing the loss function. The proposed cluster-based loss function aims to encourage the features in positive pairs to be close and push the ones in negative pairs far away. The cluster center of the positive data can be defined as:
C c = 1 M m = 1 M f ( a m n )
where M is the number of the normal samples; f ( a m n ) is the vector output from the FC layers.
Considering that the parameters of the injection data are flexible, it is difficult for the input samples to cover the characteristics of all types of injection data. In the proposed cluster-based loss function, a concentric-circles model is used to improve the ability to detect the unknown type of injection data. Two margins between positive pairs and negative pairs are used: ξ m i n is used to increase the distance between different types of pairs, and ξ m a x is used to make positive pairs more compact. The loss function can be defined as:
L = m = 1 M ( L 1 + L 2 )
where
L 1 = 1 2 max { 0 , f ( a F n ) C c 2 2 f ( a m c ) C c 2 2 + ξ m a x }
L 2 = 1 2 max { 0 , f ( a m n ) C c 2 2 ξ m i n }
where f ( a F n ) represents the farthest normal data of tie-line power. It can be learned that L 1 is used to measure the distance of negative pairs and positive pairs. If L 1 0 , the distance of negative pairs is far enough to positive pairs. L 2 is used to measure the distance of positive pairs and the cluster center. If L 2 0 , the distance of positive pairs is close enough to the cluster center. When L 1 0 , L 2 0 , negative pairs can be effectively separated from positive pairs.
Intuitively, L 1 > 0 or L 2 > 0 means that the function (28) is not satisfied and a positive loss value is generated. Then, the following gradient equations are used to guide the training direction in the process of training. That is to say, these equations are used to guide L 1 , L 2 from ( L 1 > 0 o r L 2 > 0 ) to ( L 1 0 , L 2 0 ) . The gradient of the positive pairs G n can be expressed as
G n = L 2 f ( a m n ) = f ( a m n ) C c
The gradient of the positive pairs G c can be expressed as
G c = L 1 f ( a m c ) = C c f ( a F n )
The gradient of the positive pairs G F can be expressed as
G F = L 1 f ( a F n ) = f ( a F n ) C c

4.3. Attack Detection Scheme for FDI Attacks on LFC

The procedures of the attack detection scheme are as follows:
  • Step 1: Generate the training data set. Load the historical tie-line power data under different operating conditions as the normal data. Based on (7)–(9), the data set of compromised tie-line power data can be generated using the method proposed in Section 3.
  • Step 2: Transfer the training data in the form of data pairs to the Siamese network for training.
  • Step 3: Using the high dimensional features obtained by FC layers to calculate the similarity between observed data and measured data. Loss function is used to make positive pairs compact and negative pairs far away from the positive pairs.
  • Step 4: Sample the incoming data pair, which could be compromised potentially or normal load disturbance. By checking the high dimensional features of the data pairs, the status of the RTU for tie-line power can be identified.

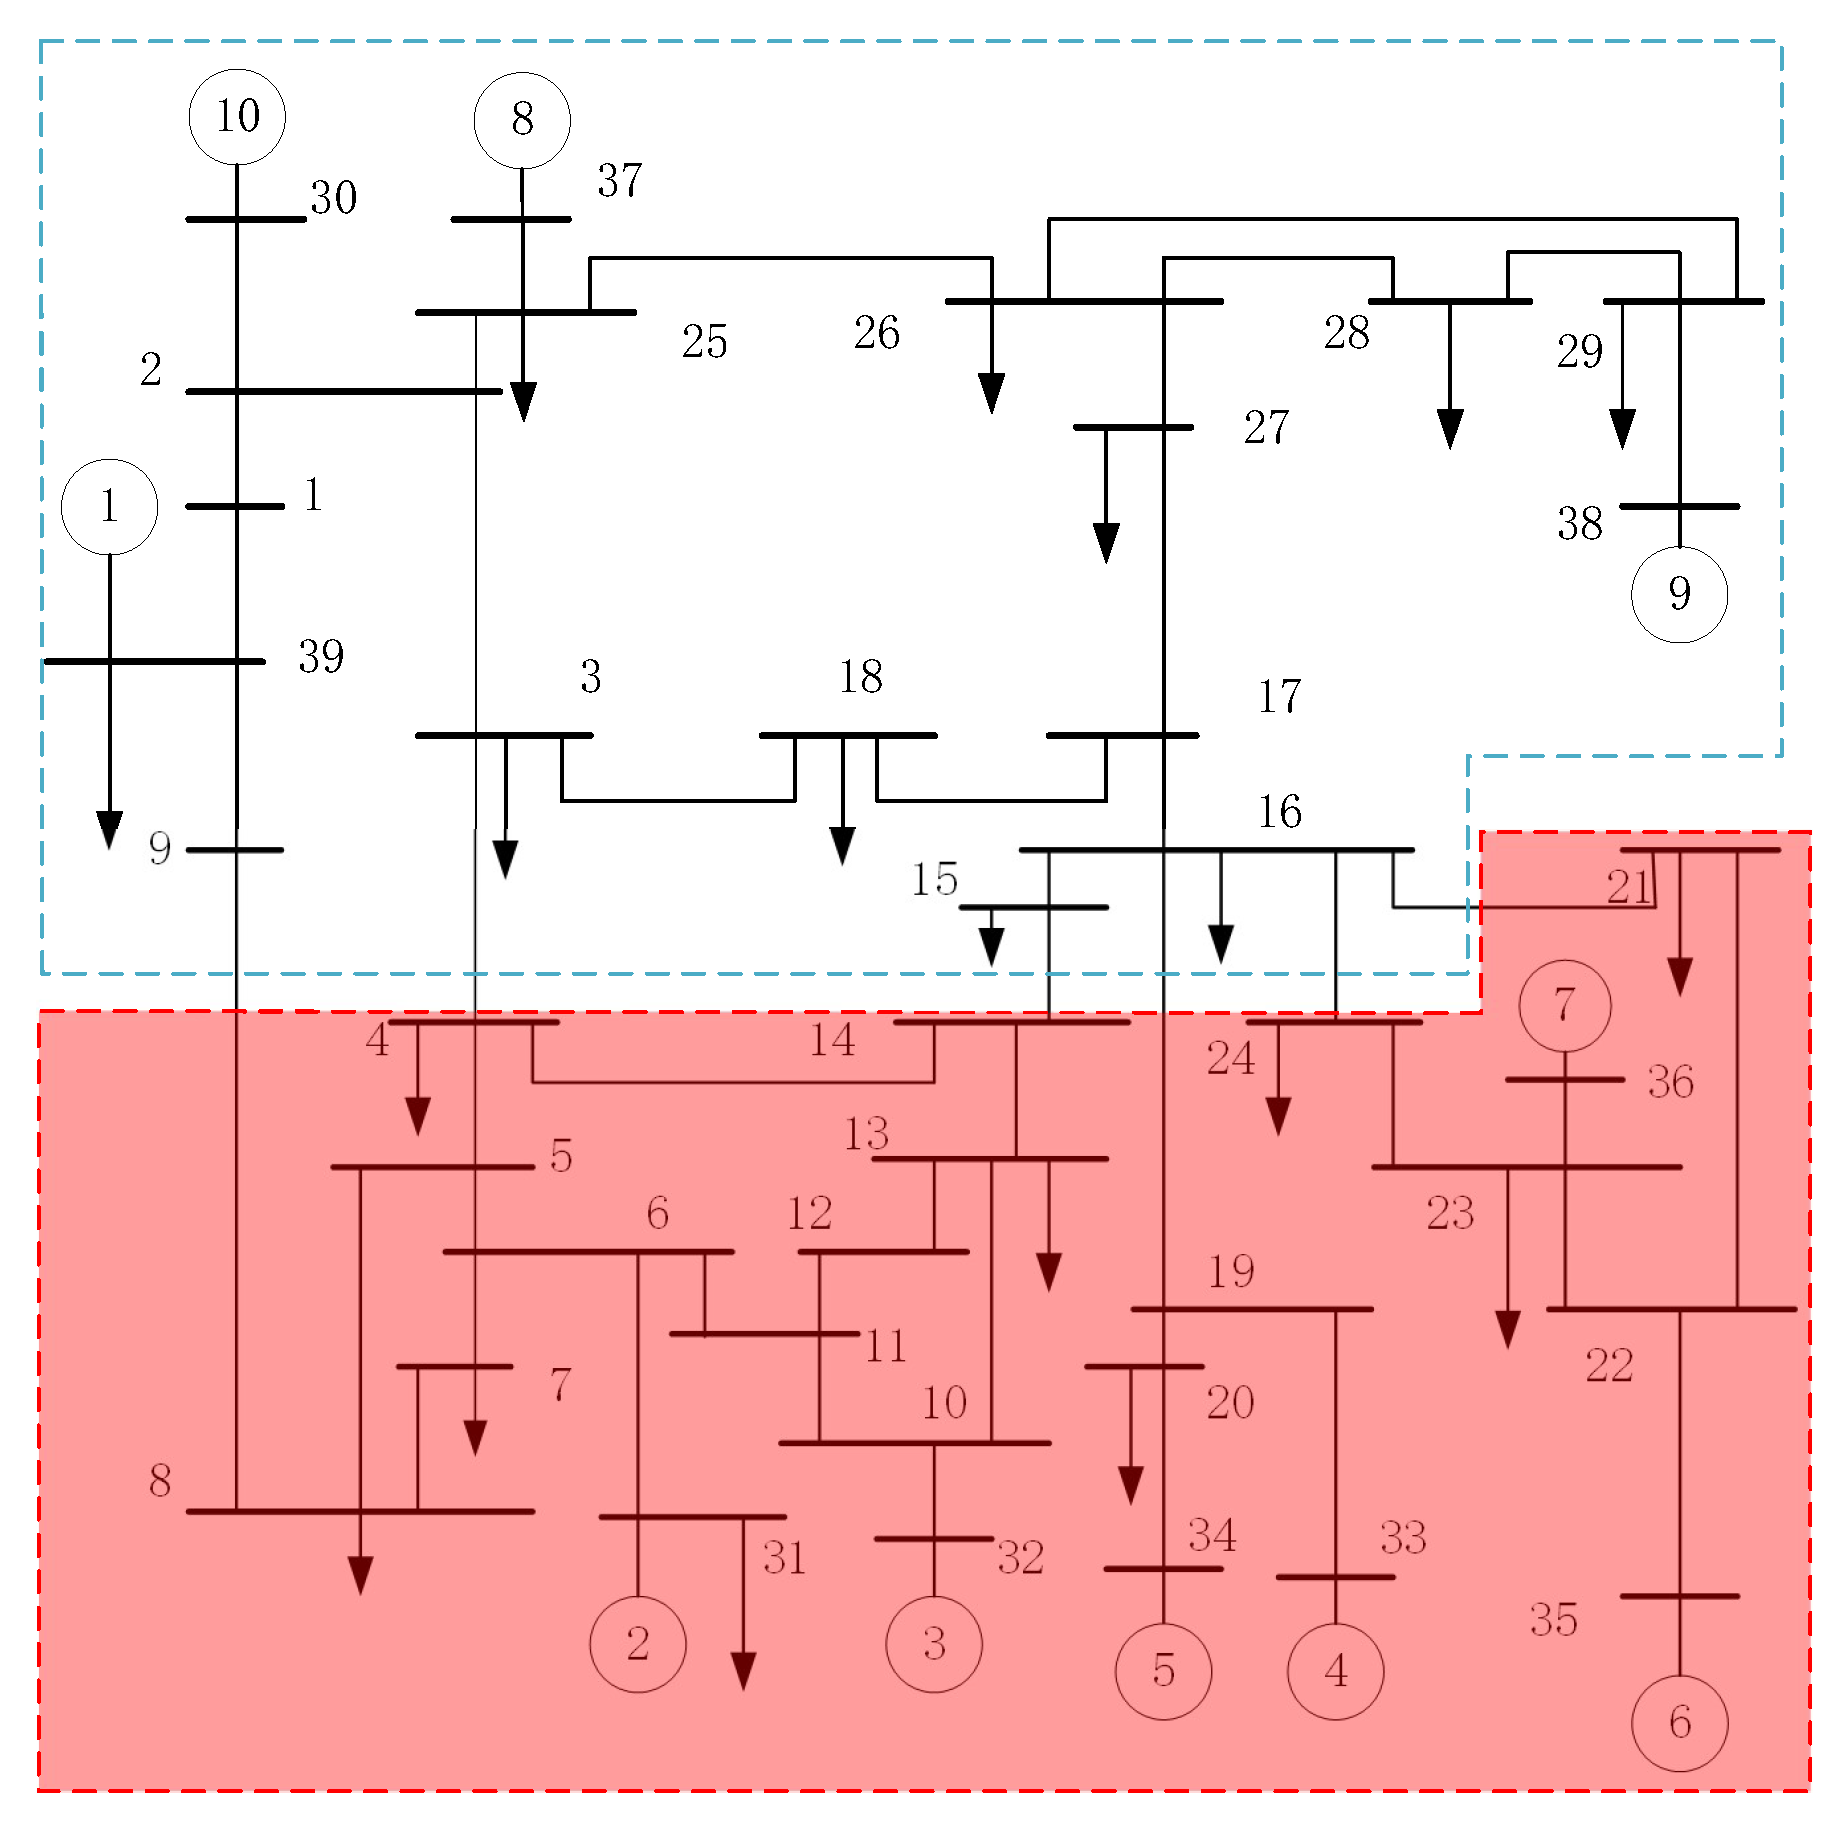
5. Simulations and Analysis

In this section, simulations are implemented to illustrate the feasibility of the proposed detection scheme on the LFC system. As is shown in Figure 3, an IEEE 39-bus 10-unit power system is used as the tested system. The data of the system can be found in [27,28]. The red block represents the compromised area (Area i).
Based on the Formulas (2)–(4), it is assumed that the uncertainties of the system studied in this simulation environment are as follows:
Δ A i ( t ) = 0.065 0 0.065 0 0.043 0.043 0 0 0 0.012 0.012 0.012 0 0 0.0025 0 · s i n ( t )
Δ B i ( t ) = 0.065 0 0 0 T · s i n ( t ) ,

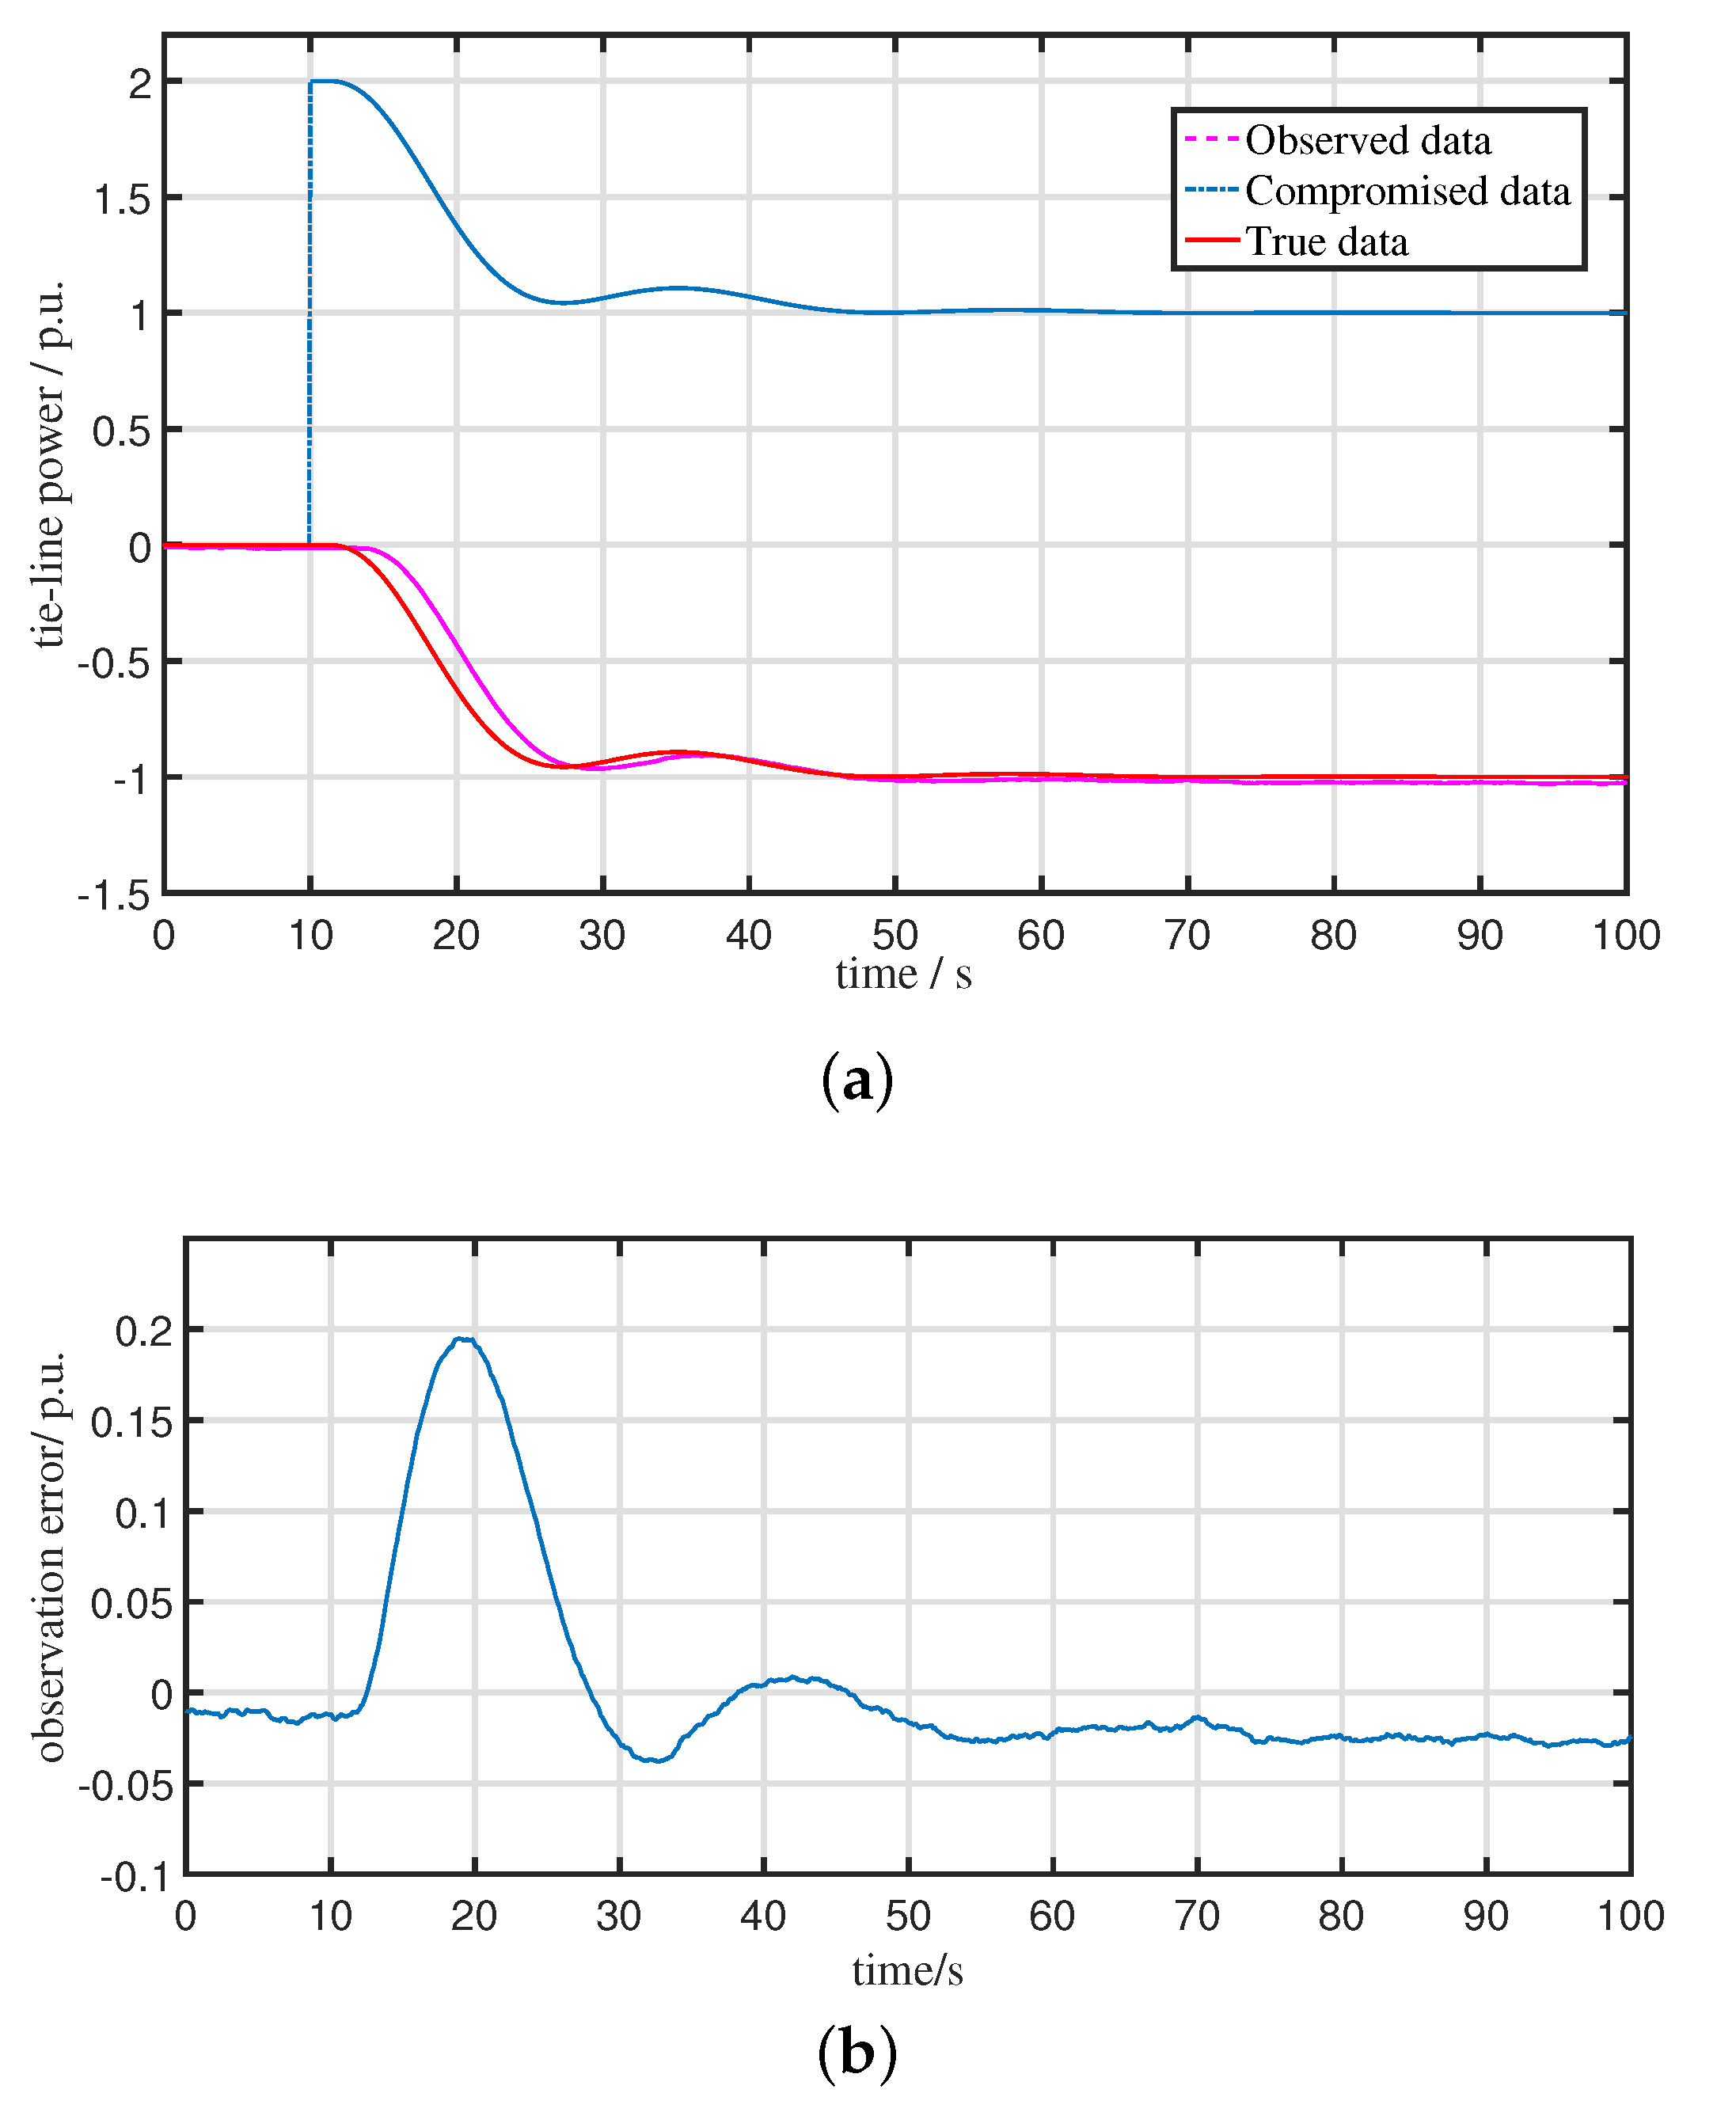
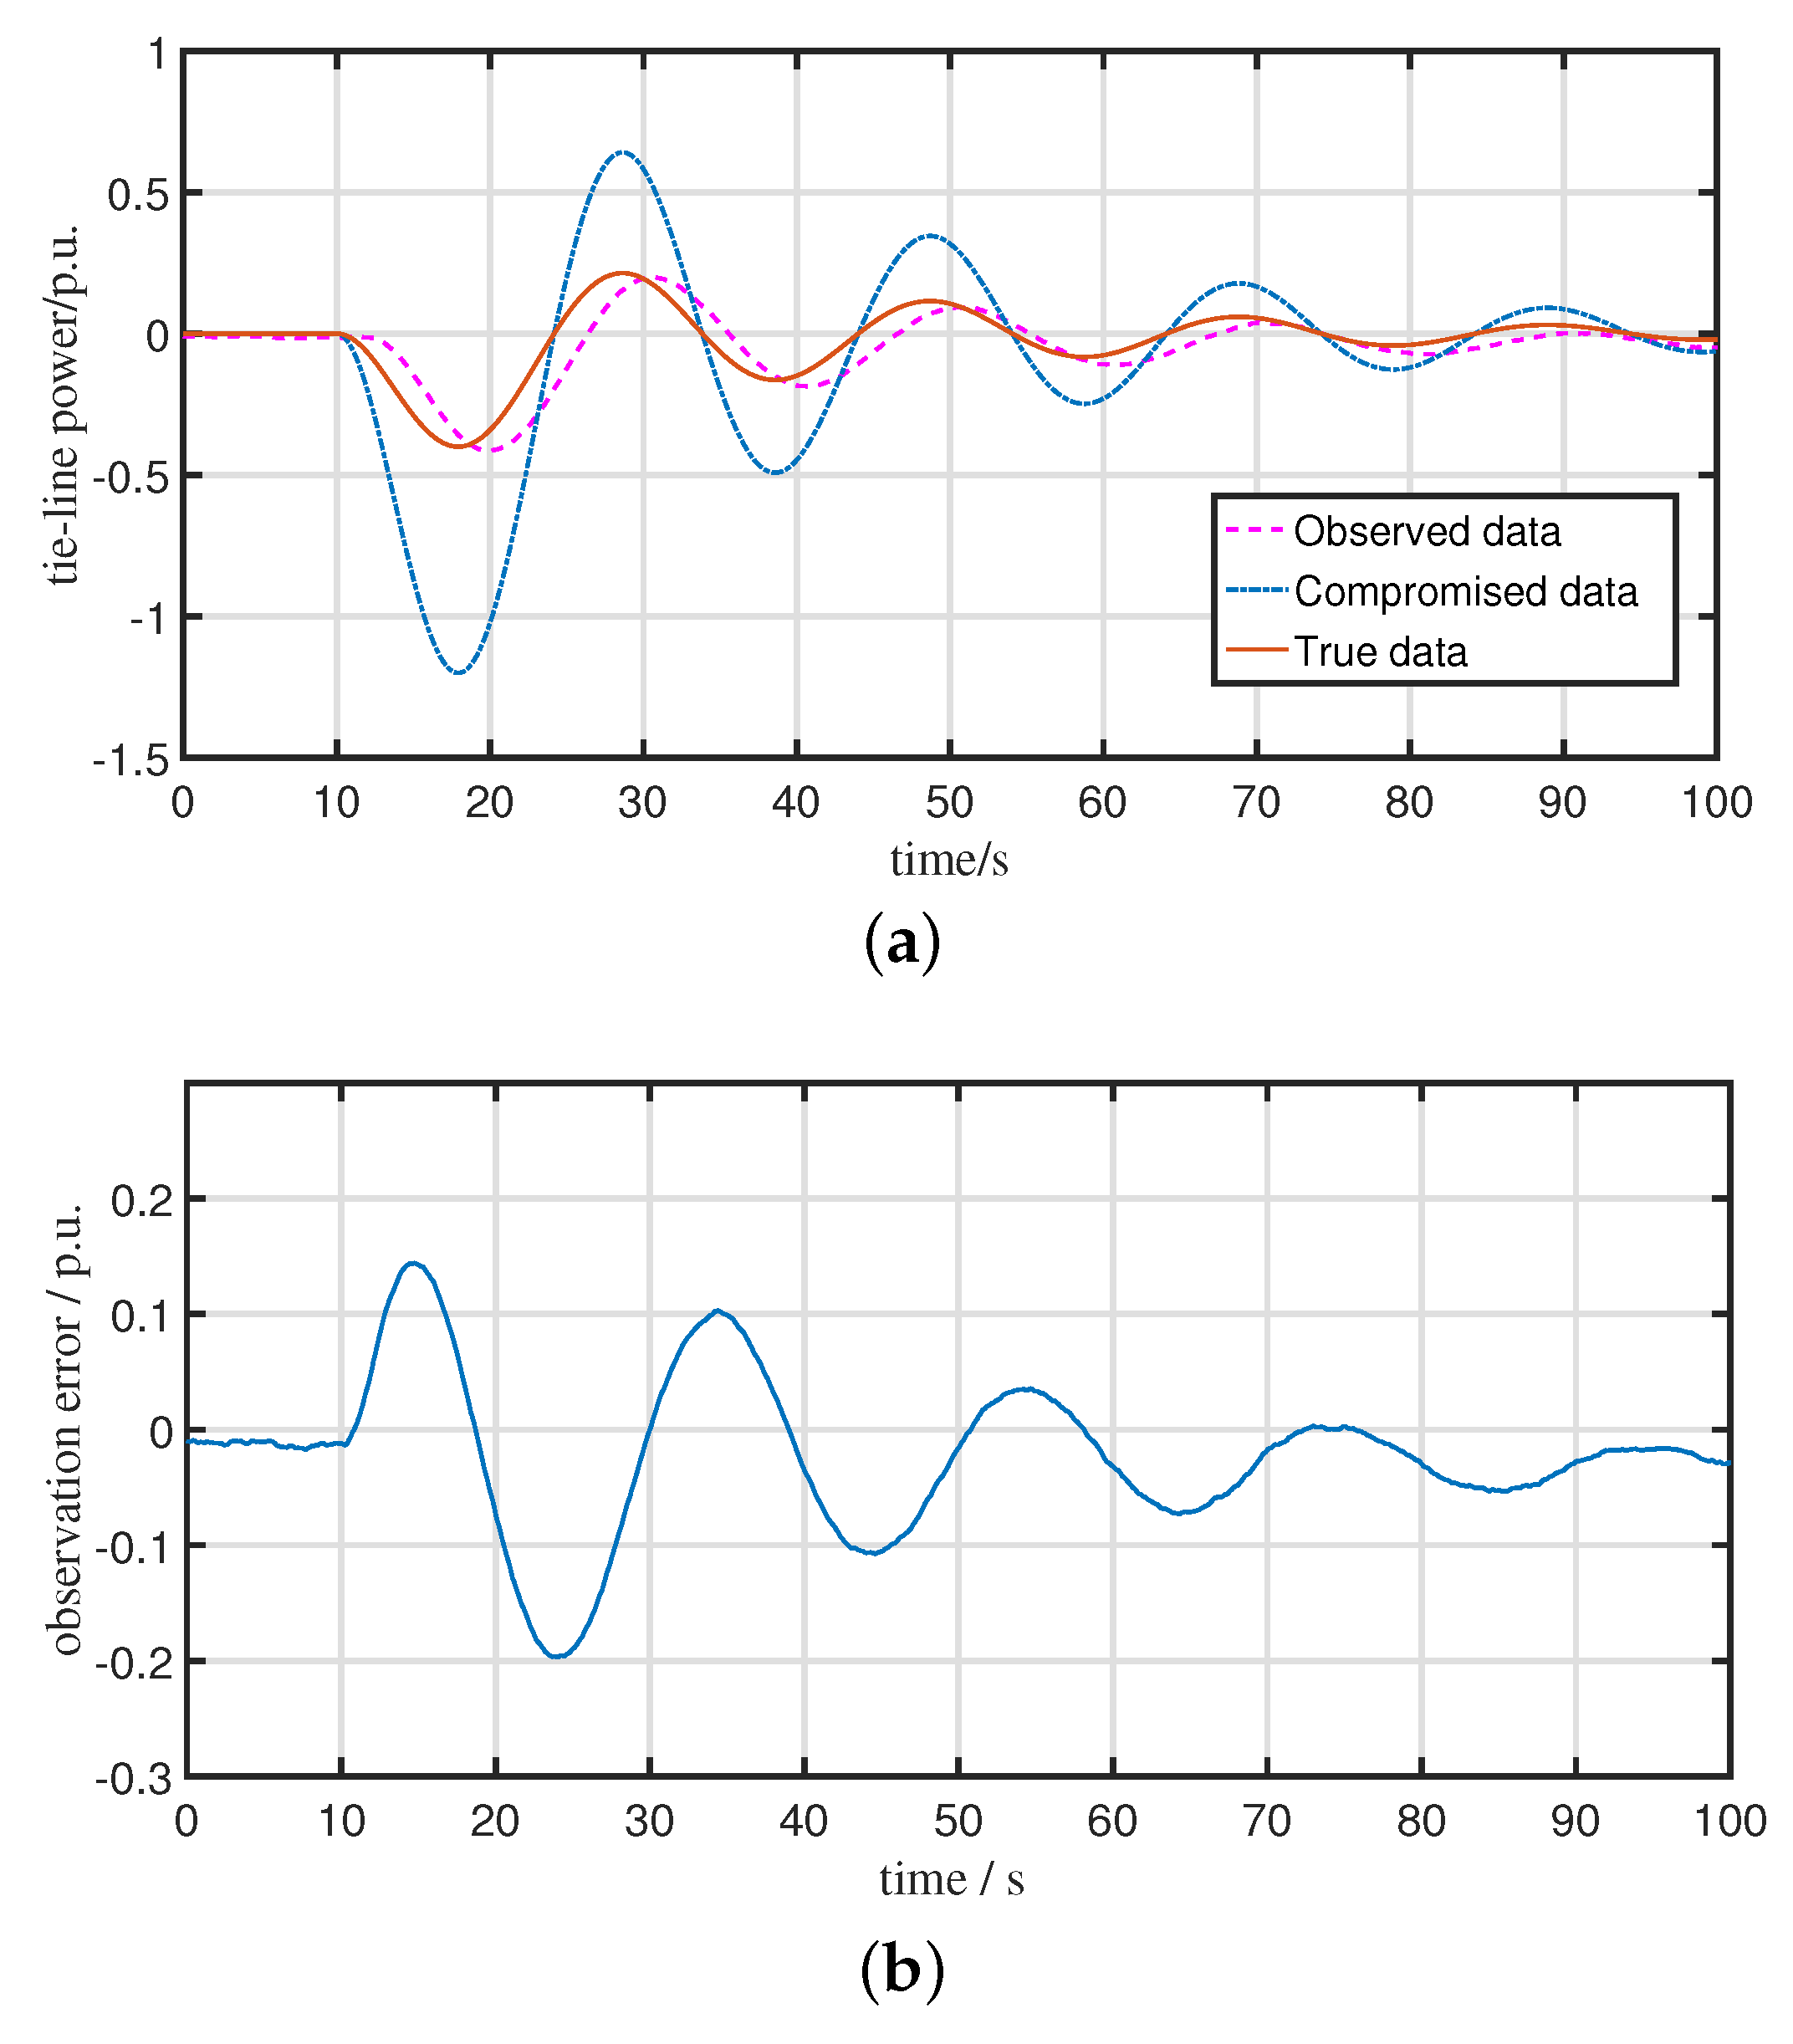
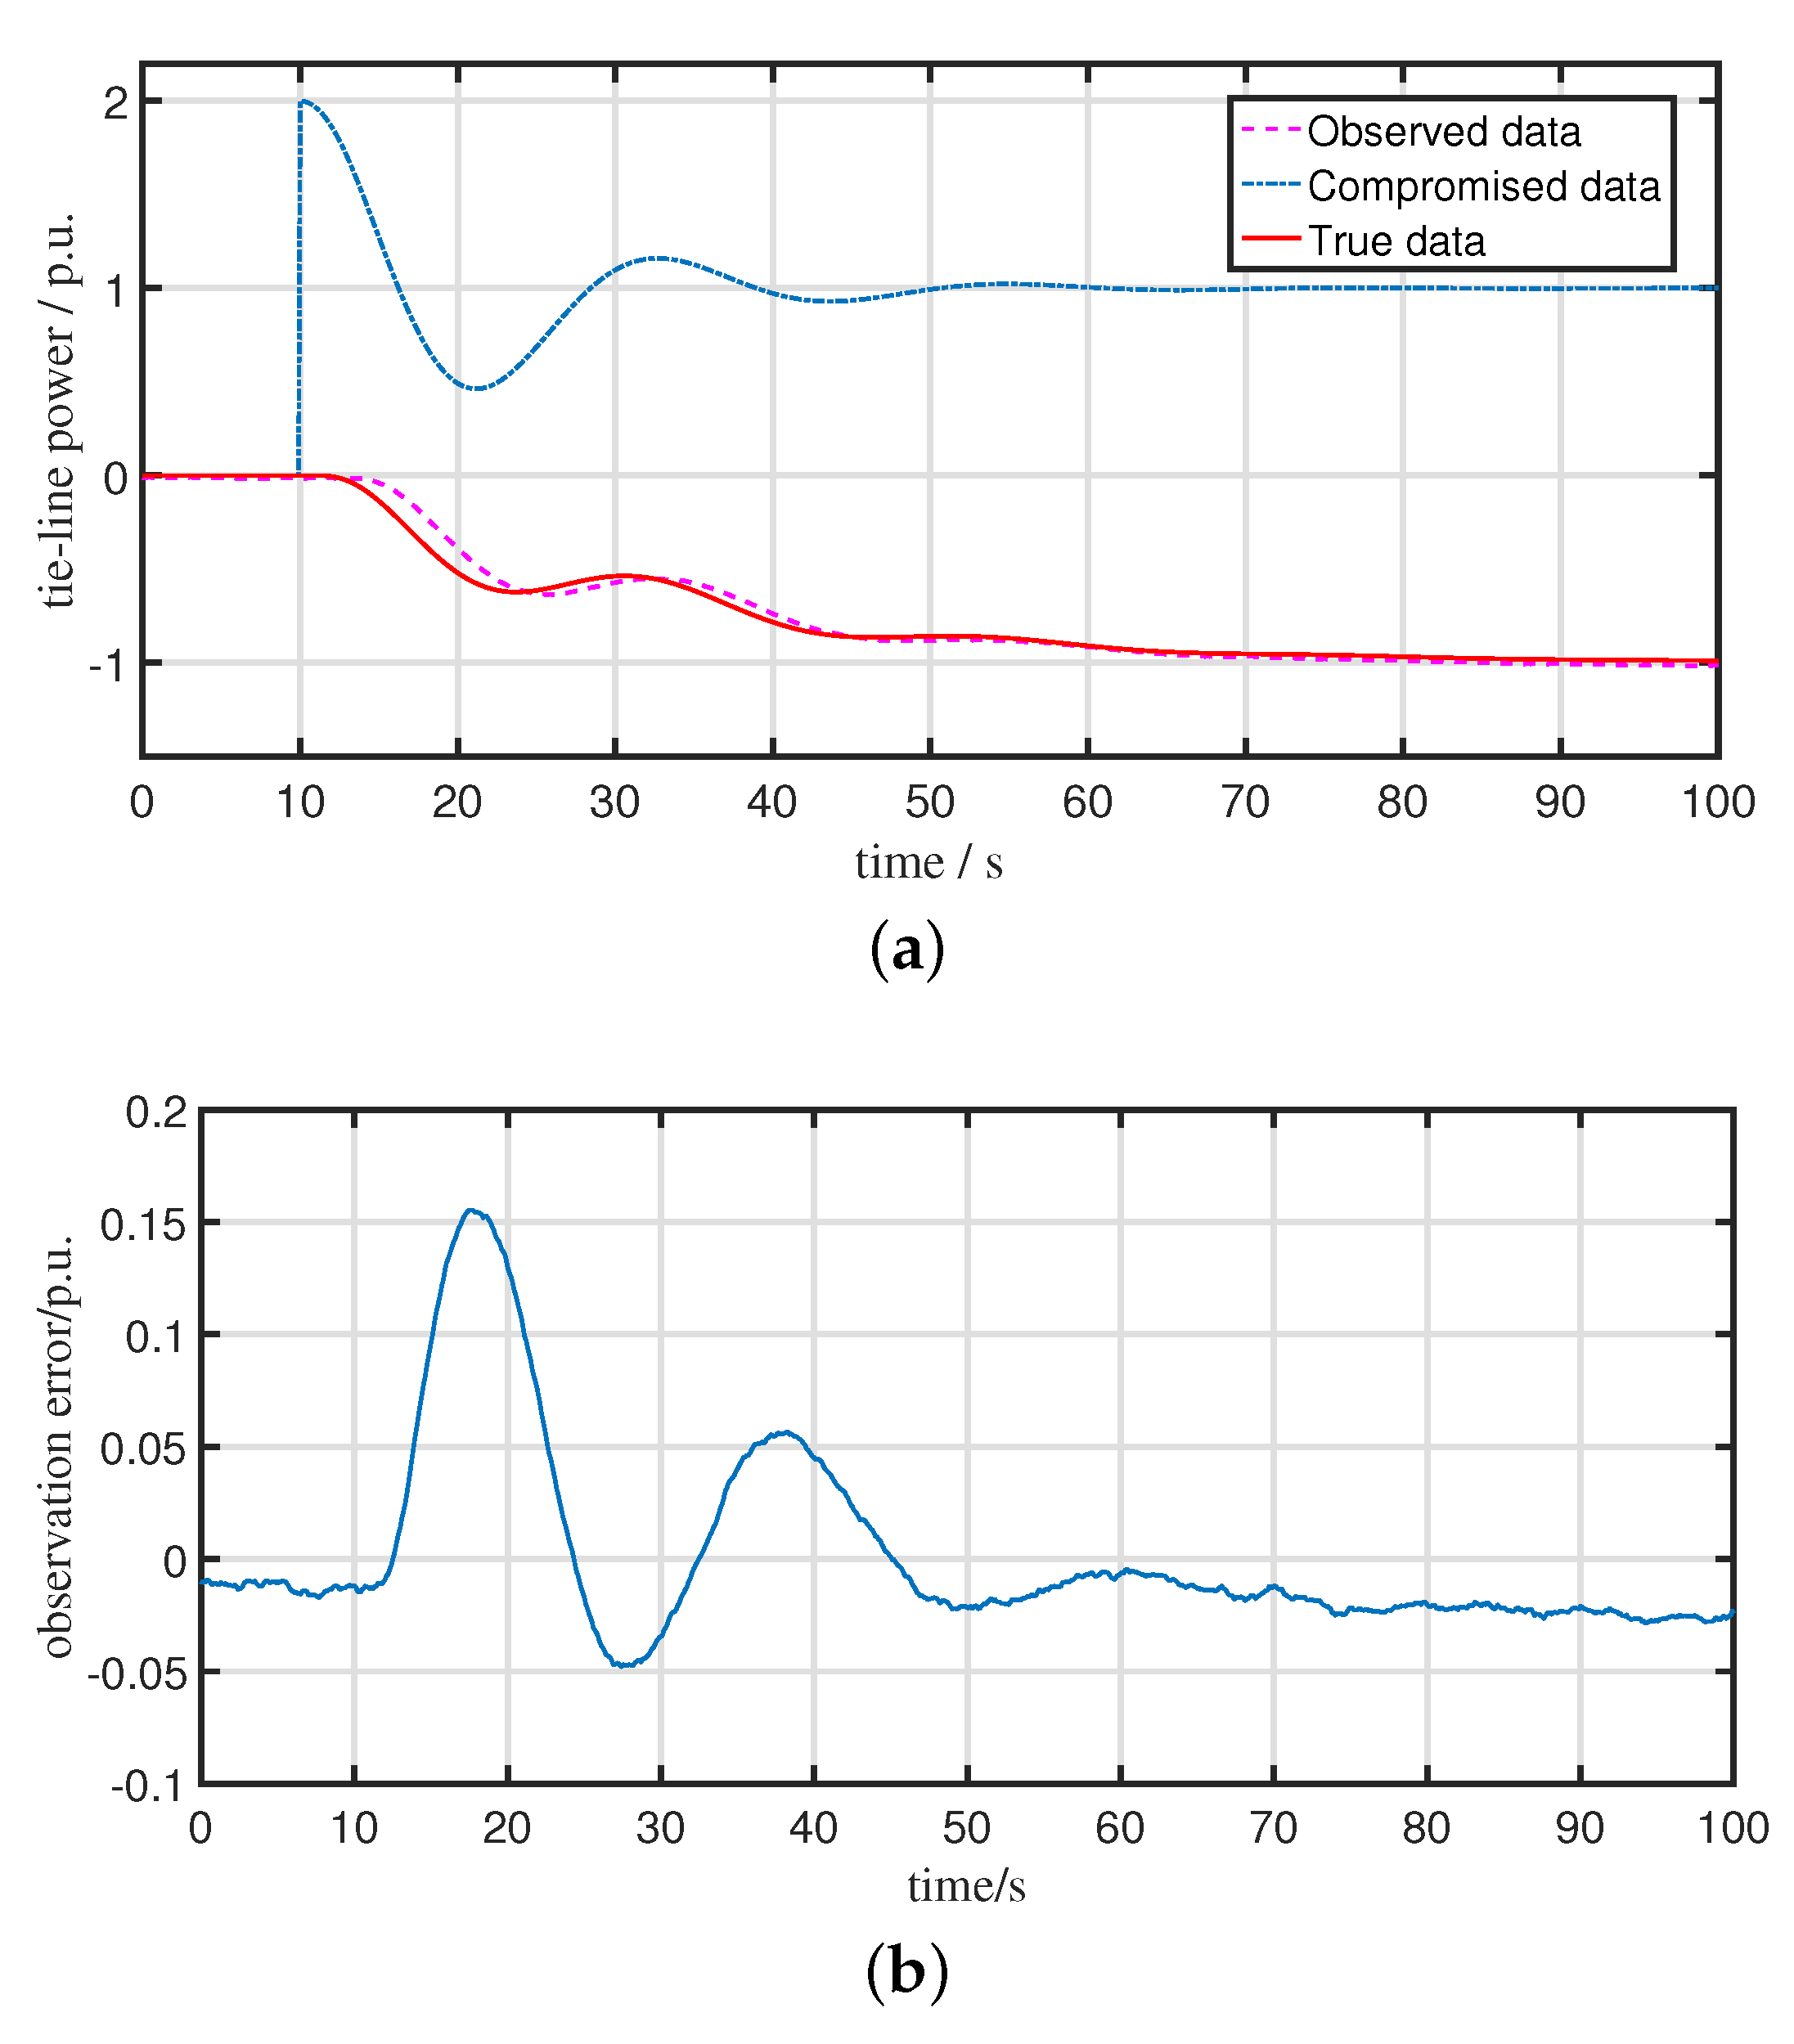
5.1. Performance of the Observer for the Compromised LFC System

Based on the method studied in Section 3 and the parameters of the system, the observer gains for the tie-line power of the compromised area i can be calculated as follows:
W i = 6.6667 0 0.0031 0 3.2258 3.2258 0.0003 0 0 0 9.053 0 0 0 0.0001 0 , N i = 0 0 1 0
Y i = 6.6635 0.0003 9.053 0.1884 T
In this case, we make τ = 1 s. The signal-to-noise ratio (SNR) of the white Gaussian noise is chosen as 30 dB. Systems compromised of different attack templates are simulated, and the simulation results are shown in Figure 4, Figure 5 and Figure 6.
It can be learned that the dynamic features of real data can be reflected by that of observed data when the system is compromised by the aforementioned types of FDI attacks. The defender can detect attacks based on the dynamic feature similarity between the observed data and the true data. Although the characteristics of the observation error are different when the system is under different attacks, the observation error tends to be small in the long-term range, which means that the observed data are closer to the true data in the case of a long sample time.

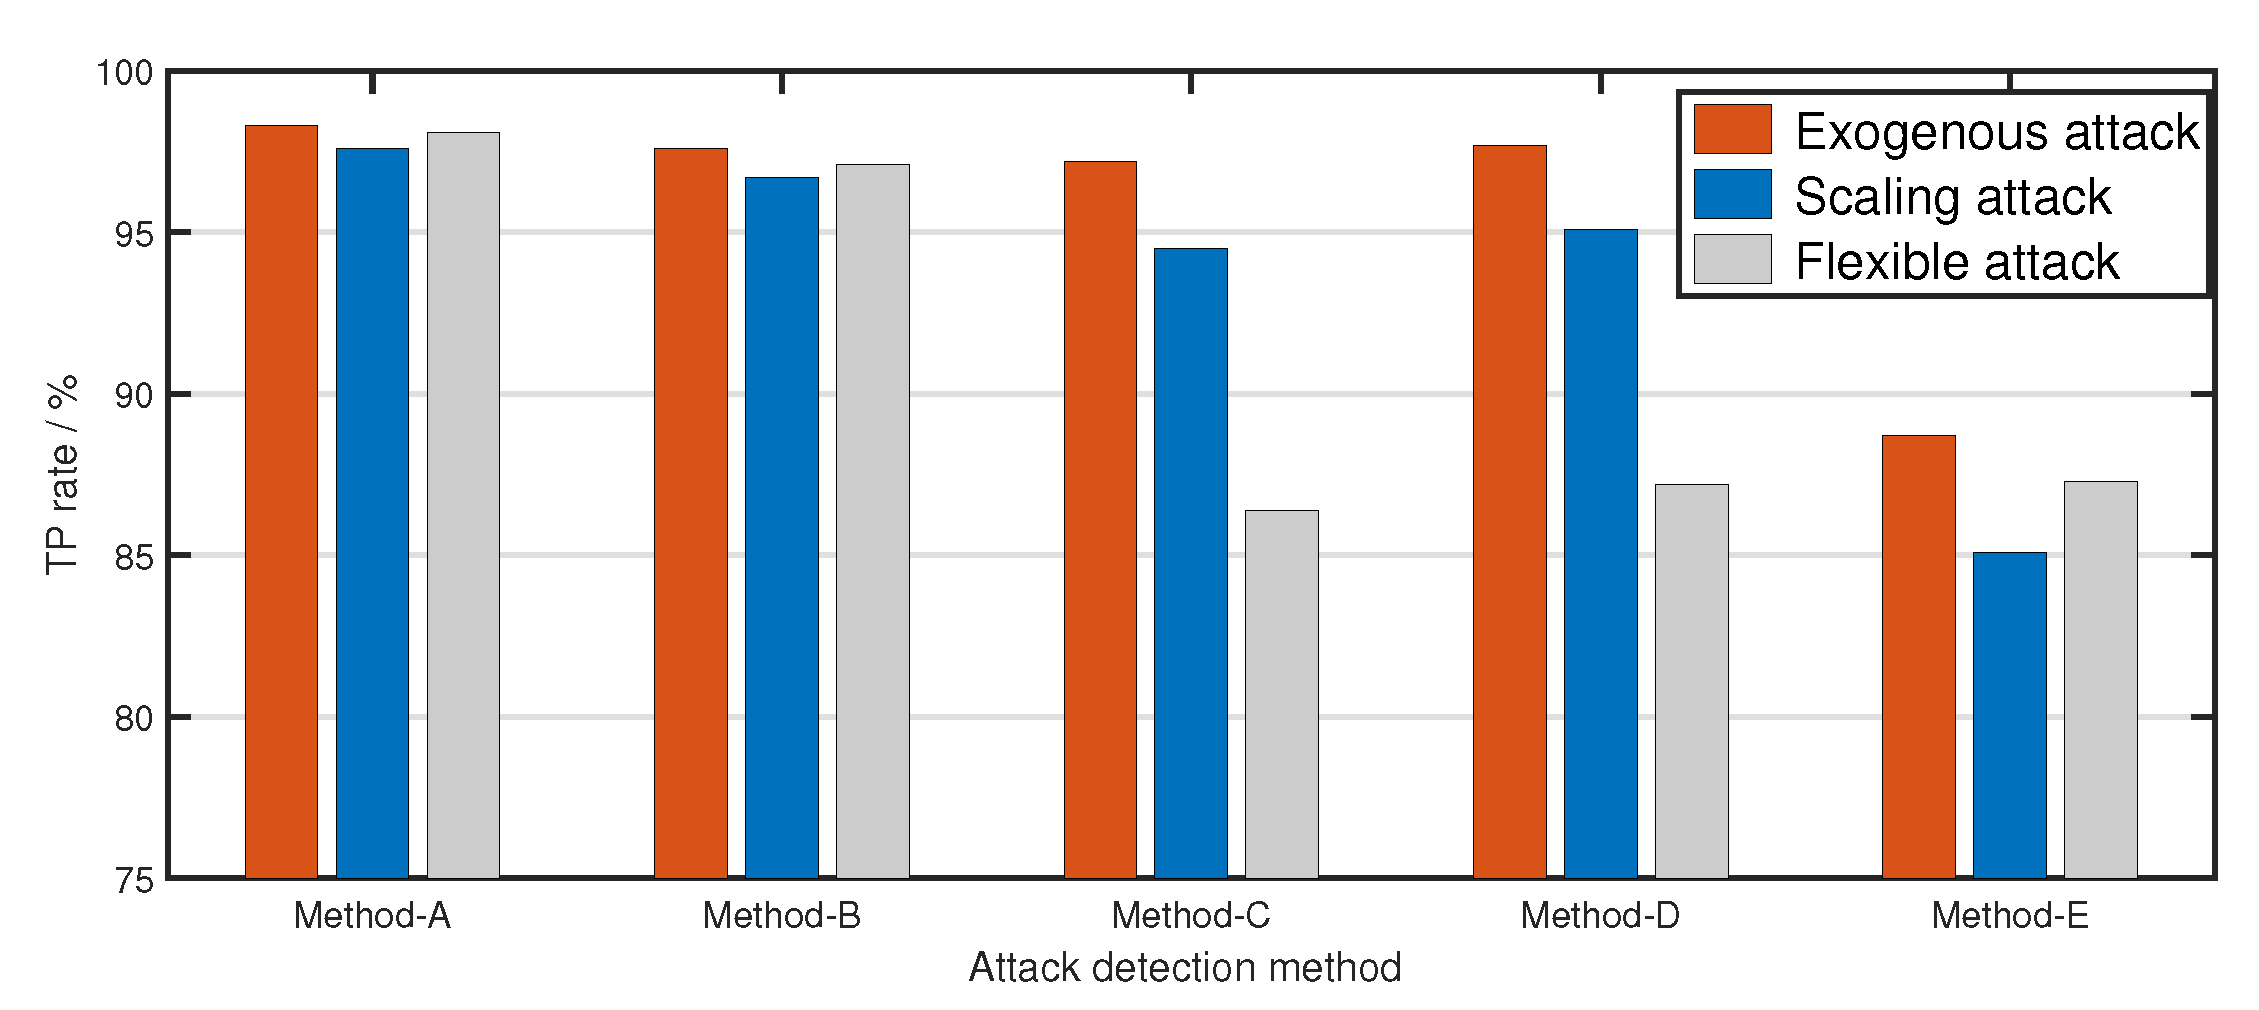
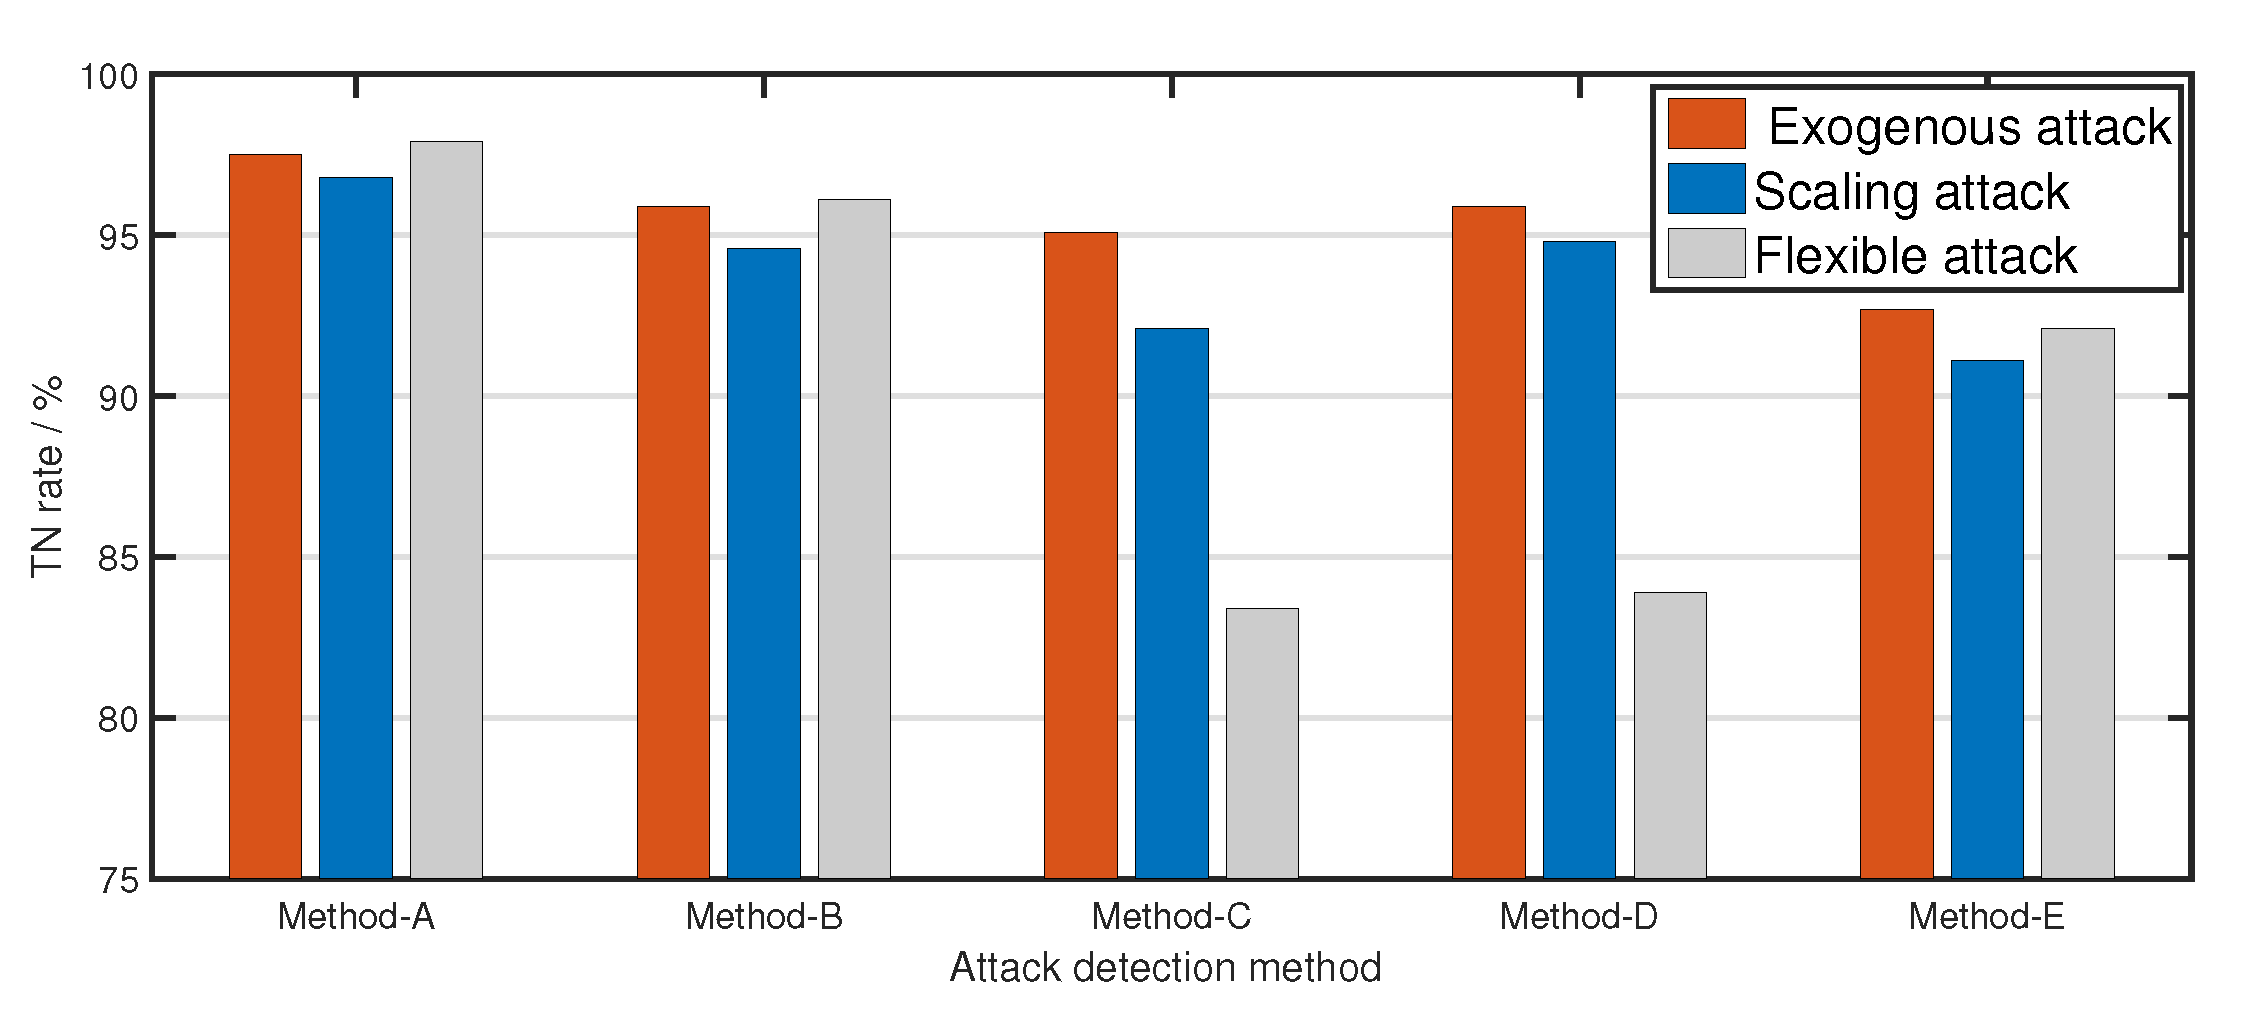
5.2. Performance of the Proposed Attack Detection Scheme

In this subsection, we evaluate the performance of the Siamese network used to detect FDI attacks. The batch size of the Siamese network is chosen as 20. Let ξ m a x = 2 and ξ m i n = 1 . Training samples contain 900 historical normal sample data and 300 compromised data. As for the compromised data, we set the value templates of the exogeneous attacks from 0.01 p.u. to 5 p.u. and set the value templates of the scaling attacks from 0.01 to 5. Each sample contains 60 s of tie-line power data. In addition, 3000 observed sample data including 1500 samples of the aforementioned three types of FDI attack templates are generated as test samples.
To illustrate the advantages of the FDI attack detection scheme studied in this paper, we choose the following five methods for comparison: (1) The proposed attack detection scheme using a cluster-based loss function (Method-A); (2) the proposed attack detection scheme using triplet loss function (Method-B) [29]; (3) the detection method using multilayer perception (Method-C) [17]; (4) the detection method using clustering-particle swarm optimization (clustering-PSO) (Method-D) [30]; and (5) the ACE forecasting method (Method-E) [15].
True positive rate (TPR) and true negative rate (TNR) are utilized to evaluate the performance of these five methods:
T P R = T P T P + F P
T N R = T N T N + F N
where T P , F P , T N , and F N are the correctly detected positive samples, incorrectly detected positive samples, correctly detected negative samples, and incorrectly detected negative samples, respectively.
The simulation results considering different types of FDI attacks are shown in Figure 7 and Figure 8.
From Figure 7 and Figure 8, it can be learned that the proposed attack detection scheme achieves higher T P rate and T N rate than the detection method using multilayer perception and that using clustering-PSO. In particular, when the system is compromised by flexible attacks, the proposed detection scheme has more prominent advantages than these two methods. This is because the proposed scheme is trained based on the relationship between observed data and true data. The detection method using multilayer perception and that using clustering-PSO are trained based on features of true data, which can be easily imitated by flexible attack. The lower T P rate of the ACE-forecasting method stems from the prediction errors.

5.3. Reliability of the Proposed Attack Detection Scheme

In this subsection, we evaluate the reliability of the proposed attack detection scheme by considering four safe factors: safe SNR, safe delay, safe number of training samples, and safe margin difference. To quantify reasonable safe levels which could guarantee certain detection performance, we establish the relationship between the minimum of the safe factors and threshold for detection performance. S r is used to represent the threshold for detection performance, which can be expressed as:
S r = min { T P , T N }
Safe SNR considering different S r and different attack templates are In Table 1. It can be learned that the safe SNR increases with the increase of S r . The impact of attack type on safe SNR is less than that of S r . When S r is at a high level, the safe SNR is basically the same. When S r is at a low level, the safe SNR under different attacks begin to differ.
Safe delay considering different S r and different attack templates are In Table 2. Different attack types perform almost the same under different S r . This is because, when the time span of the data sample is long, the short time delay is difficult to change the main characteristics of the data.
A safe number of training samples considering different S r and different attack templates are in Table 3. It can be seen that the proposed detection scheme does not require a high number of data samples considering the scale of historical data of power systems. Among them, the proposed flexible attack requires a little higher data size. This is because it is more diverse, and a small number of samples can not effectively cover all cases.
A safe margin difference considering different S r and different attack templates is in Table 4. As the margin difference increases, S r increases. The marginal benefit of the method of increasing S r by increasing the margin difference is reduced. This is because the test data outside the margin are limited. Different attack types perform almost the same under different S r . This is because the probability of testing data outside the margin is almost the same for different attack types.

6. Conclusions

A novel detection scheme of cyber attacks on a load frequency control system is studied in this paper. We design an observer of the tie-line power based on known-secured variables to track the dynamic features of the tie-line power. The designed observer can achieve the observation tie-line power when the system is under different types of FDI attacks. The observed data and the measured data of tie-line power are combined into the input pairs of the Siamese network to achieve attack detection. The simulation results illustrate that the proposed attack detection scheme is feasible under mid or little SNRs.

Author Contributions

Conceptualization: W.B. and K.Z.; data curation: W.B.; formal analysis: W.B. and C.C.; methodology: K.Z.; project administration: K.Z.; resources: W.B.; software: W.B. and C.C.; supervision: K.Z.; validation: W.B.; writing—original draft: W.B.; writing—review and editing: K.Z. and C.C. All authors have read and agreed to the published version of the manuscript.

Funding

This research was funded by the National Natural Science Foundation of China (No. 51977033) and the Research Program of State Grid Corporation of China (Research and Application of Distributed Renewable Energy Monitoring and Statistical Analysis Technology).

Data Availability Statement

Publicly available datasets were analyzed in this study. This data can be found here: [27,28].

Acknowledgments

This work was partially supported by the Key Laboratory of Measurement and Control of CSE.

Conflicts of Interest

The authors declare no conflict of interest.The funders had no role in the design of the study; in the collection, analyses, or interpretation of data; in the writing of the manuscript, or in the decision to publish the results.

References

  1. Peng, C.; Sun, H.; Yang, M.; Wang, Y.L. A survey on security communication and control for smart grids under malicious cyber attacks. IEEE Trans. Syst. Man Cybern. Syst. 2019, 49, 1554–1569. [Google Scholar] [CrossRef]
  2. Deng, R.L.; Zhuang, P.; Liang, H. CCPA: Coordinated Cyber-Physical Attacks and Countermeasures in Smart Grid. IEEE Trans. Smart Grid 2017, 8, 2420–2430. [Google Scholar] [CrossRef]
  3. Peng, C.; Li, J.; Fei, M. Resilient Event-Triggering H_infinity Load Frequency Control for Multi-Area Power Systems With Energy-Limited DoS Attacks. IEEE Trans. Power Syst. 2016, 32, 4110–4118. [Google Scholar] [CrossRef]
  4. Liu, Y.; Ning, P.; Reiter, M.K. False data injection attacks against state estimation in electric power grids. ACM Trans. Inf. Syst. Secur. (TISSEC) 2011, 14, 1–33. [Google Scholar] [CrossRef]
  5. Huang, Y.; Esmalifalak, M.; Nguyen, H.; Zheng, R.; Han, Z.; Li, H.; Song, L. Bad data injection in smart grid: Attack and defense mechanisms. IEEE Commun. Mag. 2013, 51, 27–33. [Google Scholar] [CrossRef]
  6. Hong, J.; Nuqui, R.F.; Kondabathini, A.; Ishchenko, D.; Martin, A. Cyber attack resilient distance protection and circuit breaker control for digital substations. IEEE Trans. Ind. Inform. 2018, 15, 4332–4341. [Google Scholar] [CrossRef]
  7. Teixeira, A.; Dán, G.; Sandberg, H.; Johansson, K.H. A cyber security study of a SCADA energy management system: Stealthy deception attacks on the state estimator. IFAC Proc. Vol. 2011, 44, 11271–11277. [Google Scholar] [CrossRef] [Green Version]
  8. Taha, A.F.; Qi, J.; Wang, J.; Panchal, J.H. Risk mitigation for dynamic state estimation against cyber attacks and unknown inputs. IEEE Trans. Smart Grid 2016, 9, 886–899. [Google Scholar] [CrossRef]
  9. Luo, X.; Wang, X.; Pan, X.; Guan, X. Detection and isolation of false data injection attack for smart grids via unknown input observers. IET Gener. Transm. Distrib. 2019, 13, 1277–1286. [Google Scholar] [CrossRef]
  10. Befekadu, G.K.; Gupta, V.; Antsaklis, P.J. Risk-sensitive control under Markov modulated denial-of-service (DoS) attack strategies. IEEE Trans. Autom. Control 2015, 60, 3299–3304. [Google Scholar] [CrossRef]
  11. Zhang, H.; Cheng, P.; Shi, L.; Chen, J. Optimal denial-of-service attack scheduling with energy constraint. IEEE Trans. Autom. Control 2015, 60, 3023–3028. [Google Scholar] [CrossRef]
  12. De Persis, C.; Tesi, P. Input-to-state stabilizing control under denial-of-service. IEEE Trans. Autom. Control 2015, 60, 2930–2944. [Google Scholar] [CrossRef]
  13. Peng, C.; Yang, T.C. Event-triggered communication and H-infinity control co-design for networked control systems. Automatica 2013, 49, 1326–1332. [Google Scholar] [CrossRef]
  14. Peng, C.; Han, Q.L. On designing a novel self-triggered sampling scheme for networked control systems with data losses and communication delays. IEEE Trans. Ind. Electron. 2015, 63, 1239–1248. [Google Scholar] [CrossRef]
  15. Sridhar, S.; Govindarasu, M. Model-based attack detection and mitigation for automatic generation control. IEEE Trans. Smart Grid 2014, 5, 580–591. [Google Scholar] [CrossRef]
  16. Tan, R.; Nguyen, H.H.; Foo, E.Y.; Dong, X.; Yau, D.K.; Kalbarczyk, Z.; Iyer, R.K.; Gooi, H.B. Optimal false data injection attack against automatic generation control in power grids. In Proceedings of the 2016 ACM/IEEE 7th International Conference on Cyber-Physical Systems (ICCPS), Vienna, Austria, 11–14 April 2016; pp. 1–10. [Google Scholar]
  17. Chen, C.; Zhang, K.; Yuan, K.; Zhu, L.; Qian, M. Novel detection scheme design considering cyber attacks on load frequency control. IEEE Trans. Ind. Inform. 2017, 14, 1932–1941. [Google Scholar] [CrossRef]
  18. Bi, W.; Chen, C.; Zhang, K. Optimal Strategy of Attack-Defense Interaction Over Load Frequency Control Considering Incomplete Information. IEEE Access 2019, 7, 75342–75349. [Google Scholar] [CrossRef]
  19. Cheng, Z.; Yue, D.; Hu, S.; Huang, C.; Dou, C.; Chen, L. Resilient load frequency control design: DoS attacks against additional control loop. Int. J. Electr. Power Energy Syst. 2020, 115, 105496. [Google Scholar] [CrossRef]
  20. Hou, Y.; Zhu, F.; Zhao, X.; Guo, S. Observer design and unknown input reconstruction for a class of switched descriptor systems. IEEE Trans. Syst. Man Cybern. Syst. 2017, 48, 1411–1419. [Google Scholar] [CrossRef]
  21. Luo, X.; Wang, X.; Zhang, M.; Guan, X. Distributed detection and isolation of bias injection attack in smart energy grid via interval observer. Appl. Energy 2019, 256, 113703. [Google Scholar] [CrossRef]
  22. Niu, H.; Bhowmick, C.; Jagannathan, S. Attack detection and approximation in nonlinear networked control systems using neural networks. IEEE Trans. Neural Netw. Learn. Syst. 2019, 31, 235–245. [Google Scholar] [CrossRef]
  23. Liao, K.; Xu, Y. A robust load frequency control scheme for power systems based on second-order sliding mode and extended disturbance observer. IEEE Trans. Ind. Inform. 2017, 14, 3076–3086. [Google Scholar] [CrossRef]
  24. Su, X.; Liu, X.; Song, Y.D. Fault-tolerant control of multiarea power systems via a sliding-mode observer technique. IEEE/ASME Trans. Mechatronics 2017, 23, 38–47. [Google Scholar] [CrossRef]
  25. Chen, C.; Zhang, K.; Yuan, K.; Gao, Z.; Teng, X.; Ding, Q. Disturbance rejection-based LFC for multi-area parallel interconnected AC/DC system. IET Gener. Transm. Distrib. 2016, 10, 4105–4117. [Google Scholar] [CrossRef]
  26. Chen, J.; Patton, R.J.; Zhang, H.Y. Design of unknown input observers and robust fault detection filters. Int. J. Control 1996, 63, 85–105. [Google Scholar] [CrossRef]
  27. Canizares, C.; Fernandes, T.; Geraldi, E.; Gerin-Lajoie, L.; Gibbard, M.; Hiskens, I.; Kersulis, J.; Kuiava, R.; Lima, L.; DeMarco, F.; et al. Benchmark Models for the Analysis and Control of Small-Signal Oscillatory Dynamics in Power Systems. IEEE Trans. Power Syst. 2017, 32, 715–722. [Google Scholar] [CrossRef]
  28. Athay, T.; Podmore, R.; Virmani, S. A Practical Method for the Direct Analysis of Transient Stability. IEEE Trans. Power Appar. Syst. 1979, PAS-98, 573–584. [Google Scholar] [CrossRef]
  29. Qu, F.; Liu, J.; Liu, X.; Jiang, L. A Multi-Fault Detection Method with Improved Triplet Loss Based on Hard Sample Mining. IEEE Trans. Sustain. Energy 2021, 12, 127–137. [Google Scholar] [CrossRef]
  30. Zheng, H.; Hou, M.; Wang, Y. An efficient hybrid clustering-PSO algorithm for anomaly intrusion detection. J. Softw. 2011, 6, 2350–2360. [Google Scholar] [CrossRef] [Green Version]
Figure 1. Diagram of the multi-area compromised LFC system.
Applsci 11 01584 g001
Figure 2. The Siamese network for FDI attack detection.
Applsci 11 01584 g002
Figure 3. Interconnected power system.
Applsci 11 01584 g003
Figure 4. Different data sources of tie-line power and observation error under exogenous attack. (a) different data sources of tie-line power; (b) observation error.
Applsci 11 01584 g004
Figure 5. Different data sources of tie-line power and observation error under scaling attack. (a) different data sources of tie-line power; (b) observation error.
Applsci 11 01584 g005
Figure 6. Different data sources of tie-line power and observation error under flexible attack. (a) different data sources of tie-line power; (b) observation error.
Applsci 11 01584 g006
Figure 7. TP rate of the attack detection scheme.
Applsci 11 01584 g007
Figure 8. TN rate of the attack detection scheme.
Applsci 11 01584 g008
Table 1. Safe SNR considering different S r and different attack templates.
S r = 80 % S r = 85 % S r = 90 %
Exogenous attack9.3 dB10.9 dB13.1 dB
Scaling attack9.5 dB11.2 dB13.1 dB
Flexible attack9.8 dB11.2 dB13.1 dB
Table 2. Safe delay considering different S r and different attack templates.
S r = 80 % S r = 85 % S r = 90 %
Exogenous attack6.7 s5.1 s3.2 s
Scaling attack7.0 s4.9 s3.2 s
Flexible attack6.9 s5.0 s3.1 s
Table 3. Safe number of training samples considering different S r and different attack templates.
S r = 80 % S r = 85 % S r = 90 %
Exogenous attack455570
Scaling attack455570
Flexible attack606575
Table 4. Safe margin difference considering different S r and different attack templates.
S r = 80 % S r = 85 % S r = 90 %
Exogenous attack0.60.80.9
Scaling attack0.60.80.9
Flexible attack0.60.80.9
Publisher’s Note: MDPI stays neutral with regard to jurisdictional claims in published maps and institutional affiliations.

