Featured Application
This paper uses a photoelastic stress compensation method for measurement verification along with fuzzy theory to reorganize a set of processes that can be used to evaluate the re-sidual stress of a product, whereby the use of corresponding theoretical formulas can effec-tively quantify and measure the residual stress of the product.
Abstract
The phenomenon of residual stress in optical lens injection molding affects the quality of optical devices, with the refractive errors that are caused by geometric errors being the most serious, followed by the reduced accuracy and function of optical components; it is very important to ensure that the lens geometry remains intact and that the refractive index is reduced. This paper uses a photoelastic stress compensation method for measurement verification along with fuzzy theory to reorganize a set of processes that can be used to evaluate the residual stress of a product, whereby the use of corresponding theoretical formulas can effectively quantify and measure the residual stress of the product. A mold flow simulation is used to analyze the molded optical components and determine the feasibility of evaluating the quality of the lens. Through the measurement of the refractive stress value of the optical components, the molding quality of the lens can be improved, and its force distribution effects can be investigated. Geometric analysis and shear stress affect the performance of optical components, and these errors may also cause irreparable problems during secondary processing. Therefore, it is crucial to reduce the residual stress of optical components. When the stress distribution is uniform and the internal melting pressure is reasonably configured, the product’s shrinkage rate can be controlled; the method for determining the residual stress is the core theme of this research.
1. Introduction
Common optical components of optical lenses can be divided into two types: optical glass and optical lenses. Process optimization is the key factor to accurately control the quality of the injected polymer, such as the accuracy of the size and the material’s mechanical properties. This research mainly discusses injection molding plastic processing to form optical lenses. Injection molding is a one-time forming technology that is low cost, high speed, has a stable yield, and high production efficiency. Since the optical plastic lens forming does not require the secondary processes of polishing and grinding, the production time is shortened, and the cost is reduced.
There is currently a growing demand for light guide plate backlight modules and plastic optical lenses, which has indirectly driven many optical plastic parts manufacturers who originally produced automobile and motorcycle lamp housings, lighting equipment, or cosmetics to upgrade and meet these additional manufacturing requirements. In the field of high-value precision optical products, due to the extremely high precision requirements of the molds of optical products as well as the reproducibility of dimensions during mass production, the stability of accuracy and yield is particularly important. The injection of polymer material optical products has the same shrinkage and warpage deformation problems as general injection molded components, with the additional issues of optical refraction, including the relationships between the radius of curvature, the residual flow stress, birefringence, mold temperature, injection temperature, and injection speed, all of which must be improved to reach a better accuracy and yield. In addition to the accuracy requirements of the process equipment itself, the key to the process method is accurately controlling the parameters.
In the early days of injection molding technology, the mold was simply filled directly with the injection material, but research has proved that the key to flow wavefront processing injection quality accuracy is understanding the polymers’ material mechanical properties. Therefore, the injection molding process needs to use high speed, high pressure, and high temperature for molding, which causes stress to remain in the injection part, which is called residual stress. When the stress is generated in the transparent optical component, the phenomenon of birefringence occurs, which has the potential to cause large errors between the final product and the optical design values. Therefore, a method to effectively determine the residual birefringence in the injection molded part is the core goal of this article.
2. Literature Review
Optical plastic lenses that are made of polymer materials have the advantages of low material cost, light weight, high impact resistance, high impact and shatter resistance, and a simple production process for rapid mass production, as aspheric lenses are easier to produce. However, the disadvantages are that it is not easy to control the refractive index as it changes with temperature, which leads to birefringence. Compared with polymer materials, glass materials have a higher molding temperature and a high hardness, so they consume more energy. The optical glass molding process requires cutting and shape forming, and then multiple grinding and polishing processes. Consequently, if polymer material residual stress and distribution effects can be effectively interpreted, process defects can be improved through simulation and correcting machine parameters. Therefore, this research attempts to find a way to interpret the residual stress in polymer molding to determine the force distribution effects.
As early as 1995, Ajovalasit et al. [1] proposed a new full-field method for the automatic analysis of isochromatic fringes in white light. This RGB photoelasticity method eliminates the typical shortcomings of the classic white light photoelastic methods, which requires subjective analysis of colors and requires experienced analysts to obtain and interpret the results. In 1996, Chen et al. [2] used a digital photoelastic system to measure the birefringence of injection molded parts, which combined digital image analysis technology and a half-fringe photoelastic (HFP) method. The influences of processing conditions, including melt temperature, mold temperature, filling time, and filling pressure, on birefringence development in molded parts were investigated. It was found that temperature and pressure are the two main factors that determine the development of birefringence during the molding process. The frozen-in birefringence of molded parts decreases with the increase in melting temperature, mold temperature, and injection speed. The birefringence of the parts will also increase as the filling pressure increases, especially near the gate area. In 1998, Yoneyama and Takashi [3] proposed a new two-dimensional photoelastic analysis method for determining the fringe order and the main direction of birefringence from a single image combined with elliptically polarized white light and color image processing. After determining the fringe order, the main direction of birefringence is obtained by solving a nonlinear equation. In this paper, the output light intensity equation was derived, and the principle of the method was then described. In 1998, Ramesh and Mangal [4] mentioned that photoelasticity is an engineering tool, and as end users, people want to know which technology to choose for a particular application. In these terms, various technologies are reviewed, and the steps involved in each technology are briefly introduced in this paper. This work also mentioned that color images need to be captured for fully automated data collection, as well as emphasizing the future direction of digital photo elasticity research. In 2001, Lu and Lau [5] conducted a statistical experimental study to systematically analyze the influence of various process parameters on lens contour errors. The process parameters studied included injection speed, holding pressure, and mold temperature. As optical lenses require precise control of the surface profile, determination of the processing conditions for lens molding is complicated. The purpose of this work was to experimentally study the influence of molding conditions on the surface profile of injection molded lenses. The contour error is related to the mold shrinkage rate and the residual stress in the molded lens.
Before the year 2000, although there have been research studies in the field of optics, it can be seen that most of them are based on traditional physical analysis, such as the well-known two-dimensional photoelastic analysis method. However, there are few specific research methodologies. In 2003, Chen and Gao [6] studied the influence of the packing profiles on the quality of injection molded parts and how the correct settings of the holding pressure are critical to injection molding quality. The effects of different types of packing profiles on part weight, shrinkage, flash, thickness distribution, and uniformity were studied; it was recommended to specifically improve these quality attributes through the selection and determination of appropriate profile types. In 2006, Matthew et al. [7] investigated how an optical bench test system can be configured to allow interactive optical alignment during testing. To optimize performance, the design, analysis, the assembly method, and the optical bench test results for a miniature plastic injection molded lens used a fiber optic confocal reflectance microscope. Before integrating the five-lens plastic objective into a confocal microscope for in vivo imaging of cells and tissue, it was tested as a stand-alone optical system. In 2005, Ajovalasit and Petrucci [8] proposed the combined use of RGB and phase stepping photoelasticity. This method has the following characteristics: the maximum measurable order is greater than that of the RGB method, and it has the ability to determine the total fringe order without unwrapping. In 2007, Ajovalasit et al. [9] noted how the availability of image acquisition systems has led to the development of monochromatic light and white light digital photoelasticity. White light, in particular, is mainly used for the following methods: spectral content analysis, RGB photoelasticity, and phase shifting photoelasticity. To reduce the influence of isochromatic fringes, phase-shift photoelasticity in the color domain has been effectively used to determine isoclinic parameters. A method for determining the order of the isochromatic fringe was also proposed in this paper. In 2008, Tsai and Hsieh [10] conducted research to improve the quality of injection molded lenses by implementing the define, measure, analyze, improve and control (DMAIC) program based on the Six Sigma method. First, the factors that are critical to quality (CTQ) are determined according to the customer’s quality requirements, and then determination of the causal factors of the lens features within the processing test window takes place. The analysis program uses the Taguchi design-of-experiment (DOE) method to screen the relevant process parameters during the injection process, which greatly improves the contour accuracy of the molded lens. In 2009, Weng et al. [11] investigated how residual stress in microlens arrays is difficult to measure and characterize. In this paper, the birefringence method was used to evaluate the residual stress in the injection-molded microlens array, and the finite element simulation method was used to predict their distribution. Comparable results were obtained from experiments and simulations that found that mold temperature was the most important processing parameter. The higher the mold temperature, the smaller the value of the maximum residual stress. The birefringence method is suitable for measuring the residual stress in micro-optical injection molded plastic devices.
Around 2000–2009, traditional physical analysis was also continued after another related specific research methodology had emerged, such as the Taguchi design-of-experiment (DOE) method, as well as the analysis of the quality of injection molded lenses by implementing programs based on the Six Sigma method. However, there is still a long way to go for the introduction of full automation and Industry 4.0 in the future. In 2009, Weng et al. [12] mentioned that the optical quality of plastic lenses in microlens arrays is extremely sensitive to the existence of residual stress. The distribution of residual stress and birefringence of these microlens arrays was investigated in this paper and it was found that the maximum residual stress always appears in the regions near the gate. In 2010, Ajovalasit et al. [13] proposed a standard error function. Due to the discrete spectrum of the light source, the filament lamp can find retardations up to about four fringe orders, while the fluorescent lamp can determine higher fringe orders. In 2011, Ajovalasit et al. [14] analyzed the residual stress in glass using a photoelastic method. This paper considers the determination of membrane residual stress in a glass plate through automatic digital photoelasticity (RGB photoelasticity) under white light. This method is used to analyze the residual stress of tempered glass membranes. The proposed method can effectively replace the white light-based manual methods that are currently provided by certain technical standards. In 2014, Ajovalasit et al. [15] mentioned how the measurement of residual stress is especially important in the glass industry. As glass is a photoelastic material, the photoelastic method is usually used to analyze the residual stress in the glass. This paper considers the use of a digital photoelastic method to measure the residual stress of glass plates. These methods can effectively automate the manual methods currently specified in certain standards.
In 2014, Guevara-Morales and Figueroa-López [16] reported that residual stress is caused by flow and heat. Their paper focused on the processing parameters that have the greatest influence on residual stress during the injection molding process, and found that residual stress not only affects warpage, but also affects other material properties. Residual stress acts internally at room temperature and has the same effect on the material as externally applied stresses, resulting in product shrinkage and warpage. In 2015, Jansen [17] noted that in the molding process, due to the thermal contraction during the cooling process and the local pressure history during the solidification process, residual stress is formed. This paper proposed a model that relates residual stress, product shrinkage, and warpage to the temperature and pressure history during molding. Accurate excimer laser layer removal measurements are needed to verify the predicted residual stress distributions. In 2013, Pak et al. [18] studied an indentation method as a method to measure the residual stress in injection molded polymer samples because the destructive methods limit the reuse of measured parts, and it is impossible to apply destructive methods to small and complex parts. By comparing the results of the load-displacement curve with the indentation depth, the residual stress distribution of the injection molded part could be calculated. In 2014, Xie et al. [19] studied the influence of gate size on the cavity filling pattern and residual stress of injection molded parts. A total of three rectangular gates of different sizes were used, and experiments were conducted using a dynamic visualization system. A flow visualization mold was specially designed and manufactured for this research. A stress viewer was used to characterize the residual stress of the molded samples, where it was found that an undersized gate size has many adverse effects on the filling behavior and residual stress of molded parts; the larger the gate size, the faster the filling speed of the cavity and the smaller the residual stress on the part. In 2013, Kale and Ramesh [20] demonstrated the advantages of combining an advanced front-scanning method with two-point color adaptation through two samples, one of which was obtained by reflection photoelasticity and the other was a complex of simply connected stress-frozen slices. In 2006, Erzurumlu and Ozcelik [21] investigated minimizing the warpage and sink index according to the process parameters of plastic parts with different rib cross-section types and used the Taguchi optimization method to adjust the rib layout angle setup. In addition to the rib cross-section types and rib layout angle, process parameters such as mold temperature, melt temperature, and packing pressure were also considered, and a series of mold analyses were carried out to utilize warpage and sink index data. In 2019, Wu et al. [22] provided a fuzzy comprehensive evaluation system for evaluating parts by using performance indicators as evaluation factors and determined the importance of factors based on expert scoring methods. However, an analysis of the measurement results revealed that it is more biased towards 3D printing, and so the ranking and evaluation of effective performance indicators could not be evaluated in a broader sense.
Between 2009 and 2018, relevant specific research methods have begun to focus on the data report of residual stress. This data report is a pre-work for the use of big data, but such tedious and complex data seems to be unable to be used handily. The Industry 4.0 seems to be one step away, the main reason for which appears to be that no one has proposed a set of recognizable performance evaluation (RPE) methods for these complex big data, which means that it is unclear as to which district the corresponding data results go to. This is an important indicator for obtaining big data key. In 2019, Wang et al. [23] published the compelling finding that the modulus and hardness of each layer decreased first and then increased as the injection speed increased under a higher melt temperature. Meanwhile, the opposite trend was observed at a lower melt temperature. In 2018, Loaldi et al. [24], established a detailed uncertainty budget for the dimensional measurements of the replicated Fresnel lenses, considering specifically peak-to-valley (PV) step height and the pitch of the grooves. In 2019, Chung [25] found that, according to the simulation results, the use of conformal cooling channels can reduce the surface temperature difference of the melt, ejection time, and warpage. Moreover, the optimal process parameters obtained from the design of experiments improved the fringe pattern and eliminated the local variation of birefringence. In 2020, Kim et al. [26] found that conventional injection methods and injection processes like injection compression molding (ICM) are becoming more complex and harsher with high-speed injection at high mold and melt temperatures, with these approaches leading to a change in physical properties. In 2020, Ren et al. [27], introducing optical injection, found that, under proper optical injection parameters, two sub-combs originating from two orthogonal polarization components of the VCSEL(vertical-cavity surface-emitting laser) can splice into a broadband total-OFC(optical frequency comb). In 2020, Huang et al. [28] obtained results regarding optical-microscopy images and mold-cavity pressure distributions which indicated that the weldline tensile strength and the interface compatibility between fibers and melts at the weldline region during the molding stage were higher in their use.
When summarizing the literature related to this research, the focus of various scholars is the use of binarized residual stress images for the detection, and then optical delay detection, or the use of image processing technology to estimate photoelastic fringe order and phase angle. However, there is little interest in the determination of the injection molding parameters in terms of advantages and disadvantages for the injection component after the residual stress is generated. Only by constructing a widely accepted interpretation benchmark can a basic improvement process be established. In 2018–2019, Chang [29,30] obtained accurate reference data using the recognizable performance evaluation (RPE) method and determined the corresponding number (σ-sigma) of the distribution of each measurement region, so this paper attempts to introduce fuzzy theory to obtain excellent research results, then calculate the attribution level of the measured item. By providing a direct differentiation of the defuzzification attribution reduction interval to manage the distribution yield of each frequency distribution, conflicts in test performance evaluation that may occur in various fields can be resolved by directly evaluating the predicted results. For quantifiable performance evaluation, this result further distinguishes the landing interval.
3. Research Purpose and Moldflow Simulation Process
This paper focuses on the mass production of optical polymer white light material products with a molding design that negates the need for major secondary processing. The residual birefringence evaluation method can determine the residual stress increase trend using the polarization measurement and the photoelastic measurement methods. The stress force distribution on the transparent biaxial material can be directly observed, and the experimental simulation analysis is able to obtain the best manufacturing process, in terms of the effect of the optical lens, by finding the most suitable measurement method to investigate the influence of residual birefringence on the optical quality of the aspheric lens. When the recognizable stress value of the product has been detected, and the results of the photoelastic measurement of the residual birefringence in the optical component are digitized, then the related big data can be obtained. This is of great significance in realizing the intelligent transformation and application of the product in the manufacturing industry.
Polymer processing rheology is used to establish the mold flow simulation analysis of basic heat transfer to create a physical and mathematical model of the flow and heat transfer of the molten plastic in the mold. This model can simulate the change of the molten plastic during the injection molding process, and observable temperature and pressure state changes during this process can be used to solve issues such as the long period needed for mold design in the past and the inability to conduct a comprehensive analysis of materials and design schemes to find a better molding scheme (as shown in Figure 1). The use of mold flow simulation analysis help designers, in the initial mold design, to understand the influence of molding parameters on the structure and performance of plastic parts.
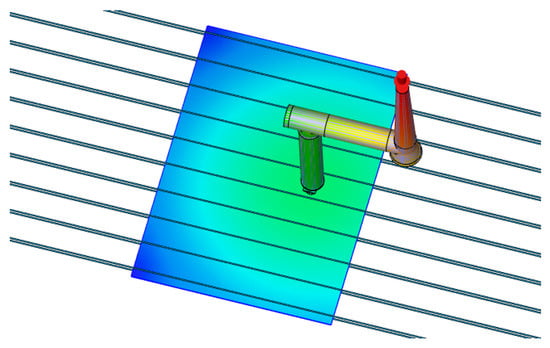
Figure 1.
Moldflow simulation process for white light components.
Mold flow simulation analysis provides a scientific basis for designing products, including: 1. Molded product design—understanding the impact of product thickness, gate location and quantity, and runner system design, on product quality. When providing accurate data to designers, it is not necessary to rely solely on the designer’s experience to find the best product design, which greatly reduces the design time. 2. Plastic mold design—optimizing the mold size, gate position, gate number, gate type, runner size and cooling system to simulate the trial conditions of various design methods, which has the potential to reduce the number of mold repairs after the mold is opened, thus significantly reducing the idle time required during mold repair, as well as improving mold quality. 3. Molding parameters—as the injection molding process is simulated, possible defects in the molded product can be found, and parameters such as mold temperature, plastic temperature, injection pressure, and holding pressure can be adjusted to determine the best molding parameters, which improves product molding quality and reduces trial time. Mold flow analysis technology is widely used to reduce the molding design cycle, improve production efficiency, and ensure product quality, thereby reducing costs; predictions such as filling, holding pressure, cooling, and warpage of the product can be carried out, and the design method of the product and the influence of cooling time can be discussed.
4. Research Methods
In terms of traditional performance evaluation, the experimental data that are usually obtained have a vector and a data unit, but during the evaluation, the experimental data often cannot be assigned or compared and verified by the vector or data unit, which is a difficult threshold. Therefore, it is clearly indicated that the comparison of performance verification cannot be based only on the evaluation data obtained; performance verification must also be based on the evaluation data of quantifiable analysis technology (as shown in Figure 2). This is because, if comparable quantifiable values were not obtained by the experimental results, we would be comparing apples and oranges, and so could not derive any meaning from heterogeneous data.
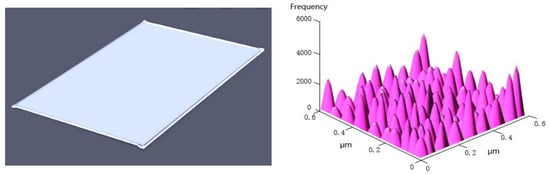
Figure 2.
Experiment of dimension tolerance.
The allowable error size and error compensation of optical parts in the manufacturing process are standardized so that the quality assurance unit and the user can choose the appropriate error level according to the best economic principle in achieving the required assembly coordination or interchangeability range. In the RPE analysis and evaluation method, there can be a more comprehensive and single-depth evaluation explanation, but the application of fuzzy theory requires defuzzification of the actual intervals. The interval can be directly compared with the analysis and evaluation, as shown in the following table, and the corresponding frequency level is obtained: 1, sigma tolerance standard is around 68.27%; 2, sigma tolerance standard is around 95.45%; 3, sigma tolerance standard is around 99.73%; 4, sigma tolerance standard is around 99.99366%; 5, sigma tolerance standard is around 99.99994%; and the tolerance standard is around 99.9999993% for 6 sigma. Among these frequency levels, the accuracy of 5 and 6 sigma is too high, and the current basic sampling tolerance does not meet such high standards. Therefore, in this paper, we can directly define values of 68.27% or less for 1 sigma (on the right side of the red area) and they are given an effective score of 1; values in the range of 68.27–95.45% are defined as 2 sigma (on the right side of the orange and yellow area) and are given an effective score of 2; values in the range of 95.45~99.73% are defined as 3 sigma (on the right side of the blue and green area) and are given an effective score of 3; values that are 99.73% or higher are defined as 4 sigma (the left side of the blue area), and are given an effective score of 4. The detailed information is shown in Table 1.

Table 1.
The SD, MSD, and S/N of white light components’ residual stress defects area.
Fuzzy theory makes outstanding science and technology more precise; it can determine key points and also corrects disambiguation, making fuzzy phenomena a dead end in scientific research. Fuzzy theory is inherently fuzzy, but the fuzzy phenomenon can also completely capture relevant information. Fuzzy theory also humanizes the physical quantitative definition interface, making the communication and relationship between evaluations closer. You can better understand the language and direction of the instruction objective, so as to obtain artificial intelligence—a more reasonable solution.
According to the use of fuzzy logic to solve issues, the three most common procedures are as follows:
- (1)
- Obtain fuzzy rules.
- (2)
- Attribute the function settings.
- (3)
- Fuzzification.
The effectiveness of residual stress evaluation in this study is an example case study, and: (A) Fuzzy rules can be obtained directly—the detailed information is related to the frequency distribution. (B) Attribute the function settings: based on the sampling restriction principle, the preset function relationship here is a Gaussian distribution, so the preset is based on 1.0 degrees, and the distribution yield (the yield ratio) of each frequency distribution is the horizontal coordinates, and can be used as in the following degree of membership graph (as shown in Figure 3).
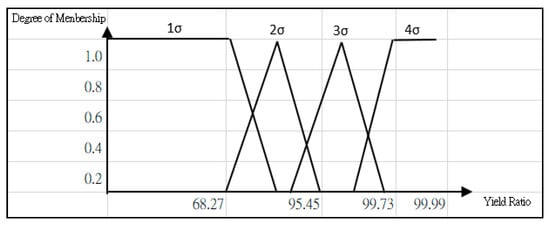
Figure 3.
Graph of degree of membership with yield ratio (Gaussian distribution).
(C) Defuzzification: There are many data on the frequency distribution, which cannot be listed one by one. However, here we take the first dataset “1.300000–1.560000” of frequency distribution—1371 randomly sampled below 500 mm—as an example, assuming that the lower limit of each σ(Sigma) is σLL (Low Limit), the middle limit is σML (Middle Limit), and the upper limit is σHL (High Limit), belonging to the attribution of 1σ, 2σ, 3, and 4σ.
- 1σ (Sigma): not in this range, the degree of attribution is 0
- 2σ(Sigma): (0/2σLL, 1/3σCL, 0/4σHL)== x = 0.6362, so the attribution is 0.6362.
- 3σ (Sigma): not in this range, the degree of attribution is 0.
- 4σ (Sigma): not in this range, the degree of attribution is 0.
The accuracy of the fuzzy value iteration solution depends on the quality of the fuzzy approximator, and the quality of the fuzzy approximator depends on the discretization. It is assumed that the discrete actions are fixed; therefore, our focus is on how to obtain a more appropriate amount. Therefore, to obtain a good quality approximation system, such prior knowledge can be obtained without actually calculating the optimal value function; when prior knowledge is not available, it can be regarded as a reliable basic function.
5. Case Study
This case study investigates the scientific problem of mass-producing optical polymer materials without secondary processability molding processes while reducing residual stress through the construction of an evaluation process that can quantify the residual stress value of the product. After the process control comparison is summarized, the statistical process parameters are made, which are part of the IMM big data parameters and are prepared in advance for AI Industry 4.0.
The residual stress defect areas of the optical components in this study are measured by the optical WPA software (as shown in Figure 4). This study’s main optical element area is determined through the area analysis of the residual stress defect area, displayed as the red line-framed area in the bar chart (as shown in Figure 5). Through the area analysis, it can be determined that the largest residual stress defect area in this main area has the value is 25.1204 nm, with the minimum value of 0.0005 nm, and the average value of 5.7736 nm; this data analysis is presented as an area chart table. As shown in Table 1, the optical WPA software performs area analysis on the optical components to obtain the relationship between the range and the frequency of the residual defect area. The range of the residual stress defect area was divided into 26 areas from 0 to 25, and the Taguchi experimental method was used to calculate the standard deviation (), the mean square deviation (), and the signal-to-noise () ratio corresponding to each area, as shown in Table 1 right side. Using the Taguchi method, only the size of the S/N ratio needs to be compared. The larger the S/N ratio, the better the quality features of the optical components.
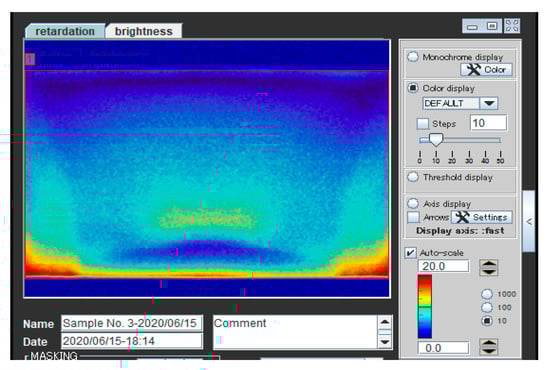
Figure 4.
Residual stress defects’ measurement interface.
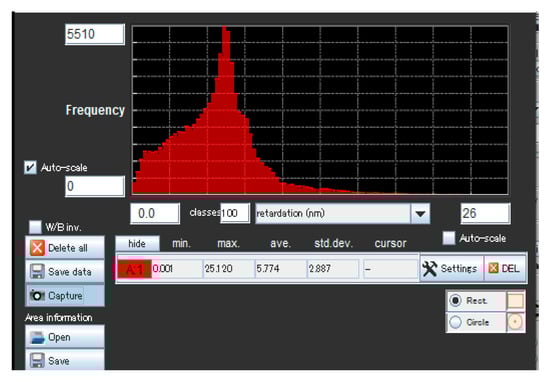
Figure 5.
Distribution of residual stress defects’ area.
In the statistical coefficient of variation, the normalized conditional measures the degree of dispersion of the probability distribution, which is defined as the ratio of the SD to the average value and is generally only defined when the average value is not zero and is generally is applicable when the average value is greater than zero. Because this case study is mainly based on the frequency of optical parts, its numerical meaning is that larger is best, and the coefficient of variation is also called the relative standard deviation or unit risk, and the relevant y value (average number) in the formula cannot be zero. Therefore, the following values should be defined by the value of the SD and calculated on a proportional scale, not the average. Among them: yi represents the number of i quality features; y is the average quality feature; and n is the number of the data section; the greater the number of samples, the better. Under the existing samples, we assume that if Table 1 is used as the complete Gaussian distribution, we can infer SD = 1432, then we can record the difference of σ-sigma separately for:
- 1σ-Sigma→977.84
- 2σ-Sigma→1367.14
- 3σ-Sigma→1428.44
- 4σ-Sigma→1438.43
The complete process parameters of traditional injection molding include about 20 to 30 piston strokes, while larger systems can even reach more than 40 strokes, but not all these parameters affect the main focus of product defect formation. If the molding defects are distinguished based on the display principle, the key one to three influencing factors are sufficient to represent an improvement plan for phased manufacturing. The S/N ratio corresponding to the 0–25 zone (as shown in Figure 6) is obtained.
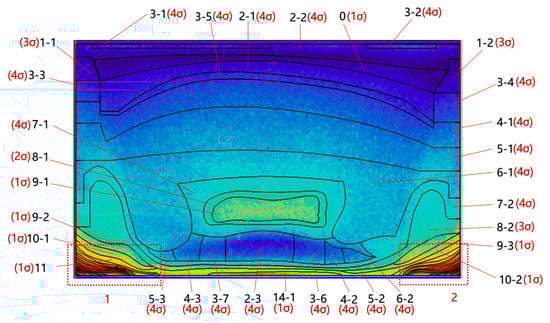
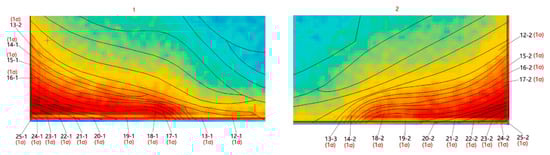
Figure 6.
Distribution of white light components’ residual stress defects area.
As shown in Table 1, the optical WPA software performs area analysis on the optical components to obtain the relationship between the range and the frequency of the residual stress defect area. The range of the residual stress defect area was divided into 26 areas from 0 to 25, and the Taguchi experimental method was used to calculate the SD, the MSD, and the S/N ratio for each corresponding area (shown in Figure 7). Using the Taguchi method, only the size of the S/N ratio need to be compared. In this study, the larger the S/N ratio, the better the quality features of the optical components.
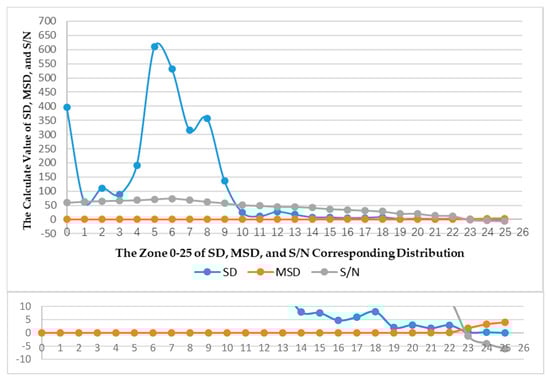
Figure 7.
The Zone 0–25 of SD, MSD, and S/N corresponding distribution.
The residual stress defect area of the optical components in this study are measured by the optical WPA software (as shown in Figure 4). This study’s main optical element area is determined through the area analysis of the residual stress defect area, displayed as the red line-framed area of the bar chart (as shown in Figure 5). Through the area analysis, it can be determined that the largest residual stress defect area in this main area has the value of 25.1204 nm, with the minimum value of 0.0005 nm, and the average value of 5.7736 nm. This data analysis is presented as an area chart table (as shown in Table 1). In Figure 8, we can find that using both recognizable fuzzy theory analysis and integrated process analysis, the evaluation process for quantifiable product residual stress values is reliable. For example, as the curves outlined in the two figures indicate, the SD and the optical element’s main area residual stress defect area have similar curves; their trends are consistent, which also proves that our calculations and speculations are correct.
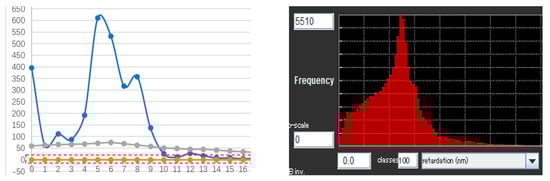
Figure 8.
The distribution for standard deviation trending.
In traditional statistical thinking, as long as you can determine the driving force behind the SD and MSD, you can ascertain which one is more suitable. However, with an actual physical fixed rate, each physical vector and physical unit are not exactly the same, so the SD and MSD alone are not enough to effectively determine the advantages and disadvantages of experimental quantification; for this reason, the S/N ratio calculation method that can determine the large and small unit that correspond to different physical vectors and physical units must be used to recognize complex big data database dependencies. Assuming that the final result of the big data database is just a bunch of data, which does not contain sigma recognizable tags, then fuzzy theory cannot be applied, and if it cannot be applied, it will not have the so-called theoretical value.
6. Conclusions
Here, we used a photoelastic stress compensation method for measurement verification along with fuzzy theory to reorganize a set of processes that can be used to evaluate the residual stress of a product, whereby the use of corresponding theoretical formulas can effectively quantify and measure the residual stress of the product.
A manufacturing forming process that lacks big data can be produced, but its convenience and immediacy are poor. Similarly, a manufacturing forming process that lacks recognizable fuzzy analysis can also be produced, but its convenience and interpretation cannot be immediately effective. Therefore, the recognizable fuzzy theory analysis and the integration processes that are established in this paper can effectively define the recognizable distribution of parameters that need to be optimized without changing the experimental structure of the molded product, which greatly defines the exact position of all analysis intervals in the effective big data experimental data; it provides a recognizable and reliable correction basis for subsequent mold maintenance or the re-adjustment of parameters.
Recognizable fuzzy theory analysis and integration processes realize an innovative method to optimize the recognizable distribution of parameters. In the past, evaluation relied on mold flow simulation analysis software and factory engineers to blindly adjust machines, which had limited effect, but recognizable fuzzy theory analysis and integrated process methods can provide designers with improvements to make changes in the areas of optical materials or alternative geometric designs. Both recognizable fuzzy theory analysis and the integrated process method can effectively quantify the configuration parameters in injection molding to improve stability, and thereby improve the reliability and quality output of injection molded products.
Author Contributions
Original propose, H.-J.C.; Data curation, Z.-M.S. and G.-Y.Z.; Methodology, H.-J.C.; Project administration, Z.-F.M.; Writing—original draft, H.-J.C. All authors have read and agreed to the published version of the manuscript.
Funding
This research was funded by the 2019 Guangdong Province Science and Technology Special Fund Project—Major Science and Technology Special Project (2019ST102).
Institutional Review Board Statement
This study did not involve humans or animals
Informed Consent Statement
This study did not involve humans.
Data Availability Statement
This study did not report any data.
Acknowledgments
Funding by the Guangdong Province Science and Technology Special Fund Project—Major Science and Technology Special Project (2019ST102) and Technical Support by Shantou Ray-Bonus Additive Manufacturing Research Institute Co. Ltd which are gratefully acknowledged.
Conflicts of Interest
The authors declare no conflict of interest.
References
- Ajovalasit, A.; Barone, S.; Petrucci, G. Towards RGB photoelasticity: Full-field automated photoelasticity in white light. Exp. Mech. 1995, 35, 193–200. [Google Scholar] [CrossRef]
- Chen, Y.C.; Chen, C.H.; Chen, S.C. Effects of processing conditions on birefringence development in injection molded parts. II. Experimental measurement. Polym. Int. 1996, 40, 251–259. [Google Scholar] [CrossRef]
- Yoneyama, S.; Takashi, M. A new method for photoelastic fringe analysis from a single image using elliptically polarized white light. Opt. Lasers Eng. 1998, 30, 441–459. [Google Scholar] [CrossRef]
- Ramesh, K.; Mangal, S. Data acquisition techniques in digital photoelasticity: A review. Opt. Lasers Eng. 1998, 30, 53–75. [Google Scholar] [CrossRef]
- Lu, X.; Khim, L.S. A statistical experimental study of the injection molding of optical lenses. J. Mater. Process. Technol. 2001, 113, 189–195. [Google Scholar] [CrossRef]
- Chen, X.; Gao, F. A study of packing profile on injection molded part quality. Mater. Sci. Eng. A 2003, 358, 205–213. [Google Scholar] [CrossRef]
- Chidley, M.D.; Carlson, K.D.; Richards-Kortum, R.R.; Descour, M.R. Design, assembly, and optical bench testing of a high-numerical-aperture miniature injection-molded objective for fiber-optic confocal reflectance microscopy. Appl. Opt. 2006, 45, 2545–2554. [Google Scholar] [CrossRef] [PubMed]
- Ajovalasit, A.; Petrucci, G. Developments in RGB photoelasticity. Appl. Mech. Mater. 2005, 3, 205–210. [Google Scholar] [CrossRef]
- Ajovalasit, A.; Petrucci, G.; Scafidi, M. Phase shifting photoelasticity in white light. Opt. Lasers Eng. 2007, 45, 596–611. [Google Scholar] [CrossRef]
- Lo, W.; Tsai, K.; Hsieh, C. Six Sigma approach to improve surface precision of optical lenses in the injection-molding process. Int. J. Adv. Manuf. Technol. 2009, 41, 885–896. [Google Scholar] [CrossRef]
- Weng, C.; Lee, W.; To, S. Birefringence techniques for the characterization of residual stresses in injection-moulded micro-lens arrays. Polym. Test. 2009, 28, 709–714. [Google Scholar] [CrossRef]
- Weng, C.; Lee, W.; To, S.; Jiang, B.-Y. Numerical simulation of residual stress and birefringence in the precision injection molding of plastic microlens arrays. Int. Commun. Heat Mass Transf. 2009, 36, 213–219. [Google Scholar] [CrossRef]
- Ajovalasit, A.; Petrucci, G.; Scafidi, M. RGB photoelasticity: Review and improvements. Strain 2010, 46, 137–147. [Google Scholar] [CrossRef]
- Ajovalasit, A.; Petrucci, G.; Scafidi, M. RGB photoelasticity applied to the analysis of membrane residual stress in glass. Meas. Sci. Technol. 2011, 23, 025601. [Google Scholar] [CrossRef]
- Ajovalasit, A.; Petrucci, G.; Scafidi, M. A critical assessment of automatic photoelastic methods for the analysis of edge residual stresses in glass. J. Strain Anal. Eng. Des. 2014, 49, 361–375. [Google Scholar] [CrossRef]
- Guevara-Morales, A.; Figueroa-López, U. Residual stresses in injection molded products. J. Mater. Sci. 2014, 49, 4399–4415. [Google Scholar] [CrossRef]
- Jansen, K. Residual stresses in injection molded products. AIP Conf. Proc. 2015, 1695, 020007. [Google Scholar]
- Pak, S.Y.; Kim, S.Y.; Kim, S.H.; Youn, J.R. Measurement of residual stresses in polymeric parts by indentation method. Polym. Test. 2013, 32, 946–952. [Google Scholar] [CrossRef]
- Xie, P.; Guo, F.; Jiao, Z.; Ding, Y.; Yang, W. Effect of gate size on the melt filling behavior and residual stress of injection molded parts. Mater. Des. 2014, 53, 366–372. [Google Scholar] [CrossRef]
- Kale, S.; Ramesh, K. Advancing front scanning approach for three-fringe photoelasticity. Opt. Lasers Eng. 2013, 51, 592–599. [Google Scholar] [CrossRef]
- Erzurumlu, T.; Ozcelik, B. Minimization of warpage and sink index in injection-molded thermoplastic parts using Taguchi optimization method. Mater. Des. 2006, 27, 853–861. [Google Scholar] [CrossRef]
- Wu, L.; Xu, L.; Li, X.; Feng, M. Fuzzy Evaluation of Rapid Prototyping Methods for Latticed Silicone Pieces. Silicon 2020, 12, 1995–2004. [Google Scholar] [CrossRef]
- Wang, L.-X.; Zhang, Y.; Jiang, L.; Yang, X.; Zhou, Y.; Wang, X.; Li, Q.; Shen, C.; Turng, L.-S. Effect of injection speed on the mechanical properties of isotactic polypropylene micro injection molded parts based on a nanoindentation test. J. Appl. Polym. Sci. 2019, 136, 47329. [Google Scholar] [CrossRef]
- Loaldi, D.; Quagliotti, D.; Calaon, M.; Parenti, P.; Annoni, M.; Tosello, G. Manufacturing signatures of injection molding and injection compression molding for micro-structured polymer fresnel lens production. Micromachines 2018, 9, 653. [Google Scholar] [CrossRef] [PubMed]
- Chung, C.-Y. Integrated Optimum Layout of Conformal Cooling Channels and Optimal Injection Molding Process Parameters for Optical Lenses. Appl. Sci. 2019, 9, 4341. [Google Scholar] [CrossRef]
- Kim, M.; Lee, J.; Yoon, K. An Experimental Study on Color Shift of Injection-Molded Mobile LGP Depending on Surface Micropattern. Polymers 2020, 12, 2610. [Google Scholar] [CrossRef] [PubMed]
- Ren, H.; Fan, L.; Liu, N.; Wu, Z.; Xia, G. Generation of Broadband Optical Frequency Comb Based on a Gain-Switching 1550 nm Vertical-Cavity Surface-Emitting Laser under Optical Injection. Photonics 2020, 7, 95. [Google Scholar] [CrossRef]
- Huang, P.-W.; Peng, H.-S.; Choong, W.-H. Mold-Face Heating Mechanism, Overflow-Well Design, and Their Effect on Surface Weldline and Tensile Strength of Long-Glass-Fiber-Reinforced Polypropylene Injection Molding. Polymers 2020, 12, 2474. [Google Scholar] [CrossRef]
- Chang, H.-J. Using a Cone Frustum Part in the Evaluation of Multiple Types of Five-Axis Machine Tools with the Taguchi Method. In Proceedings of the 2018 IEEE International Conference on Advanced Manufacturing (ICAM), Yunlin, Taiwan, 16–18 November 2018; IEEE: New York, NY, USA, 2018; pp. 209–212. [Google Scholar]
- Chang, H.-J. Performance Evaluation of Multi-type Five-axis Machine Tool with Recognizable Performance Evaluation by Fuzzy Theory. In Proceedings of the 2019 Prognostics and System Health Management Conference (PHM-Qingdao), Qingdao, China, 25–27 October 2019; IEEE: New York, NY, USA, 2019; pp. 1–5. [Google Scholar]
Publisher’s Note: MDPI stays neutral with regard to jurisdictional claims in published maps and institutional affiliations. |
© 2021 by the authors. Licensee MDPI, Basel, Switzerland. This article is an open access article distributed under the terms and conditions of the Creative Commons Attribution (CC BY) license (http://creativecommons.org/licenses/by/4.0/).