Article

UHPLC-MS Method for the Analysis of the Molecular Adjuvant Sulfavant A

1
Bio-Organic Chemistry Unit, National Research Council-Institute of Bio-Molecular Chemistry (ICB-CNR), Via Campi Flegrei 34, 80078 Pozzuoli, Italy
2
BioSearch Srl., Villa Comunale c/o Stazione Zoologica “A.Dohrn”, 80121 Napoli, Italy
3
Institute of Protein Biochemistry, National Research Council, Via Pietro Castellino 111, 80131 Naples, Italy
4
Department of Biology, University of Napoli “Federico II”, Via Cupa Nuova Cinthia 21, 80126 Napoli, Italy
*
Author to whom correspondence should be addressed.
These authors contributed equally to this work.
Appl. Sci. 2021, 11(4), 1451; https://doi.org/10.3390/app11041451
Submission received: 7 January 2021 / Revised: 29 January 2021 / Accepted: 2 February 2021 / Published: 5 February 2021
(This article belongs to the Special Issue Drugs from Marine Sources)

Abstract

:
A fast and sensitive method that is based on Ultra High Performance Liquid Chromatography coupled with High Resolution Mass Spectrometry (UHPLC-HRMS) for the measurement of Sulfavant A, a molecular adjuvant with a sulfolipid skeleton, is described. The method has been validated over the linearity range of 2.5–2000 ngmL−1 using a deuterated derivative (d70-Sulfavant A) as internal standard. Chromatographic separation is based on a UHPLC Kinetex® 2.6 µm PS C18 column and a gradient of methanol in 0.32 mM ammonium hydroxide solution buffered at pH 8. The lowest limit of quantification of Sulfavant A was 6.5 ngmL−1. The analytical procedure was tested on an extract of mice lung spiked with 30, 300, and 1500 ng of Sulfavant A. The analysis revealed a precision and accuracy value (as a mean value of all the quality control samples analyzed) of 4.7% and 96% in MeOH and 6.4% and 93.4% in the lung extracts, respectively.

1. Introduction

Sulfur-containing lipids and, in particular, sulfoquinovosyl-diacylglycerols (SQDGs) have been proposed as factors in inflammation, immunity and infection. However, despite their dissemination, fast and accurate ultra-performance liquid chromatography–mass spectrometry (UPLC-MS) or ultra high-performance liquid chromatography coupled with mass spectrometry (UHPLC-MS) methods for their quantification are still scarce and mostly focused on sulphate sterols [1,2,3,4] and sulfatides [5,6,7]. Most of the lipid analysis, also containing sulfolipids, as reported in the literature, are based on a shotgun lipidomic approach [2,3] or traditional reverse phase (RP) - HPLC columns usually associated with complex mixtures of solvents used as eluents in order to obtain a good quality chromatogram [8].
In our ongoing drug discovery exploration for new active metabolites, we recently reported the immunomodulatory activity of 1,2-O-distearoyl-3-O-β-d-sulfoquinovosylglycerol, named Sulfavant A (1) (SULF A; Figure 1). SULF A is a synthetic glycolipid that is featured by a sugar unit of sulfoquinovose. The molecule is the prototype for a new class of molecular adjuvants inspired by natural α-sulfoquinovosyl-diacylglycerols (α-SQDGs) occurring in photosynthetic organisms [9]. SULF A (1) triggers in vitro maturation of dendritic cells, the master control of innate immune response, and in in vivo antigen-specific immunization [10,11,12,13,14,15]. The initiation of a systemic immune response by the stimulation of innate immune cells correlates to adjuvanticity and Pattern Recognition Receptors (PRR) - mediated signaling. SULF A is under preclinical trials as a vaccine adjuvant and its efficacy has been already proven in a murine model of vaccine against melanoma [9]. Interestingly, the product is not cytotoxic, but treated mice do not show progress of the tumour for more than 10 days after subcutaneous injection of B16F10 melanoma cells.
In the present study, we seek a robust and fast analytical method for the quantification of SULF A in biofluids and tissues during preclinical studies. To this aim, we report the implementation of a novel Ultra High-Performance Liquid Chromatography-High Resolution Mass Spectrometry (UHPLC-HRMS) method, together with the use of deuterated Sulfavant A (d70-SULF A) (2) as internal standard (IS).

2. Materials and Methods

2.1. Chemicals and Reagents

SULF A (1) was prepared, as reported by Manzo et al. [9,10] and purified by HPLC before the analysis. The compound was eluted from a Phenomenex Phenl-Hexyl column (250 × 10 mm, 5 µm) in isocratic conditions using MeOH/H2O 87:13 for 20 min. and the solvent was removed by evaporation under reduced pressure. Chromatographic purification of synthetic lipids was carried out by a JASCO system (PU-2089 Plus quaternary gradient pump) that was equipped with a MD-2018 Plus photodiode array detector (JASCO Europe Srl, Cremella, Italy) and Sedex 85 high-sensitivity LT-ELS detector (SEDERE, Alfortville, Paris, France). The purity of 1 was verified by 1H NMR and LCMS.
UHPLC–HRESIMS analysis was performed on Q-Exactive hybrid quadrupole-orbitrap mass spectrometer (Thermo Scientific, Waltham, MA, USA) that was equipped with an Infinity 1290 UHPLC System (Agilent Technologies, Santa Clara, CA, USA). Methanol, water, and 25% ammonium hydroxide solution were all LC/MS grade. The chemical solvent and reagents were purchased from Merck Life Science S.r.l. (Milano, Italy).

2.2. Synthetic Strategy of d70-Sulfavant A

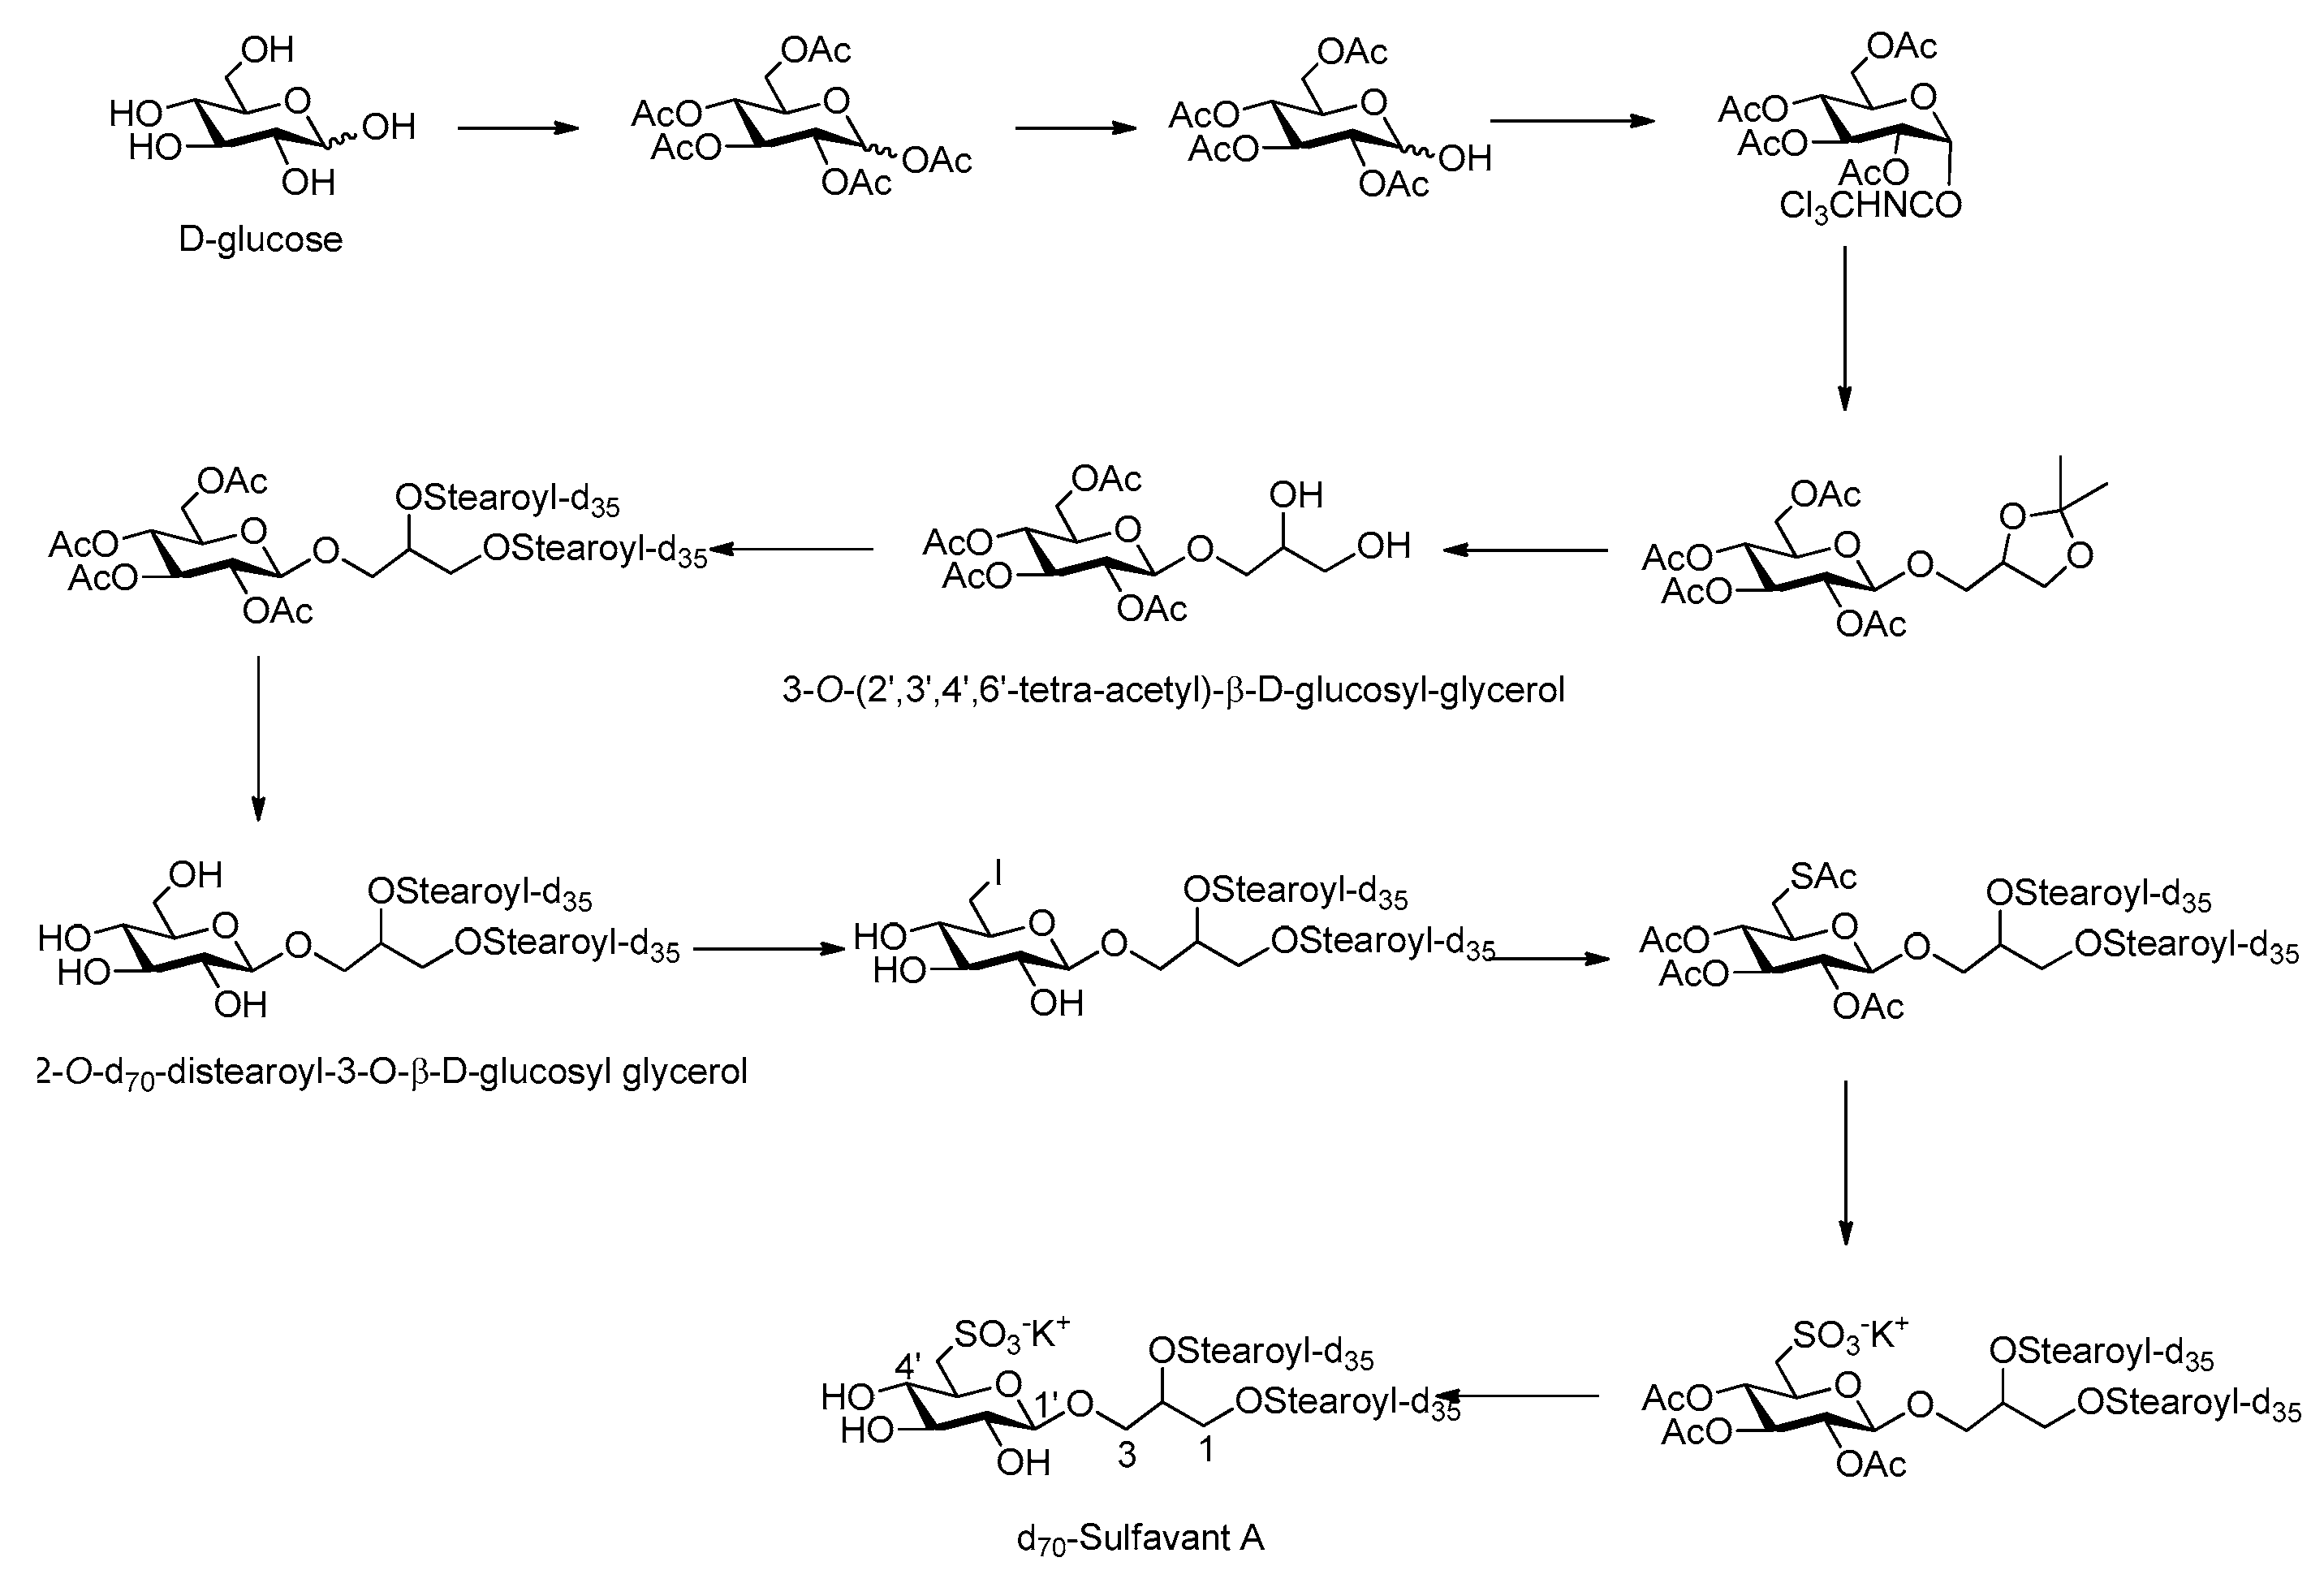
The synthesis of d70-SULF A was achieved by the ameliorated synthetic procedure for SULF A of Manzo et al. [10], which was adapted to the preparation of the analog totally deuterated on acyl portions; in detail, as compared to the literature procedure, deuterated stearic acid was used for the acylation of the 2′ 3′ 4′ 6′-O-tetracetyl-β-glucosyl-R/S-glycerol intermediate (Figure 2) [10,14,15]. Similarly to SULF A, compound 2 was purified by HPLC prior to use as an internal standard using the same experimental conditions.

2.3. Ultra-High-Performance Liquid Chromatography/High Resolution Mass Spectrometry (UHPLC/HRMS)

Chromatographic separations were achieved on UHPLC Kinetex® 2.6 µm PS C18 100 Å, LC Column 30 × 2.1 mm (Phenomenex, Italy), at 28 °C by a gradient elution of 0.32 mM ammonium hydroxide solution (0.005%), adjusted to pH 8.0 by acetic acid, and methanol (MeOH). Table 1 reports UHPLC gradient details. The flow rate was 0.5 mL min−1. The injection volume was 4 µL, and the autosampler was maintained at 10 °C. MS analyses were carried out in electrospray ionization (ESI) negative mode with source parameters, as follows: spray voltage of 3.0 kV, capillary temperature of 320 °C, S-lens RF level of 60, sheath gas flow rate of 50, and auxiliary gas flow rate of 30. Full MS scans were acquired over the range of 150–1800 Da with a mass resolution of 70,000. The target value (Automatic Gain Control-AGC) was 1 × 10⁶ and the maximum allowed accumulation time (IT) was 100 ms. For the data-dependent MS/MS (ddMS2) analyses, the peaks of interest were selected and fragmented with a stepped normalized energy of 20–40 eV. AGC was 1 × 10⁵ with IT 75 ms and 17, 500 mass resolution.

2.4. Standard Preparation and Stock Solution

SULF A and d70-SULF A were dissolved in methanol to obtain stocks solutions at a concentration of 100 µg mL−1 stored at −20 °C; the dissolution was performed by sonicating for 30 min. at 30 °C. These two solutions were used to evaluate the linearity, calibration curve, limit of detection, and matrix effect. The evaluation of the above parameters is based on chromatograms of SULF A (C45H85O12S; m/z 849.57672) and d70-SULF A (C45D70H15O12S; m/z 920.01609) that were obtained as base peak extraction at m/z 849.576 and 920.016, respectively, with a mass tolerance of 5 ppm (Figure 3).

2.5. Calibration Curve, Linearity and Detection and Quantitation Limits (LOD and LOQ)

Before the analysis, the stock solution was sonicated for 30 min. at 30 °C The calibration curve was obtained by spiking increasing concentrations of standard solution at 1, 2.5, 5, 10, 50, 100, 500, 1000, and 2000 ngmL−1. The average of three measurements was used for building up the calibration curve. The linearity of the calibration curve was also verified in the lipid extract matrix. Visual definition and the approach based on the “Standard Deviation of the Response and the Slope” (LOD = 3σ/S; LOQ = 10σ/S) was used in order to establish detection and quantitation limit [16].

2.6. Method Validation: Intra-and Inter-Day Accuracy and Precision

Three quality control (QC) samples of SULF A were prepared to validate the method: low-concentration (30 ngmL−1), medium-concentration (300 ngmL−1), and high-concentration (1500 ngmL−1). Validation for intra-day and inter-day assay accuracy and precision was assessed on three independent days while using a triplicate of three QC. Each batch of runs comprised mobile phase blanks, calibrators (eight samples spanning the range of 2.5–2000 ngmL−1), and quality control samples. Intra-day and inter-day accuracy and precision were determined by obtaining the mean concentration of the quality control samples from the calibration curve and the percent accuracy and coefficient of variation. The precision was expressed as a coefficient of variation [CV = (standard deviation/measured mean concentration) × 100], while the accuracy was expressed as [measured mean concentration/nominal concentration] × 100. The overall method accuracy and precision were determined by calculating the mean of accuracy and mean of the precision estimates, respectively, of all the quality control samples.

2.7. Evaluation of Matrix Effect on Mice Lung Extracts

The matrix effect (ME) was assessed on mice lung tissue post-extraction. Lipid extracts were achieved from five different frozen samples by homogenization of the tissues in MeOH (300 µL) at 12 °C for 2 min. and then following with MTBE extraction [17]. In detail, 1000 μL of MTBE were added to the samples and then left to mix for 5 min. Later, 250 μL of Milli-Q water was added and mixed again for 2 min. Subsequently, to induce the phase separation, the sample was centrifuged at 1000 g for 10 min. at 4 °C and the upper organic phase was recovered. Finally, the aqueous phase was re-extracted with MTBE, the upper phases combined, and the organic solvent removed under nitrogen stream. Each extract was weighted and resuspended in MeOH:CH2Cl2 (4:1) and then diluted with MeOH for LC/MS analysis.
Three different concentrations of SULF A (30, 300, and 1500 ngmL−1) were spiked into 50 µg mL−1 of lipid extracts, together with 50 ngmL−1 of IS (d70-SULF A), in order to evaluate normalized matrix effect (nME). Each concentration was compared with the corresponding solution in pure MeOH. When considering peak area as instrument response, the percentage of nME was calculated, as reported in [18]:
nME% = [(Asolvent/ISsolvent)/(Amatrix/ISmatrix) − 1] × 100
in which Asolvent = peak area of the analyte SULF A in MeOH; Amatrix = peak area of the analyte SULF A in the post-extraction spiked matrix; IS solvent = peak area of the Internal Standard d70-SULF A in MeOH; and, IS matrix = peak area of the Internal Standard d70-SULF A in the post-extraction spiked matrix.
Moreover, standards solutions at 2.5, 5, 10, 50, 100, 500, 1000, and 2000 ngmL−1 were also prepared in matrix (50 µg mL−1 of mice lung lipid extract) in order to evaluate whether the matrix effect (ME) affected the slope of the calibration curve. The average of three measurements was used. Chromatograms of SULF A and d70-SULF A (as in MeOH) were obtained as base peak extraction at m/z 849.576 and 920.016, respectively, applying a mass tolerance of 5 ppm.

3. Results and Discussion

3.1. Synthesis and Preparation of d70-Sulfavant A

The synthesis of d70-SULF A was achieved by the ameliorated synthetic strategy of Manzo et al. [10], which was adapted to the preparation of the analog with deuterated fatty acids (Figure 2). In detail, the procedure started with acetylation of D-glucose, followed by selective anomeric deacetylation by benzylamine. Coupling with 1,2-O-isopropylidene glycerol by trichloroacetimidate methodology [14,15,19,20] gave 3-O-(2′,3′,4′,6′-tetra-acetyl)-β-d-glucosyl-glycerol that was condensed with d35-stearic acid in order to obtain the intermediate 1,2-O-d70-distearoyl-3-O-β-d-glucosyl glycerol. The sulfonation of the 6′-carbon through an iodinate derivative in agreement with Manzo et al. [10] was performed to finally obtain d70-SULF A after the last hydrazinolysis step.

3.2. Method Development

Many of the studies of ultra- and ultra-high-performance liquid chromatography–mass spectrometry (UPLC- and UHPLC-MS) methods have addressed analysis of lipids [17,21]. However, no specific method for sulfoglycolipids has been reported so far.
UHPLC Kinetex® PS C18 column is a reversed-phase product that is recommended by the manufacturer for the analysis of polar compounds and weakly acidic compounds. We tested several eluting conditions with gradients of methanol with aqueous buffers at different pH and temperatures to optimize the chromatographic result for SULF A and d70-SULF A. The best result in terms of sensitivity, shape of the peak and retention time was obtained with a short gradient (run time 10 min.) of increasing amount of methanol in 0.32 mM ammonium hydroxide solution (0.005%), adjusted to pH 8.0 by acetic acid, at 28 °C. Deuterated analogue of SULF A (2), synthesized in-house, was also used during the tests as internal standard (IS). Figure 3 shows chromatograms obtained by base peak extraction of SULF A (analyte) and d70-SULF A (IS). The IS and the analyte eluted with a slightly different retention time due to the isotope effect at 2.9 and 3.0 min., respectively. The quantitation (LOQ) and detection (LOD) limits were 6.5 ngmL−1 and 1.9 ngmL−1, respectively, both established in methanol.

3.3. Linearity, Accuracy, Precision and Matrix Effect

The liquid chromatography-mass spectrometry (LC-MS) method was validated for linearity and by an evaluation of intra-and inter-day precision and accuracy in accordance with the currently-approved EMEA and FDA guidelines for the validation of bioanalytical methods [22,23]. Moreover, with the aim to demonstrate the consistency and robustness for the analysis of biological samples, we also tested the above-mentioned parameters in five different replicates of lipid extracts derived from mice lung tissues.
Samples of SULF A and d70-SULF A were tested in triplicates between 1 and 2000 ngmL−1. The resulting calibration curve was found to be linear in the concentration range between 2.5 and 2000 ngmL−1, as shown in Figure 4. Analogously, SULF A and d70-SULF A were spiked at the maximum concentration into MeOH and in a lipid extract of mice lung in MeOH in order to evaluate matrix effect (one of the five extracts available). Samples of the two calibration curves (in pure MeOH and in matrix) were carried out by dilution from the more concentrated solution. Table 2 outlines the slope values and R2 parameters of the calibration curves acquired at different days (T0 and T48). The R2 was found to be 0.999 and stable during the days (slight differences in the slope could be appointed to the variability linked to the instrument response). The difference in the mean ordinate between SULF A and d70-SULF A is in agreement with the isotope effect that can cause a different degree of ion suppression. However, although the ionization and chromatographic response was not identical, the peak area ratio of the analyte versus the IS was constant over the range of tested concentrations, with a correlation coefficient (r2) that is always higher than 0.9991.
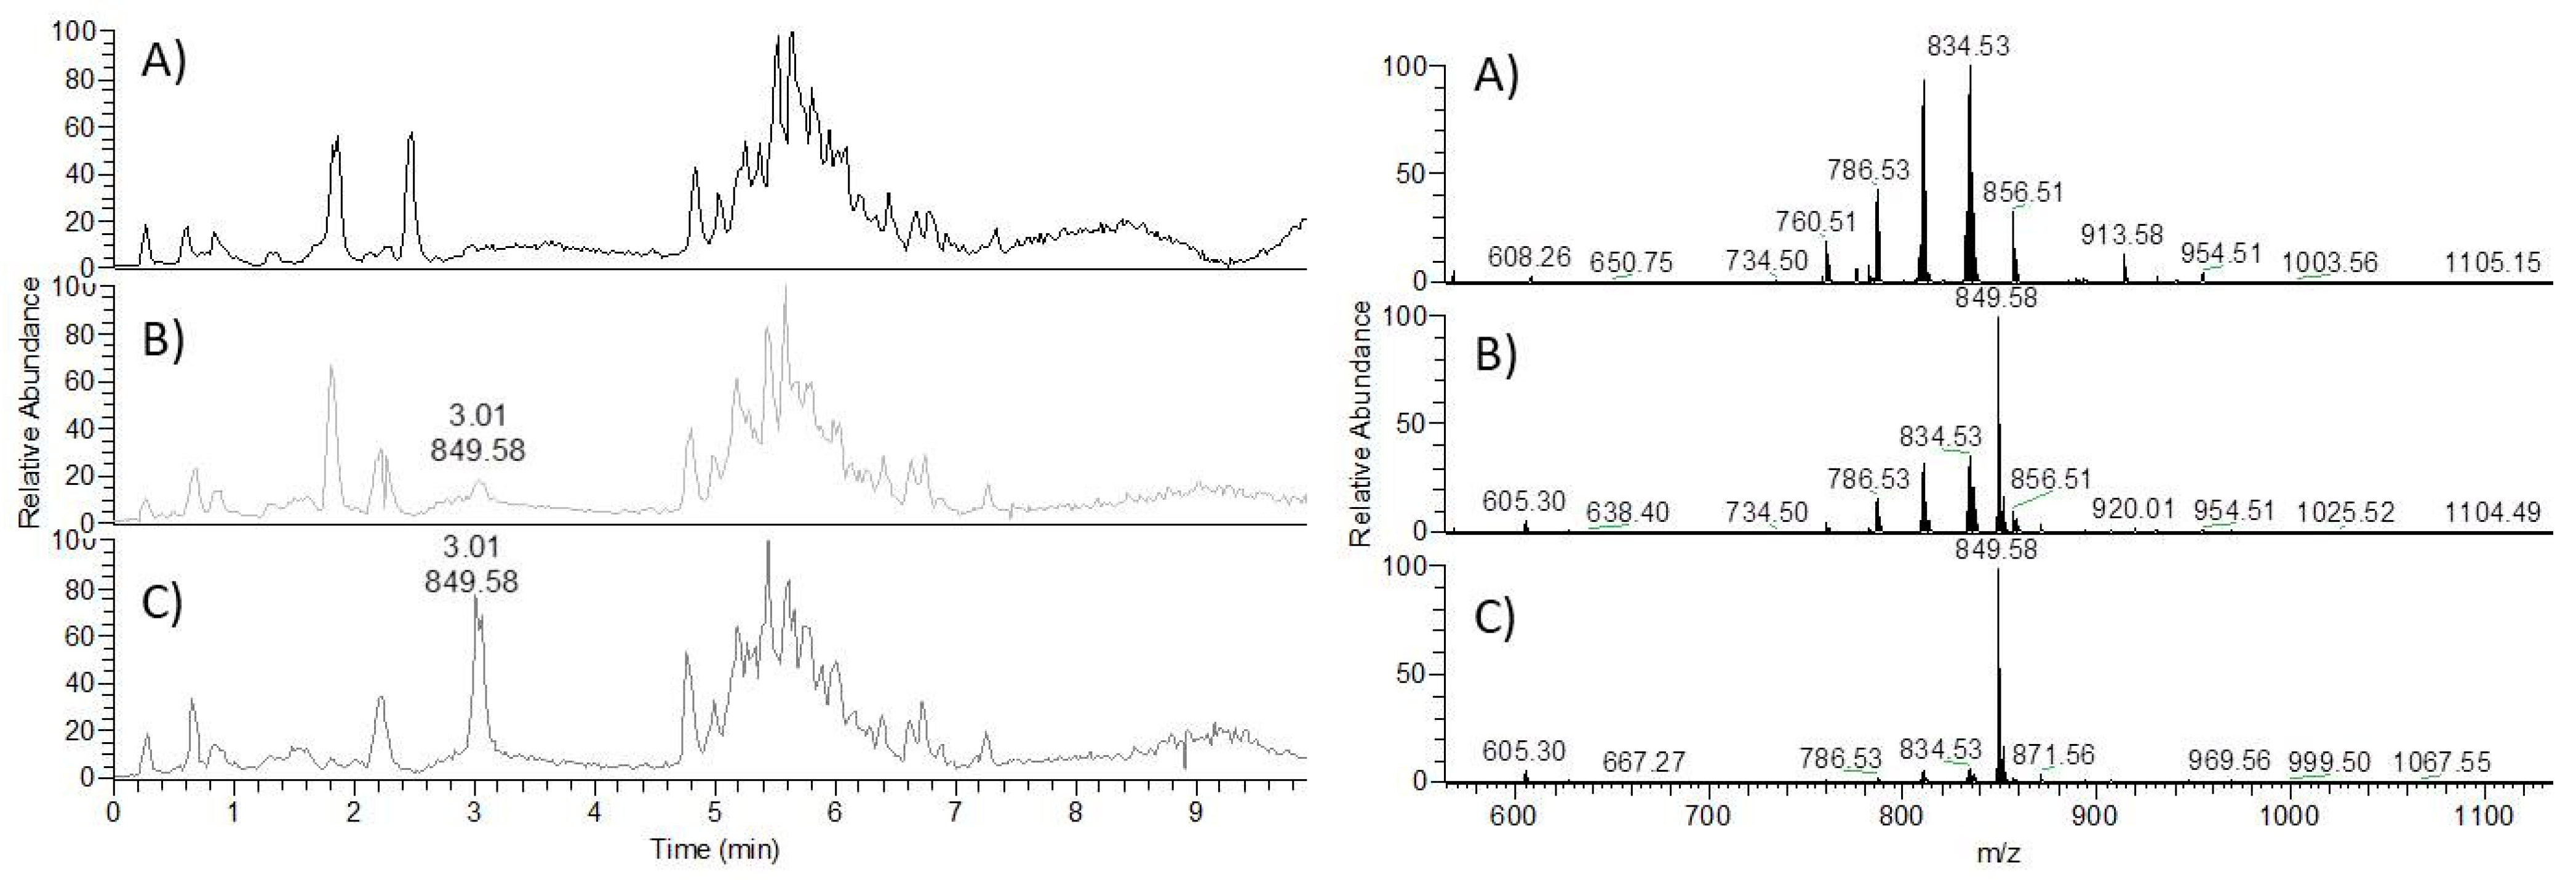
The matrix effect (ME) is one of the most important parameters to investigate during the development of an analytical method. In order to evaluate the ME, five mice lung lipid extracts were aliquoted and spiked with three different quantities (30, 300, and 1500 ng) of SULF A (Figure 5), while the same known amount of d70-SULF A (50 ng per sample) as IS was added to compare the area of the analyte in matrix with the area measured in pure MeOH (normalized matrix effect-nME). A higher CV was observed for the high concentrations in comparisons with the low ones, as can be seen in Table 3. However, all of the datasets (intra- and inter-day) passed the 15% acceptance criterion, with an overall nME average of 10%. This finding was the first evidence of the robustness of the proposed analytical procedure.
This analytical method allowed for the detection of SULF A at nanomolar concentration (LOD was below 2.5 ngmL−1) with a LOQ of 6.5 ngmL−1, in both only MeOH and in the presence of matrix. Indeed, at the LOD the analyte in the samples can be identified by only HR-MS, but it cannot be quantitatively determined with appropriate precision and accuracy, whereas, at starting from the calibration point at 5 ngmL−1, the peak of SULF A is also identifiable with MSMS and the signal appears to be defined and reproducible. Moreover, no carryover effect was detected during analysis of a blank sample after the injection of a standard sample at the highest calibration point (2000 ngmL−1).
The reliability of this UHPLC-MS method was evaluated by measuring intra-day and inter-day accuracy and precision (n = 3 in MeOH; n = 5 in matrix) of SULF A in quality control (QC) samples at three different concentrations (30, 300, and 1500 ngmL−1). Table 3 reports the results in intra-day and inter-day accuracy and precision. The accuracy of QC samples ranged from 84.2 to 109.2 %, and precision ranged from 1.1 to 10.2% (Table 3). The overall assay accuracy (mean of accuracy estimates of all quality control samples) was 96% in MeOH and 93.4% in matrix, and overall assay precision (mean of precision estimates of all quality control samples) was 4.7% in MeOH and 6.4% in matrix.
Revalidation using two different batches of synthetic SULF A (namely, BS90A and BS90A1) was carried out at the same concentrations in the range between 2.5 and 2000 ngmL−1 to further support the reliability of the method. The results showed an absolute reproducibility of the analysis with two superimposable calibration curves (BS90A: y = 31579x, R2 = 0.9999; BS90A1: y = 31331x, R2 = 0.9999).

4. Conclusions

An UHPLC-MS analytical procedure of SULF A, a 1,2-O-distearoyl-3-O-β-d-sulfoquinovosylglycerol with promising therapeutic application as a molecular adjuvant, was developed using a new deuterated analog (d70-SULF A) as an internal standard. The method was realized on a high-resolution benchtop Q-Exactive spectrometer using a UHPLC Kinetex® 2.6 µm PS C18 100 Å, LC Column and a gradient elution with water buffered at pH 8 and methanol. The sulfolipids (analyte and internal standard) were quantified in negative ion mode and the calibration curve covers a concentration range of 2.5–2000 ngmL−1with an LLOQ of 6.5 ngmL−1. The new method was validated measuring the precision and accuracy on the quality control samples in the intra-day and inter-day study and its robustness was proven by applying it on a sample matrix.
The efficacy of this analytical method is of general interest to study sulfoglycolipids that are chemically correlated to SULF-A, and suggests that it could be extended for the study of both the physiological and biological role of this class of compounds. Furthermore, the short time of the UHPLC chromatographic analysis and sensitivity makes the procedure adapt to analysis of large number of biological samples.
Pharmacokinetic and drug metabolism tests are mandatory for expediting the progress of compounds with promising properties from discovery to development phase. Mass spectrometry is one of the key technologies in bioanalysis during preclinical and clinical studies [24]. The presented LC-MS method has been designed to provide a mechanistic understanding of the pharmacokinetics, pharmacodynamics, and toxicity of SULF-A. The excellent results in accuracy, sensitivity and reproducibility indicate that the analytical protocol can be utilized in pharmacological and translational research on this negatively-charged lipid, providing accurate results with a high value for further decisions in the drug development.

Author Contributions

Conceptualization, G.N., E.M., G.d. and A.F.; methodology, G.N., A.M.C. and M.Z.; standard preparation, M.Z., L.F. and C.G.; data curation, writing-original draft preparation, G.N.; writing-review and editing, E.M. and A.F. All authors have read and agreed to the published version of the manuscript.

Funding

This work was supported by the project “Antitumor Drugs and Vaccines from the Sea (ADViSE)” project (CUP B43D18000240007–SURF 17061BP000000011) funded by POR Campania FESR 2014-2020 “Technology Platform for Therapeutic Strategies against Cancer”-Action 1.1.2 and 1.2.2.

Acknowledgments

G.N., E.M. and A.F. thank BioSEArch SRL for the supply of sulfavant.

Conflicts of Interest

The authors declare no conflict of interest.

References

  1. Nuzzo, G.; Gallo, C.; D’Ippolito, G.; Manzo, E.; Ruocco, N.; Russo, E.; Carotenuto, Y.; Costantini, M.; Zupo, V.; Sardo, A.; et al. UPLC–MS/MS Identification of Sterol Sulfates in Marine Diatoms. Mar. Drugs 2018, 17, 10. [Google Scholar] [CrossRef] [Green Version]
  2. Wood, P.L.; Siljander, H.; Knip, M. Lipidomics of human umbilical cord serum: Identification of unique sterol sulfates. Future Sci. OA 2017, 3, FSO193. [Google Scholar] [CrossRef] [Green Version]
  3. Dias, I.H.; Ferreira, R.; Gruber, F.; Vitorino, R.; Rivas-Urbina, A.; Sanchez-Quesada, J.L.; Silva, J.V.; Fardilha, M.; De Freitas, V.; Reis, A. Sulfate-based lipids: Analysis of healthy human fluids and cell extracts. Chem. Phys. Lipids 2019, 221, 53–64. [Google Scholar] [CrossRef] [PubMed] [Green Version]
  4. Gallo, C.; Nuzzo, G.; D’Ippolito, G.; Manzo, E.; Sardo, A.; Fontana, A. Sterol Sulfates and Sulfotransferases in Marine Diatoms. In Computer Methods, Part C; Elsevier BV: Amsterdam, The Netherlands, 2018; Volume 605, pp. 101–138. [Google Scholar]
  5. Mirzaian, M.; Kramer, G.; Poorthuis, B.J.H.M. Quantification of sulfatides and lysosulfatides in tissues and body fluids by liquid chromatography-tandem mass spectrometry. J. Lipid Res. 2015, 56, 936–943. [Google Scholar] [CrossRef] [PubMed] [Green Version]
  6. Moyano, A.L.; Li, G.; Lopez-Rosas, A.; Månsson, J.-E.; Van Breemen, R.B.; Givogri, M.I. Distribution of C16:0, C18:0, C24:1, and C24:0 sulfatides in central nervous system lipid rafts by quantitative ultra-high-pressure liquid chromatography tandem mass spectrometry. Anal. Biochem. 2014, 467, 31–39. [Google Scholar] [CrossRef] [PubMed]
  7. Pintado-Sierra, M.; García-Álvarez, I.; Bribián, A.; Medina-Rodríguez, E.; Lebrón-Aguilar, R.; Garrido, L.; De Castro, F.; Fernández-Mayoralas, A.; Quintanilla-López, J.E. A comprehensive profiling of sulfatides in myelin from mouse brain using liquid chromatography coupled to high-resolution accurate tandem mass spectrometry. Anal. Chim. Acta 2017, 951, 89–98. [Google Scholar] [CrossRef]
  8. Kongmanas, K.; Xu, H.; Yaghoubian, A.; Franchini, L.; Panza, L.; Ronchetti, F.; Faull, K.; Tanphaichitr, N. Quantification of seminolipid by LC-ESI-MS/MS-multiple reaction monitoring: Compensatory levels in Cgt mice. J. Lipid Res. 2010, 51, 3548–3558. [Google Scholar] [CrossRef] [Green Version]
  9. Manzo, E.; Cutignano, A.; Pagano, D.; Gallo, C.; Barra, G.; Nuzzo, G.; Sansone, C.; Ianora, A.; Urbanek, K.; Fenoglio, D.; et al. A new marine-derived sulfoglycolipid triggers dendritic cell activation and immune adjuvant response. Sci. Rep. 2017, 7, 1–10. [Google Scholar] [CrossRef]
  10. Manzo, E.; Gallo, C.; Fioretto, L.; Nuzzo, G.; Barra, G.; Pagano, D.; Krauss, I.R.; Paduano, L.; Ziaco, M.; DellaGreca, M.; et al. Diasteroselective Colloidal Self-Assembly Affects the Immunological Response of the Molecular Adjuvant Sulfavant. ACS Omega 2019, 4, 7807–7814. [Google Scholar] [CrossRef] [Green Version]
  11. Manzo, E.; Fioretto, L.; Pagano, D.; Nuzzo, G.; Gallo, C.; De Palma, R.; Fontana, A. Chemical Synthesis of Marine-Derived Sulfoglycolipids, a New Class of Molecular Adjuvants. Mar. Drugs 2017, 15, 288. [Google Scholar] [CrossRef] [Green Version]
  12. Ziaco, M.; Fioretto, L.; Nuzzo, G.; Fontana, A.; Manzo, E. Short Gram-Scale Synthesis of Sulfavant A. Org. Process. Res. Dev. 2020, 24, 2728–2733. [Google Scholar] [CrossRef]
  13. Manzo, E.; Fioretto, L.; Gallo, C.; Ziaco, M.; Nuzzo, G.; D’Ippolito, G.; Borzacchiello, A.; Fabozzi, A.; De Palma, R.; Fontana, A. Preparation, Supramolecular Aggregation and Immunological Activity of the Bona Fide Vaccine Adjuvant Sulfavant S. Mar. Drugs 2020, 18, 451. [Google Scholar] [CrossRef]
  14. Manzo, E.; Ciavatta, M.L.; Pagano, D.; Fontana, A. An efficient and versatile chemical synthesis of bioactive glyco-glycerolipids. Tetrahedron Lett. 2012, 53, 879–881. [Google Scholar] [CrossRef]
  15. Manzo, E.; Ciavatta, M.L.; Pagano, D.; Fontana, A. Synthetic strategy for the preparation of bioactive galactoglycerolipids. Chem. J. Mold. 2011, 6, 27–29. [Google Scholar]
  16. Vial, J.; Jardy, A. Experimental Comparison of the Different Approaches to Estimate LOD and LOQ of an HPLC Method. Anal. Chem. 1999, 71, 2672–2677. [Google Scholar] [CrossRef]
  17. Cutignano, A.; Luongo, E.; Nuzzo, G.; Pagano, D.; Manzo, E.; Sardo, A.; Fontana, A. Profiling of complex lipids in marine microalgae by UHPLC/tandem mass spectrometry. Algal Res. 2016, 17, 348–358. [Google Scholar] [CrossRef]
  18. De Nicolò, A.; Cantù, M.; D’Avolio, A. Matrix effect management in liquid chromatography mass spectrometry: The internal standard normalized matrix effect. Bioanalysis 2017, 9, 1093–1105. [Google Scholar] [CrossRef]
  19. Schmidt, R.R.; Michel, J. Facile Synthesis ofα- andβ-O-Glycosyl Imidates; Preparation of Glycosides and Disaccharides. Angew. Chem. Int. Ed. 1980, 19, 731–732. [Google Scholar] [CrossRef]
  20. Schmidt, R.R. New Methods for the Synthesis of Glycosides and Oligosaccharides?Are There Alternatives to the Koenigs-Knorr Method? [New Synthetic Methods (56)]. Angew. Chem. Int. Ed. 1986, 25, 212–235. [Google Scholar] [CrossRef]
  21. Zhao, Y.-Y.; Wu, S.-P.; Liu, S.; Zhang, Y.; Lin, R. Ultra-performance liquid chromatography–mass spectrometry as a sensitive and powerful technology in lipidomic applications. Chem. Interact. 2014, 220, 181–192. [Google Scholar] [CrossRef]
  22. European Medicines Agency. An unacceptable choice. Prescrire Int. 2011, 20, 278. [Google Scholar]
  23. Analytical Procedures and Methods Validation for Drugs and Biologics Guidance for Industry Analytical Procedures and Methods Validation for Drugs and Biologics Guidance for Industry. Available online: https://www.fda.gov/regulatory-information/search-fda-guidance-documents/analytical-procedures-and-methods-validation-drugs-and-biologics (accessed on 1 June 2020).
  24. Avataneo, V.; D’Avolio, A.; Cusato, J.; Cantù, M.; De Nicolò, A. LC-MS application for therapeutic drug monitoring in alternative matrices. J. Pharm. Biomed. Anal. 2019, 166, 40–51. [Google Scholar] [CrossRef] [PubMed]
Figure 1. Chemical structure of Sulfavant A (1) deuterated Sulfavant A (2).
Applsci 11 01451 g001
Figure 2. Chemical synthesis of deuterated Sulfavant A.
Applsci 11 01451 g002
Figure 3. Chromatograms of d70-Sulfavant A (a) and Sulfavant A (b) as base peak extraction at m/z 920.016 and 849.576 respectively, applying a mass tolerance of 5 ppm.
Applsci 11 01451 g003
Figure 4. Calibration curve of d70-Sulfavant A (a) and Sulfavant A (b).
Applsci 11 01451 g004
Figure 5. Chromatograms and mass spectrum acquired at 3 min. of pure matrix extract (A), matrix spiked with 300 ng (B) and 1500 ng (C) of Sulfavant A. Chromatograms were obtained as m/z mass range between 400 and 1200.
Applsci 11 01451 g005
Table 1. Gradient program of the Ultra High Performance Liquid Chromatography (UHPLC) method.
Time (min)Mobile Phase A (%) aMobile Phase B (%) b
08515
18515
6982
81000
101000
118515
158515
a methanol b 0.32 mM ammonium hydroxide water solution (pH 8.0).
Table 2. Calibration curve of d70-Sulfavant A and Sulfavant A at T0 and T48, both in MeOH and in matrix.
T0T48
MeOHMatrixMeOHMatrix
SULF Ay = 40229x
R2 = 0.9996
y = 47981x
R2 = 0.9997
y = 50537x
R2 = 0.9991
y = 46508x
R2 = 0.9993
d70-SULF Ay = 23689x
R2 = 0.9998
y = 24546x
R2 = 0.9991
y = 28250x
R2 = 1
y = 24185x
R2 = 0.9996
Table 3. Accuracy and precision of quality control (QC) samples of Sulfavant A during intra-day and inter-day analysis.
SULF A in MeOH
Nominal Concentration (ngmL−1)Mean ± SD aAccuracy (%) bPrecision (CV %) c
T03027.8 ± 2.292.68.0
300315.0 ± 19.41056.1
15001247.8 ± 69.284.25.5
T12
(Intra-day)
3027.7 ± 1.1492.44.1
300313.9 ± 17.6104.65.6
15001265.2 ± 27.684.32.2
T48
(Inter-day)
3030.7 ± 1.5102.24.9
300327.7 ± 16.3109.25.0
15001353.6 ± 15.090.21.1
SULF A in Matrix
Nominal Concentration (ngmL−1)Mean ± SD aAccuracy (%) bPrecision (CV %) c
T03026.0 ± 2.286.68.6
300283.1 ± 6.594.42.3
15001459.9 ± 79.797.35.4
T12
(Intra-day)
3028.6 ± 2.095.27.1
300274.4 ± 16.691.56.1
15001457.3 ± 84.197.15.8
T48
(Inter-day)
3027.0 ± 1.290.04.3
300279.8 ± 22.093.37.9
15001432.5 ± 46.295.510.2
a SD = Standard Deviation b [Measured mean concentration/ nominal concentration] × 100. c [Standard deviation/ measured mean concentration] × 100.
Publisher’s Note: MDPI stays neutral with regard to jurisdictional claims in published maps and institutional affiliations.