Abstract
This study aims to investigate the effect of the port injection of ammonia on performance, knock and NOx emission across a range of engine speeds in a gasoline/ethanol dual-fuel engine. An experimentally validated numerical model of a naturally aspirated spark-ignition (SI) engine was developed in AVL BOOST for the purpose of this investigation. The vibe two zone combustion model, which is widely used for the mathematical modeling of spark-ignition engines is employed for the numerical analysis of the combustion process. A significant reduction of ~50% in NOx emissions was observed across the engine speed range. However, the port injection of ammonia imposed some negative impacts on engine equivalent BSFC, CO and HC emissions, increasing these parameters by 3%, 30% and 21%, respectively, at the 10% ammonia injection ratio. Additionally, the minimum octane number of primary fuel required to prevent knock was reduced by up to 3.6% by adding ammonia between 5 and 10%. All in all, the injection of ammonia inside a bio-fueled engine could make it robust and produce less NOx, while having some undesirable effects on BSFC, CO and HC emissions.
1. Introduction
The increasing rates of greenhouse gases and other emissions from different sectors, including transportation, are believed to be having a significant negative impact on our environment [1,2]. The surplus level of greenhouse gases, such as carbon dioxide, has resulted in an increase in atmospheric temperature and a shortage of freshwater [3]. Furthermore, other emissions from vehicles, such as nitrogen oxides and particulates, are directly linked with serious health problems, such as cardiovascular and respiratory diseases, infant mortality rate and cancer [4,5]. To combat this global challenge, the Paris Agreement has provided an international framework to slow down climate change’s deleterious effects on human beings by setting a limiting factor of temperature increase well below 2 °C, while encouraging limitation to 1.5 °C [6]. Despite some recent denials, the need to curtail greenhouse gas emissions has been widely accepted by governments around the globe and reflected in relevant policies. For example, the EU is committed, under the Paris Agreement, to reduce the level of greenhouse gas emissions by at least 40% by 2030, which is below the level of 1990 [7]; this target was recently proposed to increase to at least a 55% reduction by 2030.
To achieve the pollution reduction targets, reducing the emissions from the transportation sector is going to be a major challenge. While the greenhouse gas emissions from other major sectors, such as power production, residential and industry sectors, are showing a reducing trend in EU countries, the emissions from transportation have not been reduced yet when compared to the 1990 level, due to an increase in the number of vehicles across Europe. This is also the case for other parts of the world, despite technological advancements mitigating transportation emissions.
Shifting from fossil fuels towards cleaner fuels, such as biofuels, has been considered in recent years [8,9]. Biofuels are produced via different processes, including the conversion of food waste [8]. They can be used as an additive (or secondary) fuel in vehicles for the reduction of CO2 emission [10,11]. Biofuels have been used for both spark-ignition (SI) and compression ignition (CI) engines [12,13,14]; however, most researchers have focused on CI engines. In recent years, due to the excess NOx and particulate matter emissions from CI engines, for transportation applications, a shift towards SI engines is happening even in hybrid vehicles. In spark-ignition engines, ethanol addition to gasoline has been the main application for biofuels [15], with the aim of greenhouse gas emissions reductions. Ethanol blending of 5% (E5) and 10% (E10) by volume with gasoline has been carried out by different countries for about a decade [3]. Additionally, the most recent emissions regulation (Euro 6.2) uses E10. In Europe, E20 is on the horizon as a means to achieving compliancy with the up-coming Euro 7 regulations. Europe is currently looking at the benefits and costs of E20 adaptation by 2030 [16].
In the literature, the impacts of different biofuel applications for engine emission reduction have been widely studied by many researchers [17,18]. Using ethanol as a blended fuel decreases CO and HC emissions; however, it increases nitrogen oxides emissions [19,20]. As another alternative, hydrogen has been introduced as a green fuel in recent years [3,21]. In this concept, ammonia can be a convenient hydrogen carrier due to its high hydrogen content and availability. Ammonia could then be added as a secondary fuel in internal combustion engines for controlling the emissions and improving the combustion efficiency [22,23]. The hydrogen and nitrogen contents of ammonia can improve combustion conditions, resulting in improved engine performance and lower fossil fuel consumption. Furthermore, as hydrogen does not contain any carbon, we can also expect a reduction in carbon dioxide via ammonia addition [23].
Besides the benefits to carbon dioxide and fuel consumption, ammonia injection can also mitigate nitrogen oxides emissions [24,25]. Reiter and Kong [25,26] performed an experimental study on the injection of ammonia in a diesel engine. The results of their work showed that adding ammonia leads to an increase in engine power and a significant reduction in carbon dioxide and nitrogen oxide emissions. Yapicioglu and Dincer [22] accomplished an experimental study on adding ammonia to the gasoline fuel of a spark-ignition engine. Based on the results of their work, the gasoline engine’s carbon dioxide production rate decreased by nearly 2% by adding ammonia; however, the engine energy and exergy efficiencies decreased slightly due to the lower calorific value of the gasoline and ammonia mixture compared to pure gasoline fuel. In another study, the evaluation of ammonia’s direct injection into a gasoline/ammonia dual-fuel engine was performed by Ryu [23]. The results of his study indicated that engine power decreased with an increase in the ammonia injection rate; however, the engine HC production rate increased significantly as the result of lower in-cylinder temperature during combustion. In dual fuel application, knock intensity is also one of the main concerns that needs to be studied when the main fuel is diluted [27,28]. The addition of ethanol to a gasoline engine results in an increase in fuel octane number and a reduction in knock intensity in the engine, especially at high loads, as reported by Kang et al. [27]. A similar work has been done by Liu et al. [29] on the investigation of the impacts of methanol addition to gasoline on engine knock intensity, and it was shown that the engine knock can be improved by the modification of compression ratio and AF ratio parameters. However, there is as yet no study in the literature to investigate the impacts of ammonia injection on the knock intensity of the engine.
The current literature on ammonia injection in engine applications has been predominately focused on CI engines. From the literature, it can be concluded that the injection of ammonia increases the power production and reduces the in-cylinder temperature, which leads to a reduction in thermal nitrogen oxides. Ethanol at different percentages is a common additive in gasoline fuels in many countries. So, it is important to study the ammonia injection in dual-fuel SI engines as a future alternative. Furthermore, ethanol addition showed an increase in NOx emissions in SI engines, and ammonia injection would be an efficient solution to the nitrogen oxide increment caused by ethanol addition. There are limited studies on ammonia injection as the secondary fuel in spark-ignition gasoline engines in the literature [30,31], and the current work is one of the first studies looking at the effects of ammonia injection on the engine performance of a gasoline/ethanol dual-fuel engine and nitrogen oxides emissions.
This comprehensive study utilizes a simulation approach to investigate the impact of the port injection of ammonia into a gasoline/ethanol dual-fuel SI engine. The engine was modeled in AVL BOOST software and validated against the experimental data. Then, the ammonia was injected at various rates into the model, which was fueled by pure gasoline, E5, E10 and E20. The results regarding engine performance and emission changes caused by the injection of ammonia at various rates and engine performance conditions are analyzed and reported.
2. Methodology
2.1. Experimental Analysis
The experimental analysis of a KIA Cerato engine was accomplished in specialized engine test facilities, the details of which have been reported in our recent studies [28,32]. The laboratory testing and calibration standard code and the engine test standard code are ISO 17025 and ISO 1585, respectively [33]. The main output parameters (brake specific fuel consumption (BSFC), torque and nitrogen oxides emission production rate) of the engine at various engine speeds were recorded and compared with the AVL BOOST model outputs for validation. Table 1 shows the specification of the KIA Cerato engine.

Table 1.
KIA Cerato engine specifications.
2.2. Mathematical Model of Engine
The engine model shown in Figure 1 was developed using AVL BOOST software. The model is equipped with a multi-point fuel injection system (MPFI). The main injectors for primary fuel are I1, I2, I3 and I4. Furthermore, the ammonia is injected by an injector which is installed before the engine intake manifold (I5). The blocks named E1, CL1 and CAT1 denote the engine, air-cleaner and catalyst converter components, respectively. The engine cylinders are shown by C1 to C4, and mufflers are indicated by PL3 and PL4. The legends of the Figure 1 indexes are provided in Appendix A.
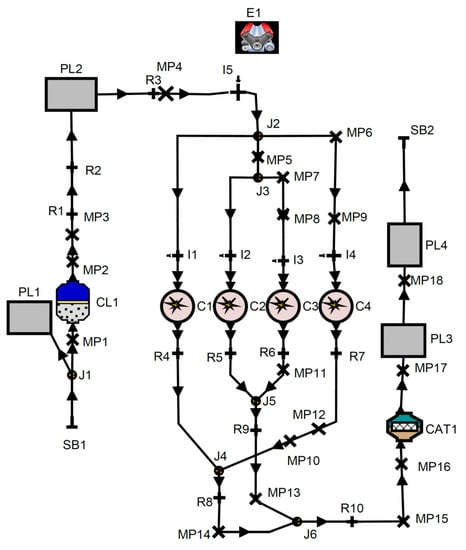
Figure 1.
Engine block diagram in AVL BOOST.
2.2.1. Combustion and Heat Transfer Model
For modeling the combustion process in this study, the vibe two zone model was employed. In this model, the burned and unburned gas regions in the combustion chamber are divided separately, and the gas temperature for each region is calculated. By applying the first law of thermodynamics to each region, the following equations are derived [34]:
where the , , , , and terms are variations of in-cylinder internal energy, piston work, fuel input energy, wall heat losses, enthalpy flow from unburnt to burnt zone, and blow-by enthalpy, respectively. Furthermore, the equations for the volume changes of each zone can be expressed as follows [34]:
In the vibe two zone model, the fuel mass burned fraction (x) during combustion is expressed by Equation (5) [3,34]:
where SOC, BDUR, ∝, m and a are the start of the combustion, burn duration, crankshaft angle, vibe shape and vibe parameter, respectively. Additionally, Woschni’s 1978 [28,35] heat transfer model is employed for modeling the heat transfer between the gas and the cylinder walls.
2.2.2. Emission Model
The Pattas and Hafner equation [34] combined with the Zel’dovich mechanism are employed for estimating the nitrogen oxides formation rate, as provided below [34]:
where , , and are the post-processing multiplier, kinetic multiplier, molar concentration and reaction rate of nitrogen oxides, respectively. The equation provided by Onorati et al. [34] is used for modeling CO formation:
where and are the CO reaction rate and molar concentration, respectively. Moreover, the complex phenomenological model for the prediction of HC formation developed by AVL BOOST is employed for the modeling of unburned hydrocarbons [34].
2.2.3. Fueling System Parameters
In a dual-fuel engine, the equivalent BSFC should be utilized to offer a means of fair assessment between fueling strategies. In this study, the equivalent BSFC is defined as [1,3]:
where , , , and are the gasoline mass flow rate, ethanol mass flow rate, ammonia mass flow rate and engine power parameters, respectively. The ammonia is injected in various ratios, which can be defined as:
where is the ammonia injection ratio. In this research, the ammonia was injected in ratios of 0.05 (or 5%) and 0.1 (or 10%) by volume. The various fueling modes which are used in this study are presented in Table 2.
Table 2.
Various fueling modes definitions in this study.
2.2.4. Knock Model
The knock model is used for calculating the minimum octane number required for the engine to work free of knock by various types of fuels [36]. For identifying knock onset, the parameter is defined, and the threshold for the onset of knock is exceeded if the is larger than one before the end of combustion:
Furthermore, in the knock model, the ignition delay () has a strong relationship with fuel octane number and the in-cylinder gas thermophysical conditions, such as in-cylinder pressure () and temperature () [36]:
where , ON, p and T are the ignition delay, minimum octane number, pressure and temperature of the in-cylinder gas, respectively. Moreover, A, a, n and B are constant parameters used in the model, of values 17.68, 3.402, 1.7 and 3800, respectively [36].
3. Validation
The experimental output data obtained from testing a KIA Cerato on a test bed was used for validating the AVL BOOST model. The tests were accomplished in a steady-state condition at various engine speeds listed in Table 3. The experimental test on a KIA Cerato engine was performed in an engine test room at Dinamotors company (Figure 2). Moreover, the lab testing and calibration standard code and the engine test standard code were ISO 17025 and ISO 1585, respectively. The required load was applied on the engine at the rated RPM using a Schenck 190 kW dynamometer [33]. The fuel consumption rate and nitrogen oxide production rate were measured using a Dina fuel mass flow meter and a Testo 350 gas analyzer, respectively [33]. The engine’s main output parameters, obtained from experiments [3], are compared to the corresponding values obtained from AVL BOOST. As shown in Table 3, the maximum error of the mathematical model is below 10%, which shows that the AVL BOOST output data are reliable.
Table 3.
Comparison of engine torque, BSFC and nitrogen oxide production rate of AVL model with experimental tests at different engine speeds [3].
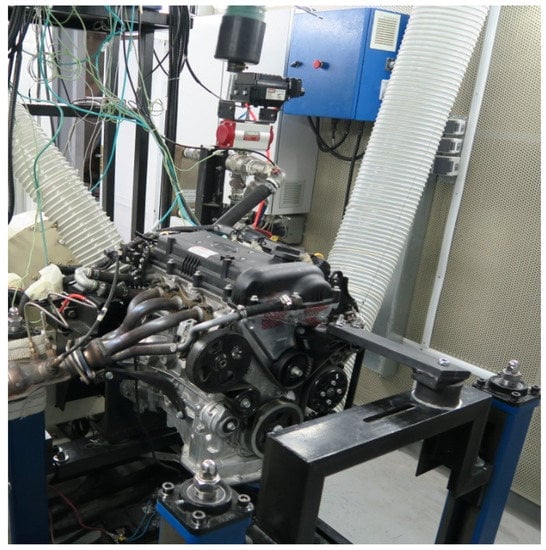
Figure 2.
The KIA Cerato engine installed in engine test room.
4. Result and Discussion
4.1. The Impacts of Ethanol Addition to Fuel
Figure 3 indicates the impacts of adding ethanol to the fuel at various fraction in different engine speeds. As can be seen in this figure, the engine power slightly increased by adding ethanol. The effect of employing ethanol as a blended secondary fuel on engine equivalent BSFC is shown in Figure 4. By increasing the ethanol fraction in the fuel mixture, the equivalent BSFC decreased, confirming the benefit of using biofuel in reducing fuel consumption and carbon dioxide. However, the increase in the ethanol fraction in the fuel mixture increased nitrogen oxide emissions, as shown in Figure 5. The exhaust nitrogen oxides levels increased by 18%, 46% and 110% at ethanol fractions of 5%, 10% and 20%, respectively, compared to the gasoline only operation. As indicated, the highest nitrogen oxide increase belongs to the E20 fuel; however, it had a significant BSFC reduction effect, as shown in Figure 3. E20 is selected to evaluate the effect of ammonia injection on nitrogen oxide emissions, and also other engine emission and performance parameters.
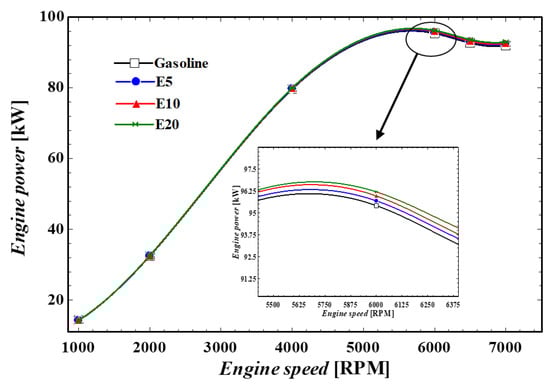
Figure 3.
The engine power at various engine speeds at different fractions of ethanol.
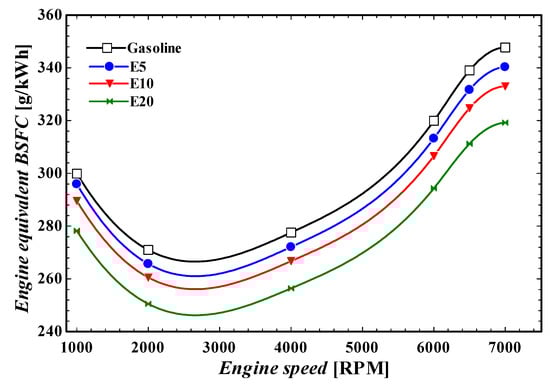
Figure 4.
Engine equivalent BSFC at various engine speeds at different fractions of ethanol.
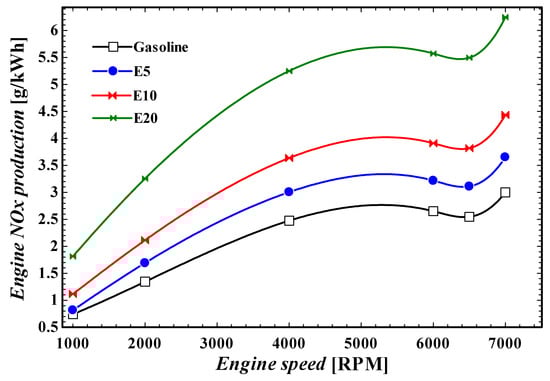
Figure 5.
Engine nitrogen oxide production at various engine speeds at different fractions of ethanol.
4.2. Port Injection of Ammonia
Figure 6 shows the engine power trend when ammonia is injected in different fractions at different engine speeds for the E20 fuel. As can be seen, ammonia injection had a small positive impact on engine power. The variation in engine equivalent BSFC caused by the injection of ammonia is also shown in Figure 7. The port injection of ammonia showed a positive impact on BSFC via a slight increase in engine equivalent BSFC. At the maximum ammonia injection (A10), the engine equivalent BSFC increased up to approximately 3%.
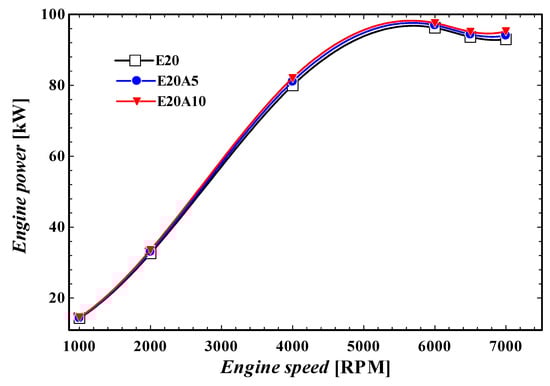
Figure 6.
Engine power at various engine speeds at different fractions of ammonia.
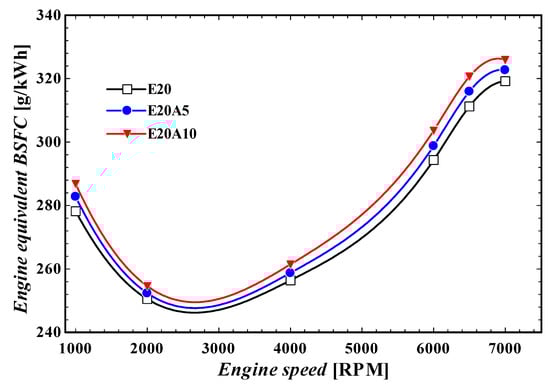
Figure 7.
Engine equivalent BSFC at various engine speeds at different fractions of ammonia.
Figure 8 shows the shares of fuel energy converted to brake power, as well as the wasted energy through the friction loss, piston walls, cylinder head walls, cylinder liner walls, valves walls and exhaust gas at engine rated RPM (6000 RPM). As indicated in this figure, the percentage of the fuel energy converted to brake power decreased by 0.4% and 2% following increases in ammonia injection to 5% and 10%, respectively, due to the reduction in the in-cylinder pressure (Figure 9). On the other hand, the share of the fuel energy wasted through the exhaust increased by approximately 2% following the increment of ammonia injection up to 10%. Considering the ammonia lower heating value (LHV), the total fuel energy released during combustion increases following the increment in ammonia injection rate, as confirmed by Figure 10. So, the in-cylinder pressure increased minimally by increasing the ammonia injection rate, as is shown in Figure 9, resulting in a slight increment in engine power shown in Figure 6.
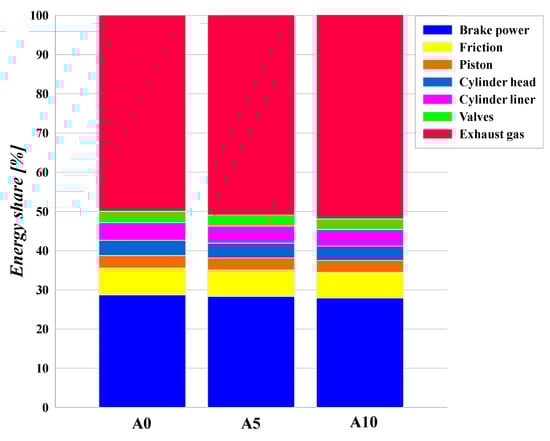
Figure 8.
The energy shares of fuel energy converted to brake power and friction, and that wasted at engine rated RPM.
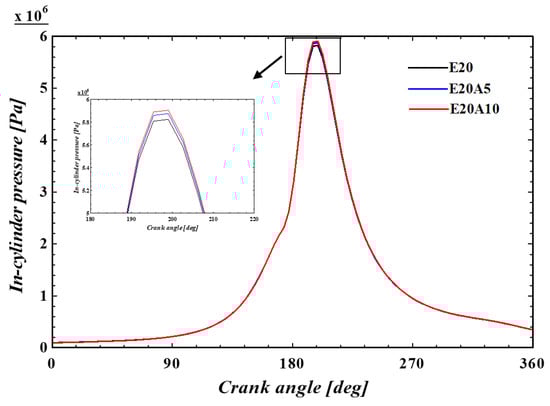
Figure 9.
The in-cylinder pressure in various crank angles at engine rated RPM.
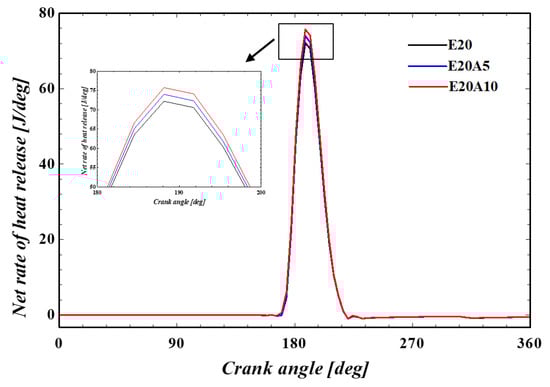
Figure 10.
The net rate of heat release in various crank angles at engine rated RPM.
The changes to engine nitrogen oxides emissions and peak cylinder temperature caused by the injection of ammonia at different engine speeds are shown in Figure 11 and Figure 12, consecutively. As discussed before, the ethanol fraction increment in the fuel mixture results in a considerable increase in nitrogen oxides. However, ammonia injection causes nitrogen oxide reduction, as shown in Figure 11. The injection of ammonia up to 5% and 10% led to engine nitrogen oxide reductions of 25% and 48%, respectively, on average at various engine speeds for E20.
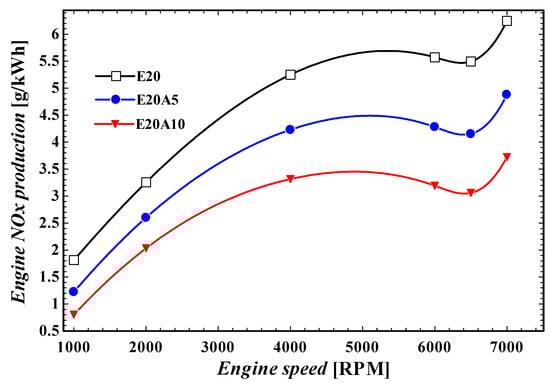
Figure 11.
Nitrogen oxides production at various engine speeds at different fractions of ammonia.
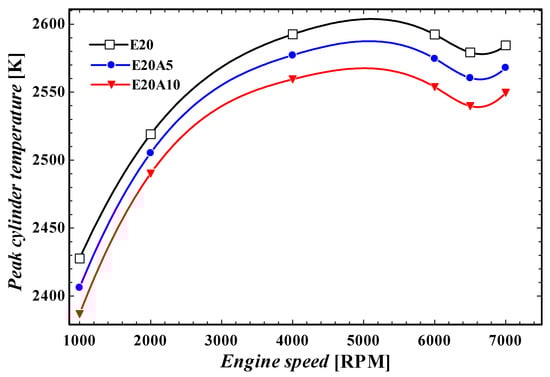
Figure 12.
Peak cylinder temperature at various engine speeds at different fractions of ammonia.
The main parameter affecting nitrogen oxide production is the in-cylinder combustion temperature. As demonstrated in Figure 12, the engine in-cylinder temperature was reduced with the injection of ammonia, which led to the observed nitrogen oxide reduction. The main cause of nitrogen oxide reduction is the decrement in engine volumetric efficiency, caused by the injection of ammonia. By increasing the ammonia injection ratio up to 10%, the engine in-cylinder temperature decreased by approximately 50 K, across the engine speed range.
Figure 13 demonstrates the effect of ammonia port injection on CO emission at various engine speeds. The injection of ammonia resulted in a reduction in in-cylinder temperature, as presented in Figure 12. This reduction in in-cylinder temperature will impose a negative effect on engine CO due to the extension of unburnt zones, which directly affects engine CO production. Our results show that an increase in ethanol fraction in the fuel mixture results in a significant decrease in the CO generation rate. However, the port injection of ammonia, up to 10%, leads to a CO increment of nearly 30% at various engine speeds, respectively, which is mainly because of the decrease in in-cylinder temperature and the spread of unburnt zone.
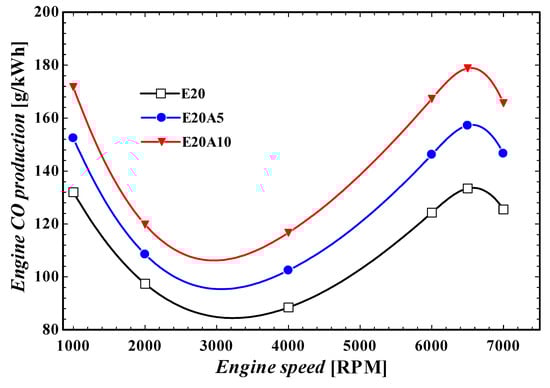
Figure 13.
CO production at various engine speeds at different fractions of ammonia.
The impact of ammonia port injection on engine HC emission production is shown in Figure 14. Similar to CO, HC production increased by the injection of ammonia. With the port injection of ammonia increased up to 5% and 10%, the HC emission increased by 6% and 10%, respectively. However, the increase in HC and CO emissions caused by the injection of ammonia can be controlled by the employment of efficient catalytic converters in vehicles [37,38,39].
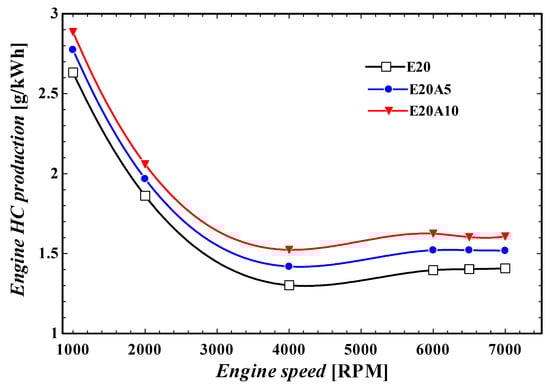
Figure 14.
HC production at various engine speeds at different fractions of ammonia.
The minimum required fuel octane number for preventing engine knock with ammonia injection is presented in Figure 15. While ethanol addition did not affect the minimum octane number parameter significantly [3], the increase in port injection of ammonia up to 5% and 10% led to a reduction in the minimum octane number, from 84 (A0) to 82 (A5) and 81 (A10), respectively. Therefore, the port injection of ammonia can be considered as being beneficial for engine knock.
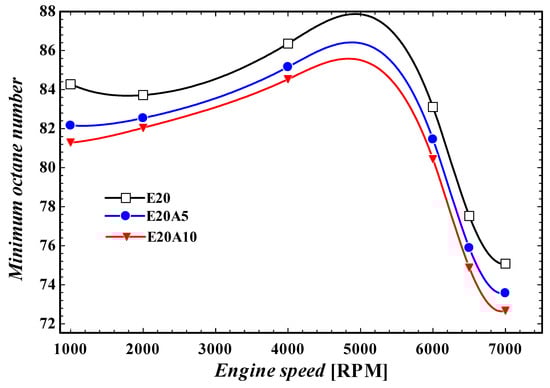
Figure 15.
Minimum fuel octane number requirement at various engine speeds at different fractions of ammonia.
5. Conclusions
The impact of ammonia port injection on a gasoline/ethanol dual-fuel engine was investigated in this paper. The engine was numerically modeled in the AVL BOOST software and validated against experimental data obtained from physical engine tests. The presented results are an evaluation of the impact of ammonia port injection on a spark-ignition engine across a range of engine speeds with respect to engine performance parameters, such as net rate of heat release, engine power, equivalent BSFC and emissions such as nitrogen oxides, CO and HC emissions. The key conclusions of this study are as follows:
- -
- By adding ethanol to gasoline at various volume shares, the rate of engine nitrogen oxides production increased, while the BSFC decreased and the engine power was changed minimally compared to a single-fueled gasoline engine;
- -
- The port injection of ammonia increased engine power up to 1.4%;
- -
- The equivalent BSFC of the engine increased with the port injection of ammonia by 3% (at a 10% injection ratio);
- -
- The engine combustion chamber cooled with the port injection of ammonia up to 50 K, which resulted in a significant reduction in engine nitrogen oxide emissions up to ~50% across the engine speed range;
- -
- The share of fuel energy wasted through the exhaust increased by approximately 2% following the increase in ammonia injection up to 10%;
- -
- The other engine emissions, such as CO and HC, increased by 30% and 21%, respectively, when ammonia was injected at a 10% ratio. However, this issue can be controlled by having an appropriate after-treatment system in place;
- -
- The required minimum octane number of the main fuel for preventing knock decreased when ammonia was injected at a 10% injection ratio, indicating that the port injection of ammonia can positively affect the engine knock;
- -
- The proposed combustion mode could be studied for heavy-duty diesel engines in future research, with possible positive impacts on efficiencies and GHG, since for passenger cars the efficiency is lower compared to conventional diesel combustion.
Author Contributions
Conceptualization, methodology, software, F.S., M.B. and A.Z.; validation, and S.V.H.; formal analysis, F.S., M.B. and T.B.; resources, S.V.H. and M.B.; writing—original draft preparation, M.B., F.S. and A.S.; writing—review and editing, M.B., A.Z. and T.B.; visualization, F.S. and A.S.; supervision, M.B. All authors have read and agreed to the published version of the manuscript.
Funding
This research received no external funding.
Institutional Review Board Statement
Not applicable.
Informed Consent Statement
Not applicable.
Acknowledgments
AVL List GmbH support for proving the simulation tools for University of Salford through their University Partnership Program is greatly appreciated. Special thanks to Dina Motors company for their support during this research.
Conflicts of Interest
The authors declare no conflict of interest.
Nomenclature
| SOC | Start of combustion |
| BDUR | Burn duration |
| ∝ | Crank shaft angle |
| m | Vibe shape |
| a | Vibe parameter |
| CO | Carbon monoxide |
| HC | Hydrocarbons |
| NOx | Nitrogen monoxide |
| DME | Dimethyl ether |
| CAT | Catalytic converter |
| E | Engine |
| SB | System boundary |
| C | Cylinder |
| CL | Air cleaner |
| PL | Plenum |
| MP | Measuring point |
| LHV | Lower heating value (kJ/kg) |
| E | Ethanol |
| A | Ammonia |
| BSFC | Brake specific fuel consumption (g/kWh) |
| R | Injection ratio |
| BMEP | Brake mean effective pressure (bar) |
| V | Volume |
| C | Constant |
| r | Reaction rate |
| ON | Octane number |
| p | Pressure (bar) |
| T | Temperature (K) |
| Subscripts | |
| PPM | Post processing multiplier |
| KM | Kinetic multiplier |
| iD | Ignition delay |
| b | Burnt zone |
| u | Unburnt zone |
| a | Ammonia |
| e | Ethanol |
References
- Odibi, C.; Babaie, M.; Zare, A.; Nabi, M.N.; Bodisco, T.A.; Brown, R.J. Exergy analysis of a diesel engine with waste cooking biodiesel and triacetin. Energy Convers. Manag. 2019, 198, 111912. [Google Scholar] [CrossRef]
- Salek, F.; Zamen, M.; Hosseini, S.V. Experimental study, energy assessment and improvement of hydroxy generator coupled with a gasoline engine. Energy Rep. 2020, 6, 146–156. [Google Scholar] [CrossRef]
- Salek, F.; Babaie, M.; Redel-Macias, M.D.; Ghodsi, A.; Hosseini, S.V.; Nourian, A.; Burby, M.L.; Zare, A. The effects of port water injection on spark ignition engine performance and emissions fueled by pure gasoline, E5 and E10. Processes 2020, 8, 1214. [Google Scholar] [CrossRef]
- Ristovski, Z.D.; Miljevic, B.; Surawski, N.C.; Morawska, L.; Fong, K.M.; Goh, F.; Yang, I.A. Respiratory health effects of diesel particulate matter. Respirology 2012, 17, 201–212. [Google Scholar] [CrossRef]
- International Agency for Research on Cancer, WHO. Diesel engine exhaust carcinogenic and IARC: Diesel engine exhaust carcinogenic. Cent. Eur. J. Public Health 2012, 20, 120. [Google Scholar]
- UNFCCC. Paris Agreement, Decision 1/CP.21. In Proceedings of the UNFCCC, Paris, France, 30 November–13 December 2015. [Google Scholar]
- Liobikienė, G.; Butkus, M. The European Union possibilities to achieve targets of Europe 2020 and Paris agreement climate policy. Renew. Energy 2017, 106, 298–309. [Google Scholar] [CrossRef]
- Martinez, D.G.; Feiden, A.; Bariccatti, R.; de Freitas Zara, K.R. Ethanol production from waste of cassava processing. Appl. Sci. 2018, 8, 2158. [Google Scholar] [CrossRef]
- Ga, B.V.; Thai, P.Q. Soot Emission Reduction in a Biogas-DME Hybrid Dual-Fuel Engine. Appl. Sci. 2020, 10, 3416. [Google Scholar] [CrossRef]
- Verma, P.; Zare, A.; Jafari, M.; Bodisco, T.A.; Rainey, T.; Ristovski, Z.D.; Brown, R.J. Diesel engine performance and emissions with fuels derived from waste tyres. Sci. Rep. 2018, 8, 1–13. [Google Scholar]
- Zare, A.; Nabi, M.N.; Bodisco, T.A.; Hossain, F.M.; Rahman, M.M.; Ristovski, Z.D.; Brown, R.J. The effect of triacetin as a fuel additive to waste cooking biodiesel on engine performance and exhaust emissions. Fuel 2016, 182, 640–649. [Google Scholar] [CrossRef]
- Tutak, W.; Grab-Rogaliński, K.; Jamrozik, A. Combustion and Emission Characteristics of a Biodiesel-Hydrogen Dual-Fuel Engine. Appl. Sci. 2020, 10, 1082. [Google Scholar] [CrossRef]
- Eliasz, J.; Osipowicz, T.; Abramek, K.F.; Mozga, Ł. Model issues regarding modification of fuel injector components to improve the injection parameters of a modern compression ignition engine powered by biofuel. Appl. Sci. 2019, 9, 5479. [Google Scholar] [CrossRef]
- Ge, J.C.; Yoon, S.K.; Choi, N.J. Using canola oil biodiesel as an alternative fuel in diesel engines: A review. Appl. Sci. 2017, 7, 881. [Google Scholar] [CrossRef]
- Koegl, M.; Baderschneider, K.; Bauer, F.J.; Hofbeck, B.; Berrocal, E.; Will, S.; Zigan, L. Analysis of the LIF/Mie ratio from individual droplets for planar droplet sizing: Application to gasoline fuels and their mixtures with ethanol. Appl. Sci. 2019, 9, 4900. [Google Scholar] [CrossRef]
- Berger, R. Integrated Fuels and Vehicles Roadmap to 2030+; Roland Berger GmbH: Munich, Germany, 2016. [Google Scholar]
- Lahane, S.; Subramanian, K. Effect of different percentages of biodiesel–diesel blends on injection, spray, combustion, performance, and emission characteristics of a diesel engine. Fuel 2015, 139, 537–545. [Google Scholar] [CrossRef]
- Millo, F.; Debnath, B.K.; Vlachos, T.; Ciaravino, C.; Postrioti, L.; Buitoni, G. Effects of different biofuels blends on performance and emissions of an automotive diesel engine. Fuel 2015, 159, 614–627. [Google Scholar] [CrossRef]
- Wu, Y.; Zhang, X.; Zhang, Z.; Wang, X.; Geng, Z.; Jin, C.; Liu, H.; Yao, M. Effects of diesel-ethanol-THF blend fuel on the performance and exhaust emissions on a heavy-duty diesel engine. Fuel 2020, 271, 117633. [Google Scholar] [CrossRef]
- Mirhashemi, F.S.; Sadrnia, H. NOX emissions of compression ignition engines fueled with various biodiesel blends: A review. J. Energy Inst. 2020, 93, 129–151. [Google Scholar] [CrossRef]
- Salek, F.; Eskandary Nasrabad, A.; Naserian, M. Turbocharged Diesel Engine Power Production Enhancement: Proposing a Novel Thermal-Driven Supercharging System based on Kalina Cycle. Renew. Energy Res. Appl. 2020, 1, 223–234. [Google Scholar]
- Yapicioglu, A.; Dincer, I. Experimental investigation and evaluation of using ammonia and gasoline fuel blends for power generators. Appl. Ther. Eng. 2019, 154, 1–8. [Google Scholar] [CrossRef]
- Ryu, K. Combustion characteristics and exhaust emissions in spark-ignition engine using gasoline-ammonia. Trans. Korean Soc. Automot. Eng. 2013, 21, 155–165. [Google Scholar] [CrossRef]
- Gross, C.W.; Kong, S.-C. Performance characteristics of a compression-ignition engine using direct-injection ammonia–DME mixtures. Fuel 2013, 103, 1069–1079. [Google Scholar] [CrossRef]
- Reiter, A.J.; Kong, S.-C. Demonstration of compression-ignition engine combustion using ammonia in reducing greenhouse gas emissions. Energy Fuels 2008, 22, 2963–2971. [Google Scholar] [CrossRef]
- Reiter, A.J.; Kong, S.-C. Combustion and emissions characteristics of compression-ignition engine using dual ammonia-diesel fuel. Fuel 2011, 90, 87–97. [Google Scholar] [CrossRef]
- Kang, R.; Zhou, L.; Hua, J.; Feng, D.; Wei, H.; Chen, R. Experimental investigation on combustion characteristics in dual-fuel dual-injection engine. Energy Convers. Manag. 2019, 181, 15–25. [Google Scholar] [CrossRef]
- Salek, F.; Babaie, M.; Hosseini, S.; Beg, O. Multi-objective optimization of the engine performance and emissions for a hydrogen/gasoline dual-fuel engine equipped with the port water injection system. Int. J. Hydrog. Energy 2020. [Google Scholar] [CrossRef]
- Liu, H.; Wang, Z.; Wang, J. Methanol-gasoline DFSI (dual-fuel spark ignition) combustion with dual-injection for engine knock suppression. Energy 2014, 73, 686–693. [Google Scholar] [CrossRef]
- Ryu, K.; Zacharakis-Jutz, G.E.; Kong, S.-C. Effects of gaseous ammonia direct injection on performance characteristics of a spark-ignition engine. Appl. Energy 2014, 116, 206–215. [Google Scholar] [CrossRef]
- Grannell, S.M.; Assanis, D.N.; Bohac, S.V.; Gillespie, D.E. The fuel mix limits and efficiency of a stoichiometric, ammonia, and gasoline dual fueled spark ignition engine. J. Eng. Gas Turbines Power 2008, 130, 042802. [Google Scholar] [CrossRef]
- Salek, F.; Babaie, M.; Ghodsi, A.; Hosseini, S.; Zare, A. Energy and exergy analysis of a novel turbo-compounding system for supercharging and mild hybridization of a gasoline engine. J. Therm. Anal. Calorim. 2020. [Google Scholar] [CrossRef]
- Salek, F.; Zamen, M.; Hosseini, S.V.; Babaie, M. Novel hybrid system of pulsed HHO generator/TEG waste heat recovery for CO reduction of a gasoline engine. Int. J. Hydrog Energy 2020, 45, 23576–23586. [Google Scholar] [CrossRef]
- Iliev, S. A comparison of ethanol and methanol blending with gasoline using a 1-D engine model. Procedia Eng. 2015, 100, 1013–1022. [Google Scholar] [CrossRef]
- Iliev, S.P. Developing of a 1-D Combustion model and study of engine performance and exhaust emission using ethanol-gasoline blends. In Transactions on Engineering Technologies; Springer: Dordrecht, The Netherlands, 2015; pp. 85–98. [Google Scholar]
- Sharma, N. Knock Model Evaluation–Gas Engine. (TRITA-ITM-EX). 2018. Available online: https://www.diva-portal.org/smash/record.jsf?pid=diva2%3A1257986&dswid=1617 (accessed on 28 January 2021).
- Farrauto, R.J.; Heck, R.M. Catalytic converters: State of the art and perspectives. Catalysis Today 1999, 51, 351–360. [Google Scholar] [CrossRef]
- Nikolaou, K. Emissions reduction of high and low polluting new technology vehicles equipped with a CeO2 catalytic system. Sci. Total Environ. 1999, 235, 71–76. [Google Scholar] [CrossRef]
- Heck, R.M.; Farrauto, R.J. Automobile exhaust catalysts. Appl. Catalysis A Gen. 2001, 221, 443–457. [Google Scholar] [CrossRef]
Publisher’s Note: MDPI stays neutral with regard to jurisdictional claims in published maps and institutional affiliations. |
© 2021 by the authors. Licensee MDPI, Basel, Switzerland. This article is an open access article distributed under the terms and conditions of the Creative Commons Attribution (CC BY) license (http://creativecommons.org/licenses/by/4.0/).