Abstract
One of the important segments of pedestrian infrastructure are pedestrian bridges. The importance is greater if these bridges are of historical and cultural significance to the city or region. To manage these bridges, it is important to develop an approach that can enable systematic and organized decision-making for experts and policy makers. Hereby, a recovery of bridges is analyzed for the priority ranking of historic pedestrian bridges. Maps of Europe from XIX. Century for the area of Split-Dalmatia County (SDC) are used to locate the bridges. A total of nine bridges are identified, and a set of relevant criteria are defined to evaluate these bridges. The Analytic Hierarchy Process (AHP) is used for the comparison of criteria, evidential reasoning for the assessment of bridges according to each criterion, and then the Technique for Order of Preference by Similarity to Ideal Solution (TOPSIS) is conducted for priority ranking of bridges for the recovery planning. To achieve the final order of bridges it was crucial to take into account mechanical, dynamical, ecological, financial, and, also, social characteristics of these bridges, which was not an easy task. For this reason, the authors proposed a model of decision support to help policy and decision makers in the managing of recovery activities of historic road bridges. The model was conducted on the bridges in the area of SDC, built until the end of the Austro-Hungarian Monarchy.
Keywords:
historic pedestrian bridges; recovery; decision concept; AHP; TOPSIS; evidential reasoning 1. Introduction
One of the main tasks of civil engineers and conservatives is to protect the historical buildings, as the key components of cultural heritage. Among those buildings are historic pedestrian bridges. As most of them are exposed to long periods of non-renovation, the degradation of their elements must be prevented and proper conservation and development of their values needs to be enabled. These bridges are often neglected and unmaintained. To make them usable and to lengthen their life cycle, they need to be adapted to the requirements of modern civilization. Additionally, their historical importance must be preserved. For this reason, materials and technologies used for their recovery, rehabilitation, or maintenence need to keep their originality as much as possible.
Guidelines of the architectural conservation, and local and regional spatial development plans are important to observe when carrying out any construction activities (such as rehabilitation) on these bridges. It is important to recognise that these bridges, as cultural heritage assets, are a resource that needs to be protected, not only in terms of cultural value, but also because of their ability to create socio-economic wealth. The approach of rehabilitating these objects needs to be friendly to the natural environment, and in accordance with the concept of sustainable and systematic development [1,2].
Definition of various criteria and their analysis is important to decide which historic pedestrian bridge has priority in the activity of rehabilitation. During the development of an appropriate set of criteria, as a part of the decision-making approach, difficulties can be present [3]. This is an interdisciplinary problem that demands thorough and detailed approach. To resolve these types of decision problems, effective tools are necessary to synthetically describe their main aim through the use of a decision concept.
The objective decision-making is a demanding task in the construction engineering industry. Usually, this is very demanding, complex, and time consuming because of the compound nature of construction projects.
A multicriteria analysis allows for making decisions to the appropriate selections in light of determined criteria [4,5,6,7,8,9,10]. In the study [11], the use of a multicriteria approach is pointed out in the analysis of a rehabilitation method for an historic road bridge. The manuscript analyzed several variants in which a historical road bridge in Podgrađe, Croatia, could be rehabilitated. In the field of protecting historical structures, various multicriteria decision-making models were developed. Most of the them refer to evaluating these objects [12], supporting the planning decisions that take these objects into account [13,14], as well as establishing priorities in their validation [15,16,17,18,19]. Fuentes [20] used the weighted average method while evaluating the possibility of recovering four historical buildings in Spain. In the study of Wang and Zeng [21] the adaptation variants of two historic buildings in the city of Taipei in Taiwan were analyzed.
Different types of bridges were analyzed in various studies for the priority ranking. Heshvararz–Ghorabaee [22] in their study a modified fuzzy TOPSIS method, to make the priority ranking of bridge design processes under uncertainty, was proposed. The AHP-TOPSIS decision-making model is proposed to compare the priority scale of bridge management in Kecamatan (District) Banjarsari, Surakarta [23]. Rashidi, Samali and Sharafi [24] developed a decision support system for concrete bridge remediation, observing structural efficiency, functional efficiency, and client impact factor. The AHP method has been proposed for the condition ranking of reinforced concrete bridges in the study of Sasmal, Ramanjaneyulu, and Lakshmanan [25]. Sasmal and Ramanjaneyulu [26] developed an approach based on fuzzy AHP to the condition evaluation of existing reinforced concrete bridges. Larsen and Holst [27] developed an appropriate Bridge Management System for the collected data, the monitoring, evaluating, and priority ranking, from a technical and economic point of view, of a bridge stock. Chassiakos, Vagiotas, and Theodorakopoulos [28] presented a knowledge-based system used for maintenance planning of highway concrete bridges which included maintenance priority setting functions of bridges, treatment assessment, and maintenance planning for a bridge stock. Costa, Oliveira, and Vieira [29] used the Measuring Attractiveness by a Categorical-based Evaluation Technique (MACBETH) method to develop a multicriteria model to the prioritization of bridges and tunnels according to their structural vulnerability and strategic importance. Rashidi and Lemass [30] developed a requirements-driven methodology for bridge monitoring and maintenance to assess the bridge condition and find the best remediation treatments using Simple Multi Attribute Rating Technique. Sasmal et al. [31] studied the possibilities of using fuzzy logic theory for condition assessment and rating of bridges, developing a systematic procedure and formulations for rating existing bridges. Sasmal, Ramanjaneyulu, and Iyer [32] used AHP for priority ranking of the existing bridges towards their assessment of condition. Vacheyroux and Corotis [33] presented a probabilistic life-cycle-based investment framework to develop decisions for bridge maintenance and rehabilitation priority ranking using the savings-to-investment ratio as a measure of cost-effectiveness. Xu et al. [34] developed a comprehensive framework for the Condition evaluation of suspension bridges to the maintenance, repair, and rehabilitation. Rashidi et al. [35] developed a decision support system for asset management of steel bridges within acceptable limits of safety, functionality, and sustainability. Mahmoud et al. [36] explained how to achieve reliable assessment of a bridge with visual inspection and the collection of information to achieve a reliable indication of the bridge’s rehabilitation and its priority in the road network. The final outcome is a Bridge Overall Priority Indicator that ranks the bridges according to their condition and maintenance urgency. Park et al. [37] presented a prior ranking approach to the maintenance management of coastal bridges and composed of more reasonable approach studied on previous priority ranking approach to realize bridge maintenance. Wakchaure and Jha [38] developed an alternative approach of data envelopment analysis for scoring the efficiency of 14 selected bridges. Nielsen, Chattopadhyay, and Dhamodharan Raman [39] proposed a bridge life management decision model using degradation, defect initiation and growth, maintenance options, and relevant costs. Sobanjo, Stukhart, and James [40] presented a decision support system to the best set of strategies for bridge rehabilitation and replacement on a highway network. Gattulli and Chiaramonte [41] in their study developed a procedure for bridge condition assessment by visual inspection to the planning and preliminary design of the Bridge Management System for the public railway networks in Italy.
There is no research made for planning the rehabilitation of historical pedestrian bridges, that includes technical, socio-economic, and cultural aspects of some city, region, or country. Additionally, no research used the combination of the AHP, TOPSIS, and evidential reasoning to gain priority ranking of the bridges, which proved to be more precise and accurate than other approaches. These bridges are quite neglected and planning of their rehabilitation is often irrational and unsystematic, mostly driven by ad hoc decisions without detailed visual inspections of the condition of bridge. The key responsibility of the manager is to make transparent decisions with the lowest predicted losses [42]. Decision-making process has been widely used to support managers determine the most appropriate actions for a rehabilitation [43]. Regardless the technical, economic, ecological, or social restraints, applying the principles of decision support, managers can clearly clarify what could be the best course of rehabilitation for a particular bridge. Since that one of the main components of construction management is planning and decision-making, the quality of managing these bridges is needed because of their bad and damaged condition, due to the atmospheric conditions they are exposed to, but also because of their historical significance reflected in the numerous spheres of socio-economic aspects of some area. Deciding how to plan rehabilitation of these bridges can be difficult and comprehensive activity. The complexity of this problem has led to the exploration of the possibility of forming a decision concept that would improve the quality of decision-making in planning the rehabilitation of historic pedestrian bridges.
Hereby, a new approach of decision concept is proposed to rehabilitation planning of the historic pedestrian bridges. With the aid of interactive groups, the goal hierarchy structure is formed in three levels. The four groups of decision makers are formed: civil engineering experts, economic experts, conservatory experts, and users. Each of the experts defined criteria according to their experience and background. The Analytic Hierarchy Process (AHP) method is used to determine criteria weights using Saaty’s scale [44]. For each criterion, interval ratings are defined according to their qualitative or quantitative nature. Furthermore, these ratings are used to evaluated bridges by each criterion. Each group defined common ratings, collected from all members of the group. To determine the assessments of the bridges according to each criterion, the evidential reasoning approach is applied. The aggregated belief decision matrix is calculated to gain final ratings of the bridges. Moreover, the Technique for Order Preference by Similarity to an Ideal Solution (TOPSIS) [10] method is used as a tool of multicriteria analysis of the selected bridges and their priority ranking for the rehabilitation. The ideal and anti-ideal alternative is determined, then the Euclidian distances of each alternative form ideal and anti-ideal alternative are calculated. Finally, the relative closeness (RC) is demonstrated, and bridge with the lowest RC is ranked first for the rehabilitation.
The proposed decision concept is based on multicriteria analysis that will improve the quality of decision-making in the rehabilitation planning of historic road bridges. The validation of the new formed decision concept was limited to the planning of rehabilitation of bridges built during or before the Austro-Hungarian Monarchy in the area of Split-Dalmatia County (SDC).
The research is divided into five sections. Firstly, the Introduction with the explanations of the research aim and novelty is presented, what follows the theoretical background of the multicriteria methods AHP, TOPSIS, and evidential reasoning, and the description of the proposed model in Section 2. In Section 3, obtained results are presented, and furthermore, in Section 4, throughout discussion, the comparison is conducted of the obtained outcomes with other studies. Additionally, in this section, strength and limits of the new proposed model are discussed. In the last section, conclusion remarks are provided.
2. Materials and Methods
Decision concept to the recovery planning of the historic pedestrian bridges is based on the logic of the decision support system for recovery planning of the historic road bridges [45]. Furthermore, the explanation of the AHP method, evidential reasoning approach, and TOPSIS method is presented. Finally, in this section, the proposed decision concept is described.
2.1. The AHP Method
The Analytic Hierarchy Process (AHP), is a method dealing mostly with the compound decision making problems and comparison of the several criteria. It analyzes the problem through different hierarchy levels, starting from a main goal and lowering to objectives, criteria, and alternatives. Each level is evaluated by experts. The AHP determines the relative importance according to involved stakeholders. Criteria with the higher weights are of greater importance, and criteria with lower weights are of less importance. Alternatives are evaluated according to the defined criteria, and the final ranking is achieved by combining the criteria weights and the alternatives evaluations. The weights are stakeholders’ subjective assessments, and groups of stakeholders are usually formed according to their common preferences and experiences. The final criterion weight is the averaged value, defined individually by each group [46]. A pairwise comparison matrix C needs to be introduced to calculate the criteria weights. Matrix C is the size of n × n dimensions, where n is the number of defined criteria. Each number in the matrix represents the importance of the jth criterion in relation to the kth criterion. Value defines relationship between the jth and kth criteria:
- (i)
- jth criterion is more important than the kth criterion;
- (ii)
- jth criterion is less important than the kth criterion;
- (iii)
- jth criterion is equally as the kth criterion;
To measure the relative importance of criteria the Saaty’s scale is used. After the definition of criteria weights, the normalized weights of decision matrix, are calculated. Each column of the matrix in summing is 1. Then, each element of the normalized matrix is demonstrated as [44]:
The weight vector of criteria w is calculated using arithmetic mean of each row in the
The decision matrix is generated for each hierarchy level using pairwise comparison, and its dimensions are defined based on the elements numbers of each level. Finally, relative eigenvector and maximum eigenvector are calculated.
Furthermore, to determine the consistency of the matrix, the consistency ratio is necessary to calculate. Firstly, the consistency index () is defined as follows [44]:
where is the maximum eigenvalue of the matrix and is the dimension of matrix. The consistency ratio is calculated as follows:
where is the random consistency index. The acceptable value of the consistency ratio relies on the dimensions of matrix (0.1 for matrices n ≥ 5). If the consistency ratio is equal to or smaller than 0.1, then the criteria weights are acceptable and close to ideal values. Otherwise, comparisons process must be improved by research stakeholders.
2.2. The Evidential Reasoning
The evidential reasoning is an approach used for multicriteria decision making problems analysis. The approach can deal with various challenges based on uncertainty, vagueness and fuzziness simultaneously. The ER approach is used for analyzing multicriteria decision making problems under uncertainties. Dealing with various judgments, which are mostly incomplete and vague, it is possible to design the belief structure. This way an expert can describe the assessment information in a flexible and trustworthy manner [47]. A belief structure is a distributed assessment defined by belief degrees, and it is used to demonstrated the performance of an alternative evaluated by a criterion [48]. For example, in multicriteria decision making problem there are bridges (alternatives) evaluated by criteria, and one of the criteria is bridge condition. The bridge condition of the th () bridge is evaluated as “Very good” to degree, e.g., 0.7, due to the humidity, micro cracks, and mild vegetation. However, the condition of the same bridge, at the same time, can be evaluated as “Poor” to the degree 0.3 because its shortcomings can still be improved. This evaluation can be presented by belief structure as: = ((Very good, 0.7), (Poor, 0.3)). Where “Very good” and “Poor” are evaluation ratings, while “0.7” and “0.3” are degrees of belief. It can be concluded that a belief structure might theoretically be a continuous probability or belief distribution.
A distributed modeling form is used where each criteria is defined by a set of assessment ratings [49]. The approach is designed based on the Dempster–Shafer theory of evidence [50], and decision theory, dealing with both quantitative and qualitative criteria in decision making. The various types of uncertainties can be possible is evidential reasoning by using the belief structure concept [51] and belief decision matrix [52]. This approach is capable of handling multicriteria decision making problems with uncertainty and duality nature [53,54]. The evidential reasoning involves identification of criteria evaluation, transformation of various sets of evaluated ratings to a common form of dissimilitude by uniting belief structures and this way comparing and aggregating the ratings consistently [55], and generating the priority ranking. The evaluation of criteria is defined by expert’s judgments. In identifying criteria, all criteria are modeled in terms of criteria weight using various types of input data such as crisp numbers, comparison numbers and belief structures, and creating a belief decision matrix. Crisp numbers are single values, interval numbers are judgments in scales, belief structures represent an evaluation as a distribution. This can be very difficult task for an expert if he or she is not completely confident in an assessment because of the lack of evidence or incomplete assessment. In the case when there is no data available, to assess the alternative by criterion the total degree of belief is zero in belief structure. The total alternative assessment is signified by the aggregated distributed assessments. Priority ranking presents the performance of alternatives by all the criteria of the assessment through a systematic and rational evaluations.
Let there be alternatives in multicirteria decision making problem, and criteria , and the corresponding criteria weight vector is denoted by , such that and Then, the set of assessment ratings, which are supposed to be collectively exhaustive and commonly exclusive, is , and the alternative under criterion is assessed as , where is a belief degree of the alternative belonging to rating on the criteria , satisfying and [35]. The degree of belief of each alternative on every criterion can be considered as evidence. Criteria values can be aggregated using evidential reasoning. A belief decision matrix can be used to represent the performance of alternatives evaluations defined by the evidential reasoning. Aggregation of the distributed evaluations by all criteria and generation of an overall alternatives evaluations can be conducted using evidential reasoning based on the belief decision matrix. At the beginning, the belief degrees are transformed into the probability mass [56]:
Hereby, is the basic probability mass representing the degree to which the alternative is evaluated to the rating on the th criteria , and is the remaining probability mass unassigned to any individual rating on criteria . for all and
The probability mass assigned to the rating set , is the sum of two parts: caused by the relative importance of the th criterion and which reflects the importance of the th criterion . Then, all the criteria are aggregated to generate the combined degree of belief in each possible rating Suppose is the combined degree of belief in by aggregating the first criteria , and is the remaining degree of belief unassigned to any rating. After that, the criteria are aggregated by combining the basic probability masses that are obtained above. Let and . Then, the overall belief degree of rating is calculated as follows [48]:
For {} there is:
For {} there is:
where, and . Furthermore, using abovementioned algorithms the degree of belief of alternative to the rating can be calculated as follows [57]:
For {} there is:
For {} there is:
where is a remaining belief degree unassigned to any . and are the degrees of belief of the aggregated evaluations. Mahmud et al. [31] proved that . These are nonlinear functions presenting weights of criteria and can also be marked by and , respectively.
2.3. The TOPSIS Method
The TOPSIS method was proposed by Hwang and Yoon [58], and then lately it was developed by Chen and Hwang [59]. It is a technique of preference order by closeness to ideal solution. It is useful and practical multicriteria decision making tool to deal with real-life complex problems [60]. The ideal alternative, according to this method, is the one that is closest to the positive ideal option and farthermost from the negative ideal option [61]. The positive ideal option maximizes the benefit criteria and minimizes the cost criteria, whereas the negative ideal option, called anti-ideal option, maximizes the cost criteria and minimizes the benefit criteria [10]. In short, the positive ideal option is composed of all ideal achievable criteria values, whereas the negative ideal option consists of all the worst achievable criteria values [62]. It is assumed that each criterion is monotonically increasing or decreasing. If each criterion has a monotone increasing (or decreasing) effective function, the positive ideal option, which consists of the best criterion values, and the negative ideal option, which consists of the worst, can be computed [63]. Euclidean distances are used to measure the distance of each alternative from the positive ideal option and anti-ideal option. The preference order of alternatives is achieved through the comparison of Euclidean distances.
Let a multicriterial decision making problem has n alternatives, A1, …, An, and m decision criteria, C1, …, Cm. Alternatives are evaluated with respect to the m criteria. All the ratings assigned to the alternatives with respect to each criterion form a decision matrix are denoted by . Let ) be the relative weight vector about the criteria, satisfying Then, the TOPSIS process is performed as follows [64]:
(i) Normalization of the decision matrix :
where is the normalized criteria rating.
(ii) Calculation of the weighted normalized decision matrix
where wj is the relative weight of the jth criterion, and
(iii) Determination of the positive ideal and negative ideal solutions.
where and are the sets of benefit criteria and cost criteria, respectively.
(iv) Calculation of the Euclidean distances of each alternative from the positive ideal solution and the negative ideal solution, respectively.
(v) Calculation of the relative closeness coefficient of each alternative to the ideal solution. The relative closeness coefficient of the alternative with respect to is defined as:
(vi) The alternatives ranking comparing the relative closeness coefficient is determined.
2.4. The Proposed Decision Concept
Vagueness dominates in real-life decisions due to insecure, unavailable, and uncertain data such as fuzziness, imprecision, incompleteness, and ignorance [65]. Most of the decisions involve the opinions and attitudes of a group of decision makers instead of an individual decision maker. For this reason, in this research focus is on the decision making with uncertainty and multiple decision makers that are gathered in groups for a belief multicriteria decision making problem.
Let there be alternatives and P decision groups . Alternatives are assessed by criteria. To handle the uncertainty of decision problems, the decision concept is proposed and applied to present the judgments of decision makers. Due to the above context, the decision concept is defined through AHP-evidential reasoning-TOPSIS methodology for the group multicriteria decision making problem demonstrated in the 13 steps and illustrated in Figure 1.
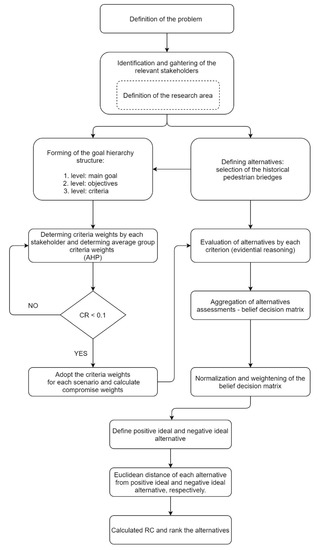
Figure 1.
The decision concept to the recovery planning of historic pedestrian bridges.
Step 1. Defining the problem and gathering of the relevant experts and stakeholders. Dividing them into the groups, and determining the research area.
Step 2. Mapping and defining the historic pedestrian bridges.
Step 3. Modeling a goal hierarchy structure, introducing the main goal and dividing it into the objectives and criteria, and at the lowest level, alternatives.
Step 4. Defining the comparison matrix for each group by AHP method using Saaty’s nine-grade scale, where 1 = equally important, 3 = slightly important, 5 = very important, 7 = much more important, 9 = extremely more important. The 2, 4, 6, and 8 are values in between. Each expert from each group gave his or her attitude on each criterion. Their opinions are further integrated using average values of criteria weights and are expressed as scenarios.
Step 5. After the definition of criteria weights by each group, priority vector, and the maximum eigenvalue () for each matrix is calculated.
Step 6. Checking the validity of comparison matrices using consistency ratio.
Step 7. Constructing a belief decision matrix of each group and defining the weights of decision makers’ groups. Assessing the bridges by each group according to each defined criterion as follows:
where is the group belief decision matrix for each group, is the weight of decision group , where is weight of criterion , and is a rating in a belief decision matrix. It means that, in the opinion of decision group , alternative is evaluated as rating with the degree of belief of according to criterion .
Step 8. Aggregation of group belief decision matrices into the belief decision matrix using the evidential reasoning. The aggregated belief decision matrix can be expressed as [65]:
With all its elements, , defining aggregated ratings of alternative according to criterion . As and , where = and are both belief structures, then the relation between and is described as follows [65]:
where
where is the weight of th decision group.
Step 9. Normalization of the aggregated group belief decision matrix using the following expression:
After that, multiplication of the columns of normalized belief decision matrix with the calculated criteria weights is conducted to obtain the weighted decision matrix:
where is the weight of criterion
Step 10. Definition of the positive ideal and negative ideal alternatives, denoted as and respectively. These alternatives are introduced as follows [66]:
where is the set of benefit criteria and is the set of cost criteria.
Step 11. Calculation of the distance of the existing alternatives from the positive ideal and negative ideal alternatives using Euclidean distance, and . The positive-ideal and negative-ideal alternatives, respectively, are obtained by following expression:
Step 12. Determination of the relative closeness to the ideal alternative as follows:
Step 13. Priority ranking of the alternatives according to .
3. Results
Hereby, a numerical example of the proposed decision concept is presented. The criteria weights are obtained by the AHP method. The ranking of alternatives is provided using the multicriteria TOPSIS method, defining the distance of each alternative from positive-ideal and negative-ideal alternative. For each criterion the definition of the minimum and maximum is defined, this way benefit and cost criteria are recognized, respectively. The result of the proposed methodology is a priority ranking of historical pedestrian bridges, and with it the quality foundation for decision making of planning the recovery of bridges is provided. After the ranking is done, the results are shown to final decision maker who can now easily, with more information, decide about future activities related to realization of the recovery plan. The bridges are identified using maps of Europe from XIX. Century, precisely using area of Austro-Hungarian Monarchy. In Figure 2, on the left is the map of Europe and on the right is the map of Split-Dalmatian County (SDC) where bridges were located. Locations of bridges are then compared with modern maps to identify all existing bridges. After the detailed analysis, nine bridges were listed.

Figure 2.
Map of Europe in the XIX. Century (left), Split-Dalmatian County in the XIX. Century (right).
As is already mentioned in previous chapter, the goal hierarchy structure has been established and within it all the goals and criteria required for a high-quality and efficient decision-making at all levels of decision hierarchy are included. This ensures the consistency of goals and criteria because lower level objectives support higher-level goals and lower-level criteria support higher level objectives. The goal hierarchy structure, presented in Figure 3, is divided into three levels and is formed to obtain the rank of historical pedestrian bridges by recovery priority.
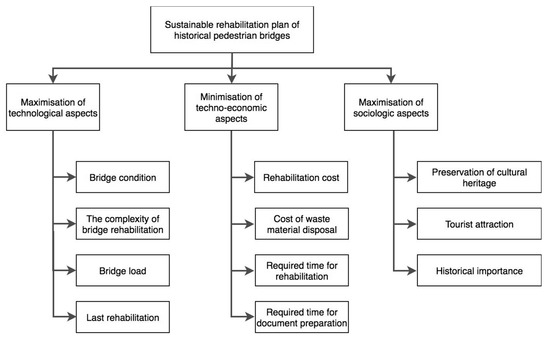
Figure 3.
The goal hierarchy structure for the rehabilitation planning of historical pedestrian bridges.
Four stakeholders’ groups with their representatives were involved into the formation of goal hierarchy structure: civil engineering experts (two representatives from Faculty of Civil Engineering, Architecture and Geodesy in Split), experts for conservation of historical buildings (two representatives from the local authority—Department of Conservation in Split which has the main role in managing and deciding when it comes to the historic pedestrian bridges), economic experts (two representatives from private civil engineering company in Split), and users (two representatives from the area of SDC). As a main goal, “Sustainable rehabilitation plan of historical pedestrian bridges” is defined. Each stakeholders’ group define objectives and criteria from their area of profession. After defining the main goal, objectives and criteria are generated. The important part of defining the most relevant objectives and criteria is obtaining objectivity. Thus, each group’s stakeholders achieved a consensus on each objective and criterion before it was included in the goal hierarchy structure.
The objectives, that support the main goal, are introduced as follows: maximization of technological aspects, minimization of techno-economic aspects, and maximization of sociologic aspects. The given objectives present stakeholders’ consensus to highlight all crucial factors of the analyzed problem. Therefore, each of the defined objectives are the satisfaction of one of the aspects of analyzed problem, that are important to stakeholders. This concept is used to define objectives and criteria, and to insure an adequate objectivity when forming a goal hierarchy structure. The proposed concept is very useful, it requires a low stakeholders’ adjustment to a new approach, it is practical, applicable and similar to the usual decision making principles. In this manner, criteria that will be used for evaluating historical pedestrian bridges were defined. These criteria are supporting achievement of upper level objectives, they are measurable and no further divisibility is required.
In Table 1, characteristics of criteria are given: label, name, description and assessment technique, type of criteria (quantitative or qualitative), minimum and maximum. The five criteria minimum (smaller values are preferred) is established and the rest six criteria got maximum (higher values are preferred).

Table 1.
Criteria label and description.
Members of each stakeholders’ groups defined criteria weights. Each group form one scenario. In this case, four scenarios are created: civil engineering experts (SC1), economic experts (SC2), conservatory experts (SC3), and users (SC4). The AHP is used to determine criteria weights by mutual comparison of criteria, using Saaty’s scale. The geometric mean is used for calculating final weight for each criterion by each decision group. Weight allocation started from the main goal and went to the last level of hierarchy (criteria). The sum of criteria weights is 1. In Table 2, four scenarios are presented. Maximum eigenvector
and consistency ratio are calculated for each scenario. Random index () for is 1.51. Final weights for further calculation are obtained by arithmetic mean. Obtained average weights values represent equally stakeholders’ involvement in the process of weights determination.

Table 2.
Criteria weights by three scenarios and compromise scenario.
Compromise scenario is defined as final weights values which are calculated as follows:
As it can be seen in Table 3, the criteria weights are as expected to be. This especially can be said for C1 which has the highest value for SC1. SC2 found criteria C5 and C6, the most important, SC3, criterion C9, and C5 and C9 for SC4. The compromise scenario is expressed considering opinions of all stakeholders uniformly.

Table 3.
Assessments of historic pedestrian bridges (linguistic values and numerical values in sets).
Observed historical pedestrian bridges located in SDC are given in Figure 4, Figure 5, Figure 6, Figure 7, Figure 8, Figure 9, Figure 10, Figure 11 and Figure 12 with their names, locations, and labels. There are nine pedestrian bridges found in the area of SDC. Some of the bridges are in quite bad and damaged condition and are in need for quick rehabilitation. Evaluation of these bridges is conducted using evidential reasoning, and the priority ranking is obtained by TOPSIS method as is explained in the previous section.
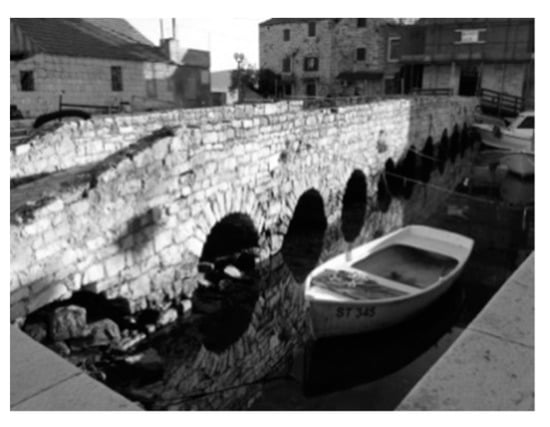
Figure 4.
Kaštilac, Kaštel Gomilica (B1).
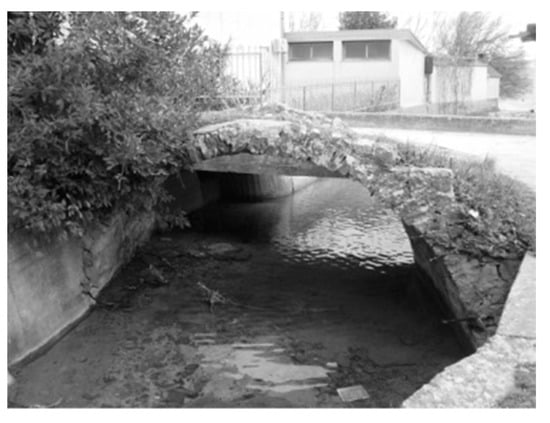
Figure 5.
Ričevica, Kaštel Štafilić (B2).
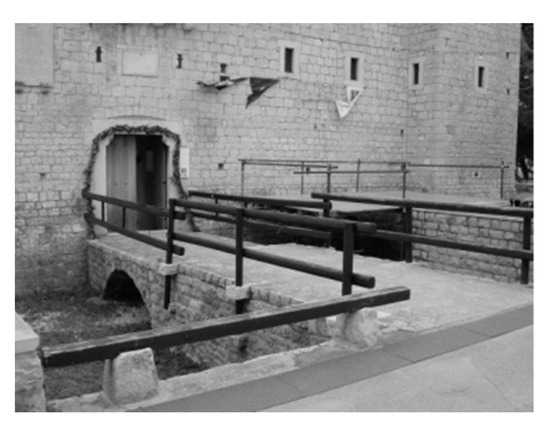
Figure 6.
Castel Vitturi, Kaštel Lukšić (B3).
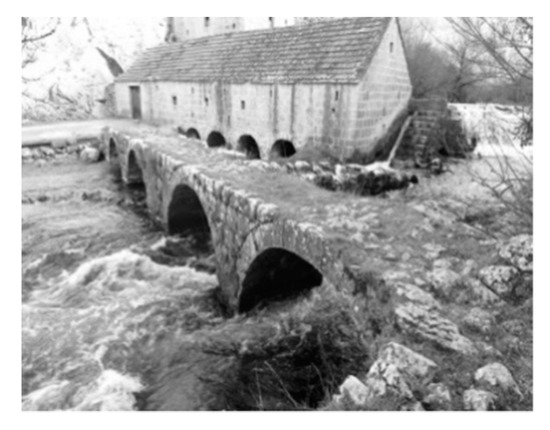
Figure 7.
Ćosić mill, Grab (B4).
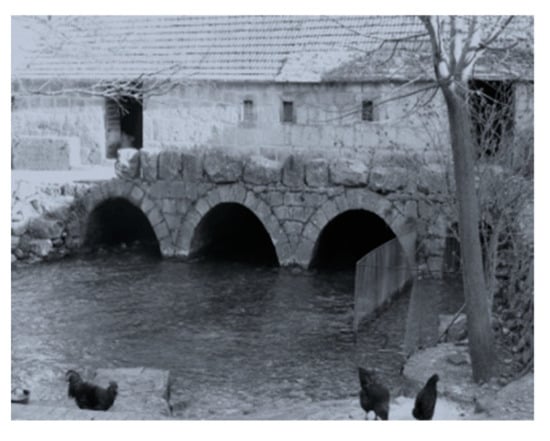
Figure 8.
Samarđić mill, Grab (B5).
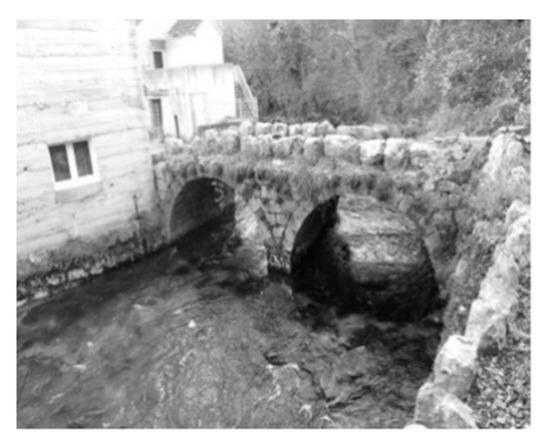
Figure 9.
Small bridge over river Grab, Grab (B6).
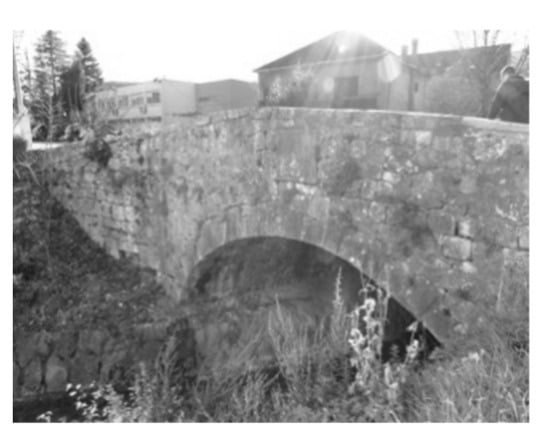
Figure 10.
Goručica, Sinj (B7).
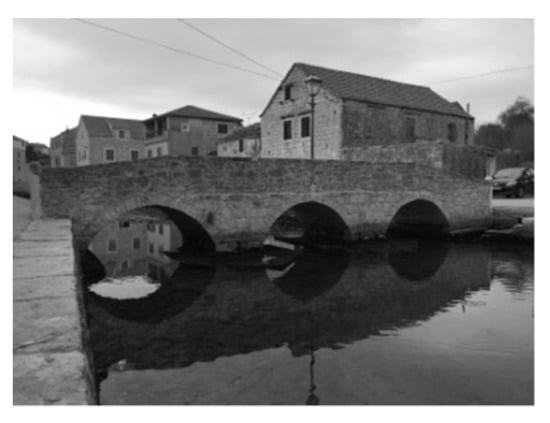
Figure 11.
Vrboska, Hvar (B8).
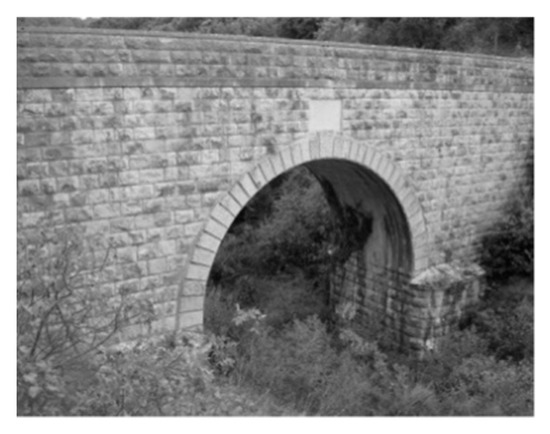
Figure 12.
Franjo Josip, Brač (B9).
The evidential reasoning is developed based on evidence theory [50] and belief decision matrix [67] with the aim to manage complex and uncertain evaluation problems. Unlike other multicriteria decision making approaches, evidential reasoning is capable of handling the vagueness and diversity, due to the involvement of the belief decision matrix in the approach. When using the belief decision matrix, the assessment of alternative by a criterion is presented with a distribution instead of a single number as is in traditional decision matrix. This way, using distributed values, the impact of imprecisions on the evaluation process is lower. Unlike a traditional decision matrix, the belief decision matrix can deal with the dualities and insecurity, when modeling multicriteria decision making problems. The belief decision matrix designs a new structure to model multicriteria decision making problems, by alternative evaluation based on a two-dimensional variable, consisting of evaluation ratings and their associated belief degrees, while handling quantitative and qualitative criteria with uncertainty, duality, and incomplete evaluation values.
Overall, 11 criteria are defined to evaluate alternatives, as is summarized in Table 1. The defined criteria have different relative importance and play different roles in the evaluation procedure of evidential reasoning approach. Some of the criteria are extremely important, some of them are important, but not very or extremely important compared with the others. Furthermore, evaluation ratings need to be defined. What kind of evaluation ratings should be used depends on the requirement from the observed problem. The most preferred and used assessment ratings in the literature are: worst (W), poor (P), average (A), good (G), and excellent (E), [57] for the simplicity. Hereby, the same evaluation ratings are applied for all criteria. For the rest of the criteria, different linguistic values are defined according to criteria meaning. Numerical values are defined according to the type of criteria, qualitative or quantitative. In Table 3, definition of evaluation ratings is given with linguistic and numerical value. For quantitative criteria linguistic and numerical values are presented, while for the qualitative criteria sets are additional defined for clearer explanation of the rating. These values are used for the bridges’ assessments according to each criterion by each expert and stakeholder.
Furthermore, each stakeholder from each group gave his opinion, an assessment, on each bridge using ratings defined in Table 3. There are five ratings defined for each criterion, and to each rating the belief value is assigned. In Table 4, the belief values are presented for the first decision group (civil engineers) as an average value of all stakeholders from the group.

Table 4.
Belief decision matrix of the alternatives assessments by the first decision group according to each criterion.
After each group has defined evaluation ratings of the bridges, the aggregated values are calculated for each rating according to each criterion, using expressions (25) and (26). Each group is equally important, and the weights are defined as: The aggregated values are presented in Table 5.

Table 5.
Aggregated belief decision matrix of the alternatives assessments given by all groups.
The values from Table 5 are further normalized, using Equations (27) and (28), and multiplied by the criteria weights determined by the AHP method. After that, positive ideal and negative ideal alternatives are determined as follows.
Final results are presented in Table 6 with distances of alternatives from positive ideal ( and negative ideal ( alternative. Relative closeness is calculated by Equation (33). Hereby, the bridge with the smallest relative closeness is considered the most necessary for the remediation. In Table 6 the ranking of historical pedestrian bridges for rehabilitation priority is given. Bridge Kštilac (B1) is ranked first and Castel Vitturi (B3) the last one, with RC = 0.446 and 0.395, respectively. Bridge B1 is indeed in very bad condition, it is subject to subsidence and erosion, while bridge B3 is in the best condition when comparing with other bridges, and recent rehabilitation also contributes to this.

Table 6.
Distance of alternatives from ideal and anti-ideal alternative and closeness coefficient.
4. Discussion
In previous studies [46,47,48,49,50,51,52,53,54,55,56,57], evidential reasoning is used and it is proved to be a robust tool when dealing with uncertain and vagueness data in decision-making. However, the main shortage is that the final decision is obtained by calculated interval numbers instead of crisp values when only this method is engaged. Hence, hereby, the AHP and TOPSIS methods are integrated into the group decision-making and, this way, the limits that the traditional method encounters are minimized or removed. This research proposed four decision-making groups participated in process of decision making. Each group proposed its own set of criteria according to their background and experience. Within the AHP method, the Saaty’s scale is used to compare defined criteria and to gain their relative importance. Furthermore, unlike other studies, the process firstly continued with the evaluation of bridges by the defined criteria, using determined interval ratings. Then the TOPSIS method is integrated, obtaining the ideal and anti-ideal alternative according to the type of the criteria. Finally, with the Euclidian distance and relative closeness, the priority ranking of the bridges is calculated, where the bridge with the lowest relative closeness is determined the most urgent for the remediation. Combining three multicriterial methods had gain more precise and accurate outcomes. For example, studies [22,23,24,25,26,27,28,29,30,31,32,33,34,35] used the AHP or TOPSIS, or both methods to rank bridges according to the priority of the remediation or maintenance. Authors made a comparison with these studies within which the collected data are conducted through the AHP, TOPSIS, AHP-TOPSIS, and the results are compared with the proposed decision concept based on the AHP-evidential reasoning-TOPSIS methodology. The results are presented in the Table 7. From the given outcomes, it is obvious that the combination of the two multicriteria methods gain more precise ranking, but still not quite similar as obtained by the proposed approach. From the AHP-TOPSIS methodology, the B1 alternative, as the most deteriorated, is places on the third rank, while B3, as the least damaged, is penultimate.

Table 7.
Comparison of the proposed approach with other studies.
The advantages of the proposed decision concept are the accuracy and certainty of the obtain outcomes. Combination of the more different multicriteria methods can define more precise results. The model is easy to follow and can be applied on any other decision-making problem. The limit is that the stakeholders and experts still have to be mainly involved in the whole process, and for this reason in the future research an expert system will be integrated into the proposed decision concept to minimize the human inclusion.
5. Conclusions
Historic pedestrian bridges are a key asset of cultural and socio-economical aspects of a city or region. The research aim was to propose a decision concept that will assist and improve decisions for final policy and decision makers, which is in this case was the Department of Conservatory in Split, in planning of the recovery of historic pedestrian bridges. A total of four stakeholders’ groups were involved in the problem solving and creating the goal hierarchy structure. Planning of the rehabilitation of historic pedestrian bridges is an ill-structured problem and a compound process of decision-making that requires qualitative and quantitative methodology using adequate decision tools. A multicriteria decision-making analysis is proposed for this problematic because of the numerous mutually conflicted criteria and stakeholders involved in the process. The technique of AHP method is used to determine relative importance of each objective and criterion. Furthermore, defined criteria are used to evaluate bridges, and criteria weights are calculated for the further procedure. The approach of evidential reasoning is introduced to establish the evaluation ratings of the bridges. Each decision group defined its ratings of bridges according to each criterion. Ratings are determined by the proposed interval numbers instead of the crisp values. Finally, the aggregated decision matrix of ratings in the form of the belief matrix is designed. Furthermore, by the TOPSIS method a complete priority ranking of the historic pedestrian bridges is provided, calculating the Euclidian distance of each alternative from the ideal and anti-ideal solution and relative closeness index. Hereby, bridges with the smallest relative closeness are considered with the highest priority for the rehabilitation. The proposed decision concept is then tested to verify that the approach can be used in an engineering practice. Nine bridges were analyzed according to the defined eleven criteria. Kaštilac bridge (B1) was ranked first with a closeness coefficient of 0.446 and the bridge by Castle Vitturi (B3) was ranked last with a coefficient value of 0.626. This results presents the objectivity and reality of the evaluated ratings, because the ranking of these bridges fits with the current condition of these bridges, and hence the planning schedule of their need for the rehabilitation.
After the above mentioned, the model of decision concept proved to be useful and supportive when it comes to the decision-making of historic pedestrian bridges recovery planning. Since the new model is flexible and easy to understand, it can be applied to other historic buildings in terms of recovery planning with the small changes (if necessary) in the model, especially in the goal hierarchy structure. Therefore, the proposed methodology would be upgraded with defined relevant criteria and scenarios to assess historic objects for the recovery projects.
In summary, the proposed decision concept, based on the combination of three multicriteria methods, enables reliable support for the priority ranking of objects for the activity of remediation, according to the deterioration condition of pedestrian bridges. Therefore, the concept does not provide security only to project experts and stakeholders, but can also be introduced as an easy and fast learning tool for new experts. It can be an effective and useful approach to the strategies optimization undertaken by local and regional authorities, to resist increasing deterioration on historic pedestrian bridges.
Author Contributions
Conceptualization, K.R., J.K.P., and N.J.; methodology, K.R., J.K.P., and N.J.; software, K.R., J.K.P., and N.J.; validation, K.R., J.K.P., and N.J.; formal analysis, K.R., J.K.P., and N.J.; investigation, K.R., J.K.P., and N.J.; resources, K.R., J.K.P., and N.J.; data curation, K.R., J.K.P., and N.J.; writing—original draft preparation, K.R., J.K.P., and N.J.; writing—review and editing, K.R., J.K.P., and N.J.; visualization, K.R., J.K.P., and N.J.; supervision, K.R., J.K.P., and N.J.; project administration, K.R., J.K.P., and N.J.; funding acquisition, K.R., J.K.P., and N.J. All authors have read and agreed to the published version of the manuscript.
Funding
This research received no external funding.
Institutional Review Board Statement
Not applicable.
Informed Consent Statement
Not applicable.
Data Availability Statement
Data available on request due to restrictions e.g., privacy or ethical. The data presented in this study are available on request from the corresponding author. The data are not publicly available due to further research to be published.
Acknowledgments
This research is partially supported through project KK.01.1.1.02.0027, a project co-financed by the Croatian Government and the European Union through the European Regional Development Fund—the Competitiveness and Cohesion Operational Programme.
Conflicts of Interest
The authors declare no conflict of interest.
References
- Affelt, W.J. Dziedzictwo techniki jako czastka kultury (The Heritage of Technology as a Particle of Culture). W strone dziedzictwa zrównowazonego (cz.2) (Within the Sustainable Development Current), Ochrona Zabytków (Protection of Historical Structures). 2009, Volume 1, pp. 53–82. Available online: http://polona.pl/item/39077718 (accessed on 27 December 2020).
- Throsby, D. Cultural Capital and Sustainability Concepts in the Economics of Cultural Heritage, Assessing the Values of Cultural Heritage; The Getty Conservation Institute: Los Angeles, CA, USA, 2002. [Google Scholar]
- Radziszewska-Zielina, E.; Sladowski, G. Supporting the selection of a variant of the adaptation of a historical building with the use of fuzzy modeling and structural analysis. J. Cult. Herit. 2017, 26, 53–63. [Google Scholar] [CrossRef]
- Jajac, N.; Bilic, I.; Ajduk, A. Decision support concept to management of construction projects - problem of construction site selection. Croat. Oper. Res. Rev. 2013, 4, 235–246. [Google Scholar]
- Jajac, N.; Marović, I.; Baučić, M. Decision support concept for managing the maintenance of city parking facilities. Electron. J. Fac. Civ. Eng. Osijek-e-GFOS 2014, 5, 60–69. [Google Scholar] [CrossRef]
- Jajac, N.; Marović, I.; Mladineo, M. Planning support concept to implementation of sustainable parking development projects in ancient Mediterranean cities. Croat. Oper. Res. Rev. 2014, 5, 345–359. [Google Scholar] [CrossRef]
- Marović, I.; Car-Pušić, D.; Hrvatin, Z. Establishing a model to evaluate public administration projects. e-GFOS 2014, 5, 56–66. [Google Scholar] [CrossRef]
- Marović, I.; Hanak, T. Selection of adequate site location during early stages of construction project management: A multi-criteria decision analysis approach. IOP Conf. Ser. Mater. Sci. Eng. 2017, 251, 012044. [Google Scholar] [CrossRef]
- Marovic, I.; Zavrski, I.; Jajac, N. Ranking zones model—A multicriterial approach to the spatial management of urban areas. Croat. Oper. Res. Rev. 2015, 6, 91–103. [Google Scholar] [CrossRef]
- Tavra, M.; Jajac, N.; Cetl, V. Marine Spatial Data Infrastructure Development Framework: Croatia Case Study. ISPRS Int. J. Geo-Inform. 2017, 6, 117. [Google Scholar] [CrossRef]
- Jajac, N.; Rogulj, K.; Radnic, J. Selection of the Method for Rehabilitation of Historic Bridges-A Decision Support Concept for the Planning of Rehabilitation Projects. Int. J. Arch. Herit. 2017, 11, 261–277. [Google Scholar] [CrossRef]
- Dutta, M.; Husain, Z. An application of Multicriteria Decision Making to built heritage. The case of Calcutta. J. Cult. Herit. 2009, 10, 237–243. [Google Scholar] [CrossRef]
- Girard, F.L.; De Toro, P. Integrated spatial assessment: A multicriteria approach to sustainable development of cultural and environmental heritage in San Marco dei Cavoti, Italy. CEJOR 2007, 15, 281–299. [Google Scholar] [CrossRef]
- Paolillo, P.L.; Benedetti, A.; Baresi, U.; Terlizzi, L.; Graj, G. An assessment-based process for modifying the built fabric of historic centers: The case of Como in Lombardy. In International Conference on Computational Science and Its Applications, ICCSA 2011, Part I, LNCS; Murgante, B., Gervasi, O., Iglesias, A., Taniar, D., Apduhan, B.O., Eds.; Springer: Berlin, Germany, 2011; Volume 6782, pp. 162–176. [Google Scholar]
- Kutut, V.; Zavadskas, E.K.; Lazauskasn, M. Assessment of priority alternatives for preservation of historic buildings using model based on ARAS and AHP methods. Arch. Civ. Mech. Eng. 2014, 14, 287–294. [Google Scholar] [CrossRef]
- Šiožinyte, E.; Antuchevičiene, J.; Kutut, V. Upgrading the old vernacular building to contemporary norms: Multiple criteria approach. J. Civ. Eng. Manag. 2014, 20, 291–298. [Google Scholar] [CrossRef]
- Tupenaite, L.; Zavadskas, E.K.; Kaklauskas, A.; Turskis, Z.; Seniut, M. Multiple criteria assessment of alternatives for built and human environment renovation. J. Civ. Eng. Manag. 2010, 16, 257–266. [Google Scholar] [CrossRef]
- Turskis, Z.; Zavadskas, E.K.; Kutut, V. A model based on ARAS-G and AHP methods for multiple criteria prioritizing of heritage value. Int. J. Inf. Technol. Decis. Mak. 2013, 12, 45–73. [Google Scholar] [CrossRef]
- Vodopivec, B.; Žarnić, R.; Tamošaitiene, J.; Lazauskas, M.; Šelih, J. Renovation priority ranking by multicriteria assessment of architectural heritage: The case of castles. Int. J. Strateg. Prop. Manag. 2014, 18, 88–100. [Google Scholar] [CrossRef]
- Fuentes, J.M. Methodological bases for documenting and reusing vernacular farm architecture. J. Cult. Herit. 2010, 11, 119–129. [Google Scholar] [CrossRef]
- Wang, H.; Zeng, Z. A multiobjective decision-making process for reuse selection of historic buildings. Expert Syst. Appl. 2010, 37, 1241–1249. [Google Scholar] [CrossRef]
- Keshavarz-Ghorabaee, M.; Amiri, M.; Zavadskas, E.K.; Turskis, Z.; Antuchevičienė, J. Ranking of bridge design alternatives: A TOPSIS-FADR method. Balt. J. Road Bridg. Eng. 2018, 13, 209–237. [Google Scholar] [CrossRef]
- Intan Nurani, S.A.; Pramudyaningrum, A.T.; Rizqi Fadhila, S.; Sangadji, S.; Hartono, W. Analytical Hierarchy Process (AHP), Fuzzy AHP, and TOPSIS for Determining Bridge Maintenance Priority Scale in Banjarsari. Int. J. Sci. Appl. Sci. Conf. Ser. 2017, 2, 60–71. [Google Scholar] [CrossRef]
- Rashidi, M.; Samali, B.; Sharafi, P. A new model for bridge management: Part A: Condition assessment and priority ranking of bridges. Aust. J. Civ. Eng. 2016, 14, 35–45. [Google Scholar] [CrossRef]
- Sasmal, S.; Ramanjaneyulu, K.; Lakshmanan, N. Priority ranking towards condition assessment of existing reinforced concrete bridges. Struct. Infrastruct. Eng. Maint. Manag. Life-Cycle Des. Perform. 2007, 3, 75–89. [Google Scholar] [CrossRef]
- Sasmal, S.; Ramanjaneyulu, R. Condition evaluation of existing reinforced concrete bridges using fuzzy based analytic hierarchy approach. Expert Syst. Appl. 2008, 35, 1430–1443. [Google Scholar] [CrossRef]
- Larsen, E.S.; Holst, J. Inspection, Monitoring, and Priority-Ranking of Bridges. Transportation Research Circular 498. In Proceedings of the 8th International Bridge Management Conference, Denver, CO, USA, 26–28 April 2000; pp. F-3/1–F-3/14. [Google Scholar]
- Chassiakos, A.P.; Vagiotas, D.; Theodorakopoulos, D. A knowledge-based system for maintenance planning of highway concrete bridges. Adv. Eng. Softw. 2005, 36, 740–749. [Google Scholar] [CrossRef]
- Bana e Costa, C.A.; Oliveira, S.; Vieira, V. Prioritization of bridges and tunnels in earthquake risk mitigation using multicriteria decision analysis: Application to Lisbon. Omega 2008, 36, 442–450. [Google Scholar] [CrossRef]
- Rashidi, M.; Lemass, B. A Decision Support Methodology for Remediation Planning of Concrete Bridges. KICEM J. Constr. Eng. Proj. Manag. 2011, 1, 1–11. [Google Scholar] [CrossRef]
- Sasmal, S.; Ramanjaneyulu, K.; Gopalakrishnan, S.; Lakshmanan, N. Fuzzy Logic Based Condition Rating of Existing Reinforced Concrete Bridges. J. Perform. Constr. Facil. 2006, 20, 261–273. [Google Scholar] [CrossRef]
- Sasmal, S.; Ramanjaneyulu, K.; Iyer, N.R. Condition Ranking and Rating of Bridges Using Fuzzy Logic. Fuzzy Log. Emerg. Technol. Appl. 2007, 9, 175–202. [Google Scholar]
- Vacheyroux, G.; Corotis, R. Strategies of investment in the management of urban bridges: A life-cycle approach illustrated for Paris. Struct. Infrastruct. Eng. Maint. Manag. Life-Cycle Des. Perform. 2013, 9, 1080–1093. [Google Scholar] [CrossRef]
- Xu, X.; Huang, Q.; Ren, Y.; Zhao, D.Y.; Zhang, D.Y.; Sun, H.B. Condition evaluation of suspension bridges for maintenance, repair and rehabilitation: A comprehensive framework. Struct. Infrastruct. Eng. Maint. Manag. Life-Cycle Des. Perform. 2019, 15, 555–567. [Google Scholar] [CrossRef]
- Rashidi, M.; Ghodrat, M.; Samali, B.; Kendall, B.; Zhang, C. Remedial Modelling of Steel Bridges through Application of Analytical Hierarchy Process (AHP). Appl. Sci. 2017, 7, 168. [Google Scholar] [CrossRef]
- Mahmoud, D.; Mansour, M.; Moustafa, I.M.; Hussein, A.; Hisham, K.; Mahdi, A. An assessment model for identifying maintenance priorities strategy for bridges. Ain Shams Eng. J. 2019, 10, 695–704. [Google Scholar]
- Park, J.; Park, S.K.; Choi, J.; Hong, S. New Priority Ranking Algorithm for the Deteriorated Coastal Bridges Considering Network Level. J. Coast. Res. 2017, 79, 129–133. [Google Scholar] [CrossRef]
- Wakchaure, S.S.; Jha, K.N. Prioritization of bridges for maintenance planning using data envelopment analysis. Constr. Manag. Econ. 2011, 29, 957–968. [Google Scholar] [CrossRef]
- Nielsen, D.; Chattopadhyay, G.; Raman, D. Life cycle management of railway bridges—Defect management. In Proceedings of the Conference on Railway Engineering, Brisbane, Australia, 10–12 September 2012; pp. 1–10. [Google Scholar]
- Sobanjo, J.O.; Stukhart, G.; James, R.W. Evalutaion of Projects for Rehabilitation of Highway Bridges. J. Struct. Eng. 1994, 120, 81–99. [Google Scholar] [CrossRef]
- Gattuli, V.; Chiaramonte, L. Condition Assessment by Visual Inspection for a Bridge Management System. Comput. Aided Civ. Infrastruct. Eng. 2005, 20, 95–107. [Google Scholar] [CrossRef]
- Rashidi, M.; Lemass, B.P.; Gibson, P.R. A Decision Support System for Concrete Bridge Maintenance. University of Wollongong, Faculty of Engineering and Information Sciences—Papers (Archive). 2010, pp. 1372–1377. Available online: https://ro.uow.edu.au/engpapers/1275 (accessed on 27 December 2020).
- McCowan, A.K.; Mohamed, S. Decision Support System to Evaluate and compare Concession Options. J. Constr. Eng. Manag. 2007, 133, 114–123. [Google Scholar] [CrossRef]
- Saaty, T.L. How to make a decision: Analytic Hierarchy Process. Eur. J. Oper. Res. 1990, 48, 9–26. [Google Scholar] [CrossRef]
- Hwang, C.L.; Yoon, K. Multiple Attribute Decision Making: An Introduction; SAGE Publications, International Educational and Professional Publisher: Thousand Oaks, CA, USA, 1995. [Google Scholar]
- Chen, Z.; Chen, T.; Qu, Z.; Yang, Z.; Ji, X.; Zhou, Y.; Zhang, H. Use of evidential reasoning and AHP to assess regional industrial safety. PLoS ONE 2018, 13, e0197125. [Google Scholar] [CrossRef]
- Bazargan-Lari, M.R. An Evidential Reasoning Approach to Optimal Monitoring of Drinking Water Distribution Systems for Detecting Deliberate Contamination Events. J. Clean. Prod. 2014, 78, 1–14. [Google Scholar] [CrossRef]
- Xu, D.L. An introduction and survey of the evidential reasoning approach for multiple criteria decision analysis. Ann. Oper. Res. 2012, 195, 163–187. [Google Scholar] [CrossRef]
- Mirzazadeh, A. The passenger service improvement using fuzzy QFD based on evidence reasoning approach; case study. J. Soc. Sci. Res. 2013, 2, 138–153. [Google Scholar] [CrossRef]
- Shafer, G.A. Mathematical Theory of Evidence; Princeton University Press: Princeton, NJ, USA, 1976. [Google Scholar]
- Yang, J.B.; Xu, D.L. On the evidential reasoning algorithm for multiple attribute decision analysis under uncertainty. IEEE Trans. Syst. Man Cybern. Part A Syst. Hum. 2003, 32, 289–304. [Google Scholar] [CrossRef]
- Mahmud, T.; Rahman, K.N.; Hossain, M.S. Evaluation of Job Offers using the Evidential Reasoning Approach. Glob. J. Comput. Sci. Technol. Neural Artif. Intell. 2014, 13, 35–44. [Google Scholar]
- Kumru, M.; Kumru, P.Y. Analytic hierarchy process application in selecting the mode of transport for a logistics company. J. Adv. Transp. 2013, 48, 974–999. [Google Scholar] [CrossRef]
- Xu, D.L.; Yang, J.B. Introduction to Multi-Criteria Decision Making and the Evidential Reasoning Approach; Working Paper Series, Paper No.: 010; Manchester School of Management, University of Manchester Institute of Science and Technology: Manchester, UK, 2001; ISBN 1-86115-111-X. [Google Scholar]
- Zhou, Z.J.; Hu, C.H.; Yang, J.B.; Xu, D.L.; Chen, M.Y.; Zhou, D.H. A sequential learning algorithm for online constructing belief rule based systems. Expert Syst. Appl. 2010, 37, 1790–1799. [Google Scholar] [CrossRef]
- Wu, B.; Zong, L.; Yana, X.; Soares, C.G. Incorporating evidential reasoning and TOPSIS into group decision-making under uncertainty for handling ship without command. Ocean Eng. 2018, 164, 590–603. [Google Scholar] [CrossRef]
- Sellak, H.; Ouhbi, H.; Frikh, B. Energy planning under uncertain decision-making environment: An evidential reasoning approach to prioritize renewable energy sources. Intel. Artif. 2017, 20, 21–31. [Google Scholar] [CrossRef][Green Version]
- Hwang, C.L.; Yoon, K. Methods for multiple attribute decision making. In Multiple Attribute Decision Making; Springer: Berlin/Heidelberg, Germany, 1981; pp. 58–191. [Google Scholar]
- Chen, S.J.; Hwang, C.L. Fuzzy Multiple Attribute Decision Making: Methods and Applications; Springer: Berlin/Heidelberg, Germany, 1992. [Google Scholar]
- Yoon, K.; Hwang, C.L. Manufacturing plant location analysis by multiple attribute decision making: Part II. Multi-plant strategy and plant relocation. Int. J. Prod. Res. 1985, 23, 361–370. [Google Scholar] [CrossRef]
- Benitez, J.M.; Martin, J.C.; Roman, C. Using fuzzy number for measuring quality of service in the hotel industry. Tour. Manag. 2007, 28, 544–555. [Google Scholar] [CrossRef]
- Wang, Y.J. Applying FMCDM to evaluate financial performance of domestic airlines in Taiwan. Expert Syst. Appl. 2008, 34, 1837–1845. [Google Scholar] [CrossRef]
- Byun, H.S.; Lee, K.H. A decision support system for the selection of a rapid prototyping process using the modified TOPSIS method. Int. J. Adv. Manuf. Technol. 2005, 26, 1338–1347. [Google Scholar] [CrossRef]
- Mateo, J.R.S.C. Multi Criteria Analysis in the Renewable Energy Industry; Springer: New York, NY, USA, 2012. [Google Scholar]
- Jiang, J.; Chen, Y.W.; Tang, D.W.; Chen, Y.W. TOPSIS with Belief Structure for Group Belief Multiple Criteria Decision Making. Int. J. Autom. Comput. 2010, 7, 359–364. [Google Scholar] [CrossRef]
- Du, Y.; Mo, H.; Deng, X.; Sadiq, R.; Deng, Y. A new method in failure mode and effects analysis based on evidential reasoning. Int. J. Syst. Assur. Eng. Manag. 2014, 5, 1–10. [Google Scholar] [CrossRef]
- Kong, G.; Xu, D.L.; Yang, J.B.; Ma, X. Combined medical quality assessment using the evidential reasoning approach. Expert Syst. Appl. 2015, 42, 5522–5530. [Google Scholar] [CrossRef]
Publisher’s Note: MDPI stays neutral with regard to jurisdictional claims in published maps and institutional affiliations. |
© 2021 by the authors. Licensee MDPI, Basel, Switzerland. This article is an open access article distributed under the terms and conditions of the Creative Commons Attribution (CC BY) license (http://creativecommons.org/licenses/by/4.0/).