Article

Advanced Chirp Transform Spectrometer with Novel Digital Pulse Compression Method for Spectrum Detection

School of Automation Engineering, University of Electronic Science and Technology of China, Chengdu 611731, China
*
Authors to whom correspondence should be addressed.
Appl. Sci. 2021, 11(3), 960; https://doi.org/10.3390/app11030960
Submission received: 21 November 2020 / Revised: 10 January 2021 / Accepted: 18 January 2021 / Published: 21 January 2021
(This article belongs to the Special Issue Applications and Advancements of Spectroscopy)

Abstract

:
Based on chirp transform and pulse compression technology, chirp transform spectrometers (CTSs) can be used to perform high-resolution and real-time spectrum measurements. Nowadays, they are widely applied for weather and astronomical observations. The surface acoustic wave (SAW) filter is a key device for pulse compression. The system performance is significantly affected by the dispersion characteristics match and the large insertion loss of the SAW filters. In this paper, a linear phase sampling and accumulating (LPSA) algorithm was developed to replace the matched filter for fast pulse compression. By selecting and accumulating the sampling points satisfying a specific periodic phase distribution, the intermediate frequency (IF) chirp signal carrying the information of the input signal could be detected and compressed. Spectrum measurements across the entire operational bandwidth could be performed by shifting the fixed sampling points in the time domain. A two-stage frequency resolution subdivision method was also developed for the fast pulse compression of the sparse spectrum, which was shown to significantly improve the calculation speed. The simulation and experiment results demonstrate that the LPSA method can realize fast pulse compression with adequate high amplitude accuracy and frequency resolution. Compared to existing digital pulse compression technology, this method can significantly reduce the number of required calculations, especially for measurements of sparse signals.

1. Introduction

The technology used for spectral analysis has evolved over many years, and has many applications in various regions. The early classical heterodyne spectrometer relies on the sweep frequency and narrow-band filtering [1]. By mixing the input signals with the known swept-frequency signal and then detecting the output of the narrow-band filters, the spectral information of the input signal can be measured. However the frequency resolution of the classical heterodyne spectrometer corresponds to the band-pass width of the narrow-band filter, which is usually difficult to improve. Also, the use of the sweep frequency technology limits its application in real-time signal processing when dealing with wideband signals. Another high-speed digital spectrometer is the Fast Fourier Transform (FFT) spectrometer, which has been investigated and applied widely in recent years [2,3,4]. Based on the theory of discrete Fast Fourier Transform, the FFT spectrometer can realize spectrum measurements with extremely high-resolution and high real-time performance. Usually, the power consumption of the FFT spectrometer increases rapidly with the increase of the frequency resolution and measured bandwidth. Also, using the FFT algorithm for high-speed digital signal processing in Field Programmable Gate Arrays (FPGAs) may introduce instability when applied to onboard systems. Based on the technology of pulse compression, the chirp transform spectrometer was first proposed in the 1960s for high-resolution and real-time spectral analyses. Due to its advantages of low power consumption and high stability, CTS has been widely applied to onboard systems for radiation measurements.
The technology of pulse compression was first developed in radar systems to resolve the conflict between detection capability and range resolution [5]. This technology was then extended by Klauder to include spectral analysis [6]. Afterwards, the demodulation of wideband, low-power FM signals based on pulse compression technology was realized by Darlington [7], and today, Darlington’s system is known as the chirp transform spectrometer system. In recent years, CTS systems have been developed for atmospheric sounding [8,9,10,11,12]. Some new, single-channel structures have also recently been developed [13,14], which may have potential applications in the aerospace field. As a new passive detection method, the CTS backend has developed into a mature tool which is widely used in weather and astronomical observations.
The frequency resolution of CTS system depends on the time-bandwidth product of the compressor, which means that larger time-bandwidths of surface acoustic wave (SAW) filters correspond to higher frequency resolution [15,16]. In practice, the design and manufacture of SAW filters having large time-bandwidth products is challenging and extremely expensive. Meanwhile, the large bandwidth of SAW filters introduces large insertion loss, which influence the dynamic range and sensitivity of the system. The nonideal quadratic dispersion characteristic of SAW filters during the manufacturing process also degrades the frequency resolution. In CTS systems, the classical pull–push structure has two channels. Achieving a precise dispersion characteristic match between different SAW filters remains challenging. In general, even though the SAW filter has the advantage of lower power consumption, it inevitably comes with many problems.
In modern radar systems, the SAW filter is generally replaced with the digital pulse compression method [17,18]. However, the classical digital convolution algorithm in the time domain is only suitable for the pulse compression of narrow-band signals. Significant computation and hardware resources are required when dealing with large bandwidth compression. For large bandwidth compression, digital multiplication in the frequency domain is usually used. However, this brings about pulse compression in the frequency domain, which makes it impossible to determine the time difference of the input chirp signals and the frequency bands.
In many real applications, the measured signals are sparse or distributed mainly in a small area of the frequency domain, such as the oxygen and water absorption bands in atmospheric radiation measurements. This means that many frequency bands do not have a signal in the entire working bandwidth, a shortcoming that is not taken into consideration in classical digital pulse compression methods. Considering the limitations of the SAW filter and the sparsity of the measured signals in the frequency domain, in the present research, a linear phase sampling and accumulating (LPSA) algorithm was developed for fast pulse compression. The simulation and experiment results show that the proposed method can realize pulse compression with sufficient amplitude accuracy and reduced computation compared to classical digital pulse compression methods when dealing with sparse signals.
The contents of this paper are organized as follows. In Section 2, a brief introduction of the CTS system and pulse compression is presented. Some limitations of the SAW filter are also listed. In Section 3, existing digital pulse compression methods are introduced. Subsequently, considering the limitations of the classical digital pulse compression method, a novel fast digital pulse compression method (LPSA algorithm) is proposed. In Section 4, some simulation models based on the CTS system, built using Advanced Design System (ADS), are presented. The results from the different pulse compression methods are compared and analyzed. In Section 5, an experiment to validate the LPSA algorithm is described. The related amplitude accuracy and frequency resolution are measured and the computational complexity is also discussed. A brief conclusion is drawn in the last section.

2. Chirp Transform Spectrometer

2.1. Functional Principle of CTS (Chirp Transform Spectrometer)

Based on the technology of signal expansion and pulse compression, the CTS system can realize high-resolution and real-time spectrum measurements though analog time-frequency transformation. The measured signal s ( t ) sent to the CTS system is first mixed with a chirp signal with a certain dispersive constant, μ e , and time-bandwidth product ( T e B e ) for signal expansion. This chirp signal is a quadratic phase modulated signal, and can be expressed as:
s c h i r p ( t ) = e j π μ e t 2 / T e 0 < t < T e
After the mixer, the modulated expanding chirp signal carrying the information of the input signal s ( t ) can be written as:
s m i x ( t ) = s ( t ) · s c h i r p ( t ) = s ( t ) · e j π μ e t 2 / T e
This is known as the signal expansion process of the input signal s ( t ) . Subsequently, the modulated expanding chirp signal s m i x ( t ) carrying the information of the measured signal s ( t ) will be amplified, filtered and compressed into pulses by a matched filter. Assuming that a precise dispersion characteristic match exists between the signal expansion and compression, the chirp rate of the matched filter μ c is opposite to that of the modulated expanding chirp signal ( μ c = μ e ) . The compressed signal from the SAW filter is actually the convolution between the compressor and the expanding chirp signal s m i x ( t ) :
s c o m p r e s s ( τ ) = + s m i x · h ( τ t ) d t
where h ( t ) is the impulse response of the SAW filter. Assuming μ c = μ e and omitting the time duration of the signal expansion and compression, Equation (3) can be rewritten as:
s c o m p r e s s ( τ ) = e j π μ e τ 2 + s ( t ) · e j 2 π f t d t
If the fixed phase e j π μ e τ 2 in Equation (4) is ignored, the compressed pulse s c o m p r e s s ( τ ) from the SAW filter is the Fourier transform of the measured signal s ( t ) . This process is known as pulse compression. The frequencies and amplitudes of the input signal can therefore be measured by measuring the time distributions and the envelope information of the output pulses [19].

2.2. Pulse Compression in CTS System

In the classical CTS system, two similar arrangements exist for the signal expansion and compression framework. One is the M(s)-C(l) transform arrangement, where the time duration of the expanding chirp signal is shorter compared to that of the matched SAW filter. Another similar arrangement is the M(l)-C(s) transform arrangement, where the time duration of the expanding chirp signal is greater than that of the matched SAW filter [20,21]. Symbol M denotes the signal multiplication for bandwidth expansion, C means signal convolution for matched filtering, (l) and (s) denote long and short duration time, individually.
The classical two-channel M(l)-C(s) transform arrangements for the pull-push CTS system is presented in Figure 1, assuming that there are m input cosine signals, which can be expressed as:
s ( t ) = i = 1 m a i cos ( 2 π f i t + φ i )
where a i , f i and φ i correspond to the amplitude, frequency and initial phase of the i-th input signal.
The input signal s ( t ) is firstly mixed with a chirp signal s e c ( t ) (usually called the expander chirp) to obtain the modulated chirp signal s m c ( t ) . The expander chirp signal can be written as:
s e c ( t ) = a e c cos ( 2 π ( f e c 0 t + 1 2 k t 2 ) + φ e c 0 )      t ( 0 , T 0 )
where subscript “ec” is short for expander chirp, a e c , f e c 0 and φ e c 0 are the amplitude, start frequency and initial phase of the expander chirp, k is the chirp rate, the time duration is T 0 and the corresponding bandwidth is B = k T 0 .
The modulated chirp signal can be expressed as:
s m c ( t ) = 1 2 i = 1 m ( a i cos ( 2 π ( ( f e c 0 + f i ) t + 1 2 k t 2 ) + φ e c 0 + φ i ) + a i cos ( 2 π ( ( f i f e c 0 ) t 1 2 k t 2 ) φ e c 0 + φ i ) )    t ( 0 , T 0 )
where subscript “mc” is short for modulated chirp. As the input signals are sent to the RF port and the expander chirp signal is sent to the LO port, the amplitudes of the modulated chirp signals are proportional to the amplitudes of the input signals. Only considering the difference frequency signal ( s m c d f ) in (7), the modulated chirp signals can be rewritten as:
s m c d f ( t ) = 1 2 i = 1 m a i cos ( 2 π ( ( f i f e c 0 ) t 1 2 k t 2 ) φ e c 0 + φ i )       t ( 0 , T 0 )
The subscript “mcdf” is short for modulated chirp difference frequency. Subsequently, the modulated chirp signal is sent to a band-pass filter (BPF). The output IF chirp signal from the BPF can be obtained:
s i f c ( t ) = 1 2 i = 1 m a i cos ( 2 π ( ( f i f e c 0 ) t 1 2 k t 2 ) φ e c 0 + φ i )     t ( f i f b p f s t o p f e c o k , f i f b p f s t a r t f e c o k )
where subscript “ifc” is short for the IF chirp, f b p f s t o p and f b p f s t a r t denote the stop and start frequency of the BPF, individually. The insertion loss of the BPF is not taken into consideration in (9). It can be seen that the IF chirp contains m components of chirp signals, which have the same start and stop frequencies, while the start times of each component are different; this is related to the frequencies of the input signals. Let t i = f i f b p f s t o p f e c 0 k represent the start time of the i-th IF chirp signal and B b p f = f p b f s t o p f b p f s t a r t represent the bandwidth of the BPF. Equation (9) can be rewritten as:
s i f c ( t ) = 1 2 i = 1 m a i cos ( 2 π ( f b p f s t o p ( t t i ) 1 2 k ( t t i ) 2 ) φ e c 0 + φ i )       t ( t i , t i + B b p f k )
The IF chirp signals shown in (10) contain the information of the input signals and will be ultimately compressed into pulses.
In the classical CTS system, the SAW filter is used for the final pulse compression. The SAW filter is also called the compressor, and its impulse response is also a chirp signal similar to the IF chirp signal, which can be expressed as:
c ( t ) = a c ( t ) · cos ( 2 π ( f b p f s t o p t + 1 2 k c t 2 ) + φ c 0 )       t ( 0 , T c )
where a c ( t ) is the amplitude response of the SAW filter, which can be seen as a constant; here, it is set to unity; φ c 0 and T c are the initial phase and the duration time of the compressor and k c is the chirp rate.
Considering a perfect match of the chirp rate between the expander and compressor ( k c = k ), and ignoring the phase constant, the output of the SAW filter can be expressed as:
ψ s s = T c / 2 T c / 2 s i f c ( t ) c ( t τ ) d τ = 1 2 i = 1 m a i · T c B c sin [ π T c B c ( 1 | t t i | T c ) ] π T c B c cos ( 2 π f b p f s t o p ( t t i ) )       t ( t i , t i + T c )
where B c and T c are the bandwidth and time duration of the compressor, individually. T c B c is the compression gain, and the output pulse has an envelope shape of sinc function. The bandwidth of the output pulse is approximately 1 / B c , and the frequency resolution is Δ f | μ | / B c 1 / T c . It can be seen that the character of the high frequency resolution in CTS depends on the property of the large compression time-bandwidth product ( T c B c ) of the SAW filter. Limited by the manufacturing difficulties of SAW filters with large time-bandwidth products, it is usually appropriate to utilize the minimum possible value of the compressor time-bandwidth product ( T c B c ) [22,23].
This results in the expander bandwidth being twice the bandwidth of the compressor. Due to the bandwidth mismatch between of the expander and the compressor, the two-channel arrangement is used to make up the mismatch and guarantee the maximum sensitivity that can be obtained in the CTS system. However, in the classical M(l)-C(s) transform arrangement, the use of the SAW filter will give rise to some technological difficulties, and the implementation of the system also presents challenges [15]. Some challenges and disadvantages of the utilization of the SAW filter behaving as the compressor/convolver are listed below.
  • Influenced by the large insertion loss of the SAW convolution filters, which is usually larger than 40 dB, the operation bandwidth and dynamic range are both limited and cannot be very large. Therefore, the corresponding system performance, i.e., frequency resolution and sensitivity, are degraded.
  • Imperfect manufacturing of the SAW convolution filter will cause deviations from the ideal dispersion characteristics, which will degrade the system performance, e.g., frequency resolution and power spectral density accuracy.
  • The dispersive characteristic match between the generated expander chirp signal and the SAW filter behaving as the compressor/convolver need to be carefully considered. It is very hard to fabricate two SAW filters with perfectly matched dispersion characteristics.

3. Digital Pulse Compression

3.1. Classical Digital Pulse Compression Methods

As mentioned above, dispersive characteristic mismatches may exist between the expender chirp signal and the SAW compressor in the classical CTS structure. Limited bandwidth and large attenuation of the SAW filter will influence the performance of the CTS system. Nowadays, with the development of modern digital signal processing technology, signal expanding and pulse compressing have been realized by digital processing methods instead of SAW filters in radar systems. The first step in digital pulse compression is to sample the echo signal to get the discrete Linear Frequency Modulation (LFM) signal s ( n ) . To avoid frequency aliasing, the sampling numbers N s cannot be smaller than the time-bandwidth products ( T s B ) of s ( n ) . After quantizing the echo signal, it is also necessary to quantify the impulse response of the matching filter h ( n ) . Then, pulse compression y ( n ) can be expressed as the convolution of s ( n ) and h ( n ) .
y ( n ) = s ( n ) h ( n )
Depending on the implementation approach, there are two common digital methods for pulse compression processing in the time and frequency domains.

3.1.1. Pulse Compression in Time Domain

For narrow bandwidth pulse compression, a digital convolution in the time domain is adopted. The procedure can be described as follows:
y ( n ) = s ( n ) h ( n ) = k = 0 N 1 s ( k ) h ( N k )
A digital FIR filter structure is usually used to implement digital convolution in the time domain. When N is large, the implementation of the FIR filter is difficult, which limits its application to the pulse compression of large bandwidth chirp signals.

3.1.2. Pulse Compression in Frequency Domain

For large bandwidth chirp signals, the computation will become quite complex when using digital convolution in the time domain for pulse compression. So, an alternative pulse compression method is developed in the frequency domain, which can be expressed as follows:
y ( n ) = s ( n ) h ( n ) = I F F T { F F T [ s ( n ) ] × F F T [ h ( n ) ] }
Compared to digital convolution in time domain, pulse compression in the frequency domain can save a lot of computation when the chirp signal has a large bandwidth. However, pulse compression in the frequency domain is unable to distinguish the time difference of the chirp signals with the same frequency bands. This limits its application in CTS systems.

3.2. Linear Phase Sampling and Accumulating Method for Fast Pulse Compression

In CTS structures, to solve the matching problem and to avoid large attenuation of the SAW filter, the digital pulse compression method seems to be a good solution. However, digital convolution in the time domain requires significant computation when dealing with large bandwidth chirp signals. The double time-frequency transform in the frequency domain still requires double FFT calculations, and is unable to determine the time difference of the chirp signals. Moreover, in many real applications, the measured signals are sparse in the frequency domain, which is not considered in classical digital pulse compression methods. Considering the quadratic phase characteristic of the IF chirp signal, a new LPSA method was developed for fast pulse compression in CTS systems.
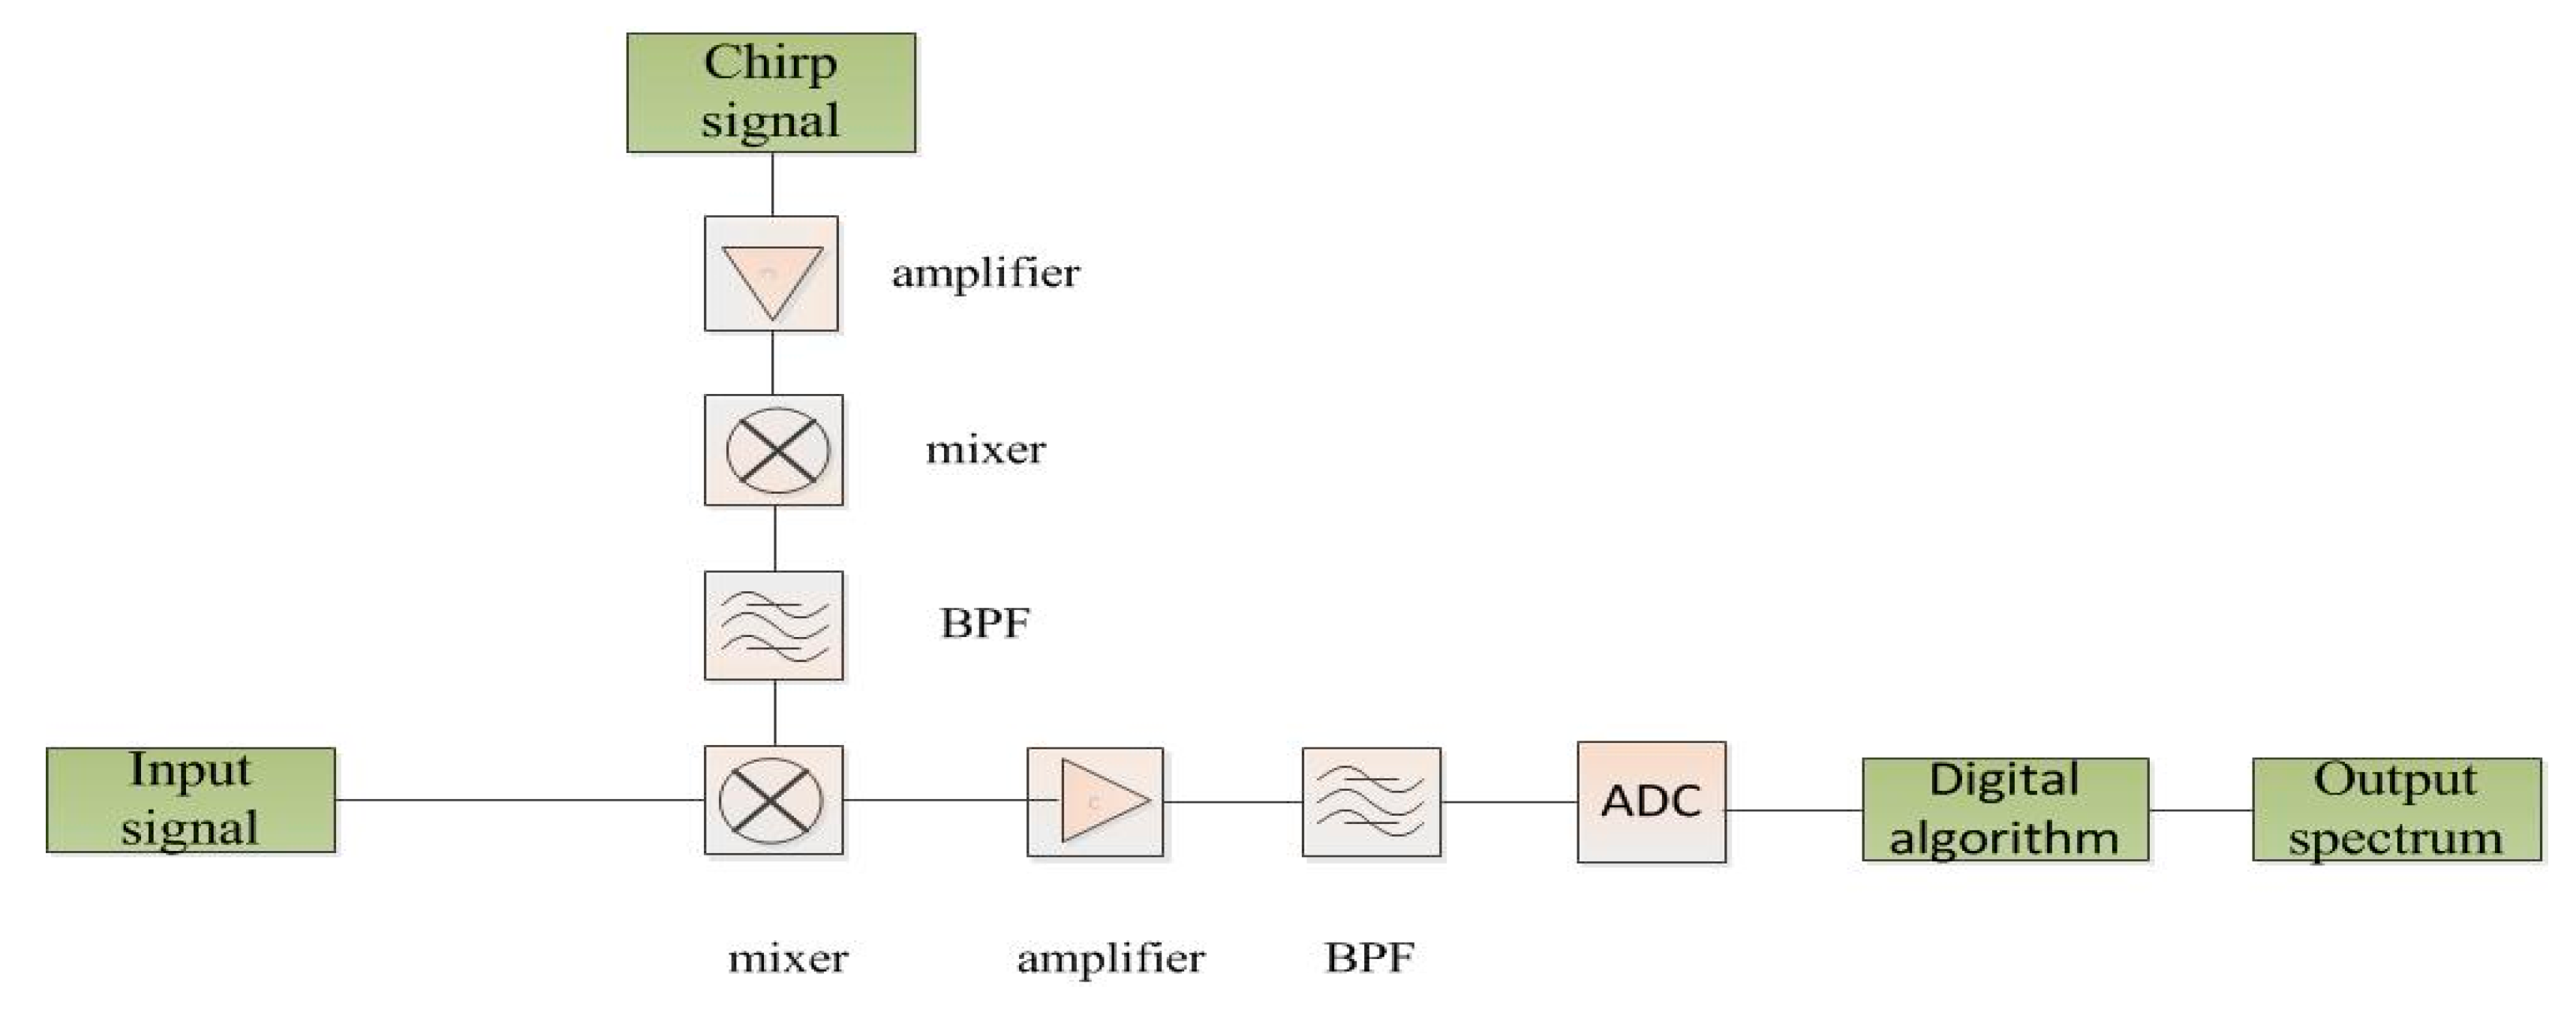
Figure 2 is a brief schematic diagram of a CTS system with the LPSA method for pulse compression. Only one channel is exhibited for signal expansion and compression in the system. The input signals are first mixed with the chirp signal to obtain the modulated chirp signals carrying the information of the input signal. After the amplifier and the band-pass filter, the output IF chirp signals are sampled and compressed into pulses by the digital algorithm.
In CTS systems, the output IF chirp signals from the BPF have a fixed dispersive constant, start frequency and stop frequency. However, these IF chirp components have different time distributions, which correspond to the different input frequencies. So, if the time distributions of the IF chirp signals can be detected, the input frequencies can be measured. Considering the sparsity of the input signals, an LPSA algorithm with two-stage frequency resolution subdivision was developed in this paper for fast pulse compression.
First, there are two sets of time sequences, t n 1 and t n 2 , which satisfy the following mutually orthogonal equations:
2 π ( f b p f s t o p t n 1 1 2 k ( t n 1 ) 2 ) = φ r + 2 n π       n = 1 , 2 , , N
2 π ( f b p f s t o p t n 2 1 2 k ( t n 2 ) 2 ) = φ r + π 2 + 2 n π     n = 1 , 2 , , N
where φ r is an arbitrary phase which is set to zero in the following derivations.
The range of t n 1 and t n 2 is 0 ~ B b p f k , and N = f b p f s t o p B b p f k 1 2 k ( B b p f k ) 2 is the total number of t n 1 and t n 2 , which is decided by the IF chirp signal and the chirp rate. n is a positive integer ranging from 1 to N. From (16) and (17), the time sequence can be derived as:
t n 1 = f b p f s t o p f b p f s t o p 2 2 n k k
t n 2 = f b p f s t o p f b p f s t o p 2 2 ( n + 1 4 ) k k
It can be seen that the time intervals of t n 1 and t n 2 are not fixed, but change linearly, which is equivalent to linear phase sampling.
By sampling the IF chirp signals using (10) via the time sequence of t n 1 and t n 2 from time t j , and then accumulating the sampling points, the following equation can be obtained:
A 1 = 1 2 n = 1 N i = 1 m a i cos ( 2 π ( f b p f s t o p ( t j + t n 1 t i ) 1 2 k ( t j + t n 1 t i ) 2 ) φ e c 0 + φ i )
A 2 = 1 2 n = 1 N i = 1 m a i cos ( 2 π ( f b p f s t o p ( t j + t n 2 t i ) 1 2 k ( t j + t n 2 t i ) 2 ) φ e c 0 + φ i )
where t n 1 and t n 2 satisfy the following conditions:
t n 1 , t n 2 ( t i t j , t i t j + B b p f k ) ( 0 , B b p f k )
If Δ t j i = t i t j , then (22) can be rewritten as:
t n 1 , t n 2 ( Δ t j i , B b p f k )     Δ t j i 0
t n 1 , t n 2 ( 0 , Δ t j i + B b p f k )     Δ t j i < 0
Equations (23) and (24) indicate that only the common parts between the i-th and j-th IF chirp components will be effective in the data accumulation.
If there is only the j-th IF chirp component, which means i = j , (20) and (21) turn into:
A 1 = 1 2 N a j cos ( 2 n π φ e c 0 + φ j )
A 2 = 1 2 N a j cos ( 2 n π + π 2 φ e c 0 + φ j )
Thus, the amplitude of the input signal a j can be obtained:
a j 2 = 2 ( ( A 1 ) 2 + ( A 2 ) 2 ) N 2
For any other IF chirp components ( i j ), (20) can be rewritten as:
A 1 = 1 2 n = 1 N i = 1 m a i cos ( 2 π k Δ t j i t n 1 + 2 π ( n f b p f s t o p Δ t j i 1 2 k ( Δ t i j ) 2 ) φ e c 0 + φ i )
If φ j i = 2 π ( f b p f s t o p Δ t j i 1 2 k ( Δ t j i ) 2 ) and Δ f j i = k Δ t j i , then (28) can be further simplified:
A 1 = 1 2 n = 1 N i = 1 m a i cos ( 2 π Δ f j i t n 1 + φ j i φ e c 0 + φ i )
Similarly, (21) can be simplified:
A 2 = 1 2 n = 1 N i = 1 m a i cos ( 2 π Δ f j i t n 2 + π 2 + φ j i φ e c 0 + φ i )
where t n 1 and t n 2 satisfy (23) and (24).
Equation (29) indicates that the accumulation result is actually equal to the amplitudes accumulation of a cosine signal, the frequency of which is equal to the frequency interval of the i-th and j-th measured signals. For a fixed compression time T c , comparing (25) and (29), the relationship between the compression time and the frequency resolution ( f r ) can be evaluated: f r = 2 π T c + 2 T c π T c 2 + 2 k , where 2 π T c and 2 T c π T c 2 + 2 k correspond to the frequency resolution for the situation of Δ t j i < 0 and Δ t j i 0 , individually. It can be seen that the frequency resolution is related to the compression time and the chirp rate. However, if T c 2 1 k , the influence of the chirp rate on the frequency resolution can be ignored. In other words, the chirp rate k only matters for low frequency resolution. When the chirp rate is predetermined, the frequency resolution is only relative to the compression time. This allows us to obtain different frequency resolutions by simply changing the compression time.
It should be noted that the sampling rate in (16) and (17) is changes linearly, which is different from uniformly-spaced sampling. So, the spectral periodic extension due to the sampling in the time domain will also be different. Assuming that the sampling rate in the algorithm ranges from f s 1 to f s 2 with a bandwidth of B s = f s 2 f s 1 , the extended spectrum will be distributed at M · ( f s 1 , f s 2 ) (M is an arbitrary positive integer), and the amplitude at the frequency point f x ( f x M · ( f s 1 , f s 2 ) ) will have a weight factor of f x M · B s · T c · f s 1 + f s 2 2 compared to the major signal. This indicates that the spectral periodic extension is not centered at some distributed frequency points as uniformly-spaced sampling, but spreads over some bands, and the extended amplitudes have an average attenuation of M · B s · T c compared to the major signal. This is different from uniformly-spaced sampling, in which, the amplitudes of the extension spectrum are the same as the major signal. Theoretically, for uniformly-spaced sampling, in order to eliminate the influence of the extended spectrum, the sampling rate must be larger than the bandwidth of the measured signals. However, for linear sampling in the algorithm, the sampling rate can be appropriately reduced for the measured signals with a relatively low dynamic range.
To detect and compress the IF chirp signals in real applications, we need to follow the detailed algorithm flow given below:
1.
Quantifying the IF chirp signal s i f c ( t )
Different from Nyquist sampling, in the presented fast pulse compression method, the higher sampling rate f s will yield more suitable and precise orthogonal sampling points, whose phases satisfy (16) and (17), leading to higher amplitude accuracy of the output pulses.
2.
Selecting two sets of mutually orthogonal sampling points
Due to the sampling, the ideal orthogonal sampling points that satisfy (16) and (17) may not exist; therefore, adjacent points can be used as alternative orthogonal points. Thus, the phases of the nonideal orthogonal sampling points satisfy the following approximation formulas:
2 π ( f b p f s t o p ( t n 1 ) 1 2 k ( t n 1 ) 2 ) = 2 n π ± p ,   n = 1 , 2 , 3 N 2 π ( f b p f s t o p ( t n 2 ) 1 2 k ( t n 2 ) 2 ) = 2 n π + π 2 ± p ,   n = 1 , 2 , 3 N
where N is the total number of the selected sampling points, which depends on the sampling rate, the characteristic of the IF chirp signal and the compression time. The notation p denotes the approximation factor, which influences the amplitude accuracy of the output pulses. A higher sampling rate allows a smaller approximation factor to be used, leading to higher amplitude accuracy.
3.
Spectrum detection under low frequency resolution
Based on the relationship between the compression time and the frequency resolution, the compression time can be determined for a certain low frequency resolution. The orthogonal sampling points that satisfy (31) can be determined. Subsequently, the i-th IF chirp component can be compressed by summing the orthogonal sampling points from the starting time t i , and other chirp components can also be compressed by shifting the starting time. This procedure can first obtain the spectrum distribution under a low frequency resolution with a modest amount of computation.
4.
Spectrum subdivision under high frequency resolution
After the third procedure, the spectrum was measured under low frequency resolution. Setting an amplitude threshold, the channels with amplitudes below the threshold can be seen as noise channels, while those with amplitudes above it need to be further subdivided. Similarly, a longer compression time needs to be determined according to the high frequency resolution. Then, the corresponding orthogonal sampling points can be determined. Finally, the spectrum under high frequency resolution can be measured by the LPSA method. As analyzed in Section 3.2, for the signal with a relatively low dynamic range, the number of the orthogonal sampling points can be properly reduced due to the linear sampling, which can further reduce the required number of calculations.

4. Simulation and Analysis

Several simulations were designed to validate the proposed LPSA algorithm for pulse compression in this section. The simulation models were built based on the structure shown in Figure 2. The output pulses from the novel LPSA algorithm were compared to the results obtained by the classical digital pulse compression method in the time domain. The frequency resolution and amplitude accuracy were measured and analyzed. The influence of the nonideal devices and sampling rate on the amplitude is discussed. Finally, the computations are compared between the novel method and the classical method.

4.1. Modeling of the CTS System

To verify the novel LPSA algorithm for fast pulse compression based on the CTS system, a simulation model of the CTS system without a SAW filter was built in Advanced Design System (ADS). In the simulations, the measured signals had a frequency bandwidth ranging from 5.5 GHz to 6.5 GHz, and the premultiplier chirp signals ranged from 3.4 GHz to 5.4 GHz. After down-conversion and band-pass filtering, the IF chirp signals had a start frequency of 1.1 GHz and a stop frequency of 2.1 GHz. The chirp rate was 100 MHz/μs, and the duration was 10 μs. A schematic diagram of this process is presented in Figure 2. The sampling rate was variable in the simulation model. The measured signals were a series of discrete sinusoidal signals. The premultiplied chirp signal was generated by the voltage source of V_tRF Pulse. The outputs of the IF chirp signals were exported from ADS and then imported into Matlab for digital pulse compression.

4.2. Simulation Results and Analysis

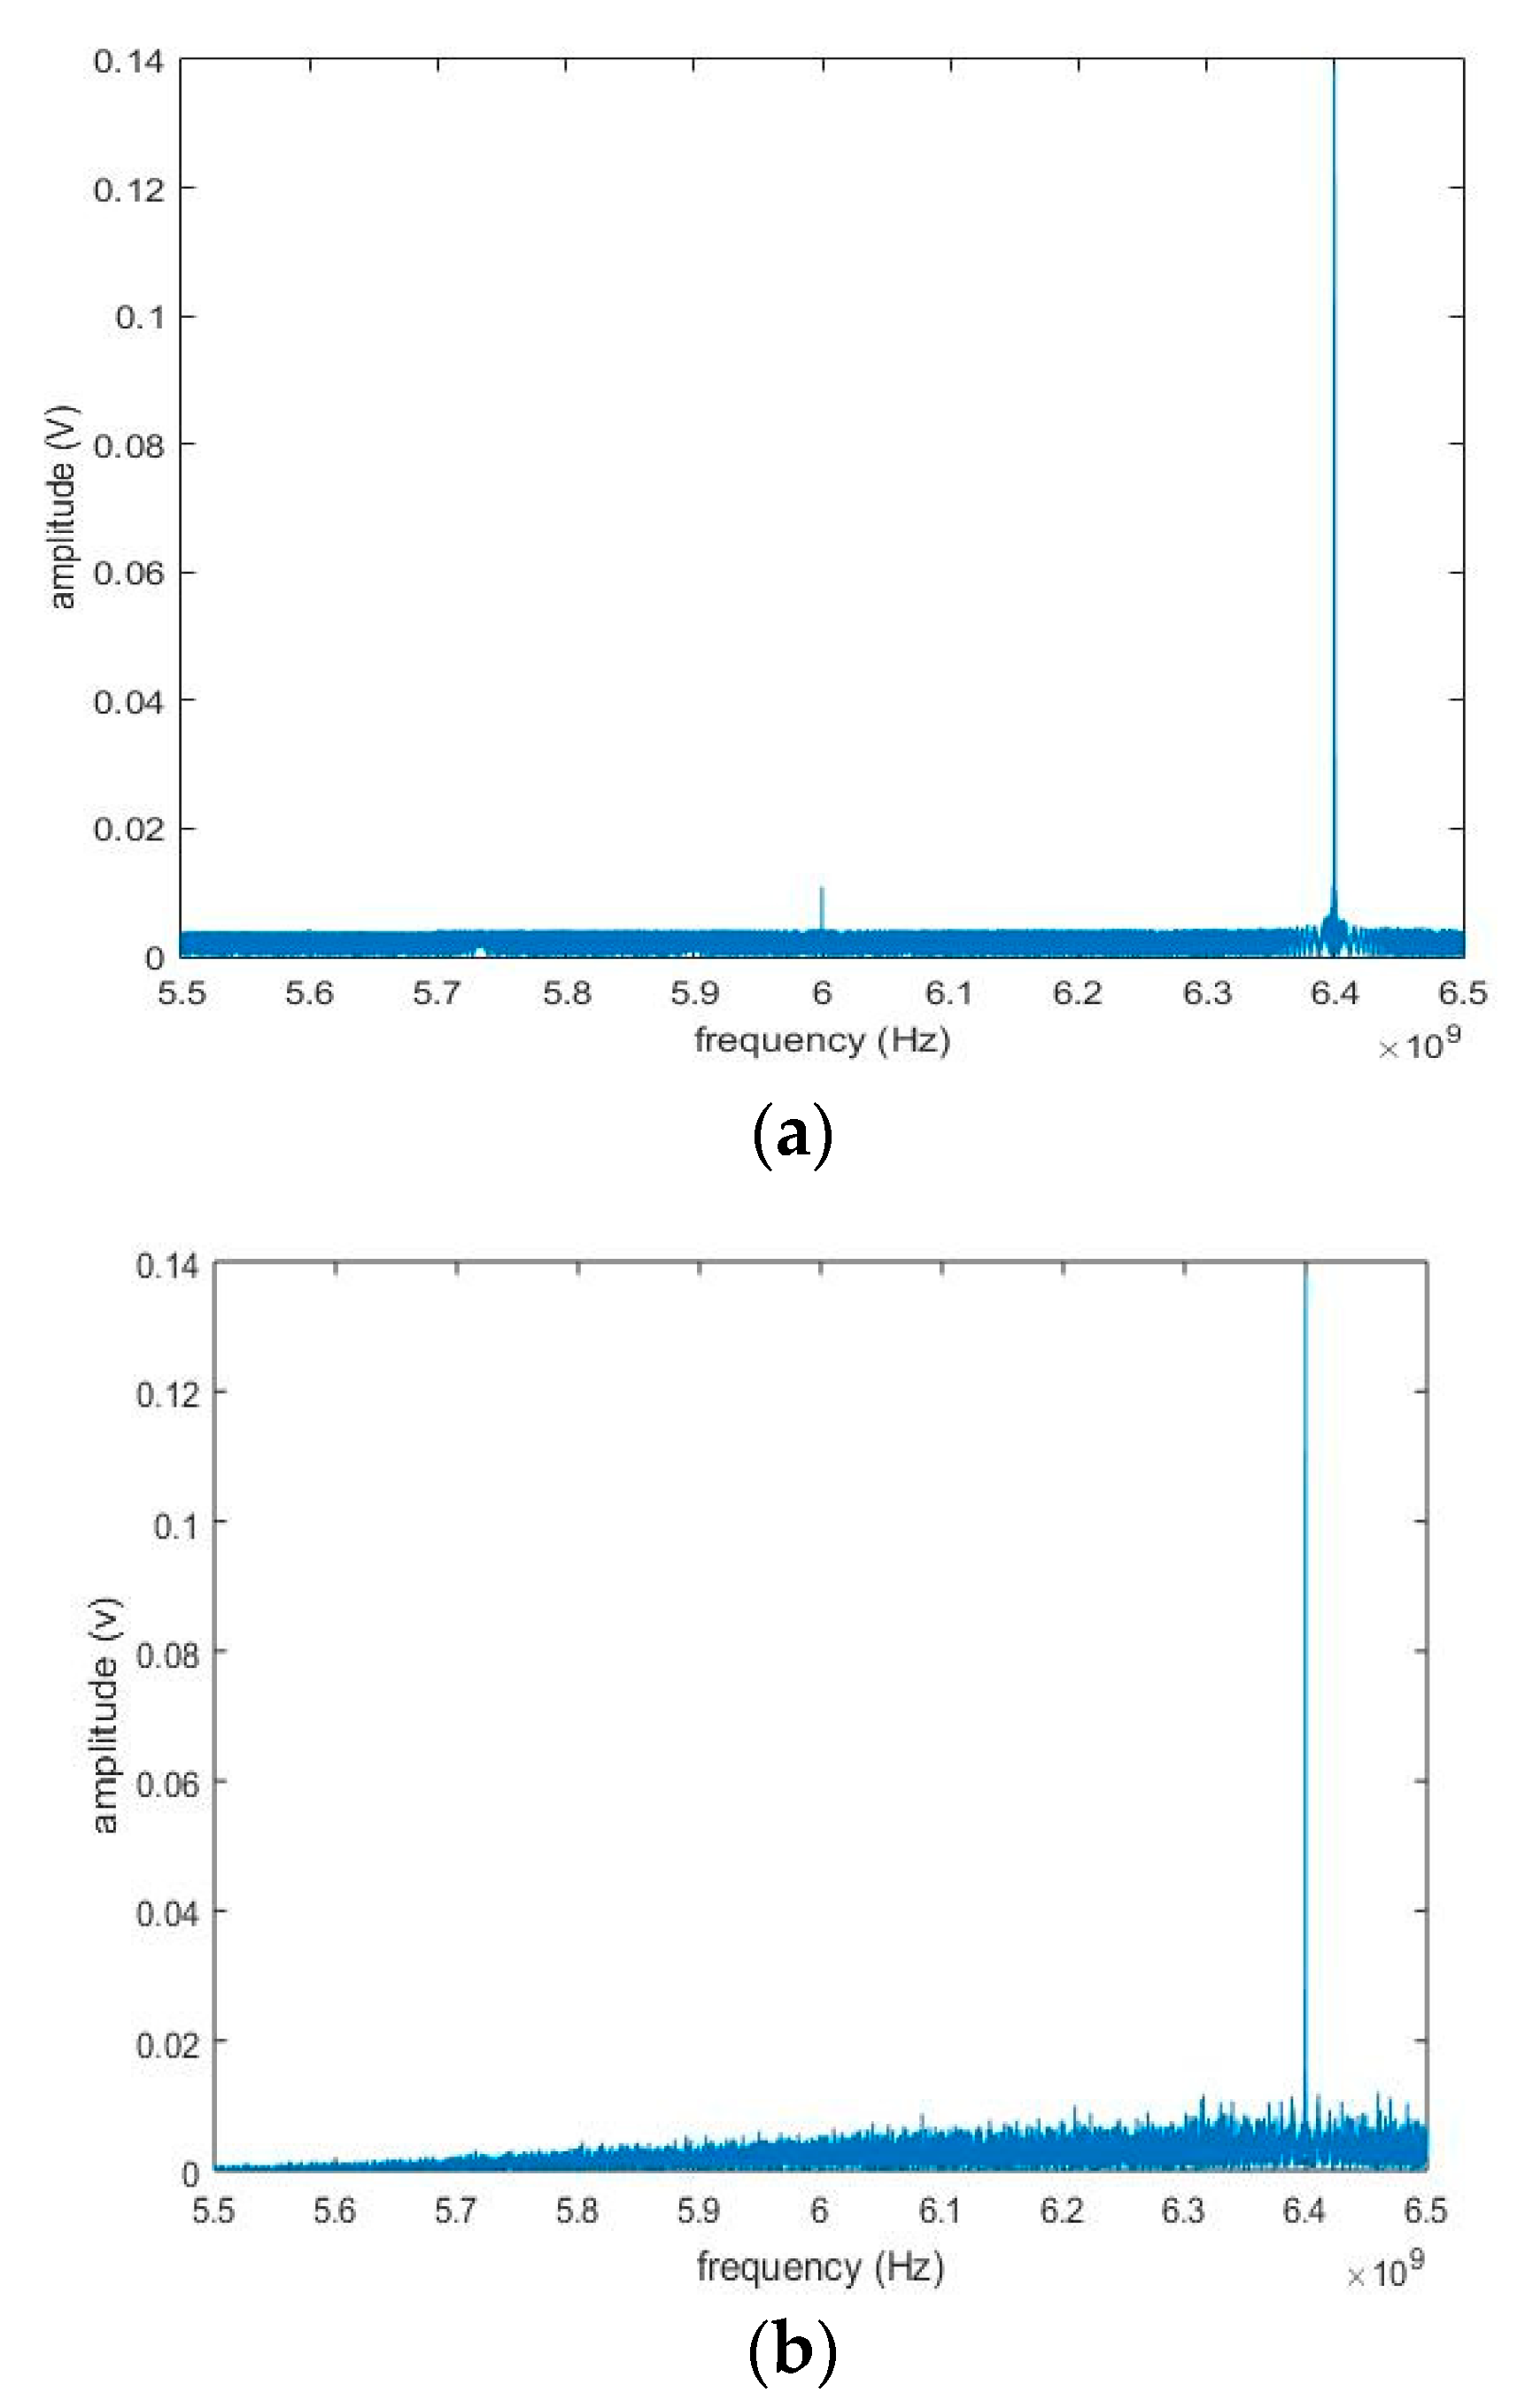
Three input signals were measured: single frequency signal, five frequencies signals and signals with eleven frequencies. Figure 3 presents the output results using the classical time-domain compression method and the novel LPSA algorithm with a single input frequency of 6.4 GHz based on CTS system. The left picture (a) shows the output pulse calculated by the classical time-domain compression method. The right one (b) shows the output pulse obtained using the new LPSA method with two-stage frequency resolution (3.1 MHz–100 kHz).
It can be observed that near the 6.4 G input frequency, the noise level of the novel method was a little higher than that of the classical time-domain pulse compression method. This was mainly caused by the subsampling of the orthogonal points, which could be improved by increasing the sampling rate, i.e., by adding more orthogonal sampling points.
For the first stage of 3.1 MHz frequency resolution, the compression time was 0.1us and the number of the orthogonal sampling points was 100. The calculation for the spectrum measurement under 3.1 MHz frequency resolution included 64,600 additions and 323 multiplications. For the second stage of 100 kHz frequency resolution, the compression time was 10 μs and the total number of the orthogonal sampling points was 15,000 (sampling rate from 1 GHz to 2 GHz and 100:1 attenuation of the amplitudes extension). As there was only one channel with signals, only 500 sampling points were selected for the calculation (sampling rate from 33.3 MHz to 66.6 MHz and 18:1 attenuation of the amplitudes extension). The calculation for the spectrum measurement under 100 kHz frequency resolution included 31,000 additions and 31 multiplications. So, the total calculations for the LPSA method comprise 95,600 additions and 354 multiplications. For the classical time-domain pulse compression method, the total calculations under 100 kHz frequency resolution comprise 8 × 10⁸ additions and 8 × 10⁸ multiplications.
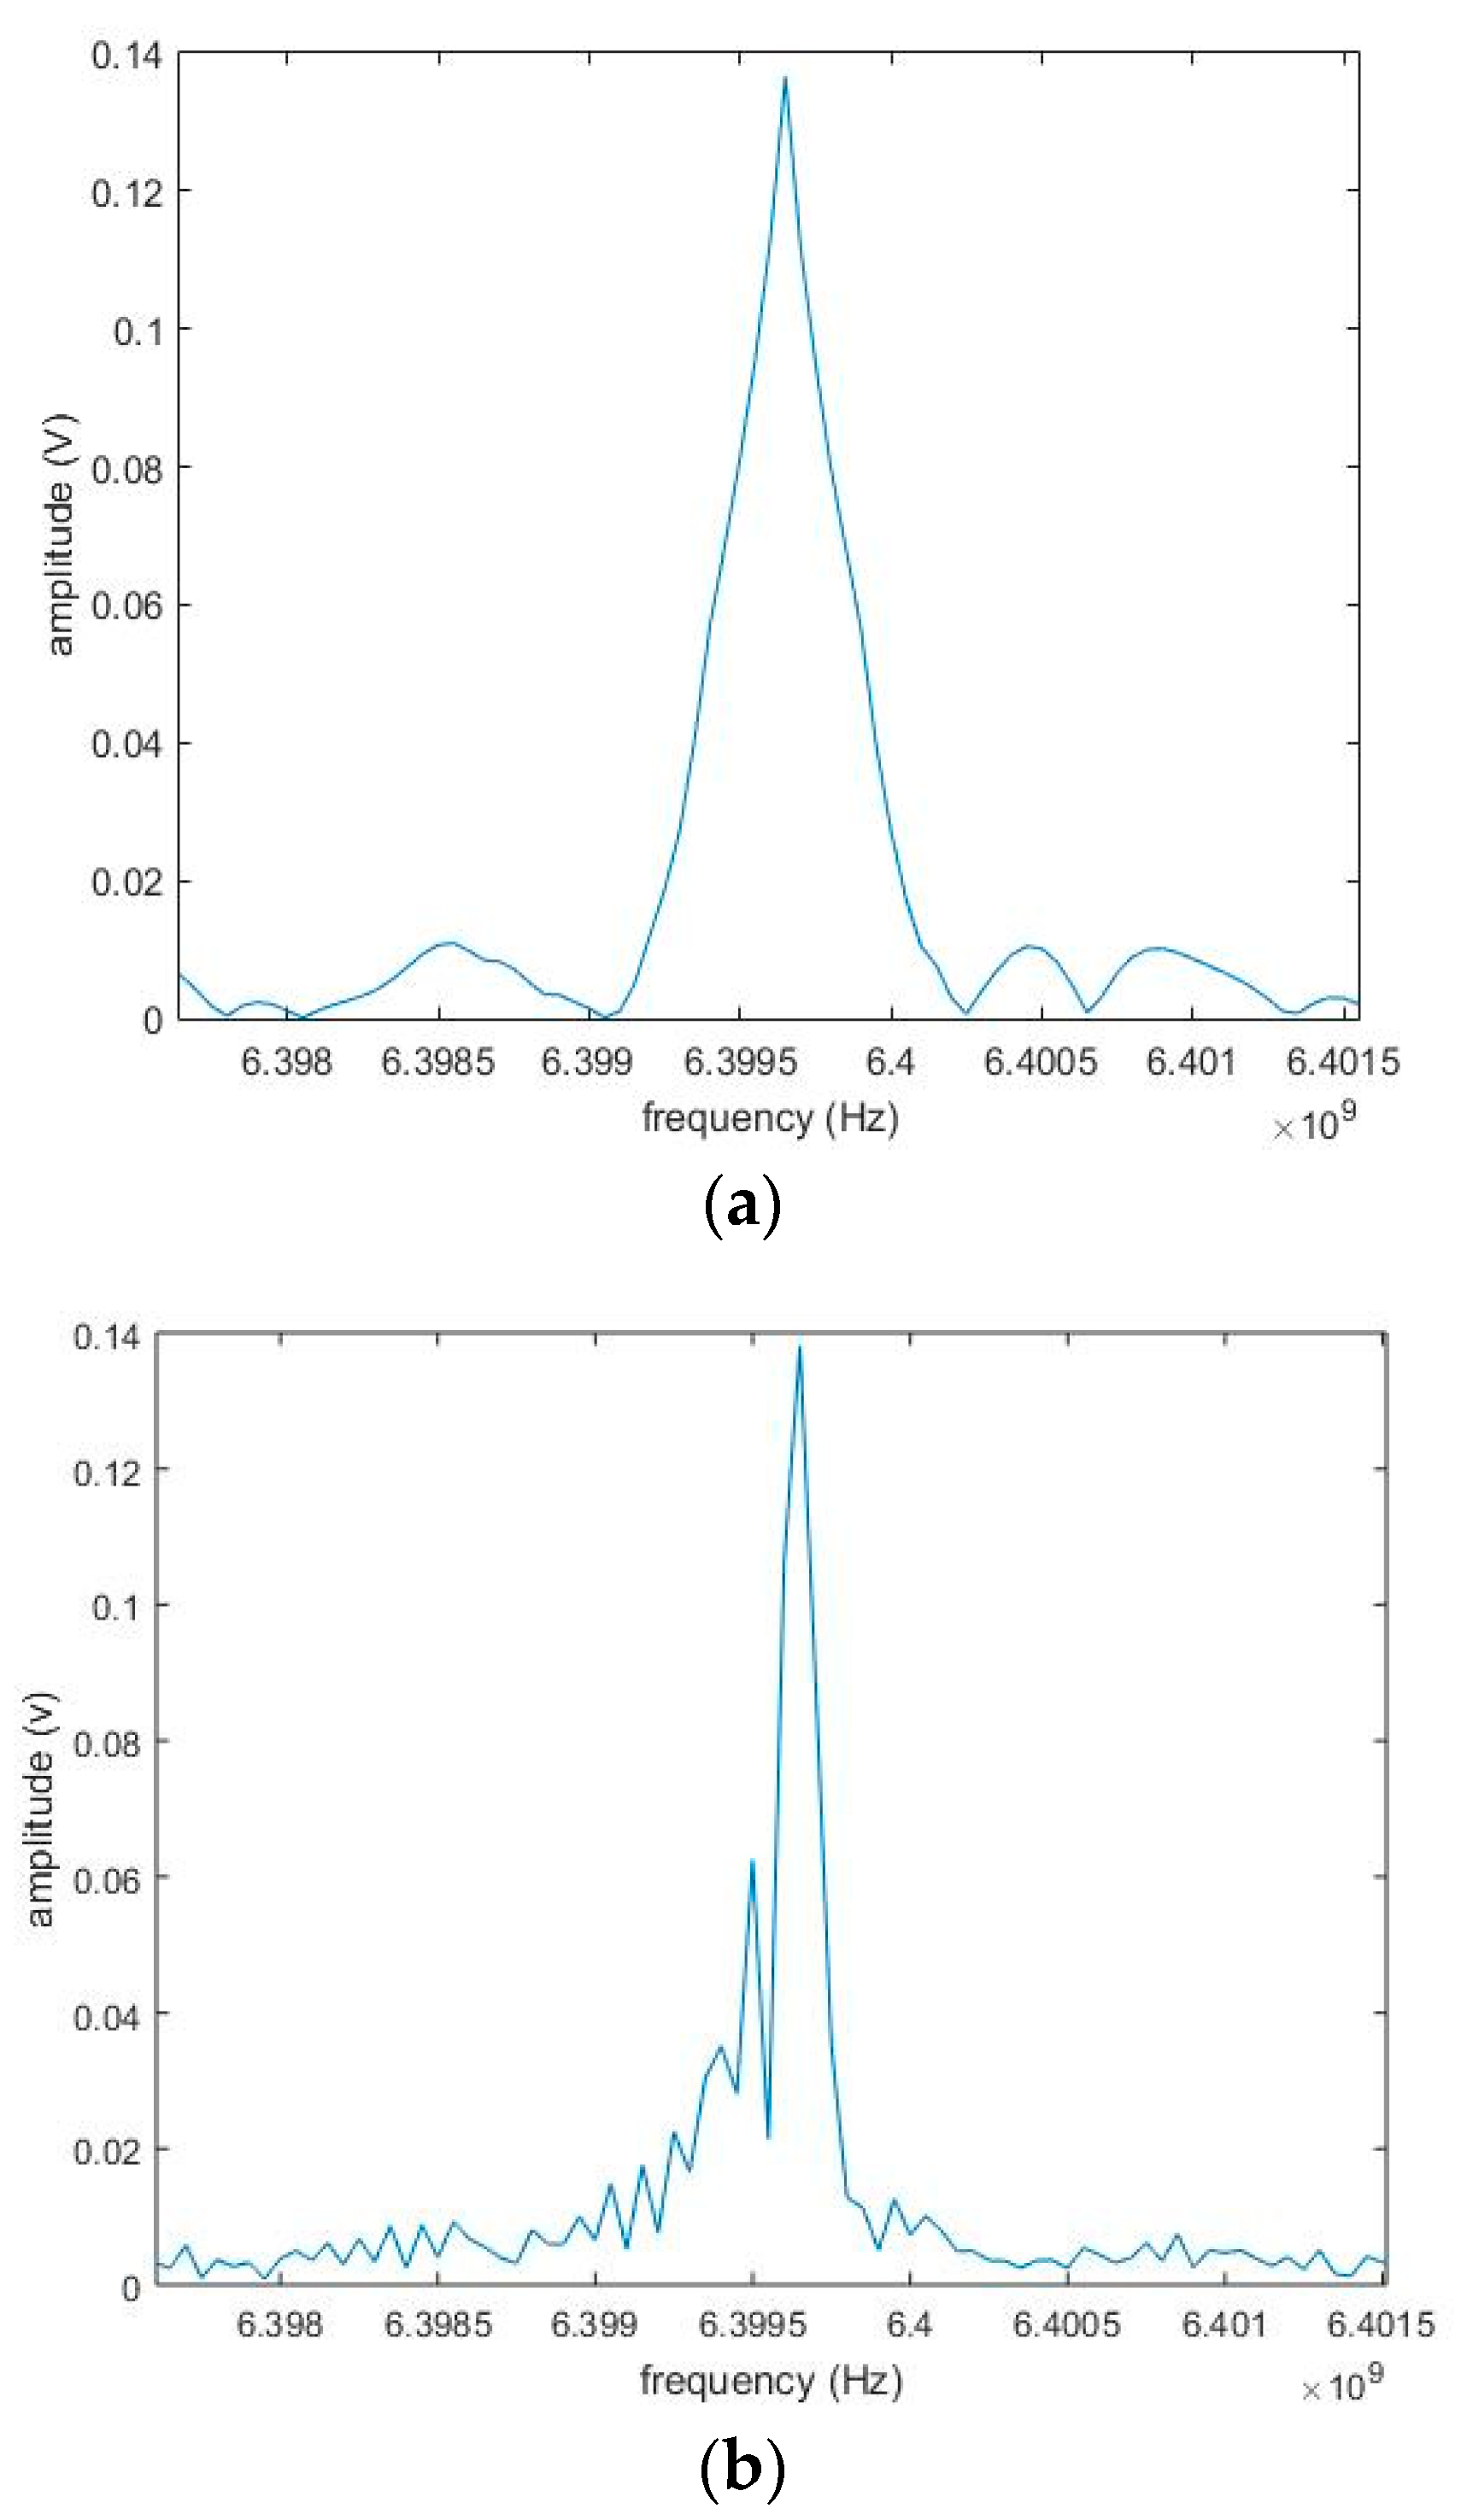
As shown in Figure 4, we zoomed in on the pulses at 6.4 GHz in Figure 3. It can be seen that the frequency resolutions of 3 dB bandwidth were both about 100 kHz, i.e., close to the inverse of the duration time ( 1 T c ) of the compressor. The novel LPSA algorithm introduced a relatively higher sidelobe compared to the classical time-domain pulse compression method. This was caused by the total number of the selected sampling points used for the calculation and phase approximation in (31).
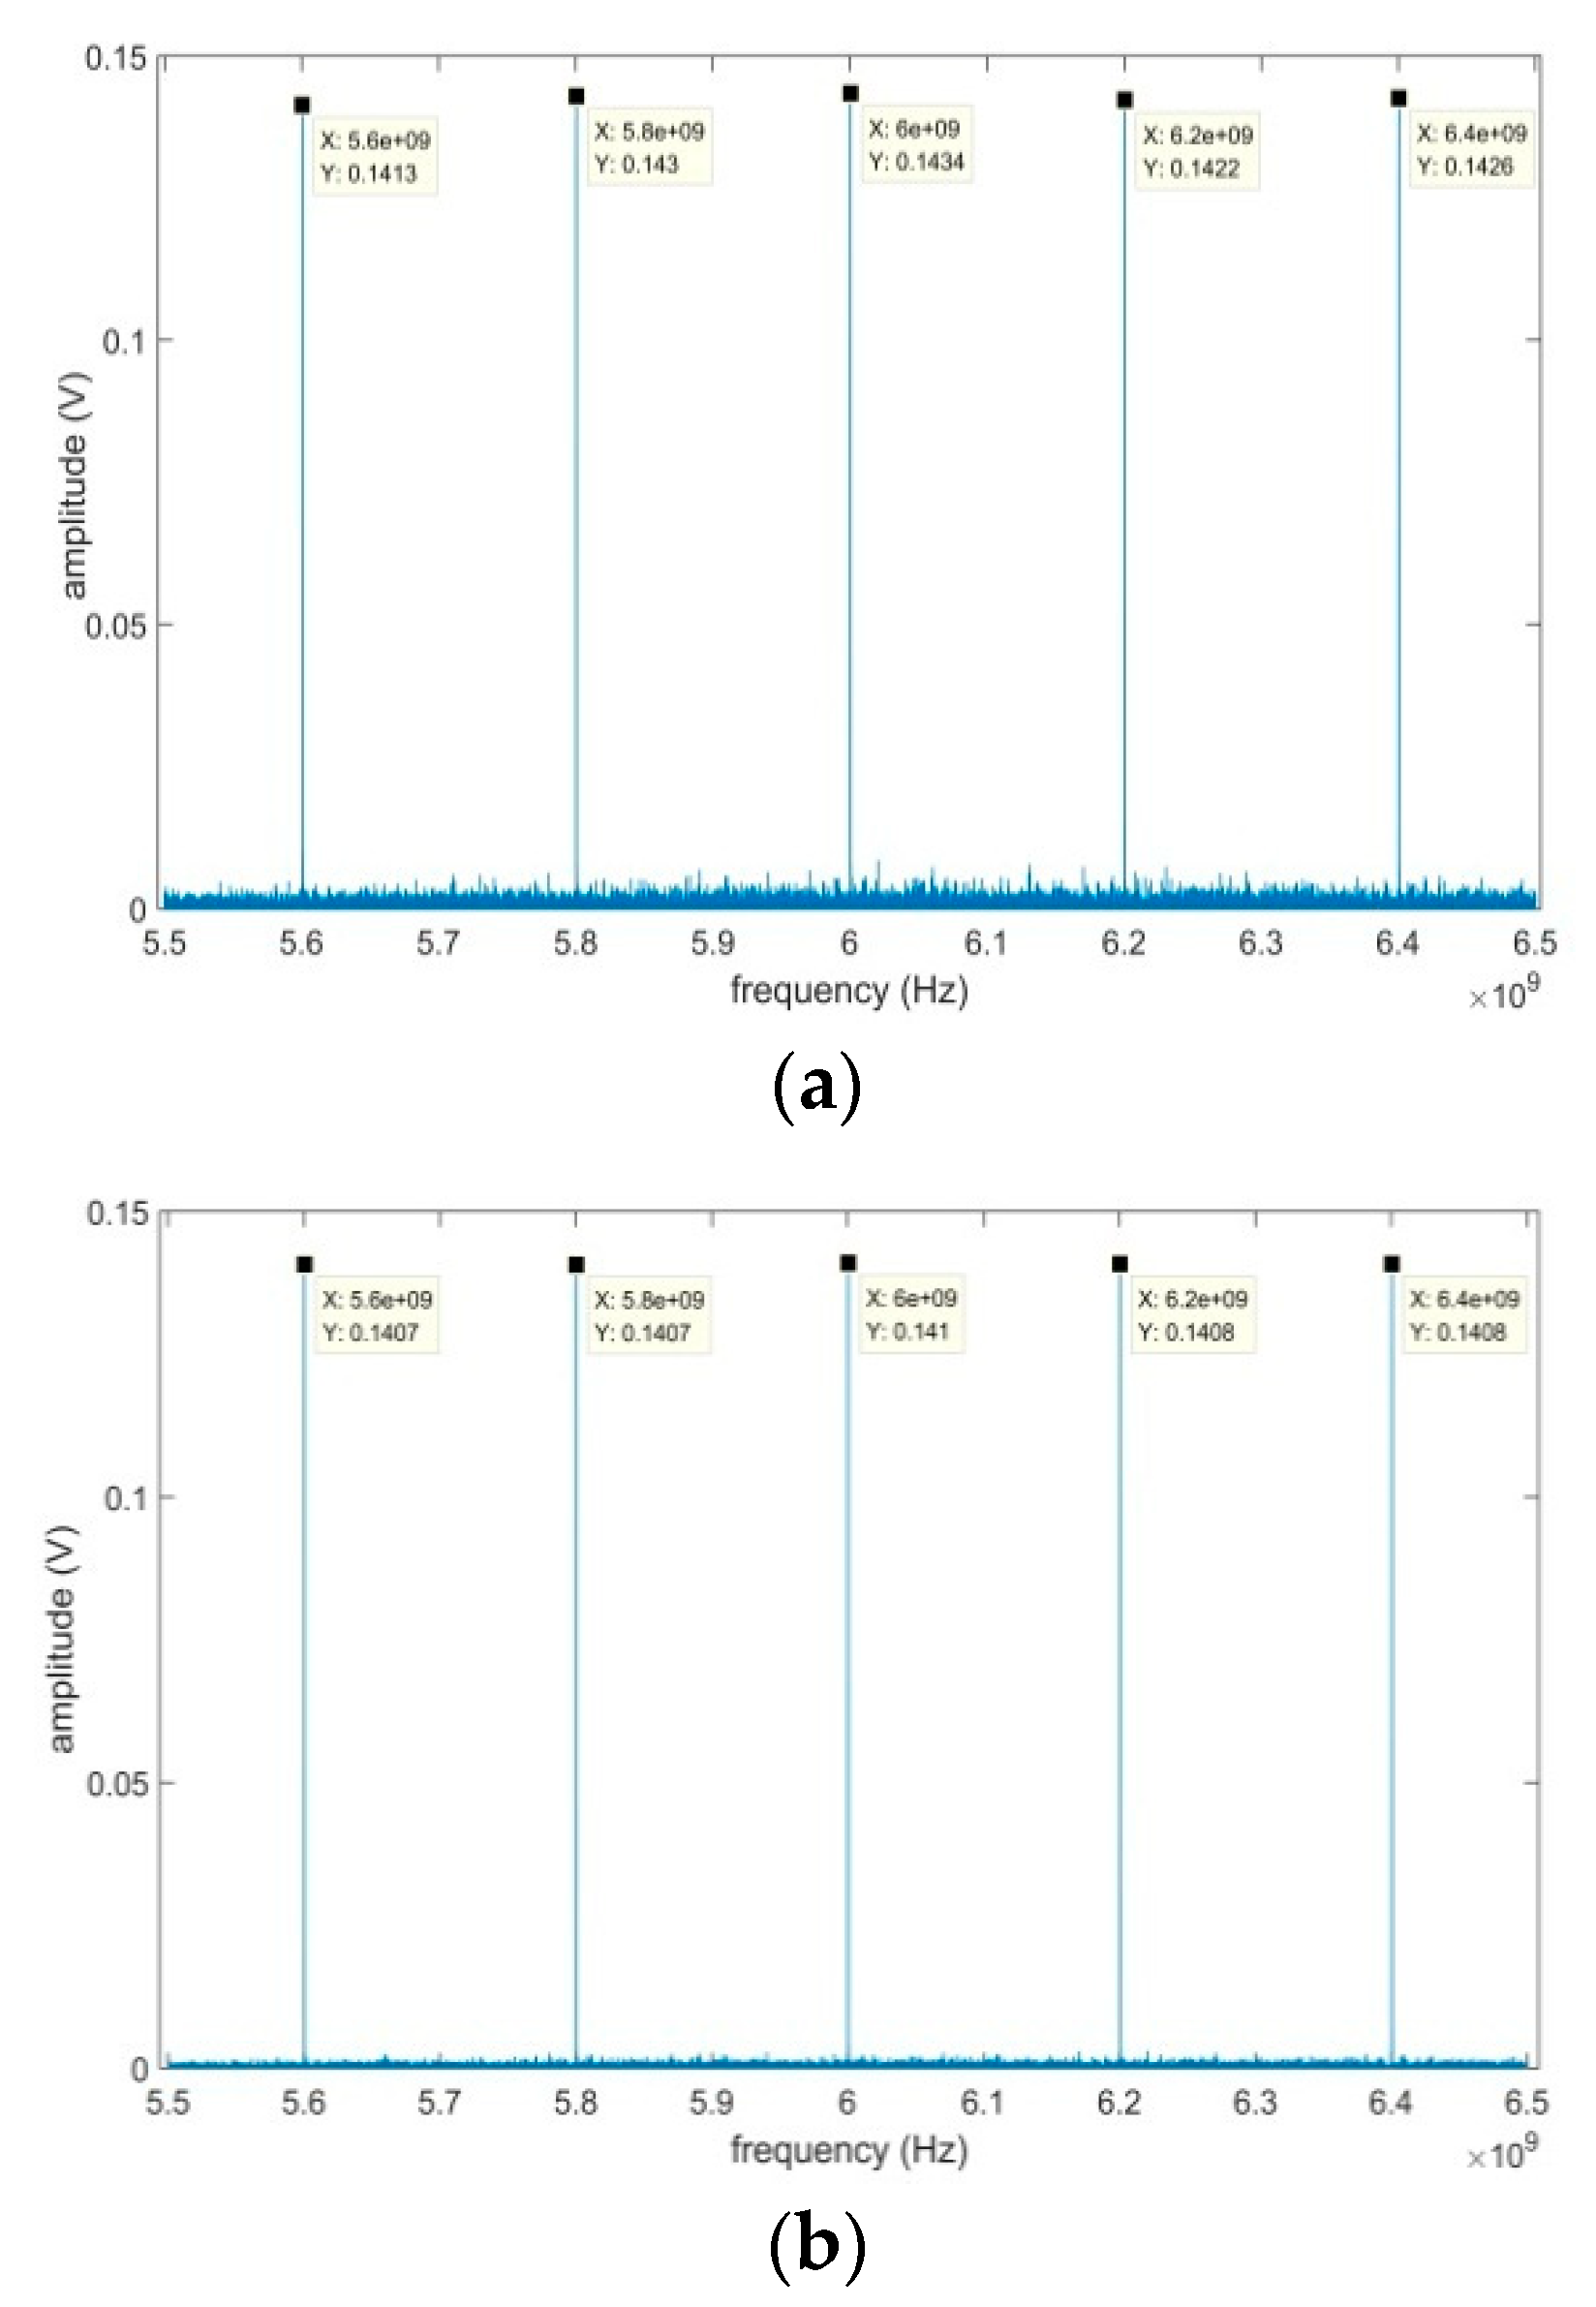
Another five input frequencies from 5.6 GHz to 6.4 GHz with 200 MHz frequency interval and identical amplitudes of 0.14 V were measured. The output pulses were calculated by the classical time-domain compression method and the novel LPSA algorithm with two-stage frequency resolution (3.1 MHz–100 kHz), as shown in Figure 5. In the second-stage frequency resolution subdivision, the subsampling rate (33.3 MHz–66.6 MHz) with only 500 orthogonal sampling was adopted for the measured spectrum. It can be seen the frequency components obtained by the two digital pulse compression methods were almost the same. The noise level had a slightly difference. This can be improved by increasing the linear sampling rate in the second-stage frequency resolution subdivision at the expense of some increased calculations. The amplitudes were a little different between the output pulses calculated by the two methods. The fixed sampling rate of 5G determines the location and maximum number of the orthogonal points satisfied (16) and (17), and it is the major factor that influences the amplitude accuracy of the output pulses. The choice of the sampling rate was determined by the amplitude accuracy requirements. In this simulation, the total computation of the novel method comprised 219600 additions and 478 multiplications, while the total number of calculations for the classical time-domain pulse compression method still comprised 4 × 10⁸ additions and 4 × 10⁸ multiplications.
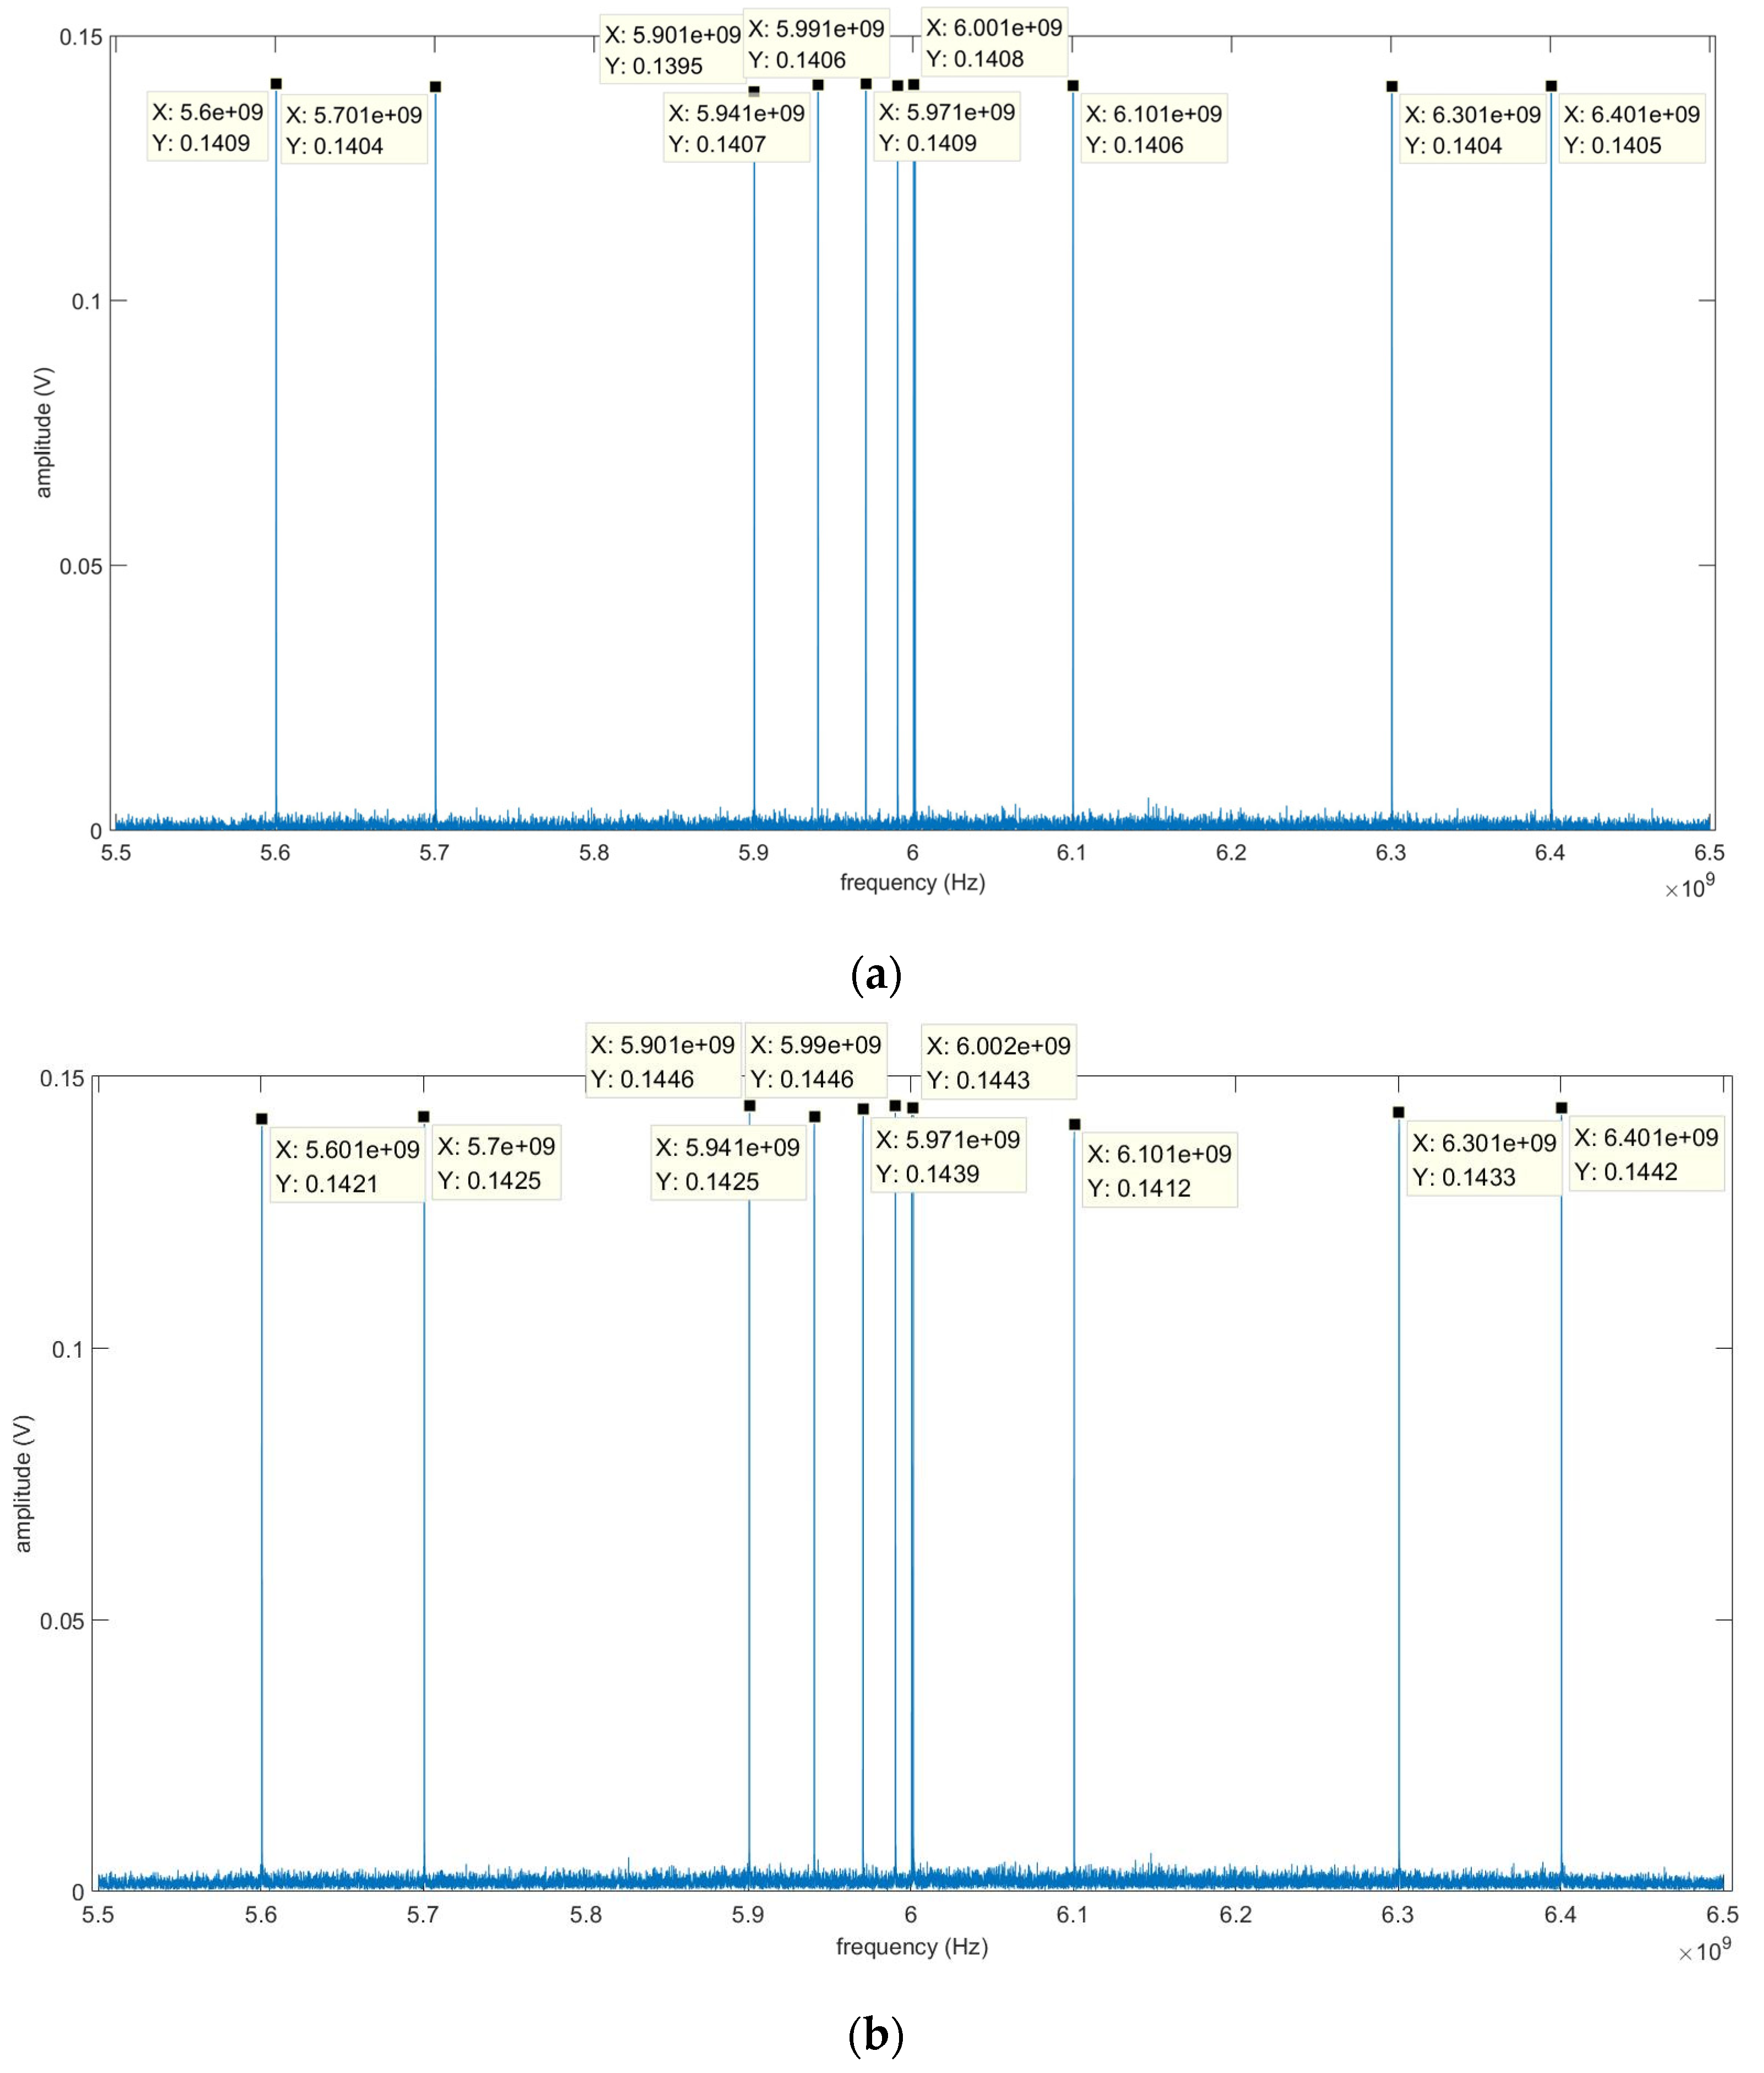
Next, a more random signal with 11 input frequencies of 5.6 GHz, 5.7 GHz, 5.9 GHz, 5.999 GHz, 6.0 GHz, 6.01 GHz, 6.03 GHz, 6.06 GHz, 6.1 GHz, 6.3 GHz and 6.4 GHz was measured using the novel LPSA algorithm with two-stage frequency resolution (3.1 MHz–100 kHz). In the calculation of the second-stage frequency resolution, the linear sampling rate ranged from 250 MHz to 500 MHz. The output pulses are shown in Figure 6. The average noise levels were very close in the two methods. There was also a little difference between the amplitudes obtained by the two methods. This was caused by the phase approximation and the number of the extracted sampling points. Higher phase approximation and more extracted sampling points yielded higher amplitude accuracy at the expense of relatively more computation.
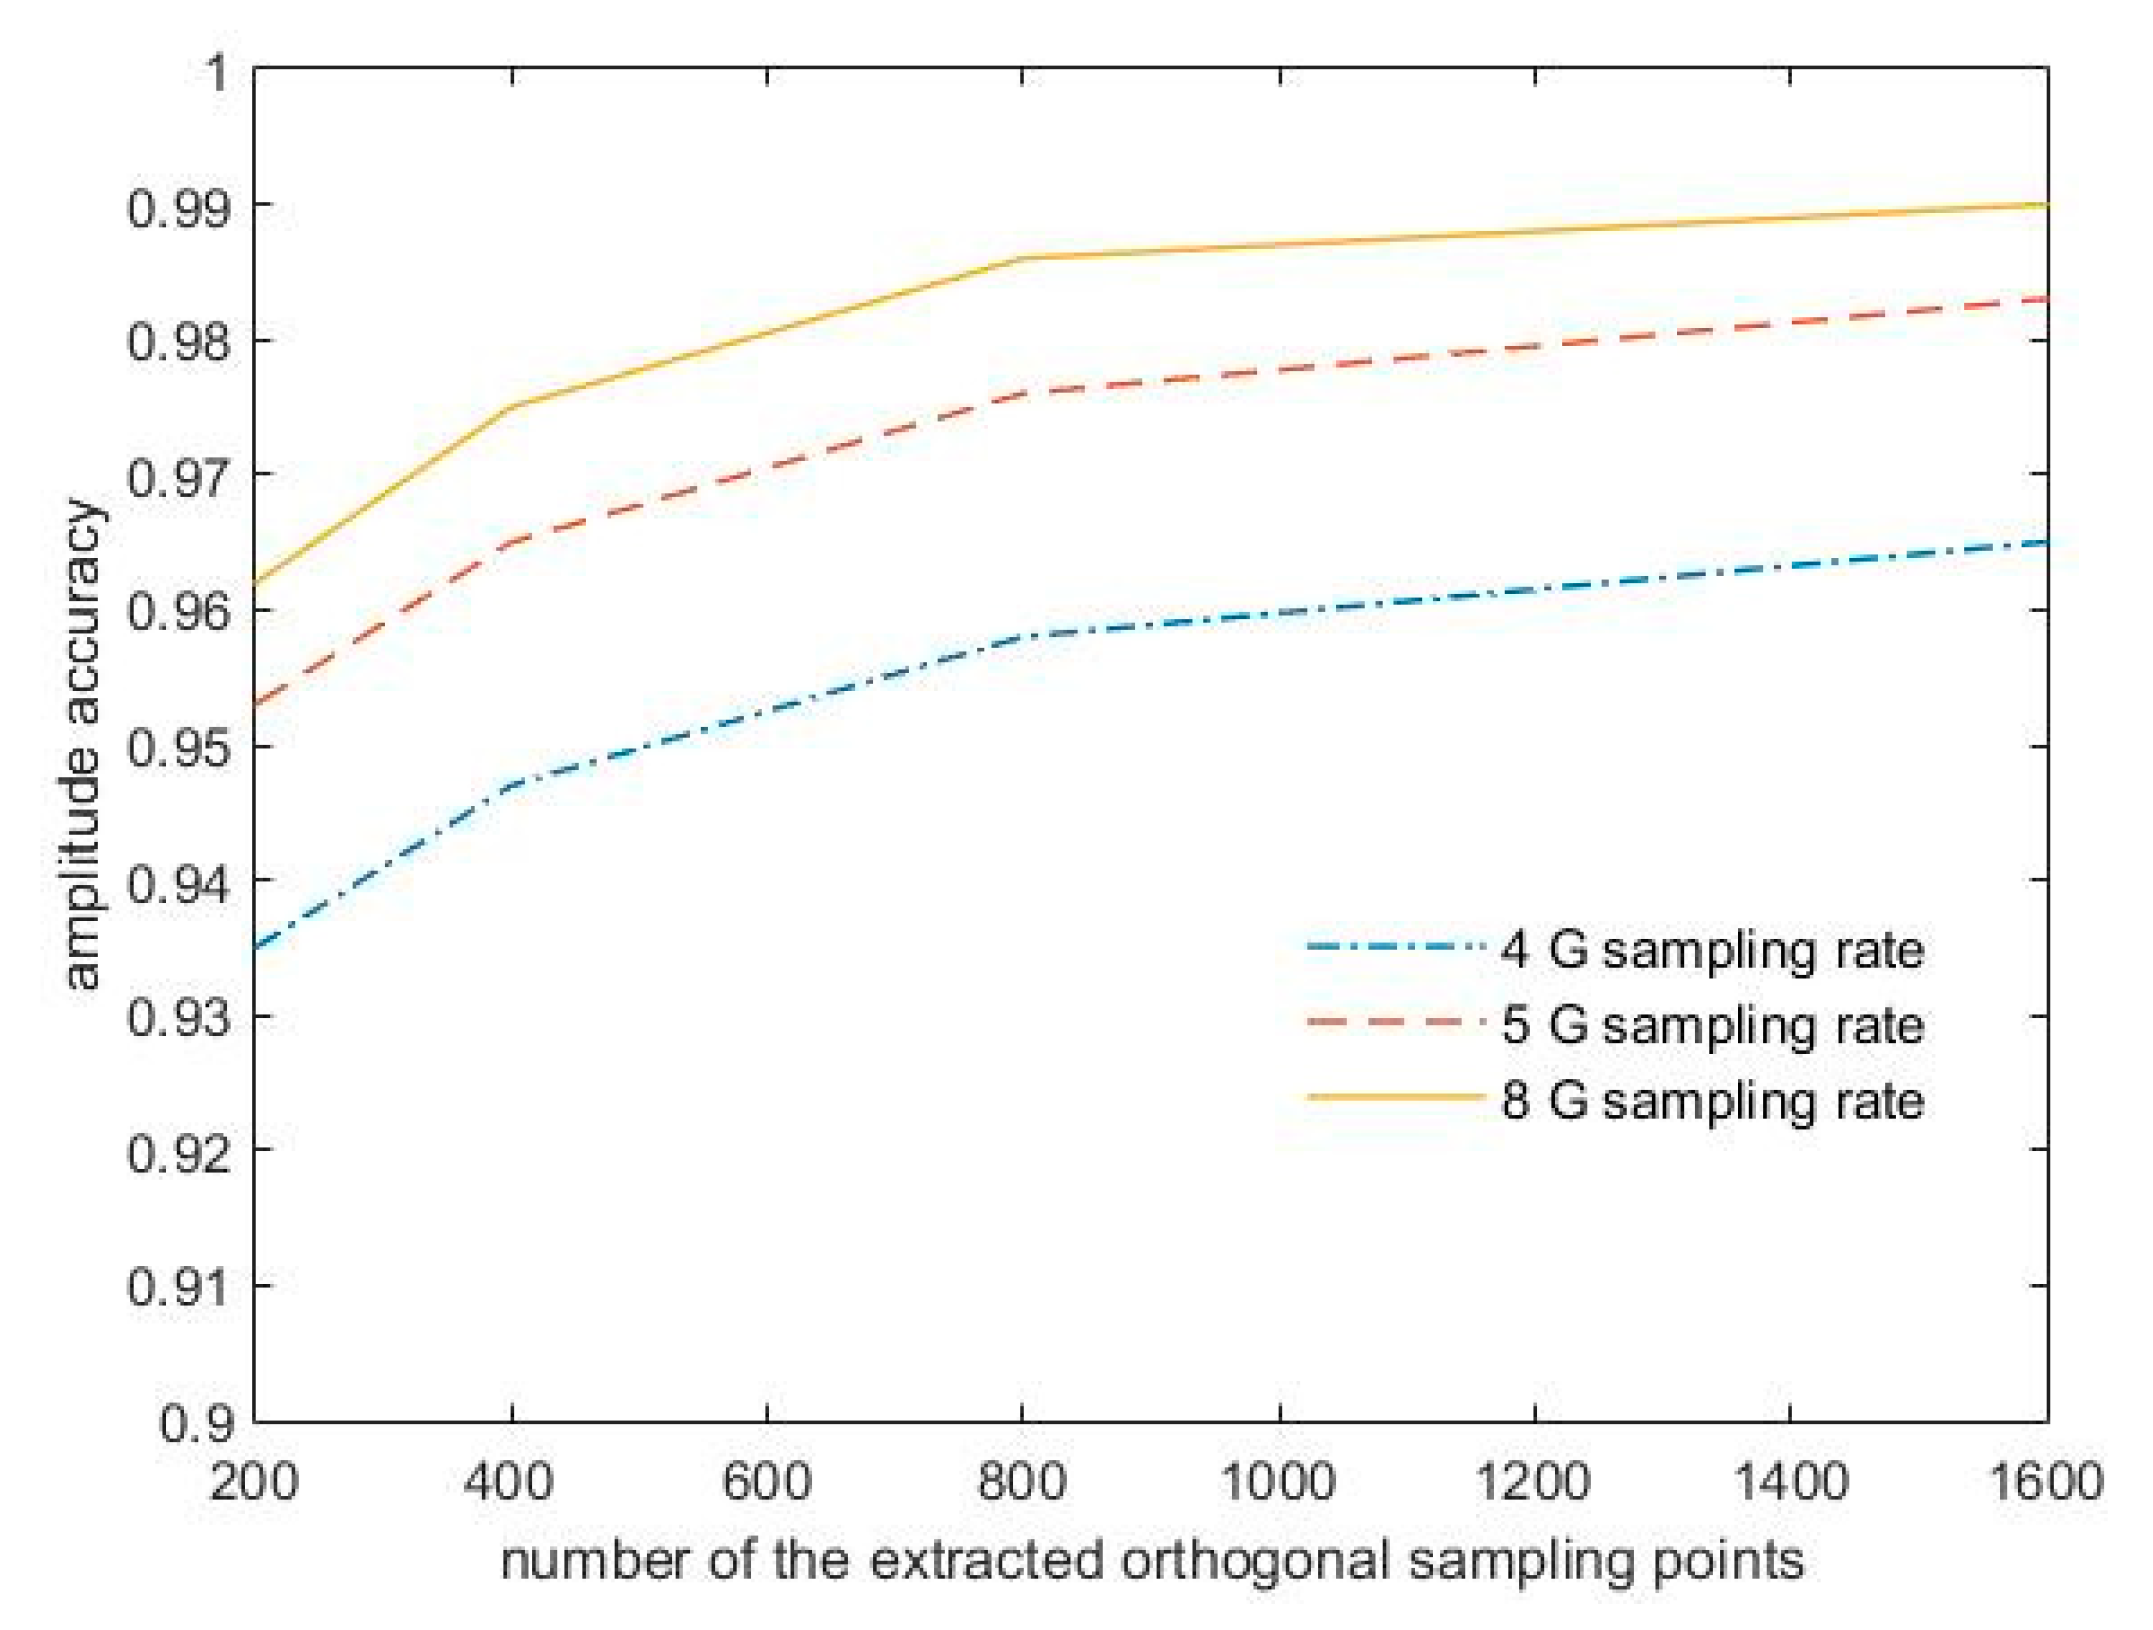
As mentioned above, the sampling rate will influence the phase accuracy of the extracted orthogonal sampling points. A higher sampling rate guarantees a smaller approximate factor p, leading to higher amplitude accuracy. Meanwhile, the increased number of the orthogonal sampling points will also reduce the impact of the phase approximation on amplitude accuracy.
Figure 7 shows the amplitude accuracy versus different sampling rates and different numbers of the orthogonal sampling points. It is obvious that the amplitude accuracy improved with the increasing number of the orthogonal sampling points. The increase of the sampling rate helped to reduce the phase error, which also improved the amplitude accuracy significantly. The simulation indicated that 800 orthogonal sampling points under an 8 GHz sampling rate were enough in the second-stage frequency resolution for the fast pulse compression with an amplitude accuracy above 98%. To obtain an amplitude accuracy above 99%, more than 1600 orthogonal sampling points in the second-stage frequency resolution under 8 GHz sampling rate would be needed.
Considering a tradeoff between the sampling rate and the number of the orthogonal sampling points, a sampling rate of 8 GHz is a reasonable choice for the novel LPSA algorithm. To obtain the average amplitude accuracy and frequency resolution, the system’s response to a sinusoidal input was measured at different input frequencies. For the simulation with 11 input frequencies, the measured amplitude accuracy, average frequency resolution and the amount of computations for the classical time-domain pulse compression method and the novel LPSA algorithm are shown in Table 1. The measured frequency resolutions of the two methods were very close. The classical time-domain pulse compression method required more computations, i.e., additions and multiplications. The computation of the novel LPSA algorithm was mainly focused on additions, which require relatively less machine instructions compared to the multiplications in the classical time-domain pulse compression method. In addition, to obtain the same amplitude accuracy as the classical time-domain pulse compression method, it needed 1600 orthogonal sampling points under the second-stage frequency resolution. Under this scenario, the total number of the addition increased to 1.0566 × 10⁶, and the multiplication remained the same.

4.3. Analysis of Computational Complexity

As mentioned above, the calculation of the LPSA algorithm is mainly determined by the number of orthogonal sampling points and the sparsity of the input signal, assuming that the input signal has a bandwidth of B and a sparsity of η s . Consider a two-stage frequency resolution ( Δ f 1 ~ Δ f 2 ) in the LPSA algorithm. For the first stage, the channel number under the frequency resolution of Δ f 1 is N 1 = B Δ f 1 , and the number of the orthogonal sampling points n 1 can also be obtained from the derived relationship between the compression time and frequency resolution in Section 3. So, the computational complexity of additions and multiplications in this stage is o ( 2 n 1 N 1 ) and o ( N 1 ) , individually. After the process of the first stage, the effective channel number was η s N 1 . For the second stage, there were m ( m = Δ f 1 Δ f 2 ) subdividable channels. Similarly, the number of the orthogonal sampling points n 2 under the second-stage frequency resolution could also be obtained. Thus, the computational complexity of the addition and multiplication were o ( 2 m n 2 η s N 1 ) and o ( m η s N 1 ) . So, the total computational complexity for the LPSA algorithm were o ( 2 n 1 N 1 ) + o ( 2 m n 2 η s N 1 ) and o ( N 1 ) + o ( m η s N 1 ) . It can be seen that the main calculation was focused on addition. The number of orthogonal sampling points and the sparsity of the input signal were the main factors influencing the calculation.
Usually, in the time-domain pulse compression method, the sampling rate is larger than double the band of the input signal. This indicates that the sampling number used in the time-domain pulse compression method is much larger than the orthogonal sampling points used in the LPSA algorithm. The computational complexity in the time-domain pulse compression method is o ( n 2 ) . So, compared to the classical time-domain pulse compression method, the proposed LPSA method can save a lot of computation, especially for the measurement of sparse signals with low dynamic range.

5. Experimental Verification and Analysis

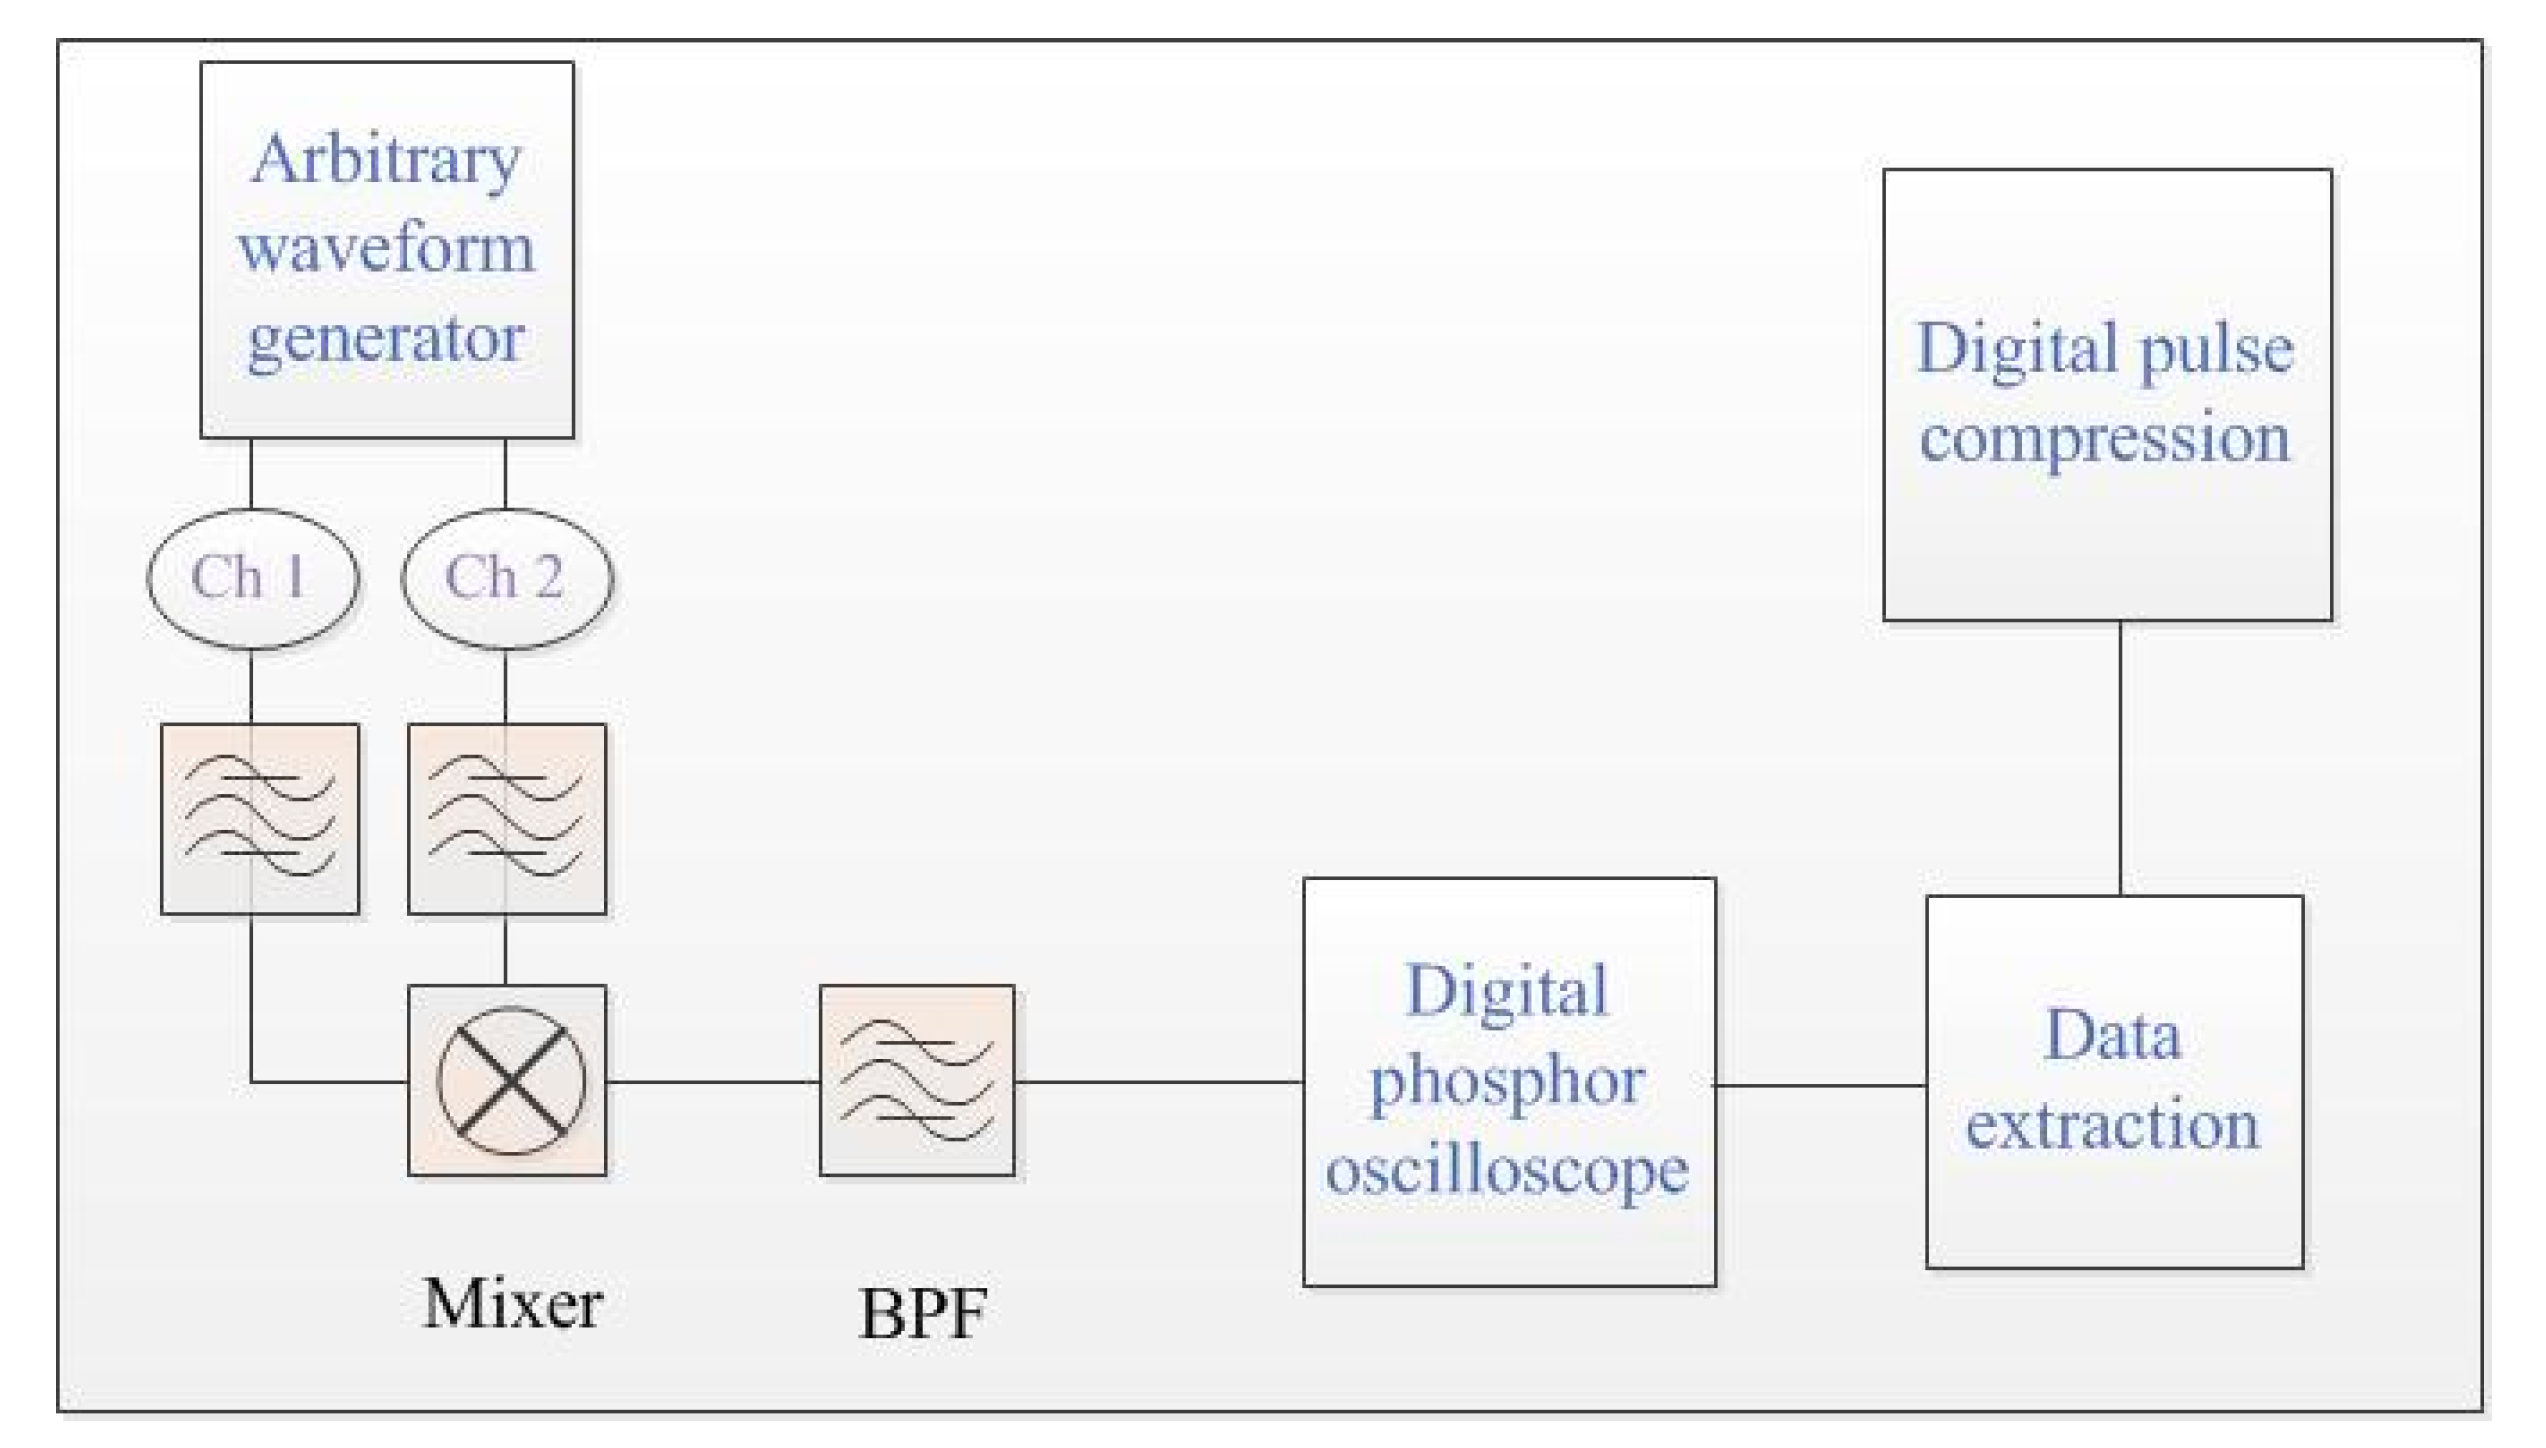
To verify the proposed LPSA algorithm for fast pulse compression, we built an experiment, as shown in Figure 8. In the experiment, the input frequency bandwidth ranged from 1.8 GHz to 2.4 GHz. The frequency of the expander chirp signal ranged from 2.5 GHz to 3.7 GHz, the chirp rate was 60 MHz/μs, and time duration was 20 μs. These two signals were generated by an arbitrary waveform generator (AWG7082C). The measured signals with four point frequencies at 1.8 GHz, 1.9 GHz, 2.0 GHz and 2.1 GHz were generated from the second channel of the AWG. After the mixer and band-pass filter, the IF chirp signals had a frequency bandwidth from 700 MHz to 1300 MHz. A digital phosphor oscilloscope (DPO) with 2 GHz bandwidth was used to sample and store the output IF chirp signal for the final digital pulse compression.
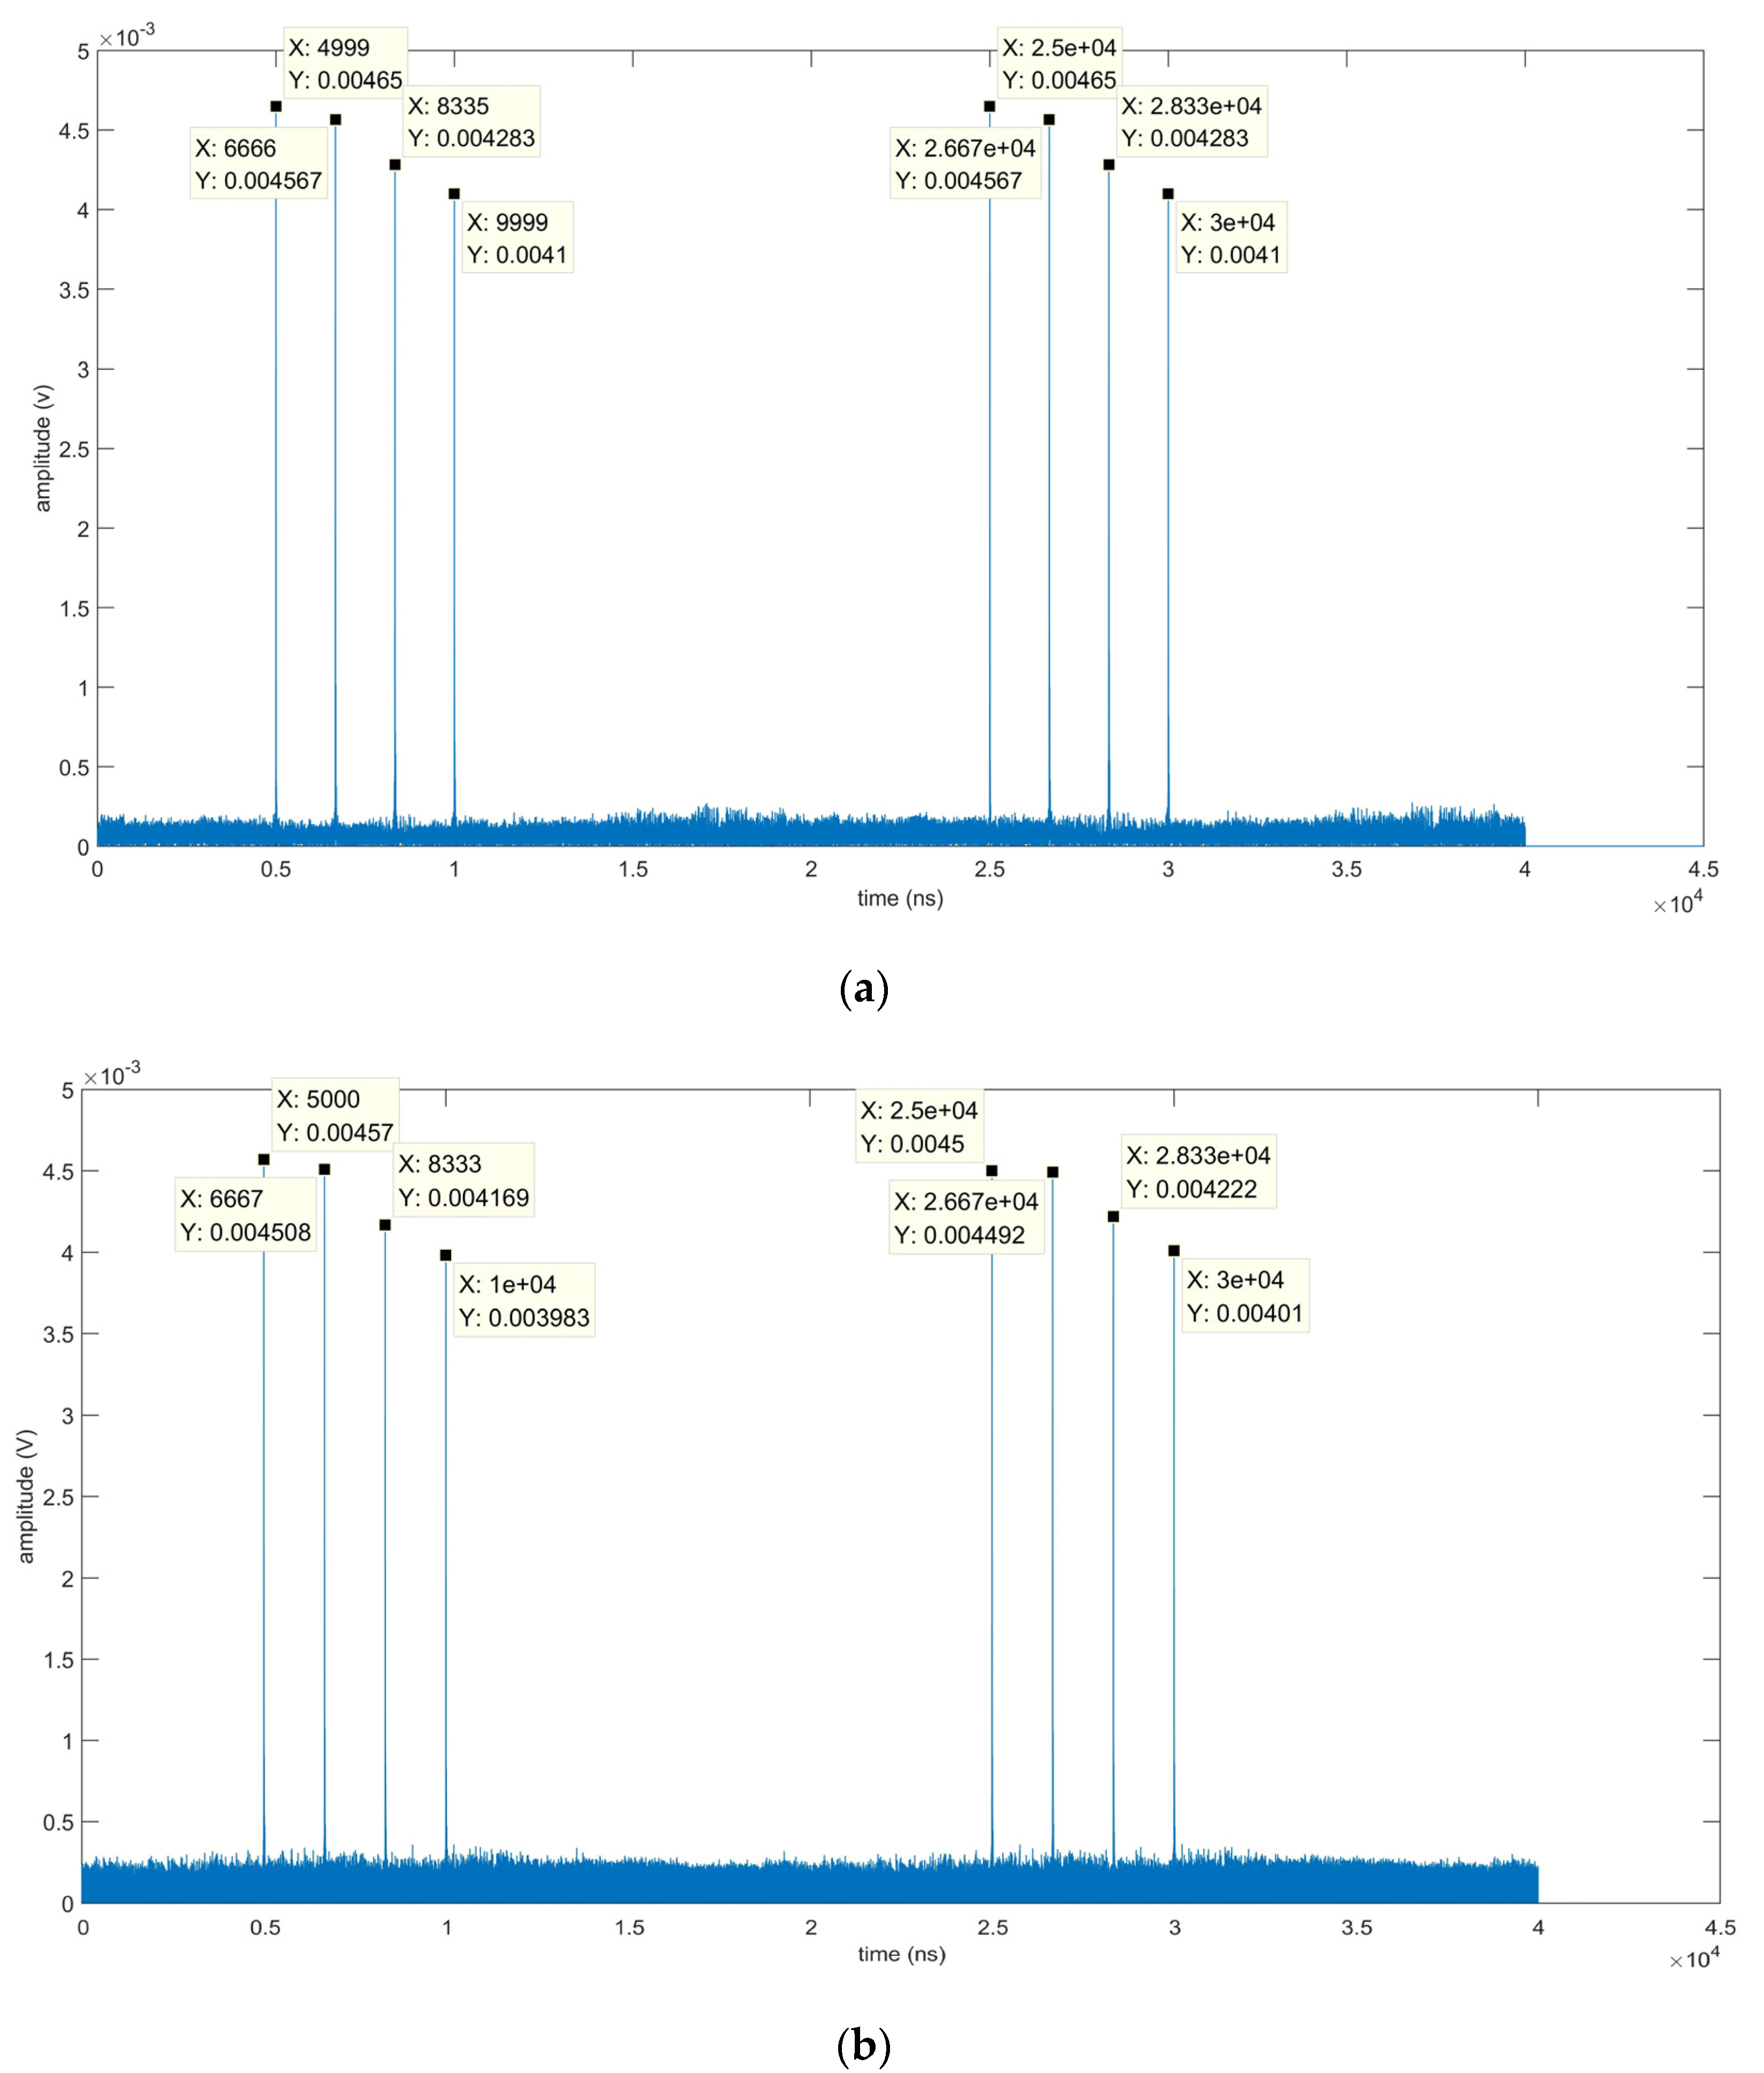
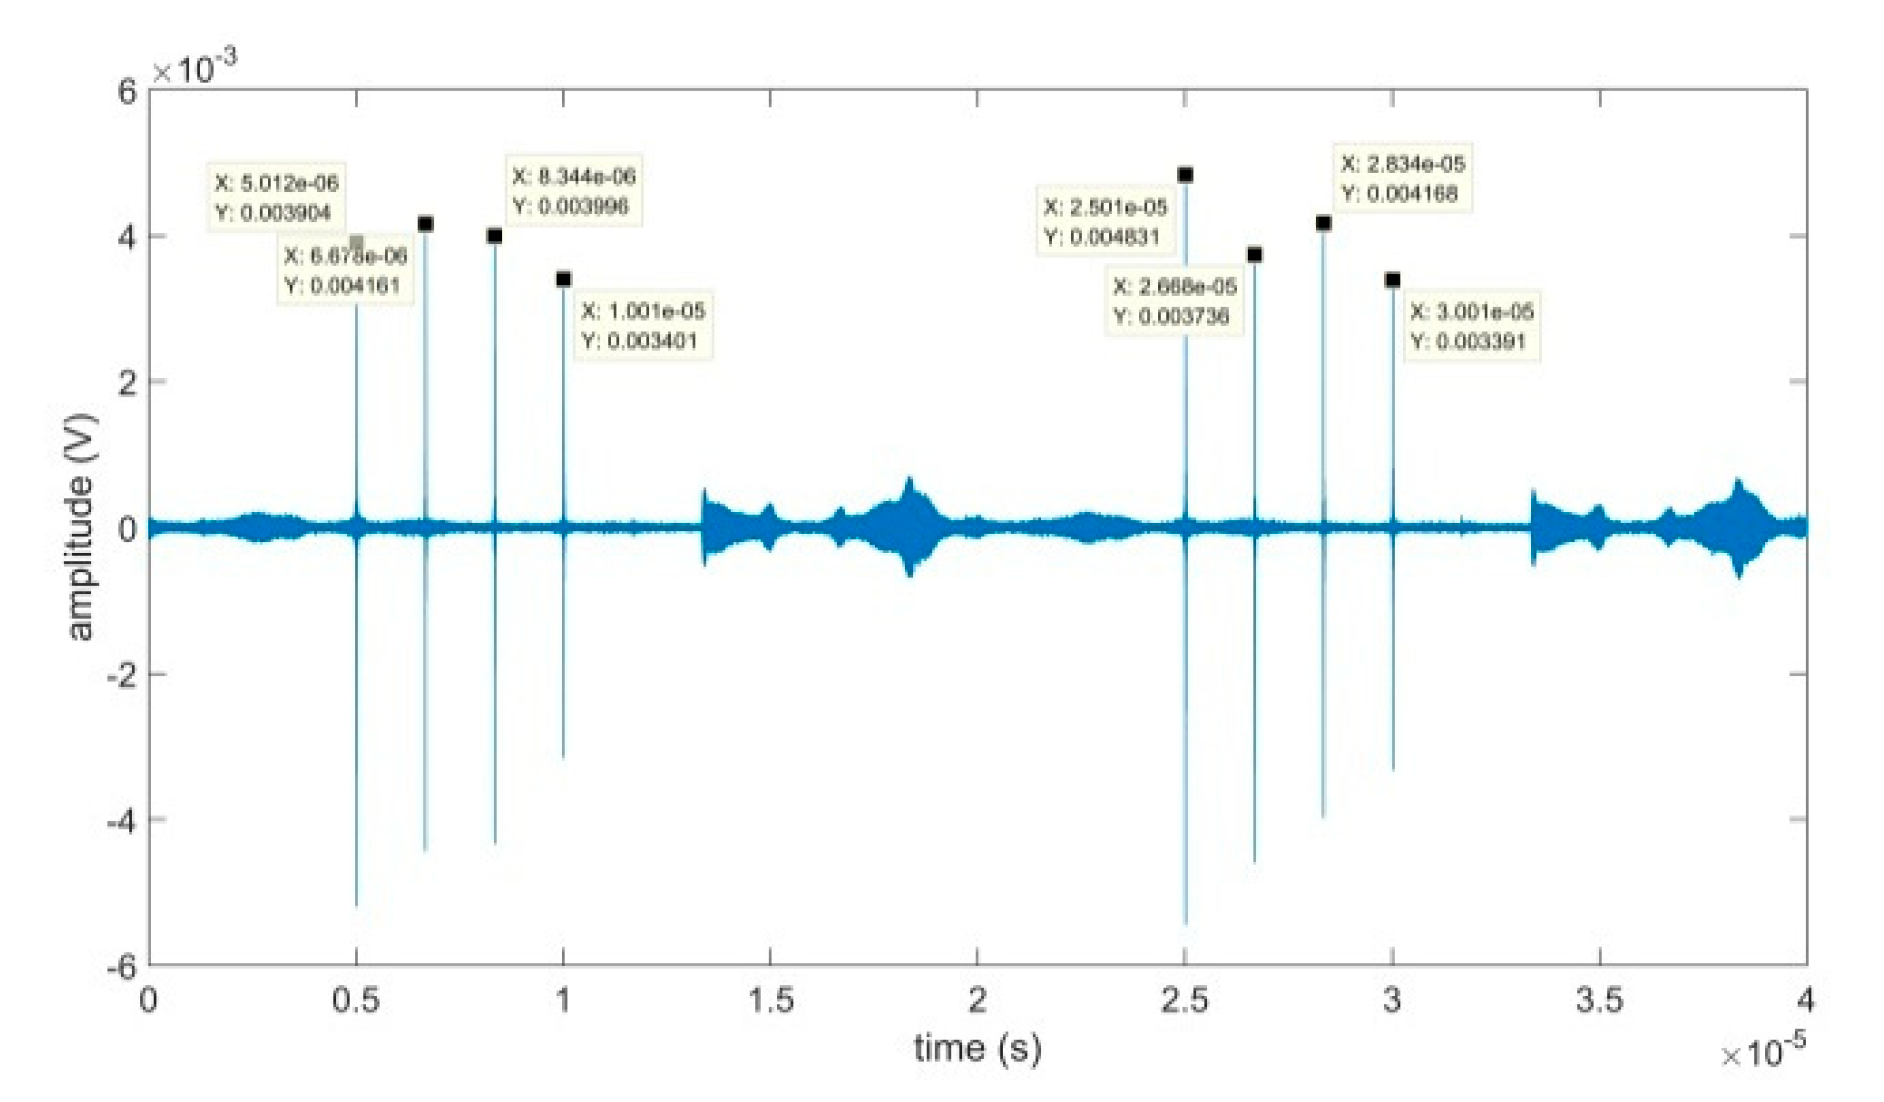
Figure 9 shows the output pulses calculated by the classical time-domain pulse compression method (a) and the novel LPSA algorithm (b) at a 8 G sampling rate. Two periods of output pulses can be observed in Figure 9. The horizontal axis is time, which can be converted to frequency by multiplying with the chirp rate. The time interval between the output pulses was about 1.667 μs, so the corresponding frequency interval was about 100 MHz, considering a chirp rate of 60 MHz/μs. It can be seen that a big amplitude difference (up to 1.14 dB) existed between the different output pulses in both of the two pictures. This was mainly caused by the different conversion loss for different input frequencies of the mixer that were used in the experiment. This fixed error introduced by the mixer could be calibrated with the conversion loss characteristic of the mixer. The amplitudes of the output pulses calculated by the classical time-domain pulse compression method were slightly higher than those calculated by the LPSA algorithm, and the noise level in (a) was smaller than that in (b). These differences in amplitudes and noise levels were introduced by the approximate choice of the orthogonal sampling points with fixed sampling rate; the differences can be further reduced by increasing the sampling rate and choosing more reasonable orthogonal sampling points.
Figure 10 shows the output pulses obtained by the SAW filter. In the experiment, a S2P file was created in MATLAB to replace the SAW filter for pulse compression. It can be seen that the amplitudes compressed by the SAW filter were smaller than those in Figure 9, while the average noise level was bigger. This was due to the limited time-bandwidth ( T c B c ) of the SAW filter, which could only achieve a compression gain ratio of D = T c B c . This is an obvious disadvantage of the analog compression method, as it will degrade the sensitivity of the system. In addition, the mismatch in the dispersion characteristics between different SAW filters will also influence the amplitude accuracy and the frequency resolution. Compared to this analog pulse compression method, the novel LPSA algorithm can avoid mismatch problem and increase the sensitivity of the system.
The total calculations of the classical time-domain compression method comprised 1.2 × 10⁸ multiplications and 1.2 × 10⁸ additions, while that of the LPSA method with two-stage frequency resolution subdivision comprised just 2.48 × 10⁵ additions and 268 multiplications.
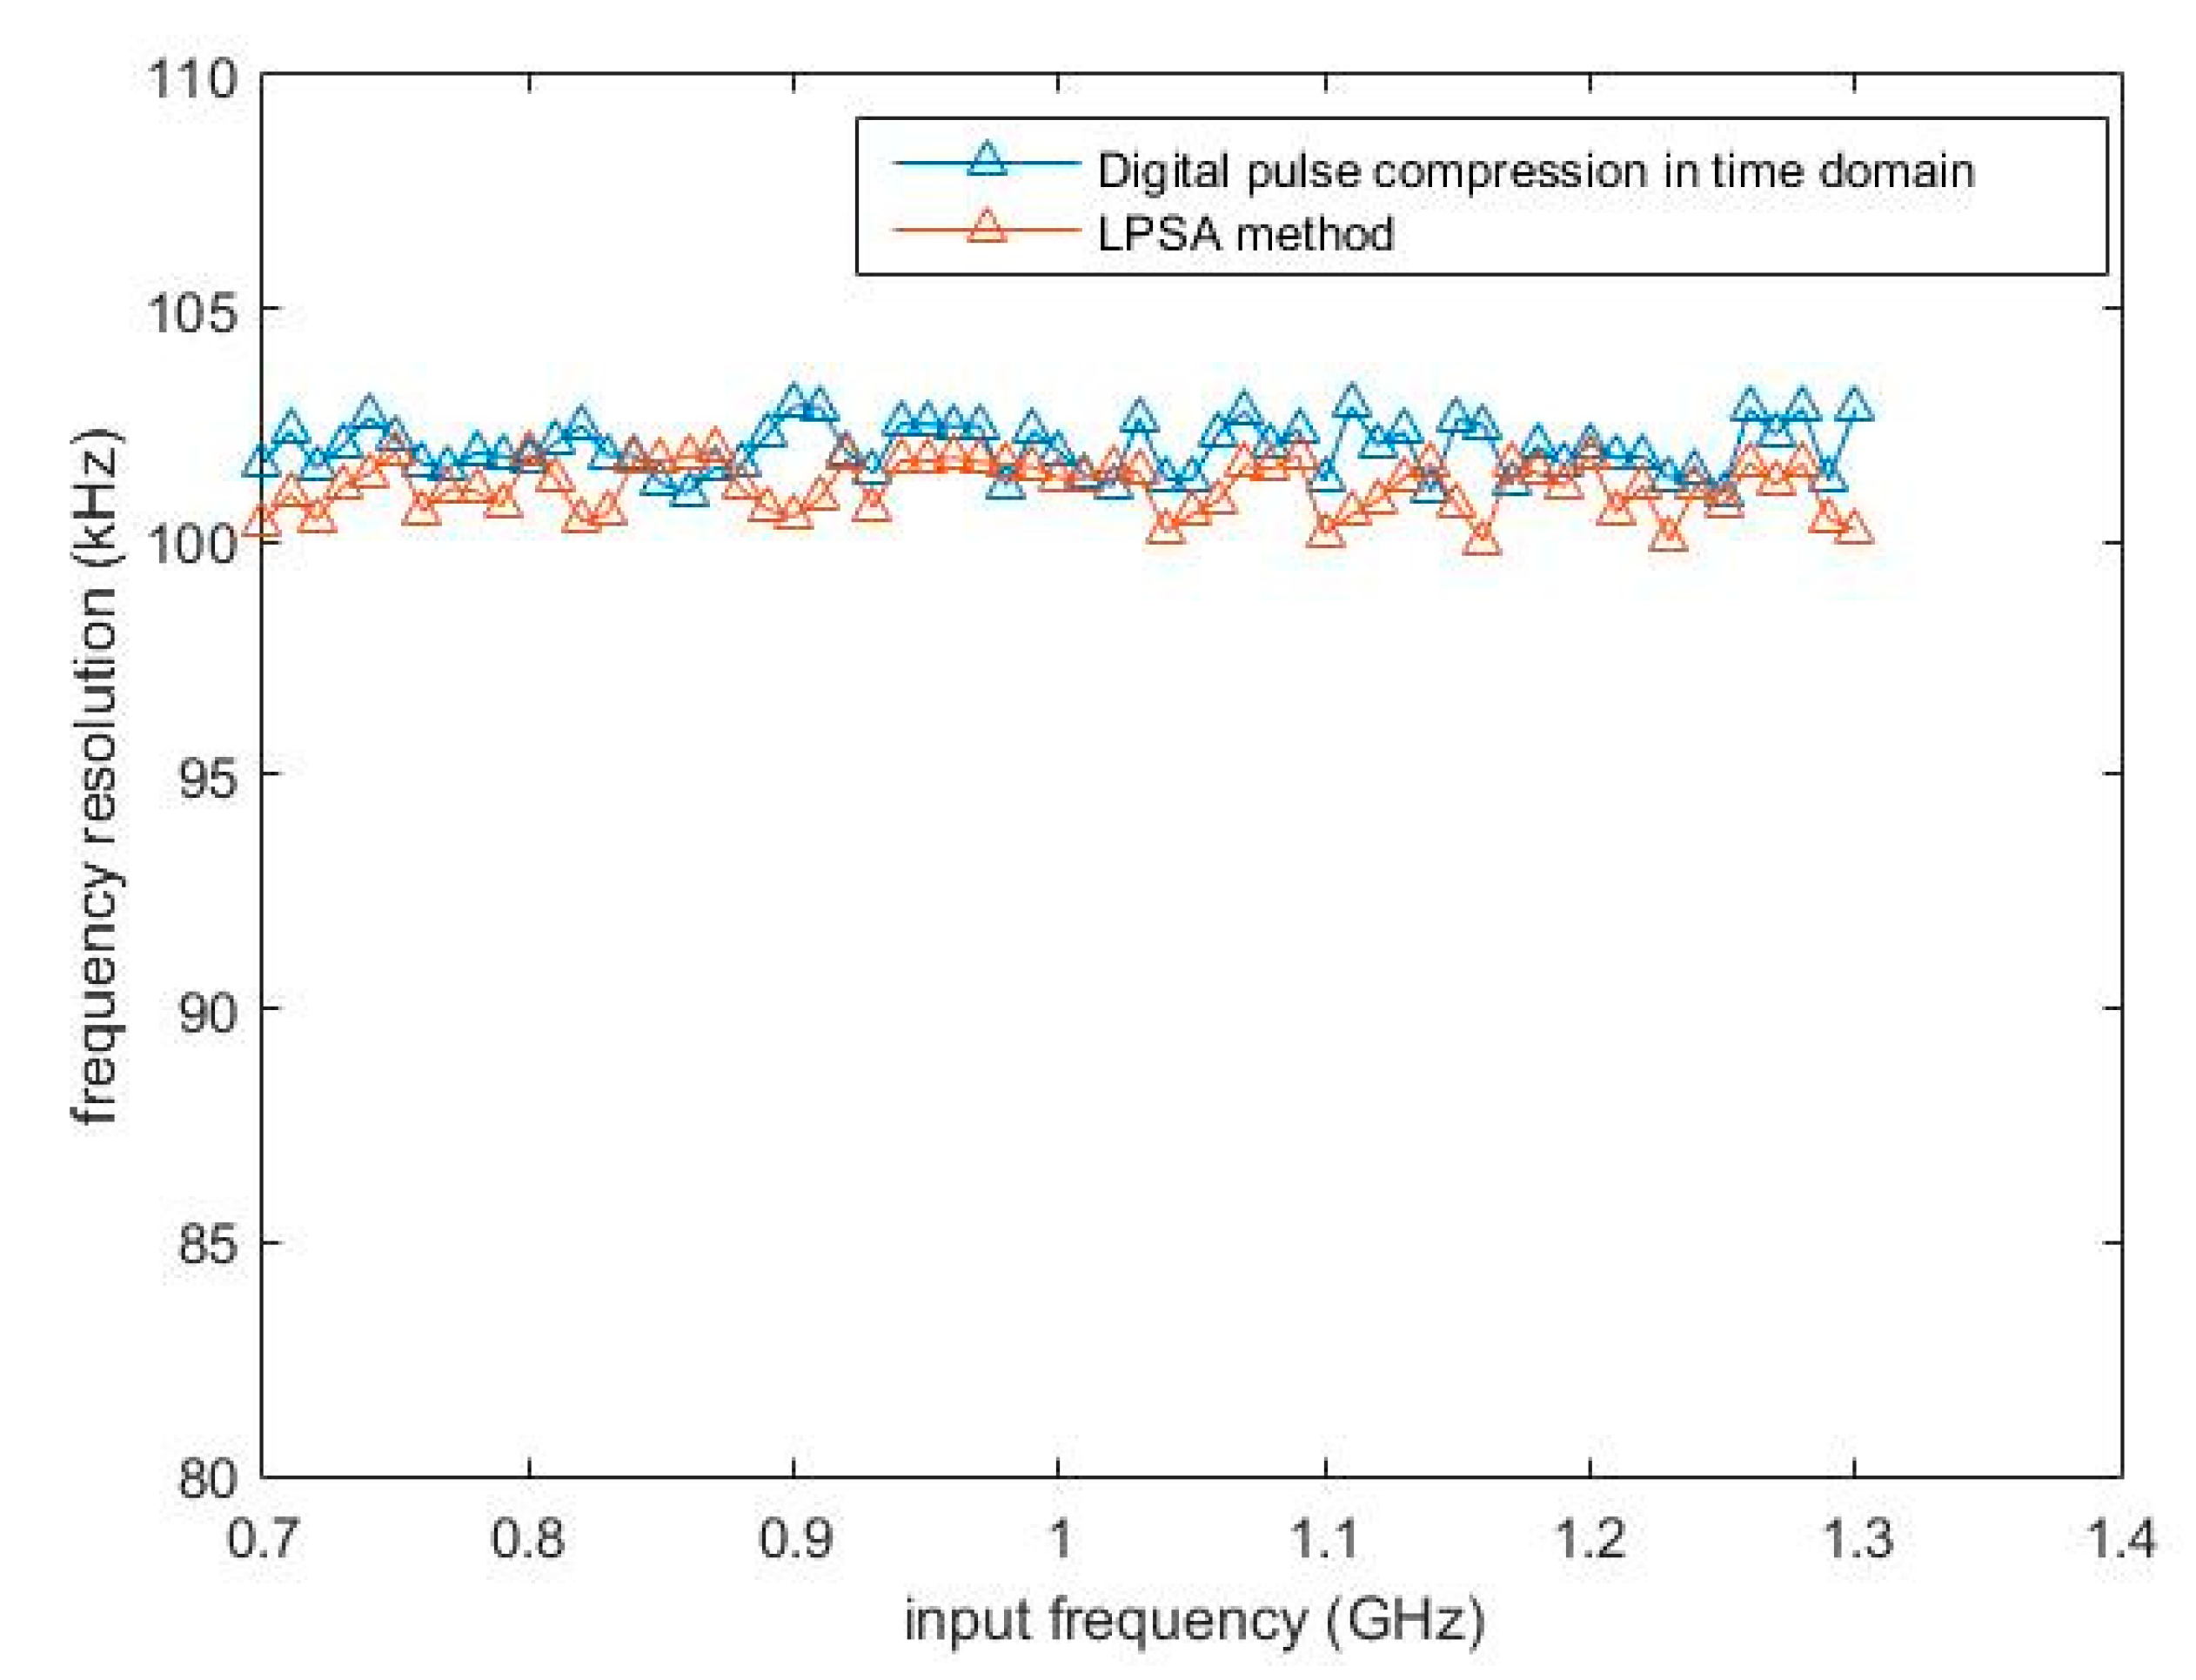
Figure 11 shows the frequency resolutions obtained by the LPSA algorithm and the digital time-domain pulse compression method. The measured average frequency resolutions were 101.17 kHz and 102.2 kHz, individually, calculated from the high resolution sampling data at 10 kHz. It can be seen that the two values were particularly close to the maximum achievable frequency resolution ( 1 T c = 100 kHz) of the classical CTS system with the SAW filter as the compressor.

6. Discussion

In this paper, a novel LPSA algorithm is proposed for pulse compression based on a chirp transform spectrometer. Limited by the dispersion characteristic match between the expander chirp signal and the SAW compressor, and the large attenuation and limited operational bandwidth of the SAW devices in the classical two-channel pull-push structure, a digital pulse compression method may be a reasonable alternative to SAW filters. Considering the quadratic phase characteristic of the chirp signal, a fast digital pulse compression method by linear sampling and accumulation was developed. Compared to the classical digital pulse compression that is widely applied in radar systems, the proposed novel method significantly decreases the computational requirements, with a two-stage frequency resolution subdivision for sparse spectrum measurements at the expense of small dynamic range.
Considering the parameters proposed in the simulations, the input IF chirp signal had a bandwidth from 1.1 GHz to 2.1 GHz for pulse compression. In classical digital pulse compression methods applied in radar systems, the realization of pulse compression in the time-domain requires significant computation. The frequency-domain pulse compression method with less computation cannot be used in the CTS system, as the spectrum measurement is based on time intervals of the IF chirp signals. In the novel LPSA algorithm with two-stage frequency subdivision, if 100 sampling points are used for spectrum sensing (with a corresponding frequency resolution of 3.1 MHz), then the total number additions and multiplications will be 64,600 and 323, respectively. In the second-stage frequency resolution subdivision, only the channels with signals above the threshold will be calculated. So, the calculation is proportional to the sparsity of the measured spectrum. When dealing with sparse spectra with small dynamic ranges, the LPSA method can further save on computation.
From the derived frequency resolution in the LPSA algorithm, we can see that the frequency resolution is mainly determined by the compression time, that is, the bandwidth of the IF chirp signals. The pulse amplitude accuracy of the novel LPSA algorithm is mainly determined by the number and accuracy of the orthogonal sampling points. Usually, 800 sampling points with 8 G sampling rate can achieve an amplitude accuracy above 98%. Also, the approximate factor p will influence the amplitude accuracy slightly; this can be optimized by improving the sampling rate to keep p close to zero. It can be also observed that the different conversion losses for different input frequencies for the mixer have a significant influence of the amplitude accuracy. This can be calibrated with the conversion loss characteristic of the mixer.

7. Conclusions

Based on the CTS system, a novel LPSA algorithm has been developed for fast pulse compression. Compared to the SAW filter for physical pulse compression, digital pulse compression can avoid the difficult dispersion characteristic match between the expander chirp signal and the SAW filters, as well as the large attenuation and limited operational bandwidth of the SAW devices. The novel LPSA algorithm can realize fast pulse compression in a much simpler way compared to the classical digital pulse compression method. The computation is far less consequent compared to the time-domain pulse compression method when dealing with an input signal with a sparse spectrum and small dynamic range. The phase approximation of the extracted sampling points will degrade the system performance, i.e., the amplitude accuracy and the dynamic range, which will influence the sensitivity of the system. To obtain a precise approximation of the orthogonal sampling points, the sampling rate required in the LPSA algorithm will be much higher than that in the classical digital pulse compression method. The factors that mainly influence the amplitude accuracy focus on the number of the sampling points, the sampling rate, the approximate factor p and the conversion loss of the nonideal mixer. In general, the proposed LPSA method can realize fast pulse compression for sparse spectrum measurements based on the CTS system at the expense of higher sampling rates and smaller dynamic range. This novel LPSA algorithm could be applied not only to CTS for fast pulse compression, but also to fast pulse compression in radar systems, especially for sparse signals with small dynamic range.

Author Contributions

Conceptualization, Q.Z.; methodology, Q.Z.; validation, Q.Z., L.T. and B.G.; formal analysis, Q.Z. and L.T.; resources, Q.Z., L.T. and B.G.; writing-original draft preparation, Q.Z. and L.T.; writing-review and editing, Q.Z. and L.T.; funding acquisition, L.T. and B.G. All authors have read and agreed to the published version of the manuscript.

Funding

This work was funded by The Pre-research Project of Civil Aerospace Technology of China (D040109).

Institutional Review Board Statement

Not applicable.

Informed Consent Statement

Not applicable.

Data Availability Statement

Not applicable.

Acknowledgments

The authors would like to thank Yandong Xiao for the supply of the arbitrary waveform generator (7082c) in the experiment.

Conflicts of Interest

The authors declare no conflict of interest.

References

  1. Schwaab, G.W. Heterodyne spectrometer. Infrared Phys. Technol. 1999. [Google Scholar] [CrossRef]
  2. Stanko, S.; Klein, B.; Kerp, J. A Field Programmable Gate Array Spectrometer for Radio Astronomy. Astron. Astrophys. 2005, 436, 391–395. [Google Scholar] [CrossRef] [Green Version]
  3. Klein, B.; Philipp, S.D.; Güsten, R.; Krämer, I.; Samtleben, D. A new generation of spectrometer for radio astronomy: Fast Fourier Transform Spectrometer. Proc. Spie 2006, 6275, 627511. [Google Scholar]
  4. Klein, B.; Hochgurtel, S.; Kramer, I.; Bell, A.; Meyer, K.; Gusten, R. High-resolution wide-band Fast Fourier Transform spectrometers. Astron. Astrophys. 2012, 542, L3. [Google Scholar] [CrossRef] [Green Version]
  5. Weintroub, S. Pulse Compression and Radar. Nature 1967, 216, 409. [Google Scholar] [CrossRef]
  6. Klauder, J.R.; Price, A.C.; Darlington, S.; Albersheim, W.J. The theory and design of chirp radars. Bell Syst. Technol. J. 1960, 39, 745–808. [Google Scholar] [CrossRef]
  7. Darlington, S. Demodulation of wideband, low-power fm signals. Bell Syst. Technol. J. 2014, 43, 339–374. [Google Scholar] [CrossRef]
  8. Hartogh, P.; Hartmann, G. A high-resolution chirp transform spectrometer for microwave measurements. Meas. Sci. Technol. 1990, 1, 592–595. [Google Scholar] [CrossRef]
  9. Hartogh, P.; Hartmann, G.K.; Heimesaat, G. The Use of Chirp Transform Spectrometers for Real Time Fourier Transform of Stochastic Signals; Technical Report; Max-Planck-Institut fr Aeronomie: Katlenburg-Lindau, Germany, 1989. [Google Scholar]
  10. Lis, D.C.; Biver, N.; Bockeleemorvan, D.; Bockelée-Morvan, D.; Hartogh, P.; Bergin, E.A.; Blake, G.A.; Crovisier, J.; de Val-Borro, M.; Jehin, E.; et al. A herschel study of D/H in water in the jupiter-family comet 45p/honda-mrkos-pajdusakova and prospects for D/H measurements with CCAT. Astrophys. J. Lett. 2013, 774, L3. [Google Scholar] [CrossRef] [Green Version]
  11. Villanueva, G.L.; Mumma, M.J.; Novak, R.E.; Käufl, H.U.; Hartogh, P.; Encrenaz, T.; Tokunaga, A.; Khayat, A.; Smith, M.D. Strong water isotopic anomalies in the martian atmosphere: Probing current and ancient reservoirs. Science 2015, 348, 218–221. [Google Scholar] [CrossRef] [PubMed] [Green Version]
  12. Hartogh, P. A fast, high resolution chirp transform spectrometer for atmospheric remote sensing from space. IEEE Int. Geosci. Remote Sens. Symp. 1991, 979–982. [Google Scholar]
  13. Zhao, Q.; Tong, L.; Bo, G. A Novel Single-channel Arrangement in Chirp Transform Spectrometer for High-resolution Spectrum Detection. Appl. Sci. 2020, 10, 4896. [Google Scholar]
  14. Zhao, Q.; Tong, L.; Bo, G. Spectral Analysis of Stationary Signals Based on Two Simplified Arrangement of Chirp Transform Spectrometer. Electronics 2020, 10, 65. [Google Scholar] [CrossRef]
  15. Villanueva, G.L.; Hartogh, P.; Reindl, L.M. A digital dispersive matching network for SAW devices in chirp transform spectrometers. IEEE Trans. Microw. Theory Technol. 2006, 54, 1415–1424. [Google Scholar] [CrossRef]
  16. Li, X.Y.; Reindl, L.; Weimann, T.; Plessky, V.; Hartogh, P. Duty cycle weighting using e-beam lithography in RACs with constant groove depth for Chirp Transform Spectrometers. Adv. Geosci. 2010. [Google Scholar] [CrossRef]
  17. Qu, X.J.; Ma, C.M.; Zhang, S.X.; Lian, S.T. High real-time design of digital pulse compression based on FPGA. Math. Probl. Eng. 2015, 1–8. [Google Scholar] [CrossRef] [Green Version]
  18. Golubicic, Z.; Simic, S.; Zejak, A.J. Design and FPGA implementation of digital pulse compression for band-pass radar signals. J. Electr. Eng.-Elektrotechnicky Cas. 2013, 64, 191–195. [Google Scholar]
  19. Villanueva, G. The High Resolution Spectrometer for Sofia-Great: Instrumentation, Atmospheric Modeling and Observations. Ph.D. Thesis, Albert Ludwig University, Freiburg, Germany, 2004. [Google Scholar]
  20. Hofstadter, M.D.; Hartogh, P.; Mcmullin, J.P.; Martin, R.N.; Peters, W. A search for variability in the HCN to H2CO Ratio on Comet Hale-Bopp. Earth Moon Planets 1997, 78, 53–61. [Google Scholar] [CrossRef]
  21. Hartogh, P. High-resolution chirp transform spectrometer for middle atmospheric microwave sounding. In Satellite Remote Sensing of Clouds & the Atmosphere II; International Society for Optics and Photonics: Lindua, Germany, 1998. [Google Scholar]
  22. Hartogh, P.; Fujisada, H. Present and future chirp transform spectrometers for microwave remote sensing. IEEE Trans. Microw. Theory Tech. 1997, 3221, 328–339. [Google Scholar]
  23. Paganini, L. Power Spectral Density Accuracy in Chirp Transform Spectrometers. Ph.D. Thesis, Albert Ludwig University, Freiburg, Germany, 2008. [Google Scholar]
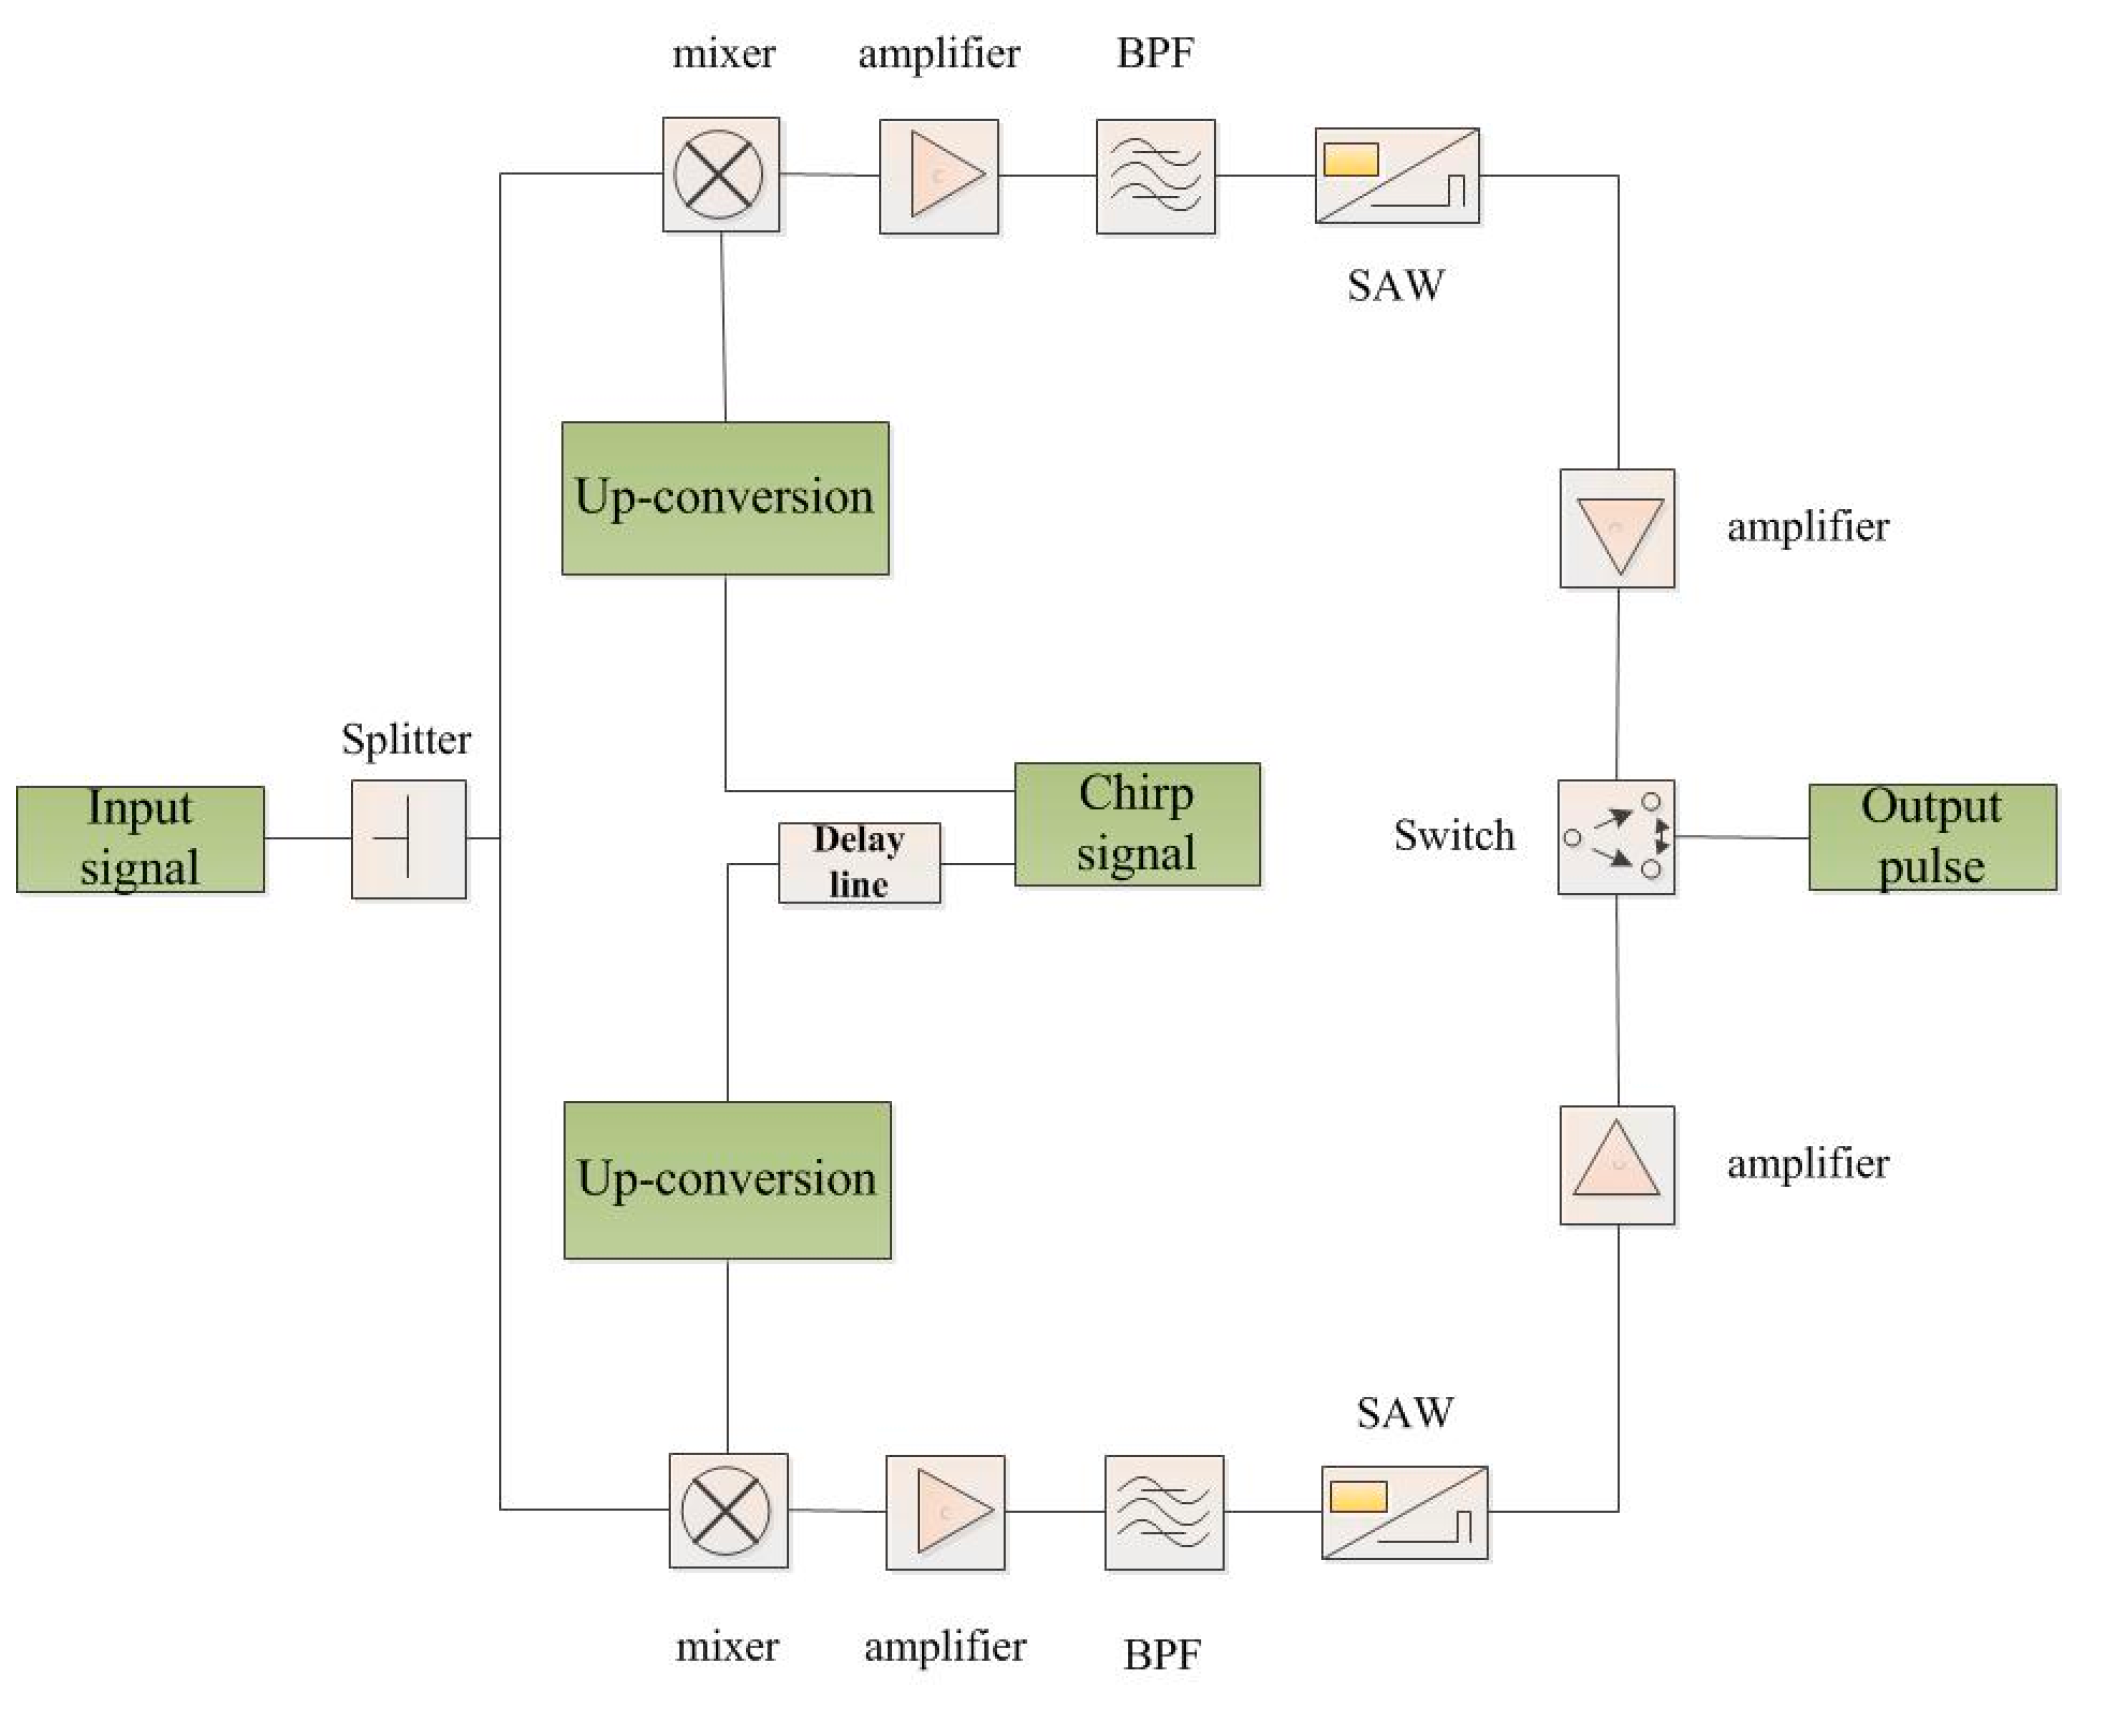
Figure 1. Schematic of classical two-channel M(l)-C(s) transform arrangements for the expander-compressor. BPF represents band-pass filter, SAW represents surface acoustic.
Applsci 11 00960 g001
Figure 2. Simplified structure of the CTS system with the LPSA algorithm for fast pulse compression.
Applsci 11 00960 g002
Figure 3. The output pulse of the single input frequency of 6.4 GHz based on CTS system. Frequency resolution of the output pulses using the classical time-domain pulse compression method (a) and the LPSA algorithm (b).
Applsci 11 00960 g003
Figure 4. Frequency resolution of the output pulses using the classical time-domain pulse compression method (a) and the LPSA algorithm (b).
Applsci 11 00960 g004
Figure 5. Output pulses calculated from five input frequencies. (a) is the result calculated by the classical time-domain pulse compression method. (b) is the result obtained by the novel LPSA method.
Applsci 11 00960 g005
Figure 6. Output results of 11 input frequencies calculated by the classical time-domain pulse compression method (a) and the novel LPSA algorithm (b).
Applsci 11 00960 g006
Figure 7. The measured amplitude accuracy with different number of orthogonal sampling points at different sampling rates.
Applsci 11 00960 g007
Figure 8. Experimental verification of the novel LPSA algorithm for pulse compression. Output IF chirp signals from the band-pass filter were first sampled and stored by a 2 G bandwidth DPO and then compressed by the classical time-domain pulse compression method and the LPSA algorithm in Matlab.
Applsci 11 00960 g008
Figure 9. Experiment results with four input frequencies calculated by the classical time-domain pulse compression method (a) and the LPSA algorithm (b) at 8 G sampling rate.
Applsci 11 00960 g009
Figure 10. Experiment results with four input frequencies compressed by the SAW filter.
Applsci 11 00960 g010
Figure 11. Frequency resolutions obtained by the LPSA algorithm and the classical time-domain pulse compression method.
Applsci 11 00960 g011
Table 1. Classical time-domain pulse compression method versus the LPSA method.
MethodClassical Time-Domain Pulse CompressionLinear Phase Sampling and Accumulation
sampling rate>2 GHz8 GHz
amplitude accuracy>99%>98%
frequency resolution101.6 kHz99.8 kHz
multiplication 8 × 10 8 633
addition 8 × 10 8 5.606 × 10 5
Publisher’s Note: MDPI stays neutral with regard to jurisdictional claims in published maps and institutional affiliations.