1. Introduction
Natural caves constitute an important part of our natural heritage. Those that include art representations are a fundamental part of our historical heritage and all of them are, or can become, an excellent tourist resource as well as an excellent living laboratory to understand their behavior in different situations. Smart documentation, which collects enough significant complex data, is key to the conservation of any type of heritage to be passed on to future generations.
Many factors can potentially affect rock art and its preservation. First, geological and geomorphological risks could lead to gravitational events such as landslides and collapses. Environmental risks directly affect the decorated panels and its parietal support as a result of exchange of energy with the exterior and can provoke erosion and fragmentation of the support. Water flowing can generate chemical weathering, washing processes or speleothem reconstruction over the walls that can cover the representations. Biological hazards, like bacteria, fungi, lichens, and algae, can alter the delicate balance of these ecosystems whose response to human action is often unpredictable. [
1].
The importance given, within speleology, to geomatics (although traditionally given only to topography), is that any study subsequent to the discovery of a cave needs a map of the cave on which to base the study. Hence, the topographic survey is one of the first tasks to be carried out. The geomatics sciences of terrain representation are the first auxiliary techniques of speleology, since they are the fundamental basis on which all subsequent information of any multidisciplinary study is integrated. This is the reason why it is very important to have a good cartographic base that allows turning over any study carried out, and to turn over any future information that allows monitoring these living elements.
The reproduction of rock art has been a recurring theme since the end of the 19th century. For over a century, casts and photographs have been the main tool for demonstrating the existence of rock art, for facilitating its study, management, and dissemination, or for analyzing and evaluating its state of conservation. In the last few years, systems have evolved and digital tools, such as virtual reality [
2], are used for tourist exploitation.
Today, the emergence of digital technologies has made a wide range of tools and software available to the community to obtain more exhaustive documentation in both 2D and 3D. The exhaustive, comprehensive and non-invasive documentation of rock art sets is an indispensable requirement to carry out continuous monitoring of the processes of degradation and alteration of these sets and to guarantee the survival of this heritage. Any aspect of rock art research requires, as a starting point, the obtaining of objective graphic documentation that allows the exhaustive studying of motifs, themes, and the patterns of composition, addition and superimposition [
3], etc.
This work implements a methodology that offers a global, comprehensive, synoptic and, if required, repetitive vision of rock art. It consists of a non-destructive observation that can be carried out at different scales in a homogeneous way, making it possible to obtain information about non-visible regions of the electromagnetic spectrum. It has been produced in the context of doctoral activities [
3,
4] and can be applied to any rock art panel or any industrial or cultural heritage with similar characteristics.
Hyperspectral remote sensing and its methods are continuously growing and new applications and analyses [
5] are appearing. The technique has been used for documenting paintings [
6], murals [
7], pigments [
8], and geologic composition [
9]. It presents some advantages [
10] and can be used in some new possible scenarios [
11]. Hyperspectral images are non-destructive and contactless, which makes it possible to use them in the study of artefacts [
12] and general conservation [
13]. However, its use in rock art [
14], and in industrial objects [
15], has been unusual until recently.
Rock art panels are composed of layers that present differences in chemical composition (organic matter and iron or manganese oxide), color, texture (particle size distribution), moisture content, roughness and structure (particle distribution). Generally, in remote sensing the most important layer is the one that is seen, that is, the most superficial, but it is essential to know also the properties of the deeper layers, especially when such ancient artistic expressions are latent in them, and this is the reason why hyperspectral remote sensing has great potential for this type of application.
The main objective of this study is to improve visualization, to generate pigment maps and to generate information that will help understand the process of creation and the risks faced by the motifs included in each panel.
2. Materials and Methods
2.1. Study Area
The study area is the Cave of El Castillo which was declared a World Heritage Site by the United Nations Educational, Scientific and Cultural Organization (UNESCO) in 2008. The cave is located in Puente Viesgo, Cantabria, Spain (
Figure 1). Throughout its extension, this cavern contains a large number of animal figures, such as aurochs, goats, deer, hinds, reindeers, horses, etc.
The panel was first studied by Alcalde del Río, Breuil and Sierra [
16] in 1911, and researchers have revisited and implemented different techniques in the last century to study it, such as direct tracing, drawings, analogue photography and traditional digital images [
17,
18,
19,
20,
21].
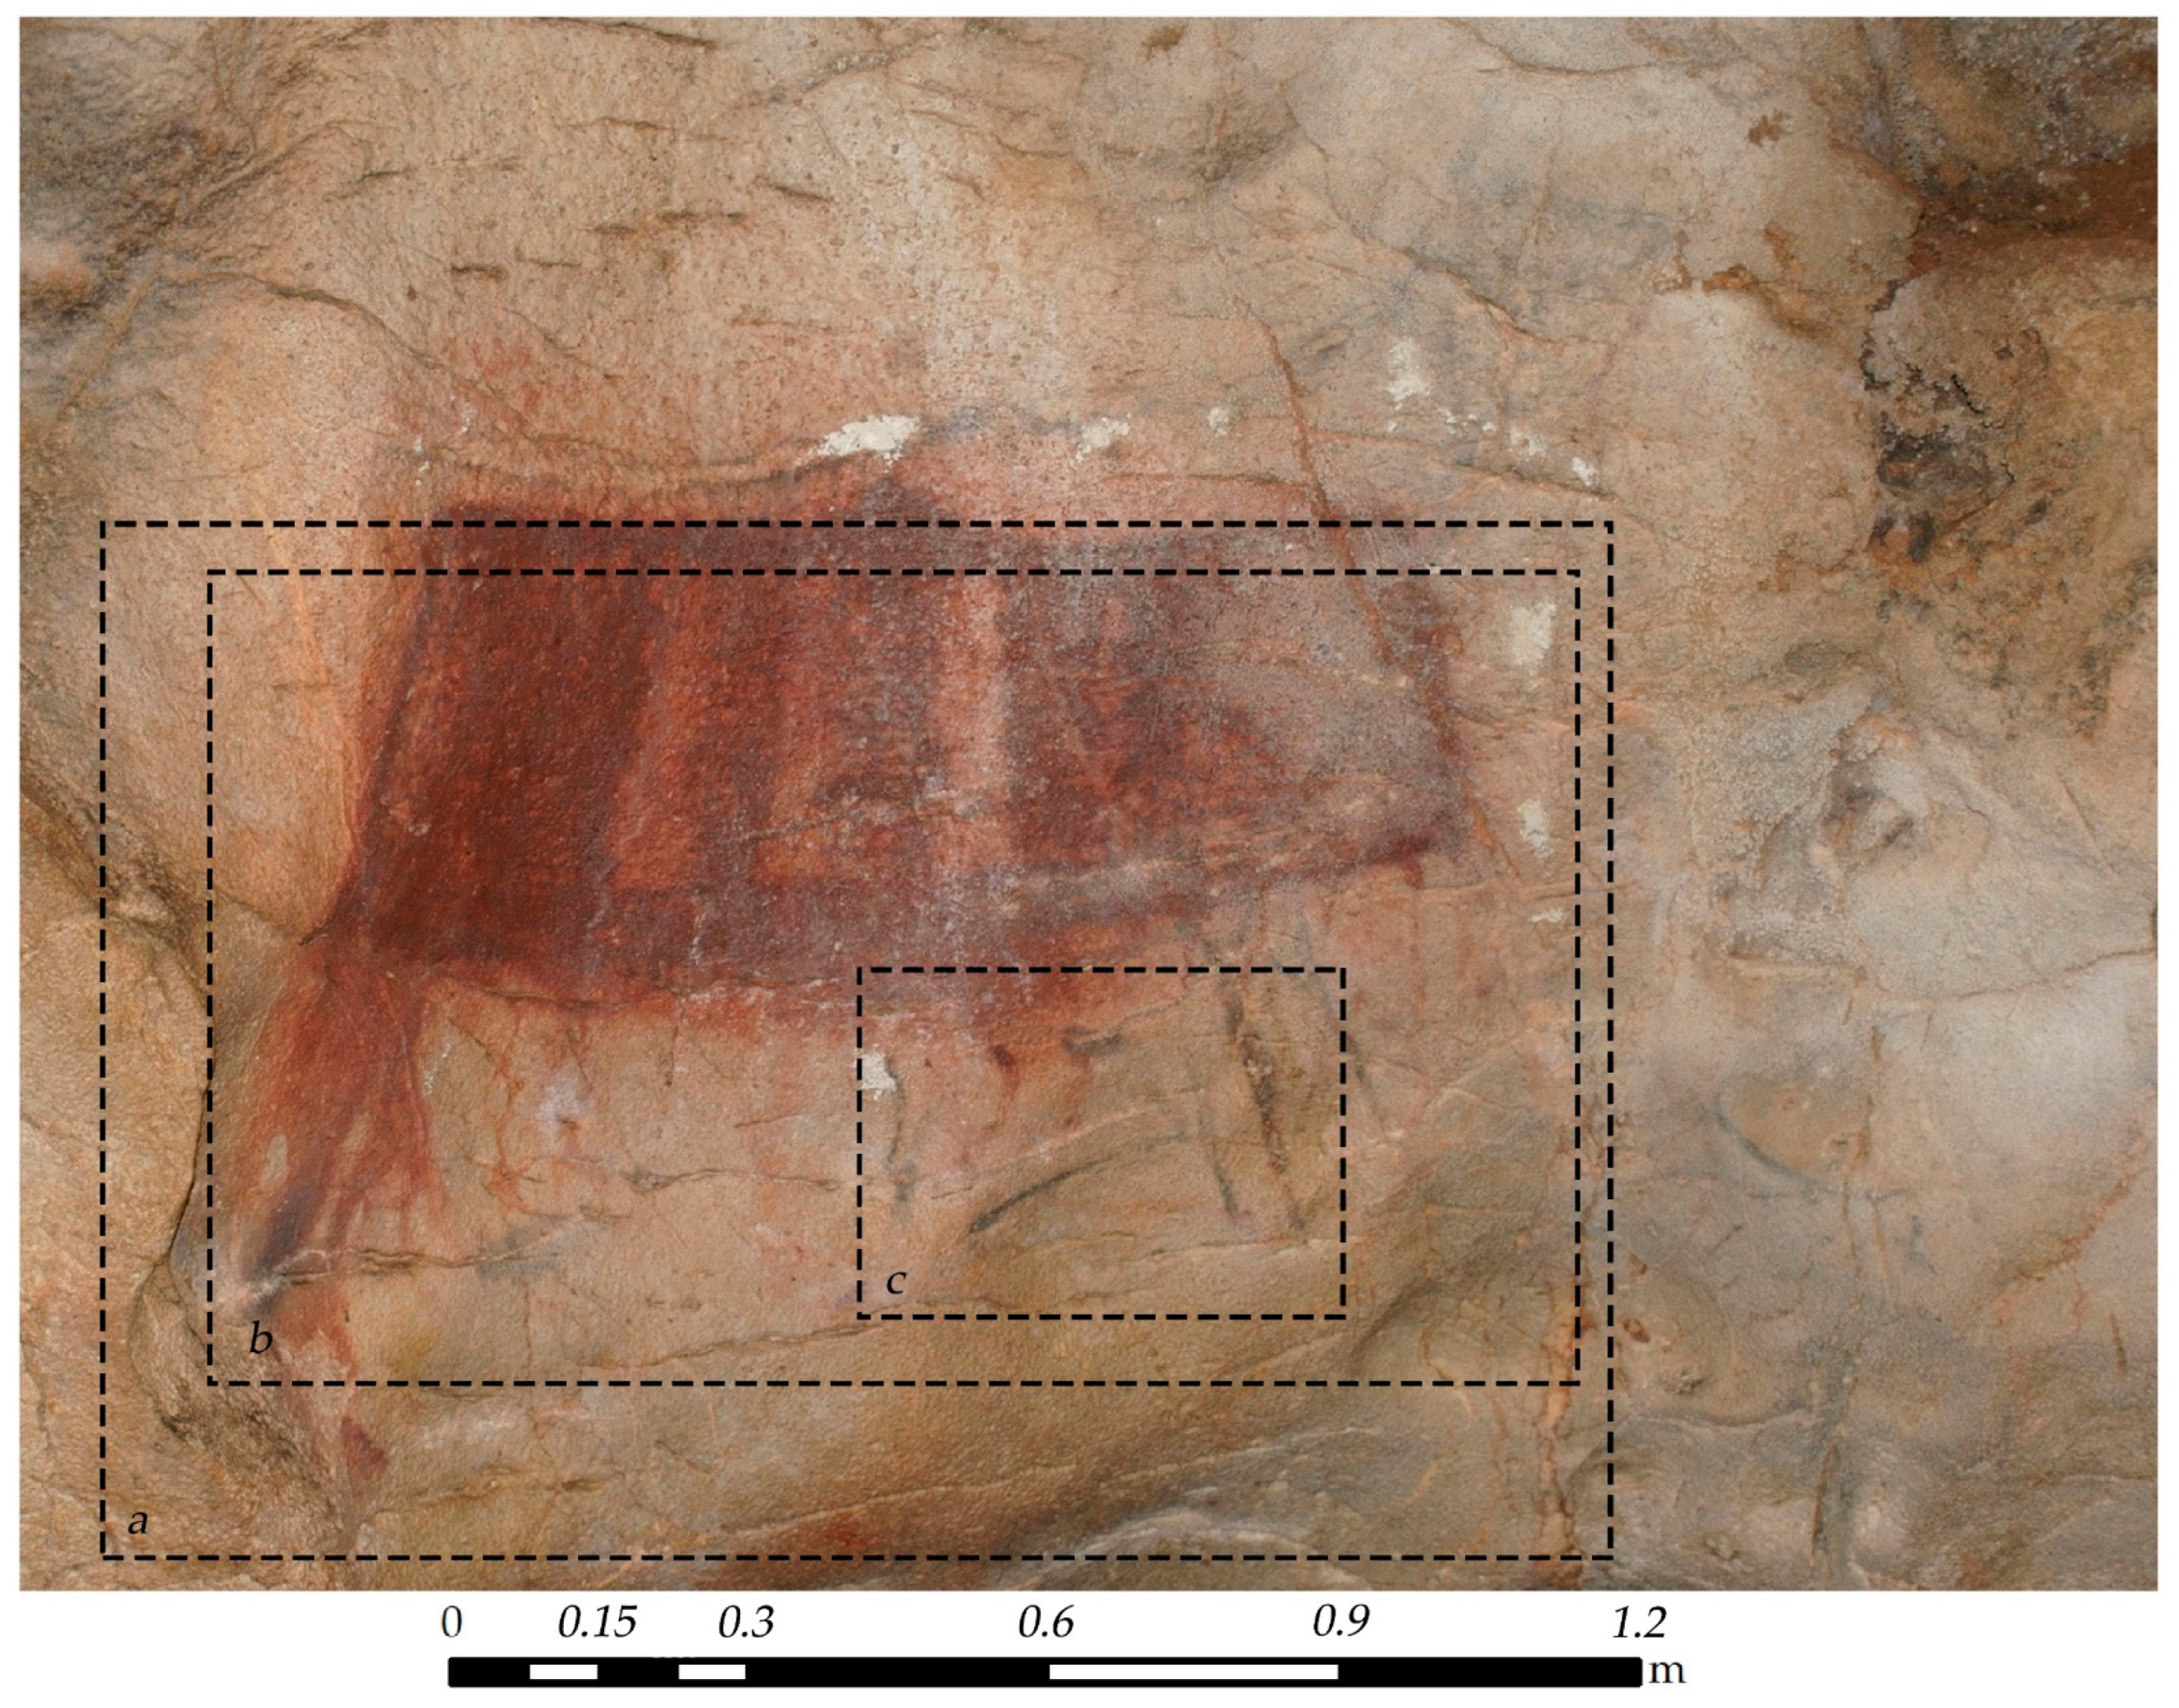
It is located in the narrow passage that connects the second and third rooms of the cave, on the wall opposite the so-called sorcerer of El Castillo. Its dimensions are 1.30 meters long by 1.20 meters wide, in which a more or less rectangular shape or ideomorph of a thick and intense red color stands out (
Figure 2).
As will be shown, hyperspectral remote sensing can help not only to better identify figures, analyze superimpositions and isolate pigment signals [
3,
4]
The first study carried out on the panel [
16] identified one symbol. The use of hyperspectral technology has allowed documenting one ideomorph, two hinds, one bison, one reindeer, and one headless quadruped.
2.2. Overall Workflow
The overall workflow of the proposed method is shown in
Figure 3. It basically consists of three parts. The first part deals with the rigorous georeferencing of the data in order to convert hyperspectral data into spatial data; the second part deals with data acquisition and pre-processing to obtain calibrated hyperspectral data. Both parts allow us to create what is known as a georeferenced 3D calibrated hyperspectral model; from this model, data analysis and visualization are carried out to obtain both cartography and false color compositions that improve visualization.
The field work for data acquisition took place in 2018. The sensor used to record data was VNIR Specim V10E (Specim Spectral Imaging Ltd., Oulu, Finland) and, as described in
Figure 4, raw data was converted to reflectance and then georeferenced and 3D ortho-corrected.
Once the georeferenced 3D calibrated hyperspectral model is obtained, a process of classification generates a pigment cartography. An image enhancement process was used in parallel to obtain false color compositions, which were used in the technical process description and pigment interpretation.
2.3. Georeferencing
Georeferencing is the technique of assigning geographic coordinates to an object, which is used in any mapping procedure and in the development of digital cartographic databases. By georeferencing, the position of a given point on the Earth’s surface is precisely located. Rock art needs absolute georeferencing to guarantee spatial coherence of the data in a time series, which might be acquired in the future to follow up its condition.
Every measurement contains error: no measurement is ever exact and must be rigorously adjusted, with the results undergoing statistical analysis. In the field of geomatics, the integration of global navigation satellite systems (GNSS), topographic total station (TTS), 3D terrestrial laser scanner (3DTLS), digital metric cameras, and hyperspectral imaging systems allow an accurate, reliable and rapid recording of information. This information can be integrated into a Geographic Information System (GIS) which can be used extensively for management, planning or decision making [
22].
Accurate georeferencing allows layers of information to be superimposed and analyzed in conjunction over time [
23] thanks to the creation of a common reference frame.
A reference frame is the practical realization of a system; it is the materialization of a reference system, i.e., the set of points and their coordinates and the techniques applied in the measurements and methods used. To create an accurate reference frame within the cave, this work combines different geomatics methods [
24]. Error propagation makes it possible to calculate the accuracy of the elements in the interior of a cave. The workflow followed is:
GNSS: Outside the cave, the reference frame is created with visible basis among them which was measured with a Topcon Hiper SR GNSS (Topcon Corporation, Tokyo, Japan) connected to the active network of GNSS stations in Cantabria to receive corrections via NTRIP protocol (Networked Transport of RTCM via Internet Protocol). The result is a set of four coordinates, accurate to the last centimeter.
Microgeodetic Network: The GNSS coordinates are used to create a complex network [
25,
26]. This is carried out to guarantee the quality of the different works carried out, as described by Bjerhammar [
27]. First, a free network is adjusted that is later attached to the reference frame, obtaining a set of coordinates that constitute the Reference Frame of the site. The coordinate system was ETRS 1989 UTM Zone 30N—EPSG: 25830. A Topcon GPT-7503 (Topcon Corporation, Tokyo, Japan) total station was used. Its angular accuracy is 3” and measurement accuracy is ± (2 mm + 2 ppm × Distance) mean squared error.
Traverse/Radiation: The microgeodetic network was adjusted outside the cave. To have accurate coordinates inside the cave, a closed traverse there and back was observed, and later adjusted and compensated (
Figure 5). The bases were materialized by means of steel nails and from them a series of new bases and targets were radiated with a TTS. These were used as references for 3D laser scanning.
3DTLS: A FARO system model X-130 (FARO Technologies, Florida, USA) [
28] was used to scan the cave. The accuracy of a single point is 2 mm at 25 m with a reflectance of 85%. Around 87% of data was measured at less than 4.5 m. Once the data was adjusted, a subsampling method was used to obtain a homogeneous point cloud that will constitute the basis of the ground control/check points that will later be used in photogrammetry. Tensions regarding correspondences between scan points concluded that 81% of the points were below 3 mm.
Photogrammetry: The panels were digitized with a resolution of more than 50 microns. The ground control points were taken from the point cloud and a standard photogrammetric process as described in [
29]. The photogrammetric equipment included a set of Sony A7R Mark II (Sony Corporation, Tokyo, Japan) cameras with 90 mm macro fixed-focal length objective, exposure control procedure and working distance below 1 m. Each picture had a surface of 0.3976 × 0.2652 m
2. This 3D model is used to re-project hyperspectral data to it, remove the conical perspective of data and be able to project data and results orthogonally.
2.4. Data Acquisition and Pre-Processing
2.4.1. Hyperspectral Imaging System
The spectral camera is the combination of the Specim V10E spectrograph with a monochrome sCMOS camera (CL-30). This generates a hyperspectral image that allows solving colorimetric applications in both scientific and industrial applications (
Figure 2).
Specim V10E is a spectrographic system that, combined with a monochrome camera, becomes a hyperspectral camera covering a spectral range of 400–1000 nm. It reads a line from the sample and decomposes the spectrum information of that line into a 2D image, composed of spectral information on the Y-axis and spatial information on the X-axis. 214 spectral bands were recorded and the spectral resolution was 5.6 nm.
2.4.2. Illumination Sources
Caves in general are places with very stable conditions. The cave of El Castillo has an average temperature of 13.78 °C and total absence of light. This means illuminating the panels was necessary, following the recommendations of the International Council of Museums (ICOM) [
30].
For this purpose, four Philips TL5 tubular fluorescent visible lamps supported with infrared and ultraviolet light-emitting diode (LED) lights were used. A FieldSpec Pro FR spectroradiometer (Analytical Spectral Devices, Inc., Colorado, USA) was used to record the spectral signature of lights in the range of 350–1050 nm (
Figure 6).
2.4.3. Pre-Processing
- (a)
Reflectance Calibration
Prior to image acquisition, dark (
D) and white references (
W) were measured to calculate the calibrated reflectance values (
I) of raw sample images (
I0), using the following formula:
- (b)
Geometric Correction
The hyperspectral reflectance image was georeferenced and ortho-corrected by using the georeferenced 3D model obtained from photogrammetry. This process makes it possible to compare the information collected. To cover the working area, there were collected two hyperspectral tracks whose pixel size was set to 500 microns, and the area covered was approximately 0.6 × 1.25 m; that is, 0,75 m2 in a 1312 × 2500 image. The process was run in Meshlab and the mean reprojection error of the adjustment was 312 microns.
2.5. Pigment Analysis
The processes that have been integrated can be divided into two families:
Pigment analysis techniques, whose end is to create a cartographic representation of pigment by classifying calibrated data and generating thematic information. These techniques produce “fully interpreted” information.
Enhanced visualization techniques, whose end is to be able to create false color compositions to enhance paintings that can hardly be appreciated with the naked eye. These techniques produce “fully uninterpreted” information.
The main difference between both techniques is the result; while the output of enhanced visualization technique is images, pigment analysis is a classified pixel.
2.5.1. Minimum Noise Fraction Transformation
The original data had 214 spectral bands; the minimum noise fraction (MNF) transformation determines the dimensionality of the image, segregates the noise from the data and reduces the hardware requirements inherent in the process [
31]. It also determines spatial coherence in the eigenimages and defines the cut-off between “signal” and “noise”, allowing specific and precise analyses. It produces orthogonal bands ordered by their information content, which implies it is also used to eliminate noise.
2.5.2. Pixel Purity Index
The pixel purity index (PPI) aims to locate the purest spectral points of the hyperspectral image. To do this, the method is based on the assumption that the most extreme points in the scatter plots are the best candidates to be used as endmembers. This model offers satisfactory results when the components that reside at a sub-pixel level appear spatially separated. In this situation, the absorption and reflection phenomena of incident electromagnetic radiation can be characterized following a strictly linear pattern.
The algorithm [
32] proceeds by generating a large number of random N-dimensional vectors called “skewers”. Each point of the image is projected onto each skewer and the points corresponding to the ends in the direction of a skewer are identified and stored in a list. As the number of skewers increases, the list also grows, and the number of times a given pixel is stored in the list also increases. Pixels with largest increments are considered to be the final endmembers.
2.5.3. n-D Display
It is used to locate, identify and group the purest pixels and the most extreme spectral responses in a data set. The n-D viewer helps to visualize the shape of a data cloud resulting from the plotting of image data in spectral space (with image bands as raster axes). The maximum number of bands to be displayed was 54. Usually a spatial subset of minimum noise fraction (MNF) data using only the purest pixels determined from the pixel purity index (PPI) is used.
It is also used to check the separability of its classes when generating regions of interest (ROI) as input to supervised classifications.
2.5.4. Spectral Analysis
The sampling was carried out using Analytical Spectral Devices’ full resolution spectrometer. This spectrometer can obtain data 350–2500 nm, but it is important to note that the hyperspectral imaging system takes advantage only of data between 400 and 1000 nm. The spectral signatures used to train the system were obtained from existing panels in the cave to train the subsequent process of the mapping methods [
4]. Areas without calcitic concretion and biodeterioration were sampled in different areas with ochre pigment, black pigment, and rocky support.
2.5.5. Spectral Angle Mapper
The spectral angle mapper (SAM) is a fully automated method used to compare spectral signatures of the image with spectral libraries [
32]. For the SAM classification to be effective [
33], the image data needs to be converted to apparent reflection. The algorithm determines the similarity between the two spectral signatures by calculating the spectral angle between them, treating them as vector units in the spectral space with spectral dimensionality equal to the number of bands.
The evaluation was carried out empirically by selecting a sample of pixels from the thematic map obtained (classified image) and comparing the assigned class with the actual class determined from reference data, obtained in the field sampling. In this way, the percentage of pixels in each class that have been correctly classified can be estimated, as well as the proportion of errors due to confusion between the different classes.
2.5.6. Mixture Tuned Matched Filtering
Mixture-tuned matched filtering (MTMF) is a hybrid method based on both linear mixture theory and signal processing [
34]. MTMF results are presented as two sets of images, the infeasibility images and the matched filter images with values from 0 (no match and feasible) to 1 (perfect match and infeasible).
MTMF does not require the knowledge of all the endmembers due to the fact that it maximizes the response of a known endmember and suppresses the response of the composite unknown classes to match the known signatures [
35].
2.6. Visualization Improvement
Visualization enhancement methods are processed independently in order to create image transformations that decorrelate and rescale the noise in data (a process known as noise whitening) resulting in transformed data in which the noise has unit variance and there is no band-to-band correlation. Different methods have been applied in order to create the transformed images.
2.6.1. Decorrelation Adjustment
Traditionally, digital filters have been used to enhance images. The image analysis techniques used to enhance elements of interest in digital images can be divided into two types:
- -
Those that alter the radiometry of images by increasing their contrast, compressing or stretching the histogram of the images
- -
Those aimed at eliminating redundant data, or decorrelation of data, which are primarily based on Principal Component Analysis (PCA) [
36]. This analysis is very practical when dealing with several spectral intervals, since it allows reducing the dataset to a more manageable number, eliminating redundant information. It is applied to generic binary data.
Apart from these traditional decorrelation techniques, two decorrelation stretch techniques have been implemented [
37] that are recommended for applications on highly correlated multispectral images, called direct decorrelation stretch (DDS) and intensity conservation DDS (ICDDS). A technique called IHS substitution (IHSS) has also been implemented [
38]. Hyperspectral bands are usually highly correlated, so they cannot be displayed by independent contrast stretching in false color compositions as common RGB images due to the fact that the colors can appear undersaturated. To solve this problem, DDS increases color saturation by reducing the achromatic component of the RGB image. ICDDS preserves the original image intensity more than DDS
IHSS technique has been applied by making two RGB-IHS transformations. In this case, the hue is unaltered and the saturation of a pixel is inversely proportional to its intensity value due to the fact that the product of saturation and intensity values equals to a constant value. The level of degradation of chromatic information is important when implementing saturation stretching algorithms.
2.6.2. Principal Component Analysis
It is a statistical technique that transforms data from multivariate radiance bands, which are often highly correlated (i.e., visually and numerically similar). It is an image space transformation designed to eliminate this spectral redundancy. The PCA transform is optimal in the sense that, of all the possible transformations, we choose the particular matrix that diagonalizes the covariance matrix of the original multispectral image.
PCA is very practical when dealing with several spectral ranges [
39], since it allows reducing the dataset to a more manageable number, eliminating redundant information. The Karhuenen–Loeve [
40] transformation has been implemented in IDL language.
2.6.3. Minimum Noise Fraction Transformation
Minimum noise fraction transformation (MNF) was developed to increase the PCA’s inability to reliably separate signal and noise components in multispectral images. The MNF is a transformation which, instead of maximizing the variance of the data, maximizes the noise content of each component to obtain the maximum signal-to-noise ratio of each component when is reversed.
The MNF transformation allows the removal of noise from the image [
31], thus determining the actual size of the image, and reducing computational requirements. It is a linear transformation consisting of the following separate principal component analysis rotations:
- -
The first rotation uses the main components of the noise covariance matrix to decorrelate and rescale the noise in the data resulting in transformed data in which there is no band-to-band correlation.
- -
The second rotation uses the main components derived from the original image data after the noise of the first rotation has been whitened and rescaled by the standard deviation of the noise. Since there will be more spectral processing later, the inherent dimensionality of the data will be determined by examining the final eigenvalues and associated images.
2.6.4. Independent Component Analysis
ICA transformation is used as a tool for blind source separation. The fundamental objective of independent component analysis (ICA) is to provide a method for finding a linear representation of non-Gaussian data so that the components are statistically independent or as independent as possible [
41,
42]. Such representation makes it possible to obtain the fundamental structure of the data in many applications, including feature extraction and signal separation.
Compared to principal component analysis, ICA analysis offers some unique advantages:
- -
PCA is an orthogonal decomposition. It is based on the analysis of the covariance matrix, which is based on a Gaussian distribution assumption. ICA analysis is based on the assumption of non-Gaussian distribution from independent sources.
- -
PCA analysis uses only second-order statistics, while ICA analysis uses higher-order statistics. Higher order statistics are a more robust statistical assumption, revealing interesting features in generally non-Gaussian hyperspectral datasets.
If the characteristic of interest (such as an anomaly) occupies only a small part of all pixels, which makes the contribution to the entire image covariance matrix negligible; in ICA analysis, the characteristic of interest will be considered as the noise bands. In this method, the characteristics are distinguished from the noise bands.
3. Results and Discussion
The studied panel is quite complex since it is not in a very good state of preservation. Remains of red and black color, covered by a thin calcite layer, can be appreciated.
3.1. Working Area
This area is located in a place named the tunnel, on the left wall. There is a single small protrusion in what would be the roof. The motifs were made on limestone covered by a thin calcite layer. It consists of a tectiform or ideomorph of thick and intense red color, in a rectangular shape. The interior is very subdivided or compartmentalized. Around it there are some black pigment remains, among which no figure has been identified. The technical characterization tells us that this is a flat ink drawing, created using iron oxide. (
Figure 7)
Once the workflow is applied, some conclusions can be obtained:
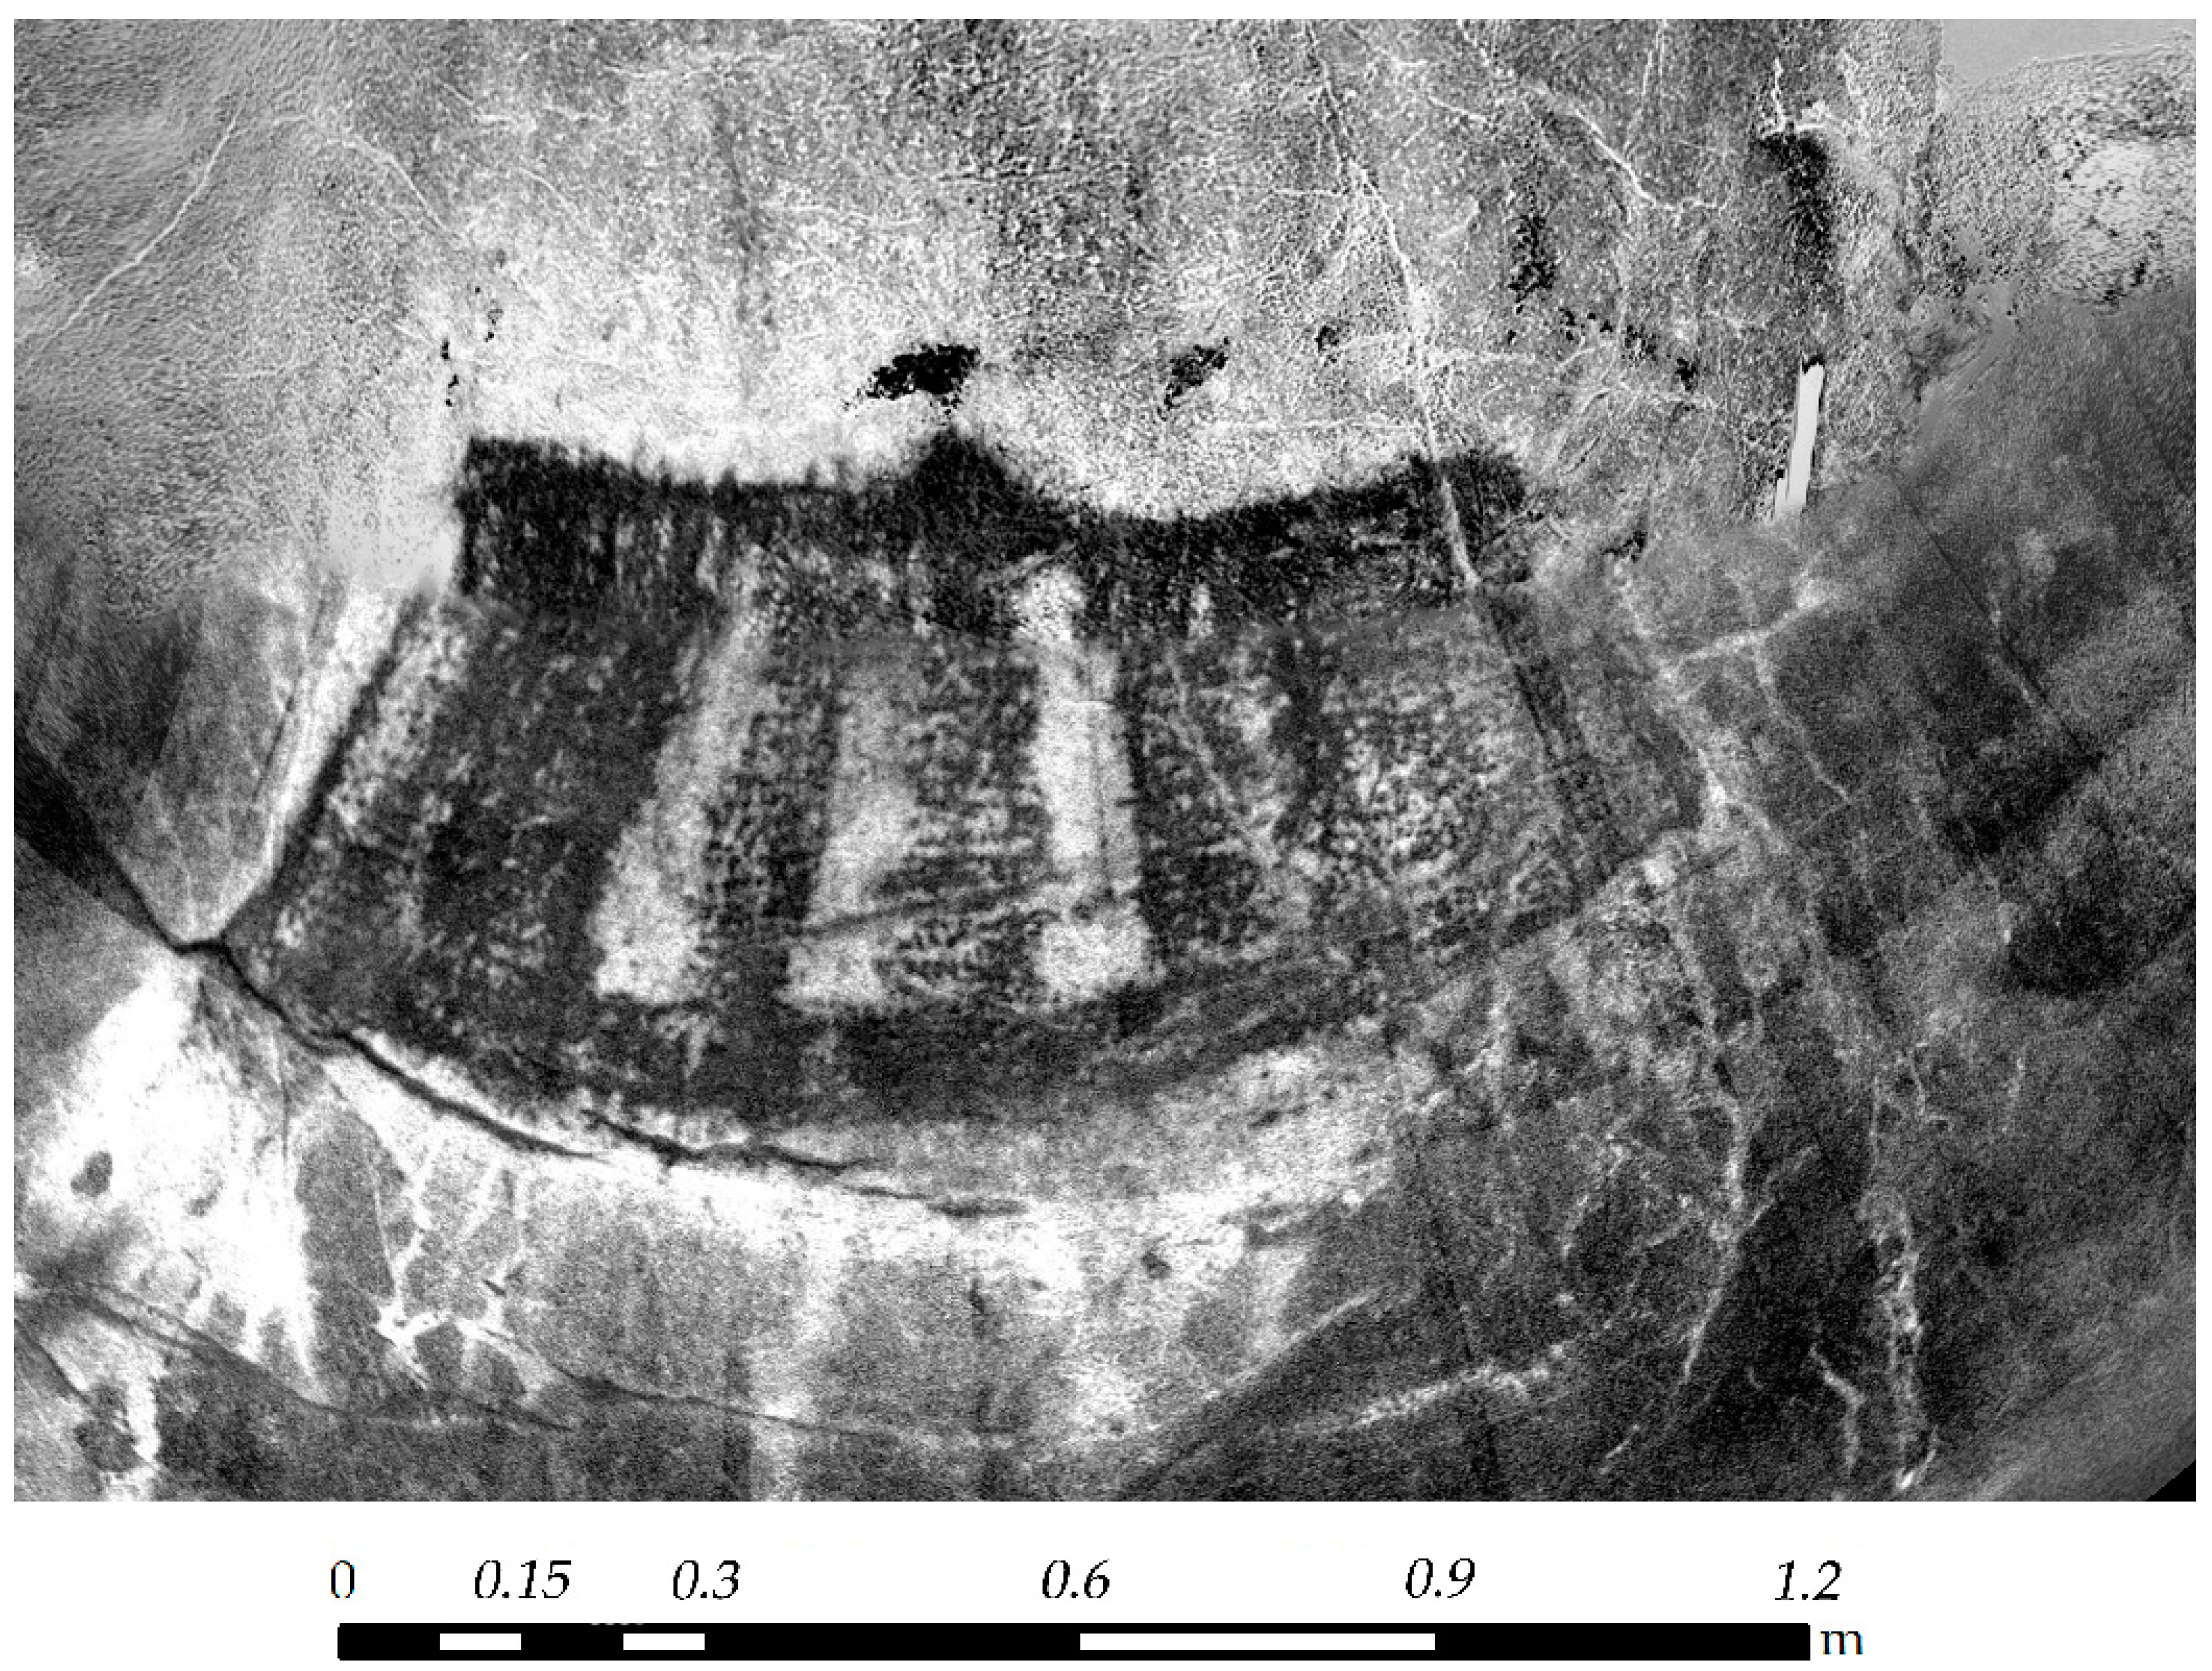
Classified data has been isolated and used to create the final tracing (
Figure 11). After the assignment phase of the classification, the reliability of the results obtained must be assessed. This will give us an idea of the level of confidence we can have in the classification and check whether the objectives of the analysis have been met.
The overall reliability of the classification was obtained by dividing the sum of the main diagonal by the total number of pixels. In the present paper, a comparison of the overall accuracy results shows that SAM classification performed the best with 89.075% (
Table 1) overall classification accuracy, compared to 83.71% of the MTMF approach, so it was decided to keep the first results. The worst results occur in the class corresponding to thin calcite, as it is sometimes confused with the elements that underlie it.
In our case, a comparison of the overall accuracy results shows that SAM classification performed the best with 75.00% overall classification accuracy, compared to 60.71% of the MTMF approach.
3.2. Comparison with the Known
The only documentation of the present motif is that made by Breuil [
15] (
Figure 12). Around it there are some black remains, among which some researchers such as E. Ripoll [
16] could not identify any figure. It is also a rectangular shape, but apparently does not have the upper appendix. According to Professor Ripoll, this ideomorphic figure is apparently painted on a previous figure, since in the lower right part of it we can see some black painted legs of a quadruped arranged towards the left.
With the application of the proposed hyperspectral methodology, we have been able to verify that the techtiform described by Breuil is correct, but there are a good number of figures that have been subordinated and superimposed on it.
We can clearly distinguish the legs that Ripoll already intuited, but in reality, there is a large, almost complete hind figure (
Figure 11), of great size, oriented to the right and painted in black. The raised head with the ears can be clearly seen. The neck must have been filled with flat black ink and the line of the back extends below the keycap up to the rump and legs. The hands and the chest are visible to the eye, bordering on the right side of the sign.
But on the lower part of the ideomorph, there are other lines that do not correspond to the deer. From left to right we can see a small bison head painted in red ochre and facing left. On the belly of the large deer, a quadruped with head or covered by the red sign can be seen, which has a high density of pigment in this area. We can see the hindquarters and both the back line and the ventral line perfectly painted in black.
Just below the previous representation we see a large, very elongated hind head, also painted in black and facing right. One ear stands out clearly.
On the right, in a slightly lower position, we see the front part of a large reindeer figure painted in black and facing right. The taxonomic attribution is made on the basis of the beard and the horns which are clearly distinguishable.
In this panel all the figures painted in black are framed in Phase 3 (Gravettian) while the large sign is from Phase 8 (final Magdalenian) and the red bison we classify in Phase 6 (lower Magdalenian) of the chrono-chromatic stratigraphy of the cave of El Castillo [
20].
Apparently, this ideomorphic figure is painted on a previous figure since on the lower right side of it there are some black painted legs of a quadruped arranged towards the left (
Figure 11). In the interior of the techtiform we have discovered a deer head facing right. Hyperspectral analysis has clearly shown that it is in a roaring attitude, with its head raised and its mouth open (in black). In addition, other figures have appeared, such as the head of a doe facing left, a reindeer, and a bison head, among others (
Figure 13).
The traditional drawing of the panel [
15] is shown in
Figure 12. If we compare it with the result of the SAM classification displayed in
Figure 13, the ochre pigments of the ideomorph symbol are shown in pink and, in blue tones, the dark pigments corresponding to other animals.
Traditionally [
15], only one symbol was known, but using hyperspectral technology, one ideomorph, two hinds, one bison, one reindeer, and one headless quadruped have now been documented [
3].
4. Conclusions
The presented methodology allows us to extend our knowledge of rock art and its documentation. The cave has been studied by different researchers who used different techniques throughout history since it was discovered in 1903. The reviewing of the rock art panels has produced an increase of six motifs where, previously, only one had been documented.
Nowadays, recording methodologies involving rock art have to be non-intrusive to prevent the panels from being damaged when the data is recorded. The present research shows that integrating geomatics methods is key to reaching an accurate, global, comprehensive and synoptic vision of rock art, and it guarantees it can be repeated over time. It makes it possible to obtain information about non-visible regions of the electromagnetic spectrum. The proposed workflow makes the documentation process more sustainable for the cave, because it reduces the time spent inside it, and it avoids the use of targets, increasing the accuracy of control points by up to 2 mm; and, what is more important still, it is possible to have them throughout the panel, thus improving the robustness of the model.
Most figures located inside cavities are subject to natural and artificial processes that cause the loss of coloring matter or the erosion of engraved surfaces, so the motifs can often be read with little definition. Applying the present methodology has made it possible to precisely define the original morphology of some painted motifs in different colours (and probably of different chemical composition). It is possible to accurately define the contours of the figures, to precisely recognize anatomical parts or areas of specific figures and, to obtain images that represent a highly reliable reconstruction of the original painting. In this way, figures difficult to see can be “reconstructed” and, thus, allow precise formal studies, or even serve as an efficient support for the production of facsimiles.
In this case study, four topics of interest were presented: (a) Recognition of figures, (b) characterization of the coloring matters, (c) study of the state of conservation, and (d) analysis of the technical process.
The results show it is possible to clearly differentiate mineralogical compositions, and coloring matter; something that is of great importance and must be studied in depth in the future.
The main tool provided by hyperspectral data is the possibility of documenting the conservation of a motif, discriminating veiled areas, leached areas, flaking and any other taphonomic action to which the figure is subjected. They can deteriorate the coloring matter, hindering the interpretation of the motifs due to the decrease in signal strength. It has also been possible to accurately reveal the morphology of motifs, painted in different colors (and, therefore, using different chemical compositions), being possible to create cartography of each figure and the conservation problems associated with them.
In rock art studies, usually conditioned by the state of conservation of the figures, reading superimpositions between strokes or figures is one of the fundamental problems. The method presented has made it possible to recognize overlaps of different pigments even below the calcite layer. PPI analysis and SAM classifications have permitted to obtain a map with fully interpreted classified information where each pixel has been assigned a thematic value. This makes it possible to read the line composition of motifs, allowing us to reconstruct the overlaying of lines in relation to the coloring matter.
The presented methodology can generate rigorous documentation regarding the conservation of a motif, and the mapping of veiled and leached areas to create a reliable thematic cartography. It can therefore be concluded that hyperspectral remote sensing has a high potential in rock art applications when technical analysis, management and conservation of cultural heritage studies are performed.
Author Contributions
Conceptualization: V.B. and S.R.; methodology: V.B. and E.C.; software: V.B. and E.C.; validation: S.R., M.A.S.; formal analysis: M.A.S.; funding acquisition: V.B.; investigation: V.B., E.C., M.A.S., and S.R.; resources: V.B.; writing—original draft preparation: V.B. and E.C.; writing—review and editing: V.B. and S.R.; visualization: V.B. and S.R.; supervision: M.A.S. and S.R. All authors have read and agreed to the published version of the manuscript.
Funding
This research has received a grant co-financed by the European Regional Development Fund through the ERDF Operational Programme 2014-2020 of Cantabria through the INNOVA 2019 grant line. It was funded by the Department of Innovation, Industry, Tourism, and Trade of the Regional Government of Cantabria in the context of aid to encourage industrial research and innovation in companies, project “Tecnología HIPERespectral para la caracterización y seguimiento del biodeterioro en el HIPOgeo (HIPER-HIPO),” grant number 2019/INN/70. This publication was funded with resources from Industrial Heritage Group of the Spanish National Distance-Learning University (UNED) and the Postgraduate and Professional Development Program “Analysis, Management and Projects in Industrial Heritage” (Análisis, Gestión y Proyectos en Patrimonio Industrial), which is taught at UNED.
Institutional Review Board Statement
Not applicable.
Informed Consent Statement
Not applicable.
Data Availability Statement
Not applicable.
Acknowledgments
This paper was produced within the scope of doctoral activities carried out by the lead author at the International Doctorate School of the Spanish National Distance-Learning University (Escuela Internacional de Doctorado de la Universidad Nacional de Educación a Distancia; EIDUNED). The authors are grateful for the support provided by this institution. The authors of this work would also like to thank the GIM Geomatics company for its support of the project and R. Ontañón for their advice.
Conflicts of Interest
The authors declare no conflict of interest.
References
- Ontañon, R.; Bayarri, V.; Herrera, J.; Gutierrez, R. The conservation of prehistoric caves in Cantabria, Spain. In The Conservation of Subterranean Cultural Heritage; CRC Press/Balkema: Boca Raton, FL, USA; Taylor & Francis Group: London, UK, 2014; ISBN 978-1-138-02694-0. [Google Scholar]
- Barrera, S.; Otaola, A.; Bayarri-Cayón, V. Explotación Turística no Intrusita de la Cueva de Santimamiñe (Vizcaya) Mediante Realidad Virtual. II Congreso Español de Cuevas Turísticas; Asociación de Cuevas Turísticas Española: Madrid, Spain, 2009; pp. 359–371. [Google Scholar]
- Bayarri, V. Algoritmos de Análisis de Imágenes Multiespectrales e Hiperespectrales para la Documentación e Interpretación del Arte Rupestre. Ph.D. Thesis, Universidad Nacional de Educación a Distancia, Madrid, Spain, May 2020. Available online: http://e-spacio.uned.es/fez/view/tesisuned:ED-Pg-TecInd-Vbayarri (accessed on 25 January 2021).
- Bayarri, V.; Sebastián, M.A.; Ripoll, S. Hyperspectral Imaging Techniques for the Study, Conservation and Management of Rock Art. Appl. Sci. 2019, 9, 5011. [Google Scholar] [CrossRef]
- Ghamisi, P.; Yokoya, N.; Li, J.; Li, W.; Liu, S.; Plaza, J.; Rasti, B.; Plaza, A. Advances in Hyperspectral Image and Signal Processing: A Comprehensive Overview of the State of the Art. IEEE Geosci. Remote Sens. Mag. 2018, 5, 34–78. [Google Scholar] [CrossRef]
- Laureti, S.; Malekmohammadi, H.; Rizwan, M.K.; Burrascano, P.; Sfarra, S.; Mostacci, M.; Ricci, M. Looking Through Paintings by Combining Hyper-Spectral Imaging and Pulse-Compression Thermography. Sensors 2019, 19, 4335. [Google Scholar] [CrossRef] [PubMed]
- Hou, M.; Cao, N.; Tan, L.; Lyu, S.; Zhou, P.; Xu, C. Extraction of Hidden Information under Sootiness on Murals Based on Hyperspectral Image Enhancement Applied Sciences. Appl. Sci. 2019, 9, 3591. [Google Scholar] [CrossRef]
- Liu, Y.; Lyu, S.; Hou, M.; Gao, Z.; Wang, W.; Zhou, X. A Novel Spectral Matching Approach for Pigment: Spectral Subsection Identification Considering Ion Absorption Characteristics. Remote Sens. 2020, 12, 3415. [Google Scholar] [CrossRef]
- Goetz, A.F.H. Spectroscopic remote sensing for geological applications. Imaging Spectrosc. 1981, 268, 17–21. [Google Scholar]
- Zhang, B. Advancement of hyperspectral image processing and information extraction. J. Remote Sens. 2016, 20, 1062–1090. [Google Scholar] [CrossRef]
- Picollo, M.; Cucci, C.; Casini, A.; Stefani, L. Hyper-Spectral Imaging Technique in the Cultural Heritage Field: New Possible Scenarios. Sensors 2020, 20, 2843. [Google Scholar] [CrossRef]
- Attas, M.; Cloutis, E.; Collins, C.; Goltz, D.; Majzels, C.; Mansfield, J.R.; Mantsch, H.H. Near-infrared spectroscopic imaging in art conservation: Investigation of drawing constituents. J. Cult. Herit. 2003, 4, 127–136. [Google Scholar] [CrossRef]
- Fischer, C.; Kakoulli, I. Multispectral and hyperspectral imaging technologies in conservation: Current research and potential applications. Stud. Conserv. 2013, 51, 3–16. [Google Scholar] [CrossRef]
- Bayarri, V.; Latova, J.; Castillo, E.; Lasheras, J.A.; De Las Heras, C.; Prada, A. Nueva documentación y estudio del arte empleando técnicas hiperespectrales en la Cueva de Altamira. ARKEOS|perspectivas em diálogo, nº 37. In XIX International Rock Art Conference IFRAO 2015. Symbols in the Landscape: Rock Art and Its Context. Conference Proceedings; Instituto Terra e Memória: Tomar, Portugal, 2015; ISBN 978-84-9852-463-5. [Google Scholar]
- Hauke, K.; Kehren, J.; Böhme, N.; Zimmer, S.; Geisler, T. In Situ Hyperspectral Raman Imaging: A New Method to Investigate Sintering Processes of Ceramic Material at High-temperature. Appl. Sci. 2019, 9, 1310. [Google Scholar] [CrossRef]
- Alcalde Del Río, H.; Breuil, H.; Sierra, L. Les Cavernes de la Région Cantabrique (Espagne); Impr. V A. Chêne: Monaco, 1911. [Google Scholar]
- Ripoll Perelló, E. Nota acerca de algunas nuevas figuras rupestres de las cuevas de EL Castillo y La Pasiega (Puente Viesgo, Santander). In Actas del IV Congreso Internacional de Ciencias Prehistóricas y Protohistóricas (Madrid 1954); Pan American Institute of Geography and History: Zaragoza, Spain, 1956; pp. 301–310. [Google Scholar]
- García-Guinea, M.A.; González-Echegaray, J. Nouvelles reprèsentations d´art rupestre dans la grotte del Castillo. Préhistoire Spéléologie Ariégoises 1966, XXI, 441–446. [Google Scholar]
- Echegaray, J.G.; Romanillo, J.A.M. Figuras rupestres inéditas de la Cueva del Castillo (Puente Viesgo). Boletín Semin. Estud. Arte Arqueol. 1970, 36, 441–446. [Google Scholar]
- Romanillo, J.A.M.; Sainz, C.G. Cronología del arte paleolítico cantábrico: Últimas aportaciones y estado actual de la cuestión. In Actas del 3er Congreso de Arqueología Peninsular; ADECAP: Vila Real, Portugal, 2000; Volume II, pp. 461–473. [Google Scholar]
- Ripoll, S.; Bayarri, V.; Muñoz, F.J.; Latova, J.; Gutiérrez, R.; Pecci, H. El arte rupestre de la cueva de El Castillo (Puente Viesgo, Cantabria): Unas reflexiones metodológicas y una propuesta cronológica. In Capítulo en Libro Cien Años de Arte Rupestre Paleolítico Centenario del Descubrimiento de la Cueva de la Peña de Candamo (1914–2014); Ediciones Universidad de Salamanca: Salamanca, Spain, 2014; ISBN 978-84-9012-480-2. [Google Scholar]
- Bayarri-Cayón, V.; Castillo, E. Caracterización geométrica de elementos complejos mediante la integración de diferentes técnicas geomáticas. Resultados obtenidos en diferentes cuevas de la Cornisa Cantábrica. In Proceedings of the VIII Semana Geomática Internacional, Barcelona, Spain, 3–5 March 2009. [Google Scholar]
- Bayarri-Cayón, V.; Castillo, E.; García-Moncó, J.M.; Calonge, J. Integration of traditional and innovative techniques to resolve a complex case: Monitoring the movement and temperature influence of the canvas in the south transept of the Church of the Convent of San Luis in San Vicente de la Barquera (Cantabria). In Built Heritage: Monitoring Conservation and Management; Politecnico di Milano, Centro per la Conservazione e Valorizzazione dei Beni Culturali: Milano, Italy, 2013; ISBN 978-88-908961-0-1. [Google Scholar]
- Ontañón, R.; Bayarri, V.; Castillo, E.; Montes, R.; Morlote, J.M.; Muñoz, E.; Palacio, E. New discoveries of pre-Magdalenian cave art in the central area of the Cantabrian region (Spain). J. Archaeol. Sci. Rep. 2019, 28, 102020. [Google Scholar] [CrossRef]
- Chueca, M.; Herráez, J.; Berné, J.L. Redes Topográficas y locales. In Microgeodesia; Editorial Paraninfo: Madrid, Spain, 1996. [Google Scholar]
- Chueca, M.; Anquela, A.B.; Baselga, S. Diseño de Redes y Control de Deformaciones. Los Problemas del Datum y Principal de Diseño; Editorial Universidad Politécnica de Valencia: Valencia, Spain, 2007. [Google Scholar]
- Bjerhammar, A. Theory of Errors and Generalized Matrix Inverse; Elsevier Science Ltd.: New York, NY, USA, 1973; ISBN 9780444409812. [Google Scholar]
- FARO. FARO Laser Scanner Focus 3D X 130 TEchnical Datasheet. Available online: https://faro.app.box.com/s/nn8swfhtez68lo88uhp6u8bchdfl1ay9/file/441669546444 (accessed on 11 November 2020).
- Bayarri-Cayón, V.; Latova, J.; Castillo, E.; Lasheras, J.A.; De Las Heras, C.; Prada, A. Nueva ortoimagen verdadera del Techo de Polícromos de la Cueva de Altamira, ARKEOS|perspectivas em diálogo, nº 37. In XIX International Rock Art Conference IFRAO 2015. Symbols in the Landscape: Rock Art and Its Context. Conference Proceedings; Instituto Terra e Memória: Tomar, Portugal, 2015; pp. 2308–2320. ISBN 978-84-9852-463-5. [Google Scholar]
- ICOM. ICOM Guidelines for Loans; International Council of Museums: Paris, France, 1994; Available online: https://icom.museum/wp-content/uploads/2018/07/Loans1974eng.pdf (accessed on 29 October 2020).
- Green, A.A.; Berman, M.; Switzer, P.; Craig, M.D. A transformation for ordering multispectral data in terms of image quality with implications for noise removal. IEEE Trans. Geosci. Remote Sens. 1988, 26, 65–74. [Google Scholar] [CrossRef]
- Boardman, J.W.; Kruse, F.A. Automated spectral analysis: A geological example using AVIRIS data, north Grapevine Mountains, Nevada. In Proceedings, ERIM Tenth Thematic Conference on Geologic Remote Sensing; Environmental Research Institute of Michigan: Ann Arbor, MI, USA, 1994; pp. I-407–I-418. [Google Scholar]
- Rashmi, S.; Swapna, A.; Venkat Ravikiran, S. Spectral Angle Mapper Algorithm for Remote Sensing Image Classification. Int. J. Innov. Sci. Eng. Technol. 2014, 1, 2348–7968. [Google Scholar]
- Boardman, J.W. Automated spectral unmixing of AVIRIS data using convex geometry concepts. In Summaries of the Fourth JPL Airborne Geoscience Workshop; JPL Publication 93-26; NASA: Washington, DC, USA, 1993; Volume 1, pp. 11–14. [Google Scholar]
- Harsanyi, J.C.; Chang, C.I. Hyperspectral image classification and dimensionality reduction: An orthogonal subspace projection approach. IEEE Trans. Geosci. Remote Sens. 1994, 32, 779–785. [Google Scholar] [CrossRef]
- Sabins, F.F., Jr. Remote Sensing Principles and Interpretation, 2nd ed.; W. H. Freeman and Co.: San Francisco, CA, USA, 1986; ISBN 9780716717935. [Google Scholar]
- Liu, J.G.; Moore, J.M. Direct Decorrelation Stretch Technique for RGB Colour Composition. Int. J. Remote Sens. 1996, 17, 1005–1018. [Google Scholar]
- Lu, H.-T.; Chang, C.-P.; Su, Y.; Chang, J.-C.; Tu, T.-M. A New Sight for Direct Decorrelation Stretch Techniques. J. C.C.I.T. 2008, 36, 1–7. [Google Scholar]
- Richards, J.A. Remote Sensing Digital Image Analysis: An Introduction; Springer: Berlin, Germany, 1999; p. 240. [Google Scholar]
- Loève, M. Probability Theory II, 4th ed.; Graduate Texts in Mathematics. 46; Springer: New York, NY, USA, 1978; ISBN 978-0-387-90262-3. [Google Scholar]
- Hyvärinen, A. Independent component analysis in the presence of gaussian noise by maximizing joint likelihood. Neurocomputing 1998, 22, 49–67. [Google Scholar] [CrossRef]
- Hyvärinen, A. Fast and robust fixed-point algorithms for independent component analysis. IEEE Trans. Neural Netw. 1999, 10, 626–634. [Google Scholar] [CrossRef] [PubMed]
| Publisher’s Note: MDPI stays neutral with regard to jurisdictional claims in published maps and institutional affiliations. |
© 2021 by the authors. Licensee MDPI, Basel, Switzerland. This article is an open access article distributed under the terms and conditions of the Creative Commons Attribution (CC BY) license (http://creativecommons.org/licenses/by/4.0/).


