Abstract
The aim of this study was to show a novel and accurate digital measurement protocol by analyzing the area and volume for interproximal tooth enamel surface reduction. In total, 14 lower teeth from all dental sectors were embedded into an epoxy resin and distributed as the lower dental arch, keeping the contact points. The experimental model was submitted to an intraoral digital impression before and after interproximal tooth enamel surface reduction using air-rotor strips and then re-contouring and polishing the interproximal enamel surfaces. These steps helped obtain standard tessellation language (STL) digital files. Furthermore, each tooth in the preoperative and postoperative full-arch STL digital files was segmented individually and aligned to analyze the area and volume of the interproximal tooth enamel surface reduction using engineering morphometry software. Descriptive analysis of the area and volume of the interproximal tooth enamel surface reduction was performed using a Student t-test. Higher enamel reduction area (3.53 ± 3.08 mm2) and volume (0.32 ± 0.22 mm3) values were shown on the distal surface compared with the area (2.97 ± 3.05 mm2) and volume (0.22 ± 0.16 mm3) of the enamel reduction on the mesial surface measured using the morphometric measurement digital protocol. The morphometric measurement protocol is an accurate digital measurement protocol for analyzing the area and volume of interproximal enamel surface reduction.
1. Introduction
Interproximal enamel reduction (IER) or stripping is considered an irreversible technique used to remove controlled amounts of interproximal enamel surfaces to achieve a reduction in the mesiodistal length of interproximal dental surfaces. The result is an increase in the available space in the dental arch [1,2]. IER is considered a more conservative orthodontic therapy than dental extractions [3] and, therefore, it is used to increase the available space without tooth extractions, allowing for teeth alignment and correct labioversion of the incisors [4] with a mild or moderate bone-dental discrepancy (BDD) between 4–8 mm [5,6]. IER is also recommended to improve the unaesthetic appearance caused by the loss of the interdental papilla, which is a consequence of bone loss or occlusal interproximal tooth contact [7]. In addition, IER is also used in temporary dentition to facilitate the eruption of partially erupted teeth blocked by insufficient space [8]. However, IER procedures are not recommended in small teeth, hypoplasia, severe tooth rotations, high risk of caries, poor oral hygiene, and young patients with large pulp chambers [9]. In addition, mechanic and manual IER techniques have been reported [10,11] to affect the interdental tooth enamel surfaces, leaving grooves and scratches [12]. For this reason, final polishing of interproximal tooth enamel surfaces after IER procedures are mandatory to reduce the number of dental abrasions and to obtain an interproximal tooth surface similar to untreated interproximal tooth enamel surfaces [5], ensuring favorable long-term prognosis [13]. Many measurement procedures have been used to analyze interproximal tooth enamel surfaces after IER techniques; however, most studies have used microscopic measurement methods [14] and profilometry [15], which are useful for analyzing the micro-roughness on interproximal tooth enamel surfaces after interproximal tooth enamel surface removal. Nonetheless, it is impossible to apply this in clinical situations because it is necessary to extract the teeth. De Felipe et al. and Johner et al. reported a digital technique to analyze the total amount of stripping in order to calculate the maximum mesiodistal distance in teeth based on the position of the tooth’s axis; however, the placement of this axis was not tested, and they measure neither the area nor the volume of the IER procedure [16,17]. However, the main novelty of the morphometric measurement technique is the possibility of using it in vivo in a clinical situation, wherein the acquisition of the digital information is done by intraoral scanners. The development of digital measurement procedures in dental research has increased the accuracy, simplicity, and versatility of acquiring information in research applications [18]. Intraoral scanners communicate easily with computer-aided design/computer-aided manufacturing (CAD/CAM) systems. This technology has also been introduced in orthodontics, thus allowing a completely digital workflow, from impression to final framework, with clinical reliability [19] and good patients’ feedback [20]. Different image capture systems—i.e., triangulation, light stripe projection, confocal parallelism images, and stereophotogrammetric videos—have been used in dental research [21]. Regardless of the scanning method, the measurements led to a three-dimensional capture made up of a point cloud that represents the object and its reference in space [22]. The most widely used digital format is standard tessellation language (STL). This format describes a succession of triangulated surfaces, where each triangle is defined by three points on a surface, which allows for a high accuracy measurement [23]. This triangulation converts cloud points into the mesh in order to calculate the volume and area of different treatments carried out on the tooth surface.
The aim of this study was to show a novel and accurate digital measurement protocol in order to analyze the area and volume of interproximal tooth enamel surface reduction.
2. Materials and Methods
2.1. Study Design
In total, 14 lower teeth from all dental sectors, extracted for periodontal or orthodontic reasons, without caries, restorations, or fractures, were selected in this study at the Alfonso X El Sabio University (Madrid, Spain), Master’s Degree program in Orthodontics at the University of Salamanca (Salamanca, Spain) and the Department of Stomatology at the University of Valencia (Valencia, Spain), between September and October 2020. An in vitro study was conducted in accordance with the principles defined in the German Ethics Committee´s statement for the use of organic tissues in medical research (Zentrale Ethikkommission, 2003), and was authorized by the Ethical Committee of the Faculty of Health Sciences, University Alfonso X el Sabio (Madrid, Spain) in September 2020 (Process No. 09/2020). All patients gave their informed consent to transfer the teeth.
2.2. Experimental Procedure
The teeth were embedded into an experimental model of epoxy resin (ref.: 20-8130-128. EpoxiCure®, Buehler, IL, USA), keeping the contact points. Afterward, the experimental model with the embedded teeth was submitted to a baseline intraoral scan (True Definition, 3M ESPE ™, Saint Paul, MN, USA) (STL1) via a 3D in-motion video imaging technology (Figure 1a) to generate an STL digital file using a cloud of points that create a tessella network, representing 3-dimensional objects as polygons composed of equilateral triangle tessellas [24,25]. The capturing images procedure was performed following manufacture recommendations by scanning the incisal/occlusal plane and the vestibular and lingual surfaces. After that, an interproximal enamel reduction of 0.2 mm at both interproximal surfaces for each tooth was performed using air-rotor strips (Ref.: 060B, Ortho-Strip system, Intensiv Dental, Montagnola, Switzerland) according to the manufacturers’ recommendations. We then re-contoured to produce an adequate interproximal shape and to polish the surfaces (Softflex system, 3M ESPE ™, Saint Paul, MN, USA) and the Komet ASR-Set (Komet Medical, Lemgo, Germany). Then, the experimental model was submitted to a postoperative interproximal enamel reduction intraoral scan (True Definition, 3M ESPE ™, Saint Paul, MN, USA) (STL2) (Figure 1b).
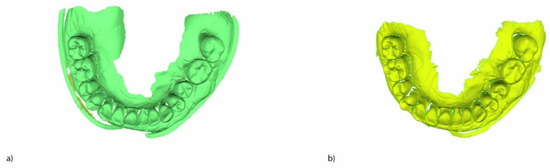
Figure 1.
(a) Occlusal view of the standard tessellation language (STL) digital file of the experimental model with the embedded teeth before and (b) after the 0.2 mm interproximal enamel reduction procedure using air-rotor strips and the interproximal enamel reduction technique.
2.3. Alignment Procedure
Afterward, the teeth from 3.7 to 4.7 of the preoperative (Figure 2a) and postoperative (Figure 2b) interproximal enamel reduction STL digital files were sequentially segmented, aligned, and individually compared (3-dimensionally) after being imported into a reverse engineering morphometric software (3D Geomagic Capture Wrap v. 2017.0.0, 3D Systems©, Rock Hill, SC, USA).
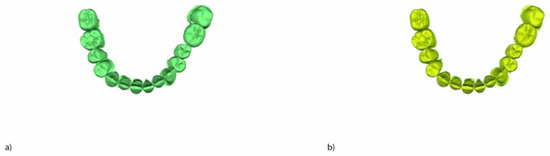
Figure 2.
(a) Occlusal view of the individually segmented teeth of the preoperative and (b) postoperative interproximal enamel reduction STL digital files.
Then, the individually segmented teeth of the preoperative (Figure 3a) and postoperative (Figure 3b) interproximal enamel reduction STL digital files were superimposed by using the non-varied buccal, occlusal, and lingual surfaces of the teeth as a reference with the best-fit algorithm.
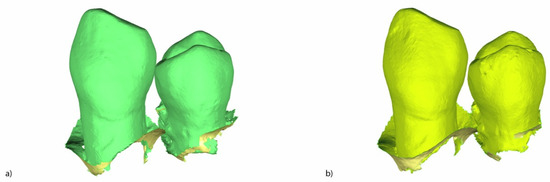
Figure 3.
(a) Buccal view of the individually segmented tooth, 3.3 and 3.4 of the preoperative and (b) postoperative interproximal enamel reduction STL digital files.
2.4. Measurement Procedure
After the alignment procedure between the individually segmented teeth in the preoperative and postoperative interproximal enamel reduction STL digital files, the area of enamel removed on the interproximal surfaces was measured by comparing preoperative boundaries (Figure 4a) and postoperative interproximal enamel reduction STL digital files (Figure 4b). The distal surfaces of teeth 3.7 and 4.7 were not submitted to the interproximal enamel reduction procedure.
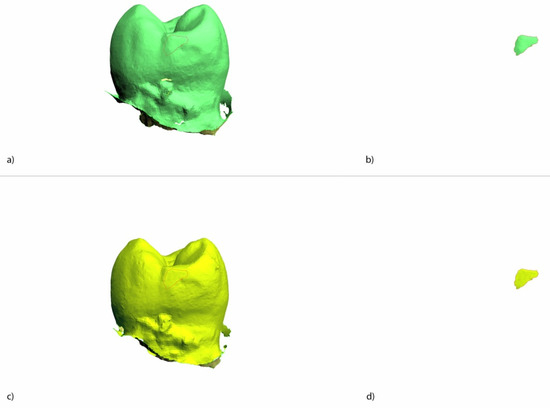
Figure 4.
(a) Interproximal view of the individually segmented tooth 3.4 of the preoperative STL (b) with the isolated interproximal examel reduction area. (c) Interproximal view of the individually segmented tooth 3.4 of the postoperative STL (d) with the isolated interproximal examel reduction area.
In addition, the volume of enamel removed after the interproximal enamel reduction procedure was selected and isolated in both preoperative (Figure 5a) and postoperative interproximal enamel reduction STL digital files (Figure 5b) via reverse selection. The selected area’s normal tessella network for the enamel removed in the preoperative (Figure 5a) and postoperative interproximal enamel reduction STL digital files (Figure 5b) were flipped to obtain a closed polygon with the selected area of the enamel removed to obtain the volume of the enamel removed after the interproximal enamel reduction procedures.
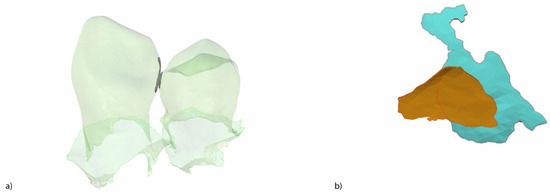
Figure 5.
(a) Interproximal view of the individually segmented and aligned preoperative and postoperative interproximal enamel reduction STL digital files (teeth 3.3 and 3.4) and the (b) digital mesh of the enamel removed in the distal interproximal surface of tooth 3.3 (blue) and digital mesh of the enamel removed in the mesial interproximal surface of tooth 3.4 (brown).
Afterward, the point of contact between the mesial and distal interproximal enamel reduction meshes (Figure 6a) were aligned perpendicular to the “X” axis (Figure 6b).
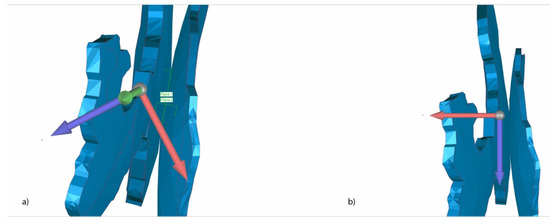
Figure 6.
(a) Point of contact between the mesial and distal interproximal enamel reduction meshes before and (b) after being aligned perpendicular to the “X” axis.
Finally, 10 points were positioned at the inner surface of the interproximal enamel reduction mesh of the anterior tooth (Figure 7a). Then, 10 lines parallel to the “X” axis were projected (Figure 7b) from the previous points to the inner surface of the interproximal enamel reduction mesh of the posterior tooth (Figure 7c). Then, 10 new points were created at the intersection of the lines and the inner surface of the interproximal enamel reduction mesh of the posterior tooth, creating 10 pairs of points (Figure 7d). The distance of each pair of points was measured. These distances were used in order to obtain a mean value of the interproximal enamel reduction between adjacent teeth.
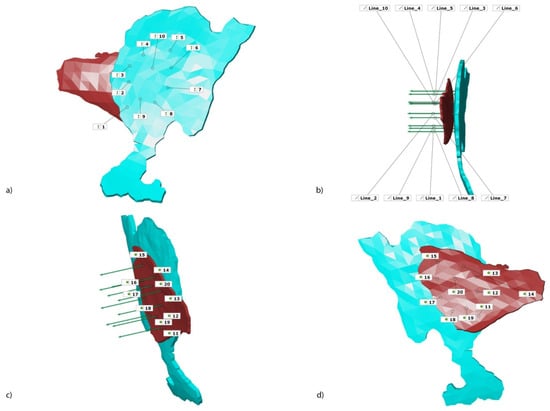
Figure 7.
(a) Points randomly distributed at the inner surface of the interproximal enamel reduction mesh of the anterior tooth; (b) linen parallel projected to the tooth to the inner surface of the interproximal enamel reduction mesh of the posterior tooth; (c) points where the projected lines crossed the inner surface of the distal interproximal enamel reduction mesh of the posterior tooth; and (d) points at the inner surface of the distal interproximal enamel reduction mesh of the posterior tooth.
2.5. Statistical Analysis
Statistical analysis of the measurement variables was carried out using SAS 9.4 (SAS Institute Inc., Cary, NC, USA). Descriptive statistics of the area and volume of the enamel removed after the interproximal enamel reduction procedure at the mesial and distal interproximal enamel surfaces of each tooth were expressed as the mean and standard deviation (SD). Additionally, also the minimum, median, and maximum values were calculated for each variable. A comparative analysis was performed by comparing the area and volume of the enamel removed after the interproximal enamel reduction procedure at the mesial and distal interproximal enamel surfaces of the STL digital files using the Student’s t-test; the variables had a normal distribution. The normality of the variables was analyzed using the Shapiro-Wilk normality test. The statistical significance was set at p ˂ 0.05.
3. Results
The means and SD values for the area of the enamel removed after the interproximal enamel reduction procedure at the mesial and distal interproximal enamel surfaces of the STL digital files are displayed in Table 1 and Figure 8.

Table 1.
Descriptive analysis of the area (mm2) of the enamel removed after the interproximal enamel reduction procedure at the mesial and distal interproximal enamel surfaces of the STL digital files.

Figure 8.
Box plot of the area of the enamel removed after the interproximal enamel reduction procedure at the mesial and distal interproximal enamel surfaces of the STL digital files. “*” represent an outlier.
The distal surface of the teeth, which underwent the interproximal enamel reduction procedure, showed a high enamel reduction area (3.53 ± 3.08 mm2) compared to the enamel reduction area of the mesial surface of the teeth (2.97 ± 3.05 mm2). The paired t-test did not show statistically significant differences between the mesial and distal areas of the removed enamel (p = 0.529).
The mean and SD values for the volume of the enamel removed after the interproximal enamel reduction procedure at the mesial and distal interproximal enamel surfaces of the STL digital files are displayed in Table 2 and Figure 9.
Table 2.
Descriptive analysis of the volume (mm3) of the enamel removed after the interproximal enamel reduction procedure at the mesial and distal interproximal enamel surfaces of the STL digital files.
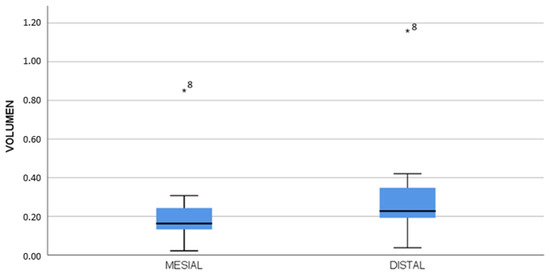
Figure 9.
Box plot of the volume of the enamel removed after the interproximal enamel reduction procedure at the mesial and distal interproximal enamel surfaces of the STL digital files. “*” represent outliers in line 8.
The distal surface of the teeth submitted to the interproximal enamel reduction procedure showed a high enamel reduction volume (0.32 ± 0.22 mm3) compared to the enamel reduction volume of the teeth submitted to the mesial surface in the interproximal enamel reduction procedure (0.22 ± 0.16 mm3). The paired t-test did not show statistically significant differences between the mesial and distal volumes of the removed enamel (p = 0.430).
4. Discussion
The results obtained in the present study showed that the morphometric measurement protocol allowed for an accurate measurement technique to analyze the area and volume of the enamel removed after the interproximal enamel reduction procedure at the mesial and distal interproximal enamel surfaces.
Profilometry, rugosimetry, scanning electron microscopy (SEM), and atomic force microscopy (AFM) measurement techniques have been used in order to assess the enamel surface roughness [17,18]. The SEM measurement technique provides two-dimensional (2D) analysis about the qualitative and morphological changes of the enamel surface [26]; however, profilometry and AFM measurement techniques report a three-dimensional (3D) analysis of the enamel surface roughness for subsequent evaluation [23]. In addition, profilometry and rugosimetry provide a micro-scale 3D image [27,28], whereas AFM provides a nanoscale 3D image with vertical and lateral resolution [29]. García Vargas et al. analyzed the surface roughness of different interproximal enamel reduction procedures using rugosimetry and obtained a higher roughness (Ra) value using strip bur (0.54 µm), as well as strip bands (0.41 µm) and strip discs (0.34 µm). In addition, interproximal enamel reduction performed with strip burs revealed the highest Vickers (vH) microhardness values (365 vH), followed by strip discs (327 vH) and strips bands (317 vH) [30]. Kilinc et al. reported that the surface roughness performed with metal strip bands and the air-rotor stripping procedure showed statistically significant differences via SEM evaluation. However, 70% less surface roughness was observed in teeth submitted to air-rotor stripping and 30% in the teeth submitted to strip bands after the first month [31]. Kaaouara et al. analyzed the interproximal tooth enamel surface using SEM and reported that single-side diamond strip bands showed a mean enamel roughness of 15 µm and ContactEZ diamond files, which also showed a mean enamel roughness of 10 µm [4]. Meredith et al. analyzed the enamel nanotopography after interproximal enamel reduction using atomic force microscopy (AFM) and reported that the enamel surface becomes progressively smoother from burs to strips and discs to polishers. In addition, surface roughness was higher using a medium roughness strip bur (707 nm), and decreased using medium strip bands (501 nm), fine strip burs (407 nm), fine strip bands (318 nm), mesh strip discs (307 nm), curved strip discs (224 nm), and a Sof-Lex polishing device (37 nm) [32]. Nevertheless, the previously described measurement techniques do not have the capability to accurately measure the area and volume of the interproximal enamel reduction because these measurement techniques perform a qualitative observational analysis. The morphometric measurement technique allows for an accurate, repeatable, and reproducible analysis that looks at the amount of cement remaining after a fixed multibracket appliance removal, the amount of orthodontic cement necessary to fix multibracket appliances, and the amount of enamel removed after fixed multibracket appliance removal, even in a clinical setting that prevents teeth extraction [33].
In accordance with this study, it is possible to accurately measure the area and volume of interproximal enamel surfaces (i.e., mesial and distal), independent of the width of each tooth, which is in contrast with previously published studies [19,20]. However, some factors have been highlighted to affect the accuracy of the digital scanner and hence on the quality of the STL digital files increasing the inaccuracy of the alignment procedure. Moreover, the selection of the digital scanner is highly relevant to provide a specific number of equilateral triangles of the tesella network, which can influence the accuracy of the measurement procedure.
The accuracy of the STL digital files through intraoral and extraoral scan devices depends on multiple factors related to the scanning process, such as the presence of saliva, adjacent structures, teeth, light reflection, presence of blood, type of material used during scanning, and the time of the scanning process [22,34], even though intraoral scan devices have reported smaller deviation values compared to extraoral scan devices [35]. Flügge et al. reported the influence of angle and distance of intraoral scan devices on the accuracy of the obtained STL digital files [36]; however, the accuracy of the obtained STL digital files has not been related to the distance of the extraoral scan device to the scanned object. Sason et al. reported that intraoral scan devices provide more accuracy compared to extraoral scanners [34]. Moreover, Ender and Mehl analyzed the accuracy of full-arch digital impressions using different intraoral scan devices and reported that the CEREC Bluecam scan showed a mean deviation of 80 µm in the posterior areas of the dental arch, whereas iTero showed a mean deviation of 120 µm and CEREC Omnicam showed a mean deviation of 130µm. Nevertheless, no statistically significant differences were observed between the intraoral scan devices (p > 0.05) [37]. In addition, Ender et al. reported no statistically significant differences (p > 0.05) between the accuracy of CEREC Bluecam, CEREC Omnicam, iTero, Lava COS, Lava True Definition, TRIOS, and TRIOS color digital for full-arch digital impressions [38]. However, Kuhr et al. analyzed the trueness of full-arch digital impressions between three digital scanners and reported statistically significant differences (p < 0.05) between the trueness values of the Lava True Definition and CEREC Onmicam; however, no statistically significant differences (p > 0.05) were shown between the Lava True Definition and TRIOS. The standard deviation about the distance measurement was 23 µm for 3M True Definition, 37 µm for Heraeus Cara TRIOS, and 214 µm for CEREC Omnicam. In addition, the angle measurement was for 0.06°, 0.13°, and 0.28° for True Definition, Heraerus Cara TRIOS, and CEREC Omnicam, respectively [39]. Moreover, Guth et al. reported higher mean trueness of True Definition (21.8 µm) than CEREC Bluecam (34.2 µm), CEREC Omnicam (43.4 µm), iTero (49.0 µm), Lava COS (47.7 µm), TRIOS (25.7 µm), and TRIOS color (26.1 µm) for partial lower arch scanning [40]. Moreover, power-dependent digital impression systems provide more accurate STL digital files than no-powder dependent digital impression systems because light refraction and scattering is prevented by the use of powder, which also allows for an accurate determination of object depth [41,42]. Currently, there is no acquisition data system through digital scan devices that can be considered more accurate than others due to the lack of standardized protocols and randomized clinical trials [22]; however, Kulczyk et al. demonstrated that 3D models derived from optical scanners are 10 times more detailed in the number of tessellas in the network describing the tooth surface and 4–5 times more accurate in terms of standard deviation compared with experimental models obtained with CBCT with a standard resolution [43].
5. Conclusions
In conclusion, the morphometric measurement protocol is an accurate digital measurement protocol for analyzing the area and volume of interproximal enamel surface reduction. However, clinical trials are necessary to ensure the potential accuracy of this novel measurement procedure.
Author Contributions
Conceptualization, M.T.; methodology, Á.Z.-M.; validation, J.A.P.-B.; formal analysis, C.G.B.; investigation, A.A.L., P.V.-G. and A.A.M. All authors have read and agreed to the published version of the manuscript.
Funding
This research received no external funding.
Institutional Review Board Statement
Not applicable.
Informed Consent Statement
Not applicable.
Data Availability Statement
Data available on request due to restrictions eg privacy or ethical.
Acknowledgments
The authors would like to thank Santiago López Martínez his invaluable assistance in this study.
Conflicts of Interest
The authors declare no conflict of interest.
References
- Jarjoura, K.; Gagnon, G.; Nieberg, L. Caries risk after interproximal enamel reduction. Am. J. Orthod. Dentofac. Orthop. 2006, 130, 26–30. [Google Scholar] [CrossRef] [PubMed]
- Aasen, T.O.; Espeland, L. An approach to maintain orthodontic alignment of lower incisors without the use of retainers. Eur. J. Orthod. 2005, 27, 209–214. [Google Scholar] [CrossRef] [PubMed]
- Lapenaite, E.; Lopatiene, K. Interproximal enamel reduction as a part of orthodontic treatment. Stomatologija 2014, 16, 19–24. [Google Scholar] [PubMed]
- Kaaouara, Y.; Mohind HBen Azaroual, M.F.; Zaoui, F.; Bahije, L.; Benyahia, H. In vivo enamel stripping: A macroscopic and microscopic analytical study. Int. Orthod. 2019, 17, 235–242. [Google Scholar] [CrossRef] [PubMed]
- Rossouw, P.E.; Tortorella, A. Enamel reduction procedures in orthodontic treatment. J. Can. Dent. Assoc. 2003, 69, 378–383. [Google Scholar] [PubMed]
- Chudasama, D.; Sheridan, J.J. Guidelines for contemporary air-rotor stripping. J. Clin. Orthod. 2007, 41, 315–320. [Google Scholar]
- Zachrisson, B.U. Interdental papilla reconstruction in adult orthodontics. World J. Orthod. 2004, 5, 67–73. [Google Scholar] [PubMed]
- Zachrisson, B.U.; Minster, L.; Øgaard, B.; Birkhed, D. Dental health assessed after interproximal enamel reduction: Caries risk in posterior teeth. Am. J. Orthod. Dentofac. Orthop. 2011, 139, 90–98. [Google Scholar] [CrossRef]
- Arman, A.; Cehreli, S.B.; Ozel, E.; Arhun, N.; Cetinsahin, A.; Soyman, M. Qualitative and quantitative evaluation of enamel after various stripping methods. Am. J. Orthod. Dentofac. Orthop. 2006, 130, e7–e14. [Google Scholar] [CrossRef]
- Keim, R.G.; Gottlieb, E.L.; Nelson, A.H.; Vogels, D.S., 3rd. 2008 JCO study of orthodontic diagnosis and treatment procedures, part 1: Results and trends. J. Clin. Orthod. 2008, 42, 625–640. [Google Scholar]
- Zachrisson, B.U.; Nyøygaard, L.; Mobarak, K. Dental health assessed more than 10 years after interproximal enamel reduction of mandibular anterior teeth. Am. J. Orthod. Dentofac. Orthop. 2007, 131, 162–169. [Google Scholar] [CrossRef] [PubMed]
- Grippaudo, C.; Cancellieri, D.; Grecolini, M.E.; Deli, R. Comparison between different interdental stripping methods and evaluation of abrasive strips: SEM analysis. Prog. Orthod. 2010, 11, 127–137. [Google Scholar] [CrossRef] [PubMed]
- Baumgartner, S.; Iliadi, A.; Eliades, T.; Eliades, G. An in vitro study on the effect of an oscillating stripping method on enamel roughness. Prog. Orthod. 2015, 16, 1–6. [Google Scholar] [CrossRef] [PubMed]
- Lombardo, L.; Guarneri, M.P.; D’Amico, P.; Molinari, C.; Meddis, V.; Carlucci, A.; Siciliani, G. Orthofile(R): A new approach for mechanical interproximal reduction: A scanning electron micro- scopic enamel evaluation. J. Orofac. Orthop. 2014, 75, 203–212. [Google Scholar] [CrossRef]
- Danesh, G.; Podstawa, P.K.K.; Schwartz, C.E.; Kirschneck, C.; Bizhang, M.; Arnold, W.H. Depth of acid penetration and enamel surface roughness associated with different methods of interproximal enamel reduction. PLoS ONE 2020, 15, e0229595. [Google Scholar] [CrossRef]
- Johner, A.M.; Pandis, N.; Dudic, A.; Kiliaridis, S. Quantitative comparison of 3 enamel-stripping devices in vitro: How precisely can we strip teeth? Am. J. Orthod. Dentofac. Orthop. 2013, 143, 468–472. [Google Scholar] [CrossRef]
- De Felipe, M.E.; Nucci, L.; Fiori, A.; Flores-Mir, C.; Perillo, L.; Grassia, V. Accuracy of interproximal enamel reduction during clear aligner treatment. Prog. Orthod. 2020, 21, 1–7. [Google Scholar] [CrossRef]
- Abduo, J.; Elseyoufi, M. Accuracy of Intraoral Scanners: A Systematic Review of Influencing Factors. Eur. J. Prosthodont. Restor. Dent. 2018, 26, 101–121. [Google Scholar]
- Lee, K.C.; Park, S.-J. Digital Intraoral Scanners and Alginate Impressions in Reproducing Full Dental Arches: A Comparative 3D Assessment. Appl. Sci. 2020, 10, 7637. [Google Scholar] [CrossRef]
- Sfondrini, M.F.; Gandini, P.; Malfatto, M.; Di Corato, F.; Trovati, F.; Scribante, A. Computerized Casts for Orthodontic Purpose Using Powder-Free Intraoral Scanners: Accuracy, Execution Time, and Patient Feedback. Biomed. Res. Int. 2018, 23, 4103232. [Google Scholar] [CrossRef]
- Lecocq, G. Digital impression-taking: Fundamentals and benefits in orthodontics. Int. Orthod. 2016, 14, 184–194. [Google Scholar] [CrossRef] [PubMed]
- Duvert, R.; Gebeile-Chauty, S. La précision des empreintes numériques intra-orales en orthodontie est-elle suffisante? Orthod. Fr. 2017, 88, 347–354. [Google Scholar] [CrossRef] [PubMed]
- Richert, R.; Goujat, A.; Venet, L.; Viguie, G.; Viennot, S.; Robinson, P.; Farges, J.C.; Fages, M.; Ducret, M. Intraoral Scanner Technologies: A Review to Make a Successful Impression. J. Healthc. Eng. 2017, 2017, 8427595. [Google Scholar] [CrossRef] [PubMed]
- Renne, W.; Ludlow, M.; Fryml, J.; Schurch, Z.; Mennito, A.; Kessler, R.; Lauer, A. Evaluation of the accuracy of 7 digital scanners: An in vitro analysis based on 3-dimensional comparisons. J. Prosthet. Dent. 2017, 118, 36–42. [Google Scholar] [CrossRef]
- Medina-Sotomayor, P.; Pascual-Moscardo, A.; Camps, A.I. Accuracy of 4 digital scanning systems on prepared teeth digitally isolated from a complete dental arch. J. Prosthet. Dent. 2019, 121, 811–820. [Google Scholar] [CrossRef]
- Sugsompian, K.; Tansalarak, R.; Piyapattamin, T. Comparison of the Enamel Surface Roughness from Different Polishing Methods: Scanning Electron Microscopy and Atomic Force Microscopy Investigation. Eur. J. Dent. 2020, 14, 299–305. [Google Scholar] [CrossRef]
- Mhatre, A.C.; Tandur, A.P.; Reddy, S.S.; Karunakara, B.C.; Baswaraj, H. Enamel Surface Evaluation after Removal of Orthodontic Composite Remnants by Intraoral Sandblasting Technique and Carbide Bur Technique: A Three-Dimensional Surface Profilometry and Scanning Electron Microscopic Study. J. Int. Oral Health 2015, 7, 34–39. [Google Scholar]
- Ahrari, F.; Akbari, M.; Akbari, J.; Dabiri, G. Enamel surface roughness after debonding of orthodontic brackets and various clean-up techniques. J. Dent. 2013, 10, 82–93. [Google Scholar]
- Kubínek, R.; Zapletalová, Z.; Vůjtek, M.; Novotný, R.; Kolářová, H.; Chmelíčková, H.; Peřina, J., Jr. Sealing of open dentinal tubules by laser irradiation: AFM and SEM observations of dentine surfaces. J. Mol. Recognit. 2007, 20, 476–482. [Google Scholar] [CrossRef]
- García Vargas, M.C.; Montoya Toro, F.A.; Salamanca Mojica, I.P.; Figueroa Valbuena, E.; Castro Figueroa, M.E.; Delgado Perdomo, L.P.; Quintero, L.C. Efectos sobre el esmalte dental con la utilización de tres diferentes métodos de reducción interproximal. Rev. Nac. Odontol. 2011, 7, 9–17. [Google Scholar]
- Kilinc, D.D.; Hamamci, O. Enamel surfaces with sem after the application of different in vivo stripping methods. J. Int. Dent. Med. Res. 2009, 2, 71–76. [Google Scholar]
- Meredith, L.; Farella, M.; Lowrey, S.; Cannon, R.D.; Mei, L. Atomic force microscopy analysis of enamel nanotopography after interproximal reduction. Am. J. Orthod. Dentofac. Orthop. 2017, 151, 750–757. [Google Scholar] [CrossRef] [PubMed]
- Zubizarreta-Macho, Á.; Triduo, M.; Alonso Pérez-Barquero, J.; Guinot Barona, C.; Albaladejo Martínez, A. Novel Digital Technique to Quantify the Area and Volume of Cement Remaining and Enamel Removed after Fixed Multibracket Appliance Therapy Debonding: An In Vitro Study. J. Clin. Med. 2020, 9, 1098. [Google Scholar] [CrossRef] [PubMed]
- Flügge, T.V.; Schlager, S.; Nelson, K.; Nahles, S.; Metzger, M.C. Precision of intraoral digital dental impressions with iTero and extraoral digitization with the iTero and a model scanner. Am. J. Orthod. Dentofac. Orthop. 2013, 144, 471–478. [Google Scholar] [CrossRef]
- Sason, G.K.; Mistry, G.; Tabassum, R.; Shetty, O. A comparative evaluation of intraoral and extraoral digital impressions: An in vivo study. J. Indian Prosthodont. Soc. 2018, 18, 108–116. [Google Scholar] [CrossRef] [PubMed]
- Flügge, T.; Att, W.; Metzger, M.; Nelson, K. Precision of Dental Implant Digitization Using Intraoral Scanners. Int. J. Prosthodont. 2016, 29, 277–283. [Google Scholar] [CrossRef]
- Ender, A.; Mehl, A. Full arch scans: Conventional versus digital impressions--an in-vitro study. Int. J. Comput. Dent. 2011, 14, 11–21. [Google Scholar]
- Ender, A.; Attin, T.; Mehl, A. In vivo precision of conventional and digital methods of obtaining complete-arch dental impressions. J. Prosthet. Dent. 2016, 115, 313–320. [Google Scholar] [CrossRef]
- Kuhr, F.; Schmidt, A.; Rehmann, P.; Wöstmann, B. A new method for assessing the accuracy of full arch impressions in patients. J. Dent. 2016, 55, 68–74. [Google Scholar] [CrossRef]
- Guth, J.; Runkel, C.; Beuer, F.; Stimmelmayr, M.; Edelhoff, D.; Keul, C. Accuracy of five intraoral scanners compared to indirect digitalization. Clin. Oral Investig. 2017, 21, 1445–1455. [Google Scholar] [CrossRef]
- Nedelcu, R.G.; Persson, A.S. Scanning accuracy and precision in 4 intraoral scanners: An in vitro comparison based on 3-dimensional analysis. Prosthet. Dent. 2014, 112, 1461–1471. [Google Scholar] [CrossRef] [PubMed]
- Akyalcin, S.; Cozad, B.; English, J.; Colville, C.; Laman, S. Diagnostic accuracy of impression-free digital models. Am. J. Orthod. Dentofac. Orthop. 2013, 144, 916–922. [Google Scholar] [CrossRef] [PubMed]
- Kulczyk, T.; Rychlik, M.; Lorkiewicz-Muszyńska, D.; Abreu-Głowacka, M.; Czajka-Jakubowska, A.; Przystańska, A. Computed tomography versus optical scanning: A comparison of different methods of 3d data acquisition for tooth replication. Biomed. Res. Int. 2019, 2019, 1–7. [Google Scholar] [CrossRef] [PubMed]
Publisher’s Note: MDPI stays neutral with regard to jurisdictional claims in published maps and institutional affiliations. |
© 2021 by the authors. Licensee MDPI, Basel, Switzerland. This article is an open access article distributed under the terms and conditions of the Creative Commons Attribution (CC BY) license (http://creativecommons.org/licenses/by/4.0/).