Article

Oil-In-Water Microemulsion Encapsulation of Antagonist Drugs Prevents Renal Ischemia-Reperfusion Injury in Rats

1
Department of Biology, School of Basic Sciences, University of Zabol, 98613-35856 Zabol, Iran
2
Department of Physics, School of Basic Sciences, University of Zabol, 98613-35856 Zabol, Iran
3
Department of Chemistry, Shahid Bahonar University of Kerman, 76169-14111 Kerman, Iran
4
Institute of Materials Physics and Engineering, Department of Applied Science and Technology, Politecnico di Torino, 10129 Torino, Italy
5
Department of Biology, School of Basic Sciences, Bu-Ali Sina University, 67178-38695 Hamedan, Iran
*
Authors to whom correspondence should be addressed.
Appl. Sci. 2021, 11(3), 1264; https://doi.org/10.3390/app11031264
Submission received: 4 January 2021 / Revised: 25 January 2021 / Accepted: 26 January 2021 / Published: 30 January 2021
(This article belongs to the Special Issue Biomaterials, Polymers and Tissue Engineering)

Abstract

:
Developing new therapeutic drugs to prevent ischemia/reperfusion (I/R)-induced renal injuries is highly pursued. Liposomal encapsulation of spironolactone (SP) as a mineralocorticoid antagonist increases dissolution rate, bioavailability and prevents the drug from degradation. In this context, this work develops a new formulation of oil-in-water type microemulsions to enhance the bioavailability of SP. The size of the SP-loaded microemulsion was about 6.0 nm by dynamic light scattering analysis. Briefly, we investigated the effects of nano-encapsulated SP (NESP) on renal oxidative stress, biochemical markers and histopathological changes in a rat model of renal I/R injury. Forty eight male Wistar rats were divided into six groups. Two groups served as control and injury model (I/R). Two groups received “conventional” SP administration (20 mg/kg) and NESP (20 mg/kg), respectively, for two days. The remaining two groups received SP (20 mg/kg) and NESP (20 mg/kg) two days before induction of I/R. At the end of the experiments, serum and kidneys of rats underwent biochemical, molecular and histological examinations. Our results showed that I/R induces renal oxidative stress, abnormal histological features and altered levels of renal biomarkers. Administration of SP in healthy animals did not cause any significant changes in the measured biochemical and histological parameters compared to the control group. However, SP administration in the I/R group caused some corrections in renal injury, although it could not completely restore I/R-induced renal oxidative stress and kidney damage. On the contrary, NESP administration restored kidney oxidative injury via decreasing renal lipid peroxidation and enhancing glutathione, superoxide dismutase and catalase in kidneys of the I/R group. The deviated serum levels of urea, creatinine, total proteins and uric acid were also normalized by NESP administration. Furthermore, NESP protected against renal abnormal histology features induced by I/R. Therefore, NESP has beneficial effects in preventing kidney damage and renal oxidative stress in a rat model of I/R, which deserves further evaluations in the future.

1. Introduction

Renal ischemia/reperfusion (I/R) accrues from a decrease in total or regional renal blood flow, followed by consequent restoration [1]. Various clinical conditions such as cardiac surgery, sepsis, trauma and kidney transplantation may lead to renal ischemia [2]. Ischemia-derived hypoxia results in tissue damages, reactive oxygen species (ROS) production, tubular epithelium necrosis, reduced glomerular filtration and inflammatory responses [3,4].
Although reperfusion is essential for the survival of ischemic kidney tissue, it was shown that restoring blood flow can exacerbate tissue damage [1]. There are various strategies to prevent I/R injury; meanwhile, this complication can lead to high mortality [5]. Consequently, newly developed therapeutic drugs and interventions addressed to the prevention of I/R-induced renal injuries are strongly pursued. Evidence suggests that imbalance between vasoconstrictors and vasodilators may lead to decreased reperfusion [6]. Therefore, the design of drugs that regulate factors affecting tissue blood flow can play an important role in preventing damage caused by renal ischemia.
The aldosterone hormone regulates the concentration of sodium and potassium ions in the blood by affecting target organs, including the intestines and kidneys. It also has a vasoconstrictive effect on the renal vasculature system. Since the effects of this hormone are mediated through mineralocorticoid receptors, blocking mineralocorticoid receptors may play a supportive role in reducing the destructive effects of circulatory disorders on kidney tissue and other ischemic organs. Specifically, recent studies have shown that the aldosterone exacerbates the destructive effects of renal I/R [7,8]. Based on these findings, clinical observations showed that the use of mineralocorticoid blockers improves the damage caused by renal ischemia. The protective effects of mineralocorticoids antagonists have been documented in several models of nephropathy, including diabetic rats [9], ureteral obstruction [10] and aldosterone-treated rats [11]. In addition, in cases of cyclosporine A-induced nephrotoxicity, administration of mineralocorticoid blockers reduces the destructive effects of cyclosporine use. Indeed, the destructive effects of cyclosporine A are due to the reduction of renal blood flow because aldosterone acts as a vasoconstrictor; therefore, the destructive effects of cyclosporine are augmented by aldosterone [12].
Several studies have demonstrated that spironolactone (SP) as a mineralocorticoid antagonist plays an important role in preventing the physiopathology of renal injuries [13,14]. For example, there are several reports showing the beneficial effects of SP in animal models of kidney damage induced by diabetes [15], ischemia [13] and obstructive jaundice [16]. Furthermore, low doses of SP carry advantages to patients with chronic kidney disease [17]. Clinically, the benefit of SP is achieved only with long-term use via oral route, which is often associated with side effects of gynecomastia, menstrual irregularities and decreased libido. Moreover, spironolactone is characterized by incomplete oral behavior because of its low solubility and slow dissolution rate [18].
Liposome drug delivery systems have shown encouraging results in altering the bioavailability of encapsulated therapeutic agents, thus improving the drug therapeutic index in terms of longevity, drug safety profiles, therapeutic efficacy and distribution characteristics [19,20,21]. It has been shown that liposome-encapsulated SP has therapeutic/preventive potential for acute lung injury and fibrosis in mice [22]. Furthermore, optimizing SP by nanoprecipitation method leads to minimizing the preparation volume administered for children medication [18]. Another report shows promising results of SP-loaded leciplexes in the treatment of female acne [23].
So far, most studies about nano-formulation of drugs used cell lines [24,25,26] or focused on respiratory tract exposures for assessing the health effects of nanoparticles. Other exposure routes, e.g., gastrointestinal tract, also need to be considered as potential portals of entry [22]. Considering the therapeutic potential of SP in renal injuries and the advantages of liposome drug delivery system, we compared the biomedical effects of SP administered via oral route in two forms of free SP and neon-encapsulated SP (NESP) against renal damage induced by I/R in rats by measuring renal oxidative stress, biochemical markers and histopathological changes.

2. Materials and Methods

2.1. Drugs and Chemicals

Standard laboratory grade chemicals, including spironolactone, sodium caprylate, ethyl butyrate, TBA (2-thiobarbituric acid), DTNB (2, 2′-dinitro-5, 5′-dithiodibenzoic acid), n-butanol, tetramethoxy propane (TMP) and ethylenediaminetetraacetic acid (EDTA) were provided by Sigma Chemical Co. (St. Louis, MO, USA). Pluronic F127 surfactant was procured from BASF Inc. (Mount Olive, NJ, USA).

2.2. Synthesis of SP-Incorporated Microemulsions

F127 oil-in-water microemulsions encapsulating SP (with total volume of 10 mL) were prepared as 1% w/w solutions of ethyl butyrate by vigorously stirring (for 24 h) the required amount of F127 and phosphate buffered saline (PBS at pH 7.4), using a fixed oil-to-surfactant molar ratio and a fixed SP-to-Pluronic molar ratio [27].
The entire microemulsion preparation procedure was executed at room temperature. Scheme 1 shows the representation of the newly synthesized SP microemulsion structure and contents.

2.3. The Size Characterization of SP-Loaded Microemulsions by Digital Light Scattering (DLS)

DLS characterization of SP-incorporated microemulsions was carried out using the ALV-5000F goniometer system coupled with a diode-pumped solid-state laser to supply a polarized incident light. The system was also integrated with a digital correlator (ALV SP-86) with a sample range of 25 ns to 100 ms. DLS was performed at an angle of θ = 90° to the incident ray by calibrating the intensity scale by toluene against ambient light scattering. Prior to the measurement, the sample solutions were directly filtered into the scattering cells using millipore millex filters (0.22 μm porosity) and were equilibrated for 10 min at the required temperature. In order to acquire a fitted correlation function, the sampling time was 5–10 min. All the experiments were carried out three times. The decay rate, Γ, obtained by fitting a single exponential function to the autocorrelation function of samples, is related to the diffusion coefficient by using [28,29,30]:
D = Γ q 2
where q is the scattering vector.
The diffusion coefficient of nanoparticles or micelles can be characterized as Rh according to the Stokes–Einstein equation [28,29,30]:
R h = k T 6 η π D
where k and η denote the Boltzmann constant and water viscosity, respectively.

2.4. In Vivo Studies

2.4.1. Animals and Experimental Design

Forty eight adult male Wistar rats weighing 200–250 g were used in this study. The rats were obtained from Pasteur Institute, Tehran, Iran. Animals were housed at standard laboratory conditions with 12 h of light/dark cycles, and constant values of temperature and humidity and had access to food and water ad libitum. The animals were randomly divided into six groups, each containing eight rats as follows: group 1 (control), group 2 (I/R), groups 3 (SP) and 4 (NESP) (rats received only SP (20 mg/kg) or NESP (20 mg/kg) for 2 days by oral gavage), group 5 (I/R + SP) (rats received 20 mg/kg of SP via gavage for 2 days before I/R) and group 6 (I/R + NESP) (rats received 20 mg/kg NESP via gavage for 2 days before I/R). The doses and administration period of SP were selected according to previous studies [14,31,32].

2.4.2. Renal I/R Model

Rats were anesthetized by using an intraperitoneal administration of ketamine xylazine. Body temperature was maintained at 37 °C with the aid of a warming pad. A midline abdominal incision was made, and both kidneys were dissected out. Renal ischemia was induced by vascular clamps over the pedicles for 20 min. The clamps were then released and the incision was closed with sutures and reperfusion was allowed to occur for 24 h. After the reperfusion period, a blood sample was collected for biochemical analysis. At the end of the experiment, the right kidney was harvested and fixed in 10% neutral buffered formalin for histological studies and the left kidney was transferred to −20 °C for evaluation of oxidative stress parameters [33].

2.4.3. Assessment of Oxidant/Antioxidant Markers

Renal oxidative stress markers were measured by using a spectrophotometer. Malondialdehyde (MDA) levels in renal tissue, which are used as an index of lipid peroxidation, were determined as described previously [34]. Reduced glutathione (GSH) content in kidney homogenate was estimated by the Ellman’s method [35]. The level of superoxide dismutase (SOD) enzyme activity was determined according to Beauchamp and Fridovich method [36]. The activity of catalase (CAT) was calculated by the rate of H2O2 consumption, which was measured at 240 nm [37].

2.4.4. Histological Evaluation

Kidneys were fixed in 10% neutral buffered formalin. After 24 h, the specimen was dehydrated with an elevated degree of ethanol. Subsequently, the specimen was embedded in paraffin, sectioned at 5 µm thickness, and stained with Hematoxylin-Eosin (H&E). Sections were examined under a light microscope and photographed. Histopathological criteria for evaluation included tubular epithelial necrosis, cast formation, intratubular debris, interstitial fibrosis and tubular dilatation, which were all used for the assessment of renal tissue damage [33]. At least 10 fields (×400) were examined on each microscopic slide. The morphometric examinations were performed in a blind manner.

2.4.5. Measurement of Renal Biomarkers

Blood was collected from the anesthetized rats through cardiac puncture, and serum was isolated by centrifugation at 3000× g rpm for 5 min. Serum urea and creatinine were measured by using commercial kits (Pars Azmoon Co., Tehran, Iran). Total protein content was assayed as described previously by Bradford [38]. Uric acid was determined according to the method reported by Caraway [39] by using a commercial kit (Pars Azmoon Co., Tehran, Iran).

2.4.6. Statistical Analysis

Results are reported as mean ± standard deviation (SD). Kolmogorov–Smirnov tests were used to determine the normal distribution of samples. Data were analyzed by using the one-way analysis of variance (one-way ANOVA test) followed by a post-hoc test (Tukey’s test). p < 0.05, p < 0.01 or p < 0.001 were considered to be the significant values between the compared groups. All of the data were analyzed by SPSS 16 statistical software.

3. Results

3.1. Physical Characterization of Oil-In-Water Microemulsions Containing SP

Figure 1 shows an autocorrelation function (ACF) against time for the prepared microemulsions. Fitting a curve to the ACF yielded a decay rate from which the hydrodynamic diameter of SP-based microemulsions was measured to be approximately 6 nm based the diffusion data (3.83256 × 10⁻¹¹ m2/s) [38,39,40].
Regarding encapsulation efficiency as well as drug release of spironolactone (SP) into the microemulations, based on the similarities in the chemical structure of SP and another drugs studied by our group [41,42,43,44], it is expected that encapsulation efficiency of the microemulations can be above 80% and sustained release of SP will be about 50% after 24 h.

3.2. In Vivo Studies

After characterizing the materials, levels of renal MDA as an index of lipid peroxidation were evaluated in the different animal groups as shown in Figure 2. We observed a significant increase in the renal MDA content in the I/R group (p < 0.001), which was due to the enhanced lipid peroxidation. Our results also indicate that the SP and NESP did not significantly alter the renal MDA contents (4.52 ± 0.22 and 4.0 ± 0.14 nmol/mg, respectively) compared to the control group (3.23 ± 0.35 nmol/mg) (p = 0.99, p = 0.94, respectively). Even though the SP decreased the MDA levels in the I/R group (6.11 ± 0.25 nmol/mg) compared to the untreated I/R group (8.42 ± 0.45 nmol/mg) (p < 0.05), there was still a significant difference in the MDA levels compared to the control group (3.23 ± 0.35 nmol/mg) (p < 0.05). However, the NESP in the I/R group completely normalized the increased MDA levels and, within this context, it can be asserted that there was no significant difference of NESP + I/R compared to the control group (p = 0.98). Furthermore, there was a significant difference between the NESP-treated I/R group (3.9 ± 0.34 nmol/mg) and SP-treated I/R group (6.11 ± 0.25 nmol/mg) in renal MDA content as shown in Figure 2 (p < 0.05).
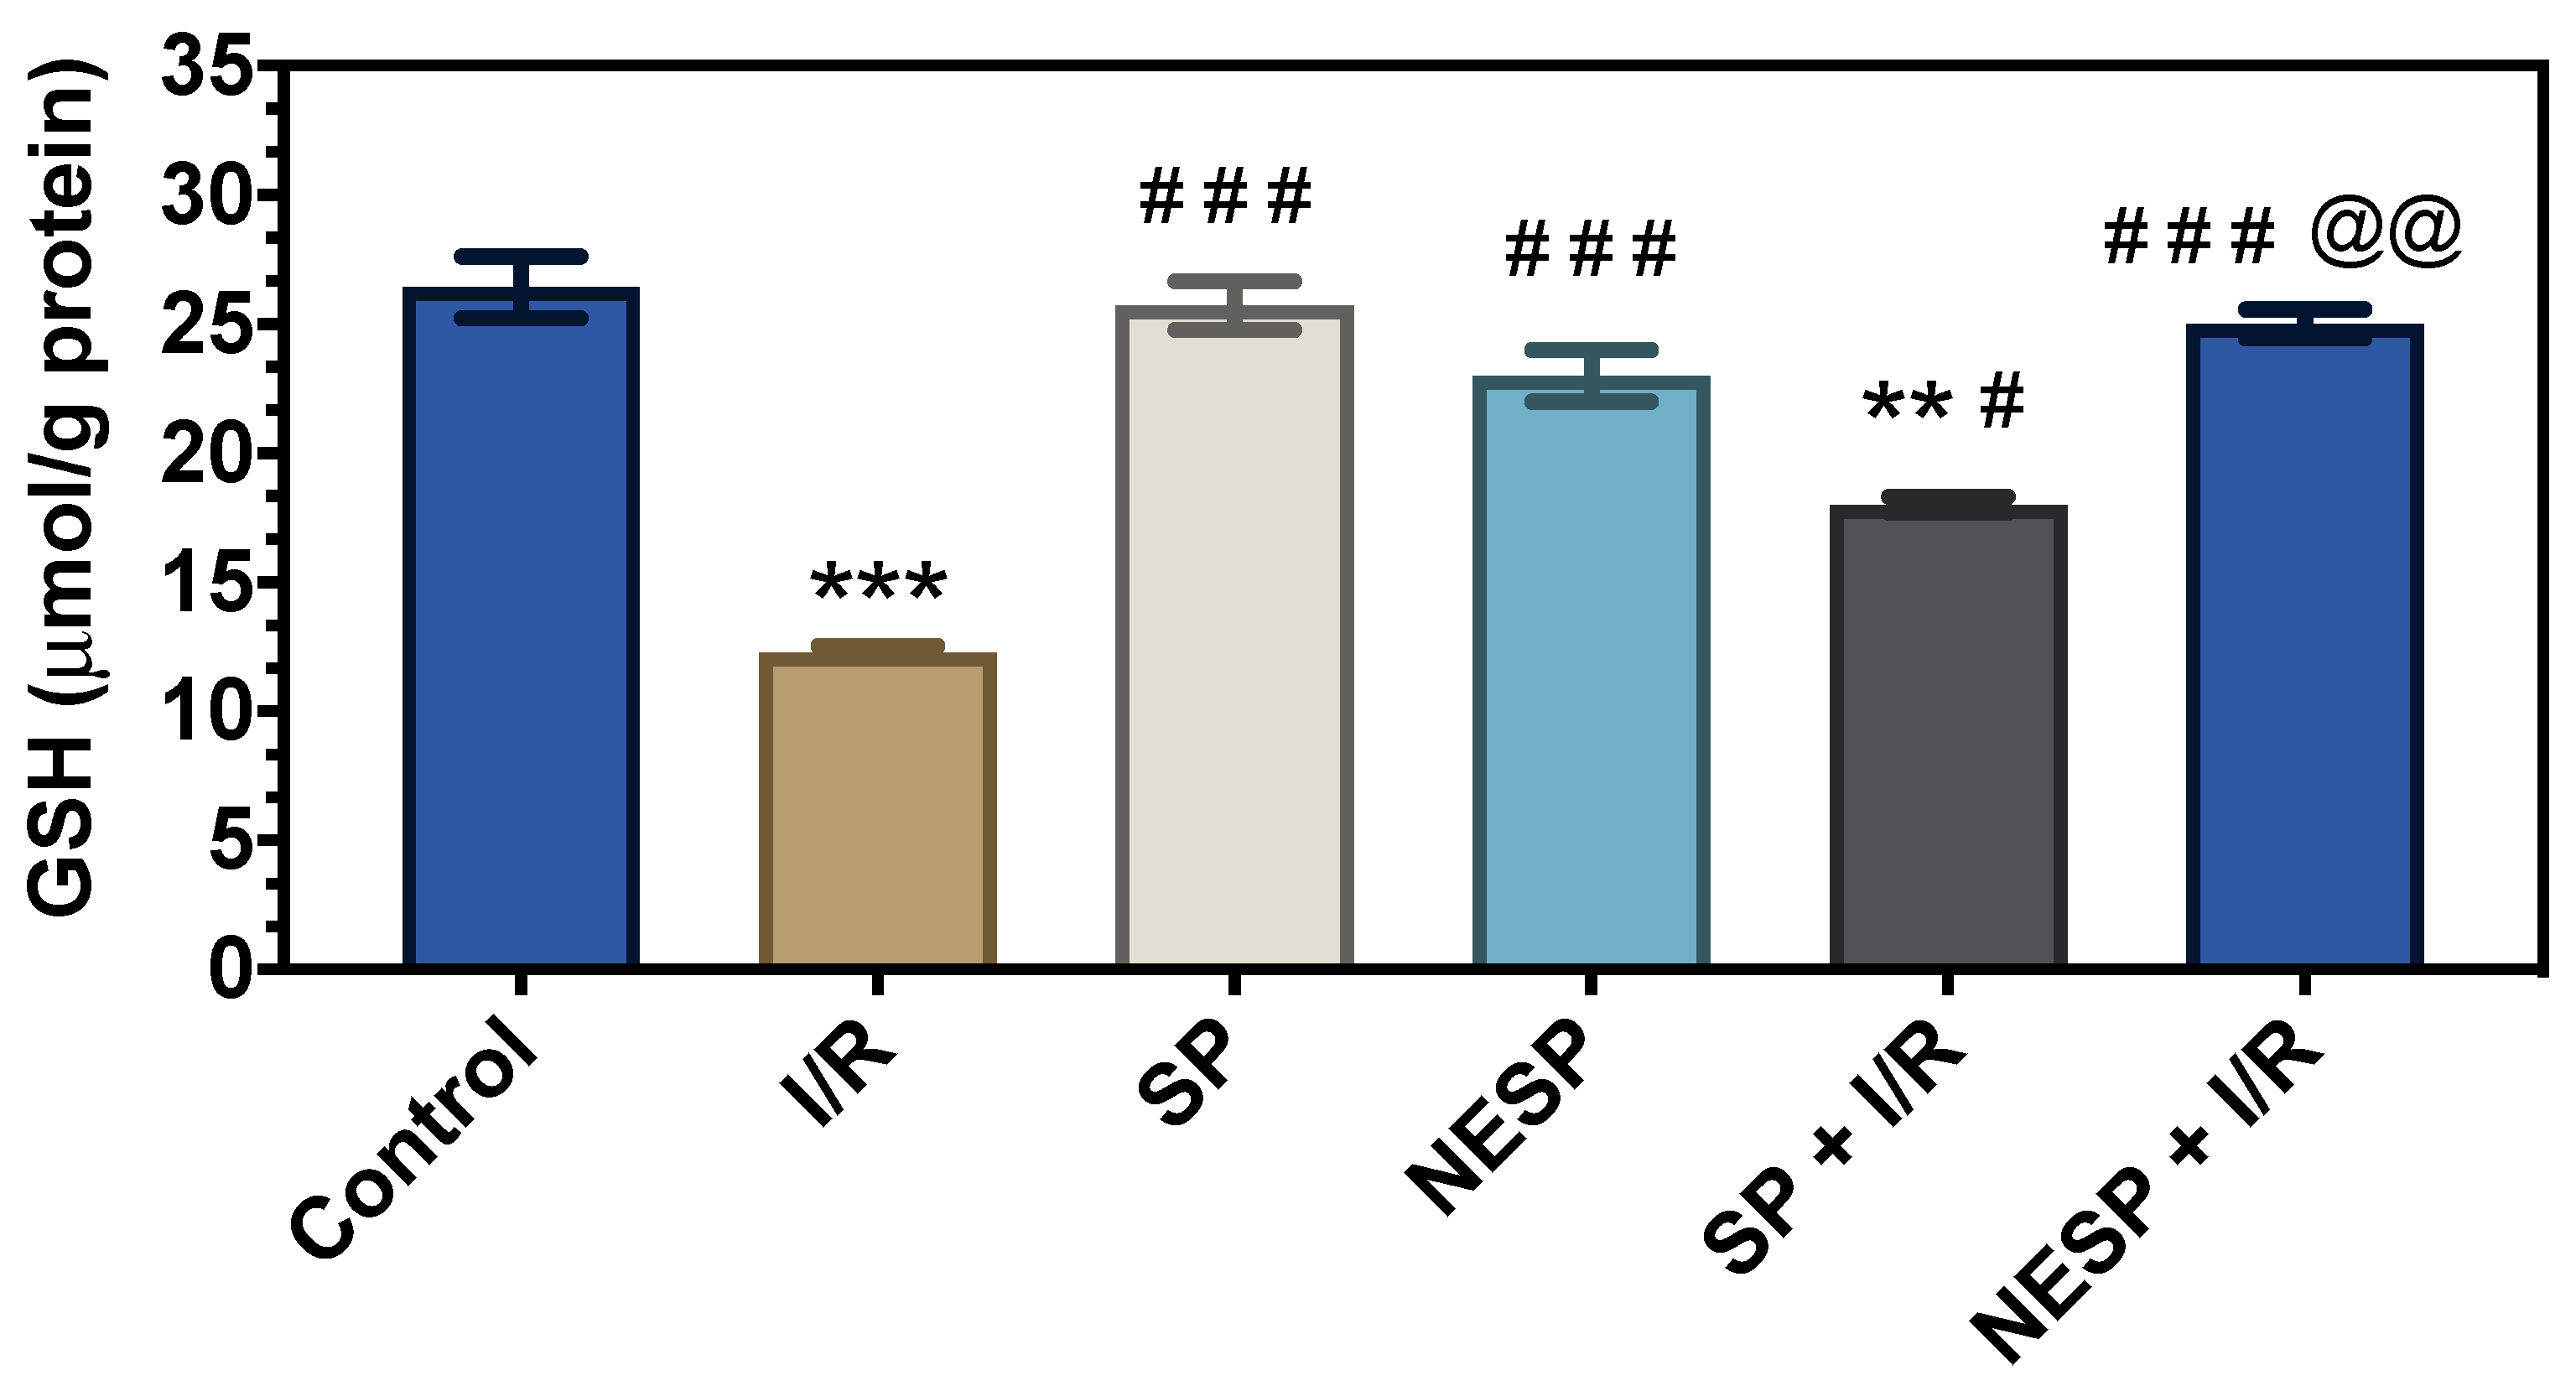
Figure 3 shows the differences in the levels of GSH in the kidney of different animal groups. There was a significant decrease in the GSH content of I/R group (12.3 ± 0.23 μmol/g) compared to the control rats (26.42 ± 1.2 μmol/g) (p < 0.001). Administration of SP to I/R group increased the renal GSH content (18.0 ± 0.31 μmol/g) compared to I/R group (12.3 ± 0.23 μmol/g) (p < 0.05), but could not completely restore the decreased GSH content compared to the control rats (p < 0.01). However, oral administration of NESP to I/R rats corrected the decreased levels of GSH (25.0 ± 0.56 μmol/g) without any significant difference compared to the control rat experiment (26.42 ± 1.2 μmol/g) (p = 0.99). Furthermore, NESP administration to the I/R group induced greater increase in renal GSH (25.0 ± 0.56) compared to the SP-treated I/R group (18 ± 0.31) (p < 0.01). Administration of SP and NESP to healthy rats could not significantly alter renal GSH content compared to control rats (p = 1.0, p = 0. 73, respectively) (Figure 3).
Renal activities of SOD and CAT at the end of experiments have been demonstrated in Figure 4. There was a significant decrease in the renal SOD activity in theI/R group (7.1 ± 0.23 U/mg) than the control group (11.59 ± 0.11 U/mg) (p < 0.001). Administration of SP and NESP to the I/R group increased the renal SOD activity (9.0 ± 0.04 and 10.33 ± 0.08 U/mg, respectively) compared to the I/R group (7.1 ± 0.23 U/mg) (p < 0.01 and p < 0.001, respectively). However, NESP administration to I/R group could completely normalize the altered SOD activity (p = 0.31). Furthermore, NESP administered I/R rats showed greater increase in renal SOD activity (10.33 ± 0.08 U/mg) compared to SP-treated I/R rats (9.0 ± 0.04 U/mg) (p < 0.05) as shown in the left panel of Figure 4.
In the I/R group, there was a significant decrease in the renal CAT activity (2.9 ± 0.5 U/mg) compared to the control rats (6.4 ± 0.2 U/mg) (p < 0.01) (right panel of Figure 4). There were no significant difference in CAT activity between SP and NESP groups (5.9 ± 0.19 and 7.0 ± 0.36 U/mg, respectively) compared to control rats (6.4 ± 0.2 U/mg) (p = 0.65, p = 0. 89, respectively). Although administration of SP in the I/R group increased renal CAT activity (4.57 ± 0.12 U/mg) compared to I/R group (2.9 ± 0.5 U/mg), there was still a significant difference compared to the control rats (6.4 ± 0.2 U/mg) (p < 0.01). The oral administration of NESP to the I/R group increased renal CAT activity significantly (6.18 ± 0.15 U/mg) compared to the I/R group (2.9 ± 0.5 U/mg) (p < 0.001) and, in this regard, there was no significant difference compared to control animals (p = 1.0). Furthermore, there was a significant difference in the renal CAT activity between SP and NESP-administered I/R groups (6.18 ± 0.15 and 4.57 ± 0.12 U/mg, respectively) (p < 0.05).
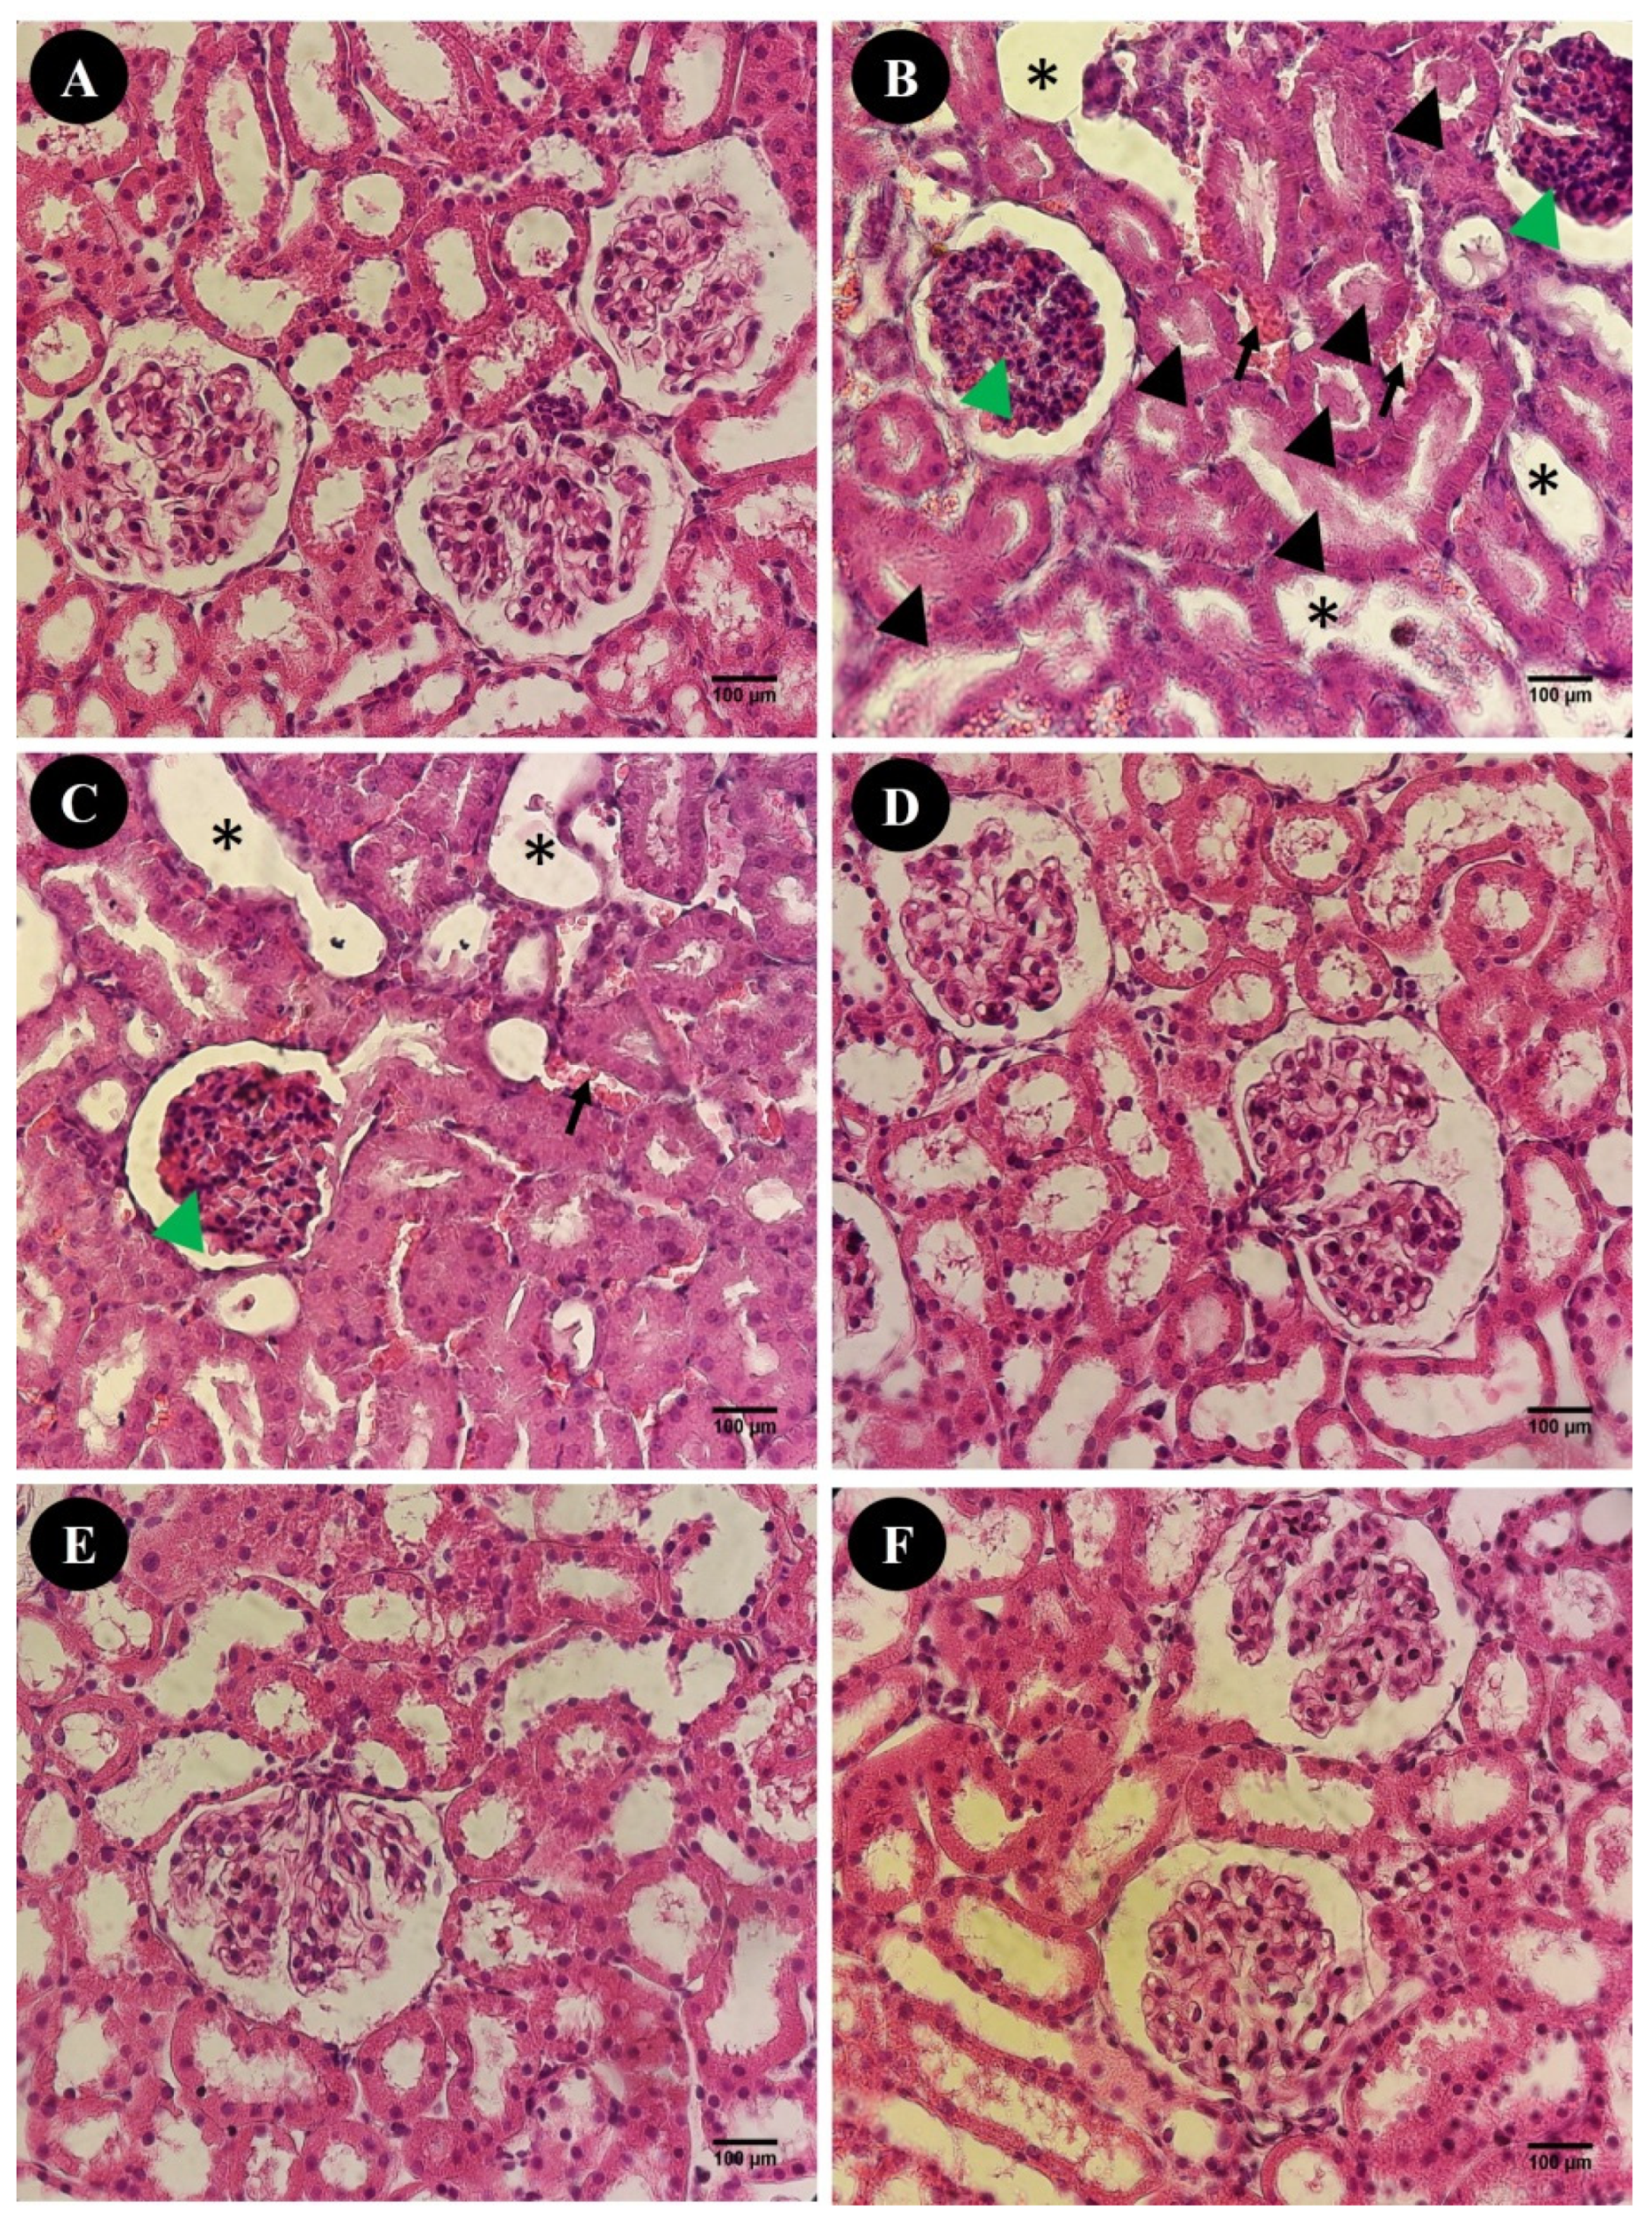
Figure 5A demonstrates normal histology of kidney in control rats. The kidneys of the rats subjected to I/R exhibited pathological alterations such as tubular dilation, glomerular atrophy, tubular cast formation and hemorrhage, as shown in the Figure 5B. Although SP treatment tried to minimize most of the abnormal renal features, there were still some signs of injury including tubular dilation, glomerular atrophy and hemorrhage (Figure 5C). However, in rats undergoing renal ischemia, treatment by NESP alleviated all the abnormal renal histological features and restored the normal histological structure, as displayed in Figure 5D. Sections from SP and NESP groups presented normal kidney architecture without tubular dilation, glomerular atrophy, cast formation and hemorrhage, as depicted in Figure 5E,F.
We also evaluated the effects of SP and NESP on the renal biomarkers. The difference in the renal functional biomarkers in the different rat groups have been depicted in Table 1. Induction of I/R induced significant increase in the serum levels of urea and creatinine (p < 0.001). There were no significant differences in the levels of urea in free SP and NESP-treated rats compared to the control animals (p = 1.0, p = 0. 99, respectively). The levels of creatinine also had no significant changes in free SP- and NESP-treated rats compared to the control rats (p = 0.83, p = 0. 92, respectively). Although administration of SP could decrease the levels of urea and creatinine in the I/R group, there was still significant differences in the levels of urea (p < 0.001) and creatinine (p < 0.01) compared to the control rats. Administration of NESP to the I/R group could restore the elevated levels of urea and creatinine and, therefore, we can claim that there was no significant difference between the NESP-administered I/R group and control rats in serum urea and creatinine levels (p = 0.74, p = 0. 93, respectively) (Table 1). Furthermore, NESP was more efficient than SP in decreasing the serum urea and creatinine in the I/R group compared to the SP-administered I/R group. In this regard, there were significant differences in the urea (p < 0.01) and creatinine (p < 0.05) between the NESP-treated I/R group and the SP-treated I/R group, as depicted in Table 1.
There was a significant decrease in the serum TP of the I/R group compared to the control rats (p < 0.001) (Table 1). Although SP administration increased the levels of TP in I/R rats, there was still a difference compared to the control rats (p < 0.01). Administration of NESP to the I/R group could completely restore the decreased levels of TP. NESP-treated I/R group showed increased levels of serum TP compared to SP-treated I/R rats (p < 0.05). Furthermore, administration of SP and NESP did not alter the serum TP in healthy animals compared to the control rats (p = 0.68, p = 0. 87, respectively).
Regarding serum uric acid levels, there was a significant increase in the uric acid levels in I/R rats compared to the controls (p < 0.001, Table 1). Administration of SP and NESP could not significantly alter uric acid levels compared to the control rats (p = 0.89, p = 0. 98, respectively). In I/R rats, administration of SP decreased the uric acid, but its level was still significantly different from the control rats (p < 0.001). However, NESP administration in I/R group decreased the uric acid levels, so that there was no significant changes compared to the control rats (p = 0.90). Furthermore, NESP had greater effect in decreasing the uric acid in NESP-treated I/R group compared to SP-treated I/R group (p < 0.01).

4. Discussion

To the best of the authors’ knowledge, there is no previous study investigating the effects of NESP on animal models of renal injury; therefore, our study is the first report comparing the effects of orally administration of free SP and NESP in a rat model of renal I/R. Our results were quite promising in showing the beneficial effects of orally-administered NESP pre-treatment (20 mg/kg) for 2 days before ischemia induction compared to free SP, administered in the same period, on improvement of renal injury through normalizing oxidant/antioxidant imbalance, renal biomarkers and histological features in rats.
Multiple factors including hypoxia, inflammatory responses and ROS production are involved in I/R-induced renal injury. Renal blood flow reduction during ischemia plays an important role in the pathophysiology of renal injury [40]. On the other hand, it has been indicated that mineralocorticoids have an important role in regulating renal vasculature tone and renal hemodynamic. Considering the role of aldosterone as a mineralocorticoid hormone in the pathophysiology of renal injury [45,46], it seems that aldosterone antagonists such as SP have beneficial effects on renal injury induced by aldosterone [14,47].
In the present study, the serum creatinine and urea levels in the I/R group increased significantly compared to the control group. The mechanism by which these two renal functional parameters increased is due to low renal blood flow and, consequently, decline in glomerular filtration rate. Treatment with SP and NESP led to a decrease in the level of urea and creatinine in the serum of ischemic rats. This supportive effect is due to the antagonistic action of these two substances against aldosterone. Previous studies showed similar findings regarding the effects of SP treatment in renal ischemia models on improving renal function [30]. In the present work, NESP showed an advantage over SP in renal biomarkers assays by correcting all the alterations in ischemic rats. In this regard, NESP decreased urea, creatinine and uric acid and increased TP compared to SP-treated I/R rats (Table 1).
In this study, rats undergoing renal ischemia exhibited severe structural alterations of the kidney including severe tubular dilation, epithelial desquamation, cast formation and tubulointerstitial fibrosis. In rats exposed to SP before renal I/R, most of the abnormal renal histological features were alleviated, but there were still some signs of damage like dilation and tubulointerstitial fibrosis. However, NESP treatment in rats subjected to renal I/R blocked all the severe alterations in kidney histology and restored normal renal histology similar to control rats.
Previous studies have shown that inflammatory cytokines such as TNF-α and IL-1β increase in the renal ischemic model [48,49]. The increase in these inflammatory cytokines is due to hypoxia followed by decreased renal blood flow. Elevated levels of inflammatory cytokines lead to increased infiltration of inflammatory cells into damaged tissue [14]. In this study, we also found infiltration of inflammatory cells into the renal tissue in the I/R group. Treatment with SP significantly reduced infiltration of inflammatory cells into the kidneys of I/R rats. However, we observed more protection against infiltration of inflammatory cells with NESP treatment.
Furthermore, renal ischemia induces hypoxia followed by decreased renal blood, which leads to ROS production and finally tubular cell injury and histological damage. Tissue damage such as tubular dilatation and tubular epithelial cell shedding were also observed in the present study in the I/R group. It is well known that histological damage is associated with MDA content as a marker of ROS generation [14]. Administration of NESP showed important advantages over SP in correcting oxidant/antioxidant imbalance induced by I/R exposure in rats. In this regard, NESP administration in I/R rats induced a greater decrease in MDA and increment in GSH, SOD and CAT compared to the SP-treated I/R rat. In agreement with our finding, Mejía-Vilet et al. demonstrated that the expression of antioxidant enzymes such as SOD and glutathione peroxidase at mRNA level was increased after SP administration in ischemic kidneys [14]. It has been reported that aldosterone can induce ROS generation in cultured mesangial cells [49]; therefore, it seems that the beneficial effects of SP and NESP on correcting oxidant/antioxidant imbalance in this study are partly due to the mineralocorticoid antagonism effect of SP and resultant reduction of renal ROS generation.
It should be noted that the better effectiveness of NESP compared to SP treatment over the same period (two days before ischemia) might be due to its better availability. In fact, SP has poor availability due to low aqueous solubility. In order enhance SP bioavailability, different methods have been used including simultaneous administration of surface active agents, micronization of SP [50], complexation of SP with cyclodextrin [51,52] and utilization of microsomal carriers [23]. Indeed, it was demonstrated that drug delivery via liposomal carrier enhances the bioavailability of drugs, therefore improving longevity, target-ability, distribution characteristics and therapeutic efficacy [19]. Long-term administration of SP in clinic is associated with several side effects such as gynecomastia, menstrual irregularities and decrease in libido due to nonselective progesterone receptor agonistic and androgen receptor antagonistic activity of SP [23]. Therefore, enhancement of the bioavailability of SP with microsomal encapsulation could be a useful therapeutic strategy in patients for reducing dose and period of drug administration and, therefore, decreasing these undesired side effects. However, we should notice that we administered NESP for two days in the present study; therefore, in order to better profile SP side effects in the long-term use such as gynecomastia, a full characterization of biochemical and pathological alterations especially in mammary glands is warranted in future works.

5. Conclusions

Taken together, the results reported in the present study show the beneficial effects of orally-administered NESP (20 mg/kg) two days before induction of ischemia over free SP administered in the same period in a rat model of I/R. Our findings indicated that NESP has a better efficacy in correcting renal oxidative stress, renal biomarker alterations and abnormal kidney structure in I/R exposed rats, which could be attributed to the enhanced drug bioavailability and drug delivery in a nano-carrier system.

Author Contributions

Conceptualization, A.R.; methodology, P.H., A.R., M.B., S.Y.; investigation, P.H., A.R., M.B., S.Y.; resources, P.H., A.R., M.B., F.B., S.Y.; writing—original draft preparation, P.H., A.R., M.B., S.Y.; writing—review and editing, F.B.; supervision, A.R.; funding acquisition, P.H., A.R., F.B. All authors have read and agreed to the published version of the manuscript.

Funding

The research leading to these results has received funding from the University of Zabol under Grant agreement numbers UOZ-GR-9618-21 and UOZ-GR-9618-170.

Institutional Review Board Statement

The study was conducted according to the guidelines of the Declaration of Helsinki, and approved by the Animal Ethics Committee of Bu-Ali Sina University (no. 12-2240).

Data Availability Statement

Data supporting reported results can be made available on demand.

Acknowledgments

Authors would like to thank Nikhil Bhalla (Ulster University, UK) for his technical inputs on the experiments and edits in the manuscript.

Conflicts of Interest

The authors declare no conflict of interest.

References

  1. Weight, S.C.; Bell, P.R.F.; Nicholson, M.L. Renal ischae-mia-reperfusion injury. Br. J. Surg. 1996, 83, 162–170. [Google Scholar] [PubMed]
  2. Kelly, K.J.; Molitoris, B. Acute renal failure in the new millennium: Time to consider combination therapy. Semin. Nephrol. 2000, 20, 4–19. [Google Scholar] [PubMed]
  3. Matejovic, M.; Ince, C.; Chawla, L.S.; Blantz, R.; Molitoris, B.A.; Rosner, M.H.; Okusa, M.D.; Kellum, J.A.; Ronco, C. Renal Hemodynamics in AKI: In Search of New Treatment Targets. J. Am. Soc. Nephrol. 2016, 27, 49–58. [Google Scholar] [CrossRef] [PubMed] [Green Version]
  4. Sharfuddin, A.A.; Molitoris, B.A. Pathophysiology of ischemic acute kidney injury. Nat. Rev. Nephrol. 2011, 7, 189–200. [Google Scholar] [CrossRef] [PubMed]
  5. Kelly, K. Acute Renal Failure: Much More Than a Kidney Disease. Semin. Nephrol. 2006, 26, 105–113. [Google Scholar] [CrossRef] [PubMed]
  6. Bonventre, J.V.; Yang, L. Cellular pathophysiology of ischemic acute kidney injury. J. Clin. Investig. 2011, 121, 4210–4221. [Google Scholar] [CrossRef]
  7. Blasi, E.R.; Rocha, R.; Rudolph, A.E.; Blomme, E.A.; Polly, M.L.; McMahon, E.G. Aldosterone/salt induces renal inflammation and fi-brosis in hypertensive rats. Kidney Int. 2003, 63, 1791–1800. [Google Scholar] [CrossRef] [Green Version]
  8. Greene, E.L.; Kren, S.; Hostetter, T.H. Role of aldosterone in the remnant kidney model in the rat. J. Clin. Investig. 1996, 98, 1063–1068. [Google Scholar] [CrossRef]
  9. Han, S.Y.; Kim, C.H.; Kim, H.S.; Jee, Y.H.; Song, H.K.; Lee, M.H.; Han, K.H.; Kim, H.K.; Kang, Y.S.; Han, J.Y.; et al. Spironolactone prevents diabetic nephropathy through an anti-inflammatory mechanism in type 2 diabetic rats. J. Am. Soc. Nephrol. 2006, 17, 1362–1372. [Google Scholar] [CrossRef] [Green Version]
  10. Trachtman, H.; Weiser, A.; Valderrama, E.; Morgado, M.; Palmer, L.S. Prevention of renal fibrosis by spironolactone in mice with complete unilateral ureteral obstruction. J. Urol. 2004, 172, 1590–1594. [Google Scholar] [CrossRef]
  11. Hostetter, T.H.; Ibrahim, H.N. Aldosterone in Chronic Kidney and Cardiac Disease. J. Am. Soc. Nephrol. 2003, 14, 2395–2401. [Google Scholar] [CrossRef] [PubMed] [Green Version]
  12. Pérez-Rojas, J.; Blanco, J.A.; Cruz, C.; Trujillo, J.; Vaidya, V.S.; Uribe, N.; Bonventre, J.V.; Gamba, G.; Bobadilla, N.A. Mineralocorticoid receptor blockade confers renoprotection in preexisting chronic cyclosporine ne-phrotoxicity. Am. J. Physiol.-Renal Physiol. 2007, 292, F131–F139. [Google Scholar] [CrossRef] [PubMed]
  13. Sánchez-Pozos, K.; Barrera-Chimal, J.; Garzón-Muvdi, J.; Pérez-Villalva, R.; Rodríguez-Romo, R.; Cruz, C.; Gamba, G.; Bobadilla, N.A. Recovery from ischemic acute kidney injury by spironolactone administration. Nephrol. Dial. Transplant. 2012, 27, 3160–3169. [Google Scholar] [CrossRef] [PubMed] [Green Version]
  14. Mejía-Vilet, J.M.; Ramírez, V.; Cruz, C.; Uribe, N.; Gamba, G.; Bobadilla, N.A. Renal ischemia-reperfusion injury is prevented by the mineralocor-ticoid receptor blocker spironolactone. Am. J. Phys.-Renal Physiol. 2007, 293, F78–F86. [Google Scholar] [CrossRef] [PubMed] [Green Version]
  15. Dong, D.; Fan, T.-T.; Ji, Y.-S.; Yu, J.-Y.; Wu, S.; Zhang, L. Spironolactone alleviates diabetic nephropathy through promoting autophagy in podocytes. Int. Urol. Nephrol. 2019, 51, 755–764. [Google Scholar] [CrossRef] [PubMed] [Green Version]
  16. Kong, E.L.; Zhang, J.M.; An, N.; Tao, Y.; Yu, W.F.; Wu, F.X. Spirono-lactone rescues renal dysfunction in obstructive jaundice rats by upregulating ACE2 expression. J. Cell Commun. Signal. 2019, 13, 17–26. [Google Scholar] [CrossRef] [PubMed]
  17. Abolghasmi, R.; Taziki, O. Efficacy of low dose spironolactone in chronic kidney disease with resistant hypertension. Saudi J. Kidney Dis. Transplant. 2011, 22, 75–78. [Google Scholar]
  18. Blouza, I.L.; Charcosset, C.; Sfar, S.; Fessi, H. Preparation and characterization of spironolactone-loaded nanocapsules for paediatric use. Int. J. Pharm. 2006, 325, 124–131. [Google Scholar] [CrossRef]
  19. Al-Jamal, W.T.; Kostarelos, K. Liposome–nanoparticle hybrids for multimodal diagnostic and therapeutic applications. Nanomedicine 2007, 2, 85–98. [Google Scholar] [CrossRef]
  20. Elbayoumi, T.A.; Torchilin, V.P. Current trends in liposome re-search. Methods Mol. Biol. 2010, 605, 1–27. [Google Scholar]
  21. Giddam, A.K.; Zaman, M.; Skwarczynski, M.; Toth, I. Liposome based delivery system for vaccine candidates: Constructing an effective formu-lation. Nanomedicine 2012, 7, 1877–1893. [Google Scholar] [CrossRef] [PubMed]
  22. Ji, W.-J.; Ma, Y.-Q.; Zhang, X.; Zhang, L.; Zhang, Y.-D.; Su, C.-C.; Xiang, G.-A.; Zhang, M.-P.; Lin, Z.-C.; Wei, L.-Q.; et al. Inflammatory monocyte/macrophage modulation by lipo-some-entrapped spironolactone ameliorates acute lung injury in mice. Nanomedicine 2016, 11, 1393–1406. [Google Scholar] [CrossRef] [PubMed] [Green Version]
  23. Salama, A.; Badran, M.; Elmowafy, M.; Soliman, G.M. Spirono-lactone-loaded leciplexes as potential topical delivery systems for female acne: In vitro appraisal and ex vivo skin permeability studies. Pharmaceutics 2020, 12, 25. [Google Scholar] [CrossRef] [PubMed] [Green Version]
  24. Jayaprakasha, G.K.; Murthy, K.N.C.; Patil, B.S. Enhanced colon cancer chemoprevention of curcumin by nanoencapsulation with whey protein. Eur. J. Pharmacol. 2016, 789, 291–300. [Google Scholar] [CrossRef] [PubMed] [Green Version]
  25. Minaei, A.; Sabzichi, M.; Ramezani, F.; Hamishehkar, H.; Samadi, N. Co-delivery with nano-quercetin enhances doxorubicin-mediated cyto-toxicity against MCF-7 cells. Mol. Biol. Rep. 2016, 43, 99–105. [Google Scholar] [CrossRef] [PubMed]
  26. Onsori, H.; Rahmati, M. Investigation of the anti-cancer effects of free and PLGA-PAA encapsulated Hydroxytyrosol on the MCF-7 breast cancer cell line. Curr. Mol. Med. 2020, 20, 1–7. [Google Scholar] [CrossRef]
  27. Varshney, M.; Morey, T.E.; Shah, D.O.; Flint, J.A.; Moudgil, B.M.; Seubert, C.N.; Dennis, D.M. Pluronic microemulsions as nanoreservoirs for ex-traction of bupivacaine from normal saline. J. Am. Chem. Soc. 2004, 126, 5108–5112. [Google Scholar] [CrossRef] [Green Version]
  28. Finsy, R. Particle sizing by quasi-elastic light scattering. Adv. Colloid Interface Sci. 1994, 52, 79–143. [Google Scholar] [CrossRef]
  29. Rahdar, A.; Almasi-Kashi, M.; Khan, A.M.; Aliahmad, M.; Salimi, A.; Guettari, M.; Kohne, H.E.G. Effect of ion exchange in naaot surfactant on droplet size and location of dye within rhodamine b (rhb)-containing micro-emulsion at low dye concentration. J. Mol. Liquids 2018, 252, 506–513. [Google Scholar] [CrossRef]
  30. Brown, W. Dynamic Light Scattering: The Method and Some Application; Clarendon Press: Oxford, England, 1993. [Google Scholar]
  31. Feria, I.; Pichardo, I.; Juárez, P.; Ramírez, V.; González, M.A.; Uribe, N.; García-Torres, R.; López-Casillas, F.; Gamba, G.; Bobadilla, N.A. Thera-peutic benefit of spironolactone in experimental chronic cyclosporine A ne-phrotoxicity. Kidney Int. 2003, 63, 43–52. [Google Scholar] [CrossRef] [Green Version]
  32. Mcauley, F.T.; Whiting, P.H.; Thomson, A.W.; Simpson, J.G. The influence of enalapril or spironolactone on experimental cyclosporin ne-phrotoxicity. Biochem. Pharm. 1987, 36, 699–703. [Google Scholar] [CrossRef]
  33. Saraç, F.; Kilincaslan, H.; Kılıc, E.; Koldaş, M.; Terzi, E.H.; Aydogdu, I.; Kilic, E.; Kılıncaslan, H. Methylene blue attenuates renal ischemia–reperfusion injury in rats. J. Pediatr. Surg. 2015, 50, 1067–1071. [Google Scholar] [CrossRef] [PubMed]
  34. Moore, K.; Roberts, L.J. Measurement of Lipid Peroxidation. Free. Radic. Res. 1998, 28, 659–671. [Google Scholar] [CrossRef] [PubMed]
  35. Ellman, G.L. Tissue sulfhydryl groups. Arch. Biochem. Biophys. 1959, 82, 70–77. [Google Scholar] [CrossRef]
  36. Beauchamp, C.; Fridovich, I. Superoxide dismutase: Improved assays and an assay applicable to acrylamide gels. Anal. Biochem. 1971, 44, 276–287. [Google Scholar] [CrossRef]
  37. Claiborne, A. Catalase Activity. In CRC Hand-Book of Methods for Oxygen Radical Research; Greenwald, R.A., Ed.; CRC: Boca Raton, FL, USA, 1985; pp. 283–284. [Google Scholar]
  38. Bradford, M.M. A rapid and sensitive method for the quantitation of microgram quantities of protein utilizing the principle of protein-dye binding. Anal. Biochem. 1976, 72, 248–254. [Google Scholar] [CrossRef]
  39. Caraway, W.T. Uric acid. In Standard Methods of Clinical Chemistry; Academic Press: New York, NY, USA, 1963; pp. 239–247. [Google Scholar]
  40. Molitoris, B.A.; Sutton, T.A. Endothelial injury and dysfunction: Role in the extension phase of acute renal failure. Kidney Int. 2004, 66, 496–499. [Google Scholar] [CrossRef] [Green Version]
  41. Rahdar, A.; Hajinezhad, M.R.; Nasri, S.; Beyzaei, H.; Barani, M.; Trant, J. The synthesis of methotrexate-loaded F127 microemulsions and their in vivo toxicity in a rat model. J. Mol. Liq. 2020, 313, 113449. [Google Scholar] [CrossRef]
  42. Rahdar, A.; Taboada, P.; Hajinezhad, M.R.; Barani, M.; Beyzaei, H. Effect of tocopherol on the properties of Pluronic F127 mi-croemulsions: Physico-chemical characterization and in vivo toxicity. J. Mol. Liq. 2019, 277, 624–630. [Google Scholar] [CrossRef]
  43. Barani, M.; Mirzaei, M.; Torkzadeh-Mahani, M.; Adeli-Sardou, M. Evaluation of Carum-loaded Niosomes on Breast Cancer Cells: Physicochemical Properties, In Vitro Cytotoxicity, Flow Cytometric, DNA Fragmenta-tion and Cell Migration Assay. Sci. Rep. 2019, 9, 1–10. [Google Scholar] [CrossRef] [Green Version]
  44. Barani, M.; Mirzaei, M.; Torkzadeh-Mahani, M.; Lohrasbi-Nejad, A.; Nematollahi, M.H. A new formulation of hydrophobin-coated niosome as a drug carrier to cancer cells. Mater. Sci. Eng. C 2020, 113, 110975. [Google Scholar] [CrossRef] [PubMed]
  45. Brown, N.J. Aldosterone and end-organ damage. Curr. Opin. Nephrol. Hypertens. 2005, 14, 235–241. [Google Scholar] [CrossRef] [PubMed] [Green Version]
  46. Nishiyama, A.; Abe, Y. Molecular Mechanisms and Therapeutic Strategies of Chronic Renal Injury: Renoprotective Effects of Aldosterone Blockade. J. Pharmacol. Sci. 2006, 100, 9–16. [Google Scholar] [CrossRef] [PubMed] [Green Version]
  47. Pérez-Rojas, J.M.; Derive, S.; Blanco, J.A.; Cruz, C.; De La Maza, L.M.; Gamba, G.; Bobadilla, N.A. Renocortical mRNA expression of vaso-active factors during spironolactone protective effect in chronic cyclosporine nephrotoxicity. Am. J. Physiol. Renal Physiol. 2005, 289, F1020–F1030. [Google Scholar]
  48. Barrera-Chimal, J.; Pérez-Villalva, R.; Rodríguez-Romo, R.; Reyna, J.; Uribe, N.; Gamba, G.; Bobadilla, N.A. Spironolactone prevents chronic kid-ney disease caused by ischemic acute kidney injury. Kidney Int. 2013, 83, 93–103. [Google Scholar] [CrossRef] [PubMed] [Green Version]
  49. Miyata, K.; Rahman, M.; Shokoji, T.; Nagai, Y.; Zhang, G.-X.; Sun, G.-P.; Kimura, S.; Yukimura, T.; Kiyomoto, H.; Kohno, M.; et al. Aldosterone Stimulates Reactive Oxygen Species Production through Activation of NADPH Oxidase in Rat Mesangial Cells. J. Am. Soc. Nephrol. 2005, 16, 2906–2912. [Google Scholar] [CrossRef] [PubMed] [Green Version]
  50. McInnes, G.T.; Asbury, M.J.; Ramsay, L.E.; Shelton, J.R.; Harrison, I.R. Effect of micronization on the bioavailability and pharmacologic activ-ity of spironolactone. J. Clin. Pharmacol. 1982, 22, 410–417. [Google Scholar] [CrossRef] [PubMed]
  51. Yusuff, N.T.; York, P.; Chrystyn, H.; Bramley, P.N.; Swallow, R.D.; Tuladhar, B.R.; Losowsky, M.S. Improved bioavailability from a spironolactone beta-cyclodextrin complex. Eur. J. Clin. Pharmacol. 1991, 40, 507–511. [Google Scholar] [CrossRef]
  52. Abosehmah-Albidy, A.Z.M.; York, P.; Wong, V.; Losowsky, M.S.; Chrystyn, H. Improved bioavailability and clinical response in patients with chronic liver disease following the administration of a spironolactone: β-cyclodextrin complex. Br. J. Clin. Pharmacol. 1997, 44, 35–39. [Google Scholar] [CrossRef]
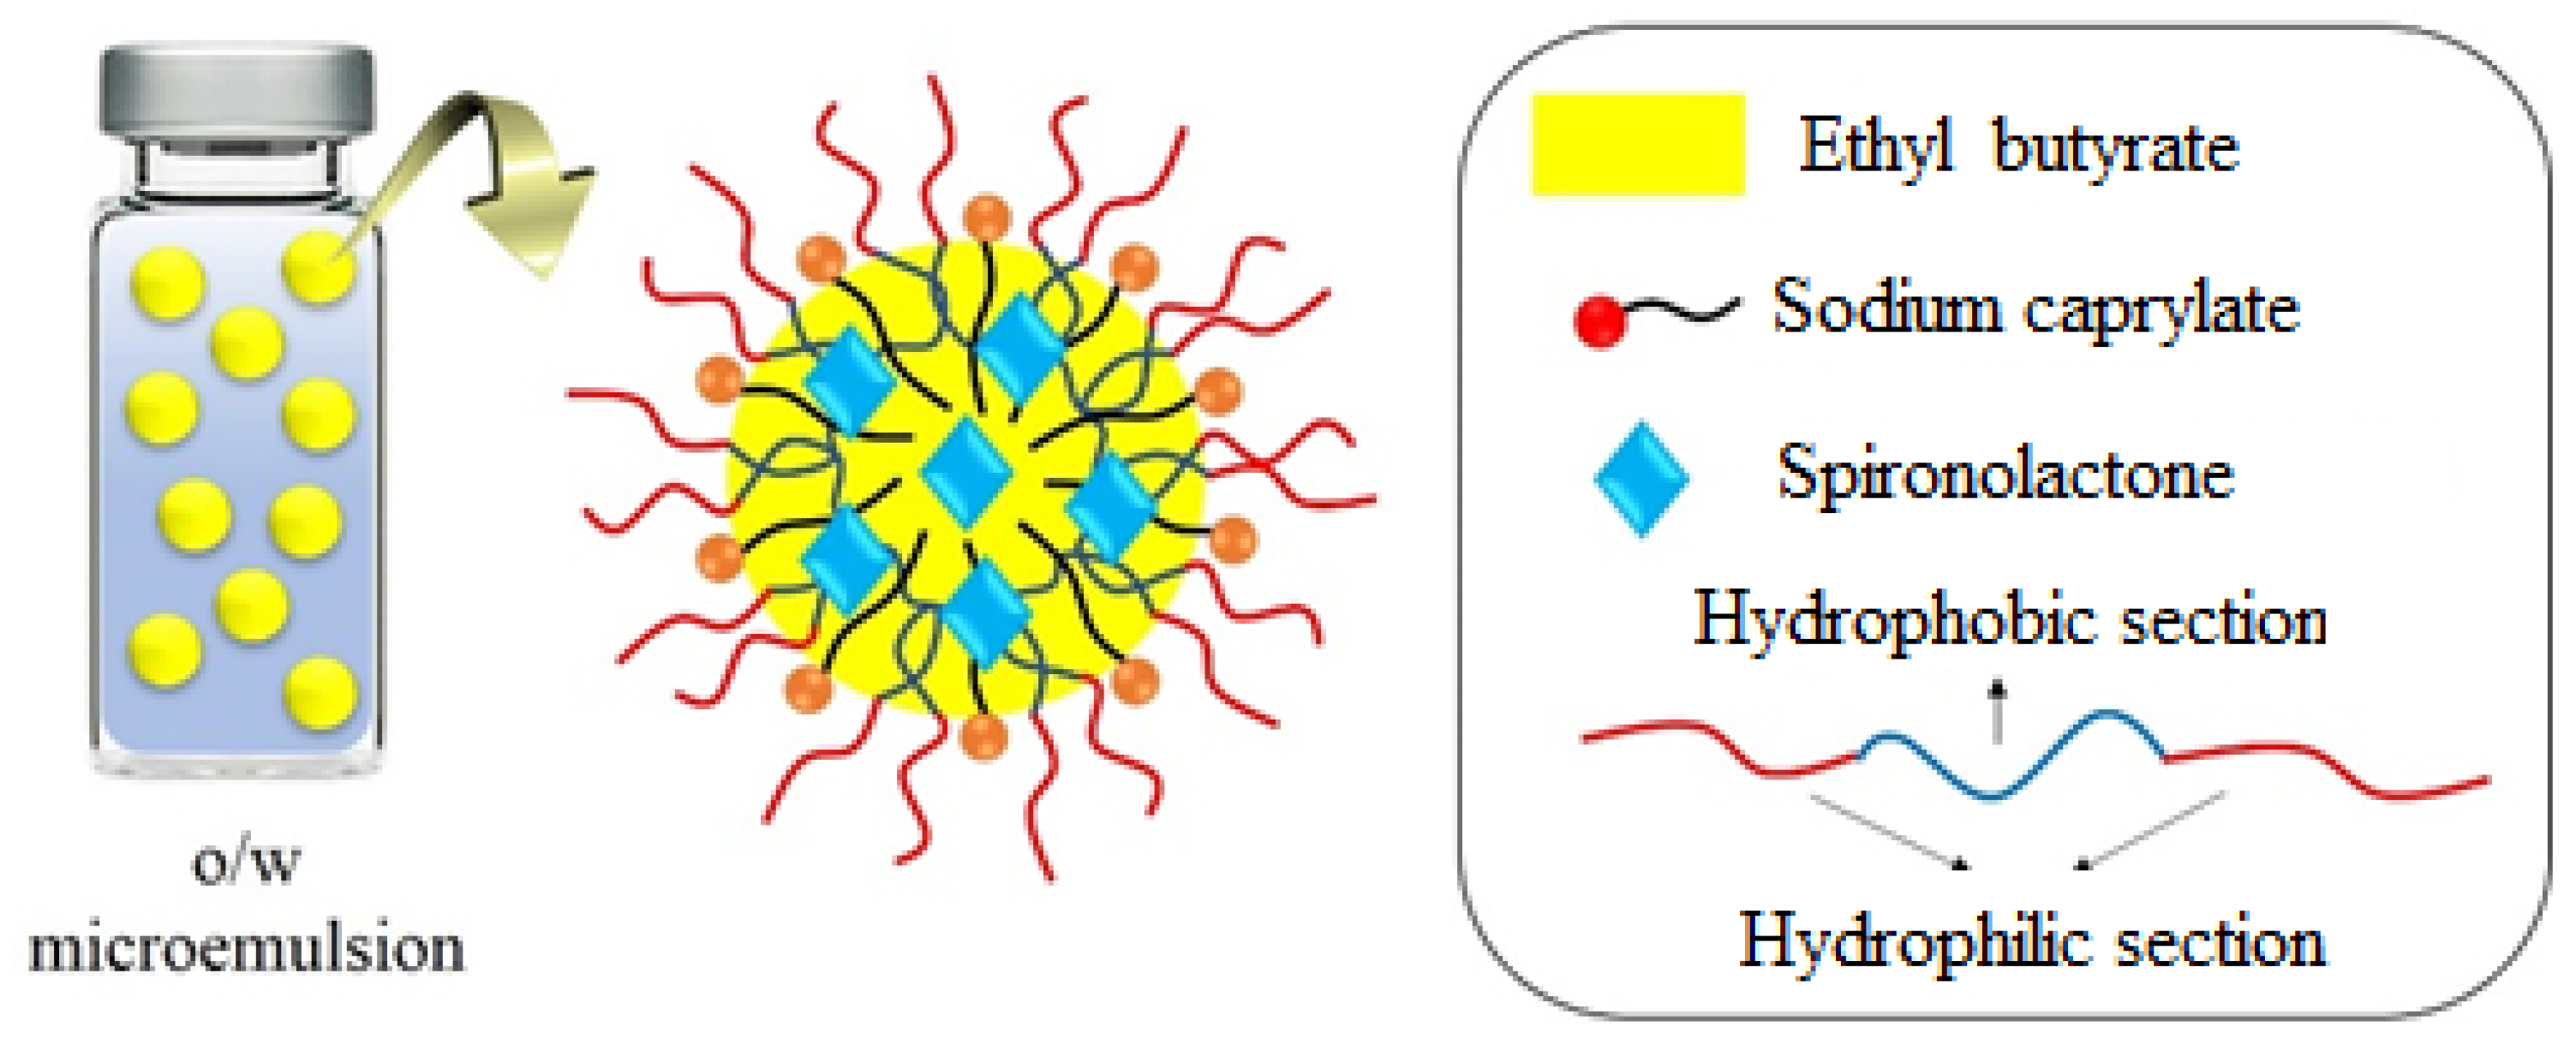
Scheme 1. Schematic of droplet microemulsions.
Applsci 11 01264 sch001
Figure 1. Dynamic Light Scattering autocorrelation function of microemulsions.
Applsci 11 01264 g001
Figure 2. Levels of renal malondialdehyde (MDA), an index of lipid peroxidation, in different animal groups (n = 8) at the end of interventions: Control, ischemic/reperfusion (I/R), spironolactone (SP), nano-encapsulated spironolactone (NESP), spironolactone-treated I/R (SP + I/R) and NESP-treated I/R (NESP + I/R) groups. * p < 0.05 and *** p < 0.001 (compared to control group). # p < 0.05 and ### p < 0.001 (compared to I/R group). @ p < 0.05 (difference between SP-treated I/R group and NESP-treated I/R group).
Applsci 11 01264 g002
Figure 3. Renal glutathione (GSH) levels in different animal groups (n = 8) at the end of interventions: Control, ischemic/reperfusion (I/R), spironolactone (SP), nano-encapsulated spironolactone (NESP), spironolactone-treated I/R (SP + I/R) and NESP-treated I/R (NESP + I/R) groups. ** p < 0.01 and *** p < 0.001 (compared to control group). # p < 0.05 and ### p < 0.001 (compared to I/R group). @@ p < 0.01 (difference between SP-treated I/R group and NESP-treated I/R group).
Applsci 11 01264 g003
Figure 4. Renal superoxide dismutase (SOD) and catalase (CAT) activities in different animal groups (n = 8) at the end of interventions: Control, ischemic/reperfusion (I/R), spironolactone (SP), nano-encapsulated spironolactone (NESP), spironolactone-treated I/R (SP + I/R) and NESP-treated I/R (NESP + I/R) groups. The data are represented as mean ± SD (Left panel: ** p < 0.01 and *** p < 0.001 compared to control group, ## p < 0. 01 and ### p < 0.001 compared to I/R group, @ p < 0.05: difference between SP-treated I/R group and NESP-treated I/R group). (Right panel: ** p < 0.01 compared to control group; # p < 0. 05, ## p < 0. 01 and ### p < 0.001 compared to I/R group; @ p < 0.05: difference between SP-treated I/R group and NESP-treated I/R group).
Applsci 11 01264 g004
Figure 5. Photomicrographs of renal histology stained with Hematoxylin-Eosin (H&E) assay in different rat groups (n = 8) at the end of interventions. (A): normal renal structure in control group; (B): abnormal features in the kidneys of rats subjected to ischemic/reperfusion (I/R) including hemorrhage (black arrow), tubular vasodilation (asterisk), glomerular atrophy (green arrowhead) and intratubular casts (black arrowhead); (C): some degree of renal damages including hemorrhage (black arrow), tubular vasodilation (asterisk) and glomerular atrophy (green arrowhead) in spironolactone (SP)-treated ischemic/reperfusion (I/R) group; (D): restored normal kidney histological features in nano-encapsulated spironolactone (NESP)-treated I/R group; (E,F): normal histology of kidneys in SP- and NESP-treated groups, respectively.
Applsci 11 01264 g005
Table 1. Effects of administration of spironolactone (SP) and nano-encapsulated spironolactone (NESP) on the serum levels of urea, creatinine, total protein (TP) and uric acid in control, ischemic/reperfusion (I/R), spironolactone (SP), nano-encapsulated spironolactone (NESP), spironolactone-treated I/R (SP + I/R) and NESP-treated I/R (NESP + I/R) groups at the end of intervention (n = 8). The data are represented as mean ± SD. Asterisks indicate significant difference compared to control group (** p < 0.01 and *** p < 0.001, analysis of variance (ANOVA), Tukey’s test for post-hoc comparisons). Hash marks indicate significant difference compared to I/R group (# p < 0.05, ## p < 0.01 and ### p < 0.001, ANOVA, Tukey’s test for post-hoc comparisons). @ symbols show significant differences between SP + I/R and NESP + I/R groups (@ p < 0.05 and @@ p < 0.01, ANOVA, Tukey’s test for post-hoc comparisons).
MarkersControlI/RSPNESPSP + I/RNESP + I/R
Urea (mg/dL)5.97 ± 0.9949.11 ± 3.11 ***6.21 ± 0.42 ###7.31 ± 0.97 ###32.34 ± 3.08 ***##12.14 ± 1.00 ###@@
Creatinine (mg/dL)0.38 ± 0.041.98 ± 0.23 ***0.19 ± 0.02 ###0.29 ± 0.01 ###1.12 ± 0.09 **#0.41 ± 0.01 ###@
TP (g/dL)6.84 ± 0.212.98 ± 0.09 ***5.78 ± 0.43 ###7.58 ± 0.51 ###4.54 ± 0.09 **#6.11 ± 0.07 ###@
Uric acid (mg/dL)1.35 ± 0.305.98 ± 0.39 ***0.97 ± 0.02 ###1.31 ± 0.11 ###4.20 ± 0.07 ***##1.98 ± 0.25 ###@@
Publisher’s Note: MDPI stays neutral with regard to jurisdictional claims in published maps and institutional affiliations.