Article

High Voltage Ride through Strategy of Wind Farm Considering Generator Terminal Voltage Distribution

1
School of Electrical Engineering, Southeast University, Nanjing 210096, China
2
Xinjiang Electric Power Research Institute, Urumqi 830000, China
*
Author to whom correspondence should be addressed.
Appl. Sci. 2021, 11(3), 1248; https://doi.org/10.3390/app11031248
Submission received: 30 December 2020 / Revised: 26 January 2021 / Accepted: 27 January 2021 / Published: 29 January 2021
(This article belongs to the Section Electrical, Electronics and Communications Engineering)

Abstract

:
When wind power is transmitted via high-voltage direct current (HVDC), the problem of high-voltage ride-through (HVRT), caused by direct-current (DC) blocking must be seriously taken into account. All the wind turbines in a wind farm are usually equivalent to a single turbine in the existing research on HVRT, which ignores the generator terminal voltage distribution in a wind farm. In view of the fact that the severity of fault voltage felt by each wind turbine in the field is different, an improved HVRT strategy considering voltage distribution is proposed in this article. First, this article analyzes the mechanism of voltage swell failure caused by DC blocking, and the characteristics of the generator terminal voltage distribution in wind farms. Second, the reactive power characteristic equations of the synchronous condenser and the doubly-fed induction generator (DFIG) are derived. Third, based on the extraction of the key node voltage, this article takes the key node voltage as the compensation target, and put forwards a HVRT strategy combining the synchronous condenser and wind turbine. Finally, the simulation is carried out to demonstrate the effectiveness of the proposed strategy in improving the HVRT capability of all wind turbines.

1. Introduction

With the massive consumption of primary energy, energy shortage has become a worldwide problem. Northwest China has a large amount of onshore wind resources, and the total wind power installations in these areas were over 50 GW at the end of 2019. However, the wind curtailment of Northwest China in 2019 was 9.3%, which was five percentage points higher than the national average. With the development of power electronics technology, high-voltage direct current (HVDC) technology is one of the most effective ways to reduce the wind curtailment [1,2,3,4].
AC failure at the sending-end grid may cause the DC blocking of the HVDC transmission system, and further lead to voltage swell problem for wind farms. To improve the high-voltage ride-through (HVRT) success rate of doubly-fed induction generators (DFIG), some papers have studied the reactive power compensation capability of DFIGs and proposed corresponding wind turbine reactive power compensation control strategies [5,6,7,8,9]. Reference [6] put forward a reactive current assignment strategy for a grid-side convertor (GSC) and rotor-side convertor (VSC), for two different ride-through scenarios, which improves the ride-through capability of the wind turbine based on DFIG. Reference [7] proposed a HVRT strategy based on the virtual resistance strategy by analyzing the transient process of the DFIG when facing the voltage swell problem. Other papers installed a reactive power compensation device at the grid-connection point to improve the wind farm’s ride-through capability [10,11,12,13,14]. References [11,12,13] compared the reactive power compensation capabilities of static synchronous compensators (STATCOM) and static var compensators (SVC) during low voltage ride-through (LVRT) periods of wind farms. References [11,13] revealed that STATCOMs can provide more reactive power during voltage sag periods, and have a better transient performance than SVC after a voltage sag fault. Reference [12] showed that STATCOM is more economical than SVC. Reference [14] adopted static var generators (SVG) as a reactive power compensation device for wind farms, and designed a capacity configuration method for SVG. However, in most existing research on HVRT strategies of DFIG with reactive power compensation devices involved, the wind farm is usually equivalent to a wind turbine, which means that the HVRT control strategies take the grid-connection point voltage as the control target, while ignoring the voltage distribution inside the wind farm. Since DFIGs have weak tolerance to high voltages, the above HVRT strategies of DFIGs may make wind turbines confront trip-off accidents at the end of the line, due to generator terminal voltage distribution caused by collection lines. Reference [15] analyzed the generator terminal voltage distribution inside a wind farm, and put forward a corresponding voltage coordinated control strategy, but the influence of DC blocking fault scenarios and the application of synchronous condensers were not considered in the paper.
As synchronously rotating reactive power compensation equipment, the synchronous condenser presents good characteristics of strong voltage support capability, strong overload capacity, and long service life, compared with power electronic reactive power compensation equipment [16,17]. At present, the synchronous condenser has been put into operation in many converter stations [18,19,20,21]. Therefore, the installation of a synchronous condenser in wind farms can effectively improve the high and low voltage ride-through capabilities of the wind turbine by considering the voltage and reactive power distribution inside the wind farm. Reference [17] showed that the reactive power compensation capability of the synchronous condenser is better than STATCOM when facing the transient overvoltage problem caused by a DC blocking fault at the sending-end grid. The application of the synchronous condenser in wind farms was discussed in References [18,19]; however, the developed HVRT strategy, with the participation of a synchronous condenser, did not consider the voltage distribution in wind farms [19].
This article takes the practical project of wind power transmission through HVDC transmission technology in Northwest China as the background. Aiming to solve the problem of voltage swell caused by DC blocking, this article put forwards a HVRT strategy considering the voltage distribution in the wind farm. The proposed strategy combines the reactive power compensation characteristics of the synchronous condenser and DFIG. The typical topology and parameters of a practical wind farm are investigated, then the effectiveness and feasibility of the proposed strategy are verified by simulation results.
The contributions of the article can be summarized:
  • A key voltage node extraction technology based on generator terminal voltage distribution curves is proposed. Compared with the grid-connected node, the extracted node can better reveal the generator terminal voltage distribution characteristics of the wind farm. The stable control of key nodes can ensure the stable operation of all wind turbines during the HVRT period.
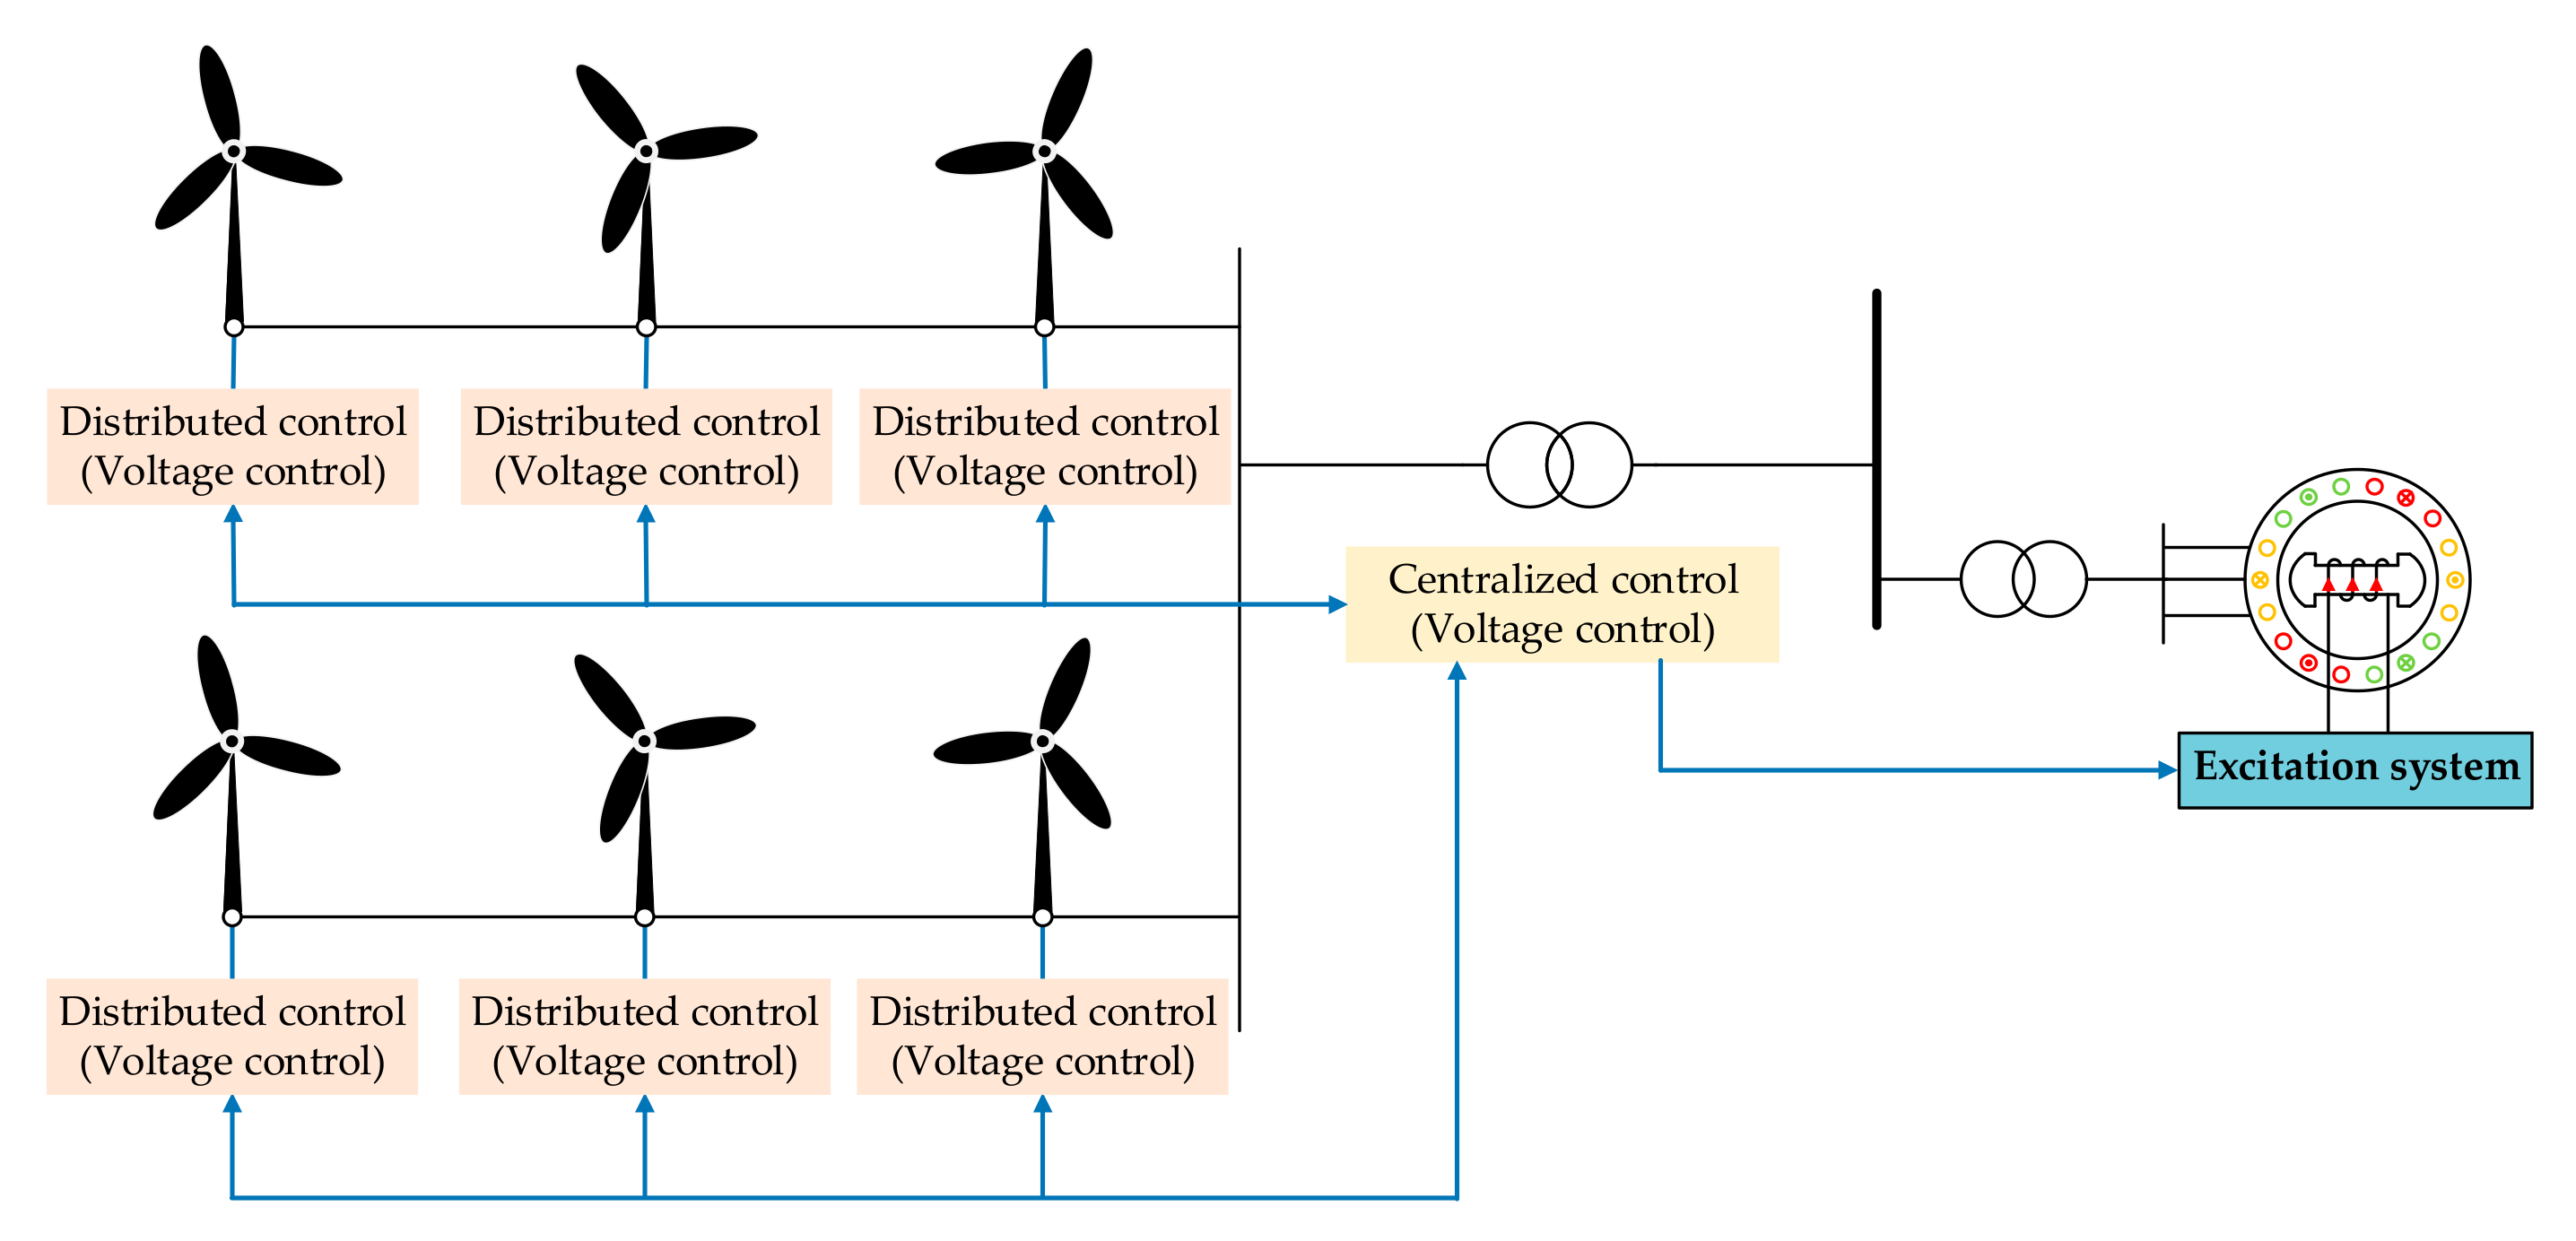
  • Based on the reactive power compensation characteristics of the synchronous condenser and the DFIG, an improved HVRT strategy is proposed. By means of controlling the voltage of the extracted node, the proposed strategy coordinates the reactive power output of the synchronous condenser and DFIGs, effectively avoiding trip-off accidents during the voltage swell period.
  • The evaluation index voltage swell index (VSI) is proposed to evaluate the ride-through performance of the HVRT strategy. Based on the practical topology and parameters of the wind farm, the proposed HVRT strategy was used to test the model built in MATLAB/SIMULINK, and simulation results showed the effectiveness and feasibility of the proposed strategy.
This article is organized as follows: Section 2 presents the DC blocking fault in HVDC transmission, and the voltage distribution characteristics inside the wind farm. Section 3 presents the reactive power output characteristics of the synchronous condenser and DFIG. Section 4 put forward a method of extracting the key voltage node, and an improved HVRT strategy. Section 5 simulates and verifies the proposed HVRT strategy. Section 6 concludes this article.

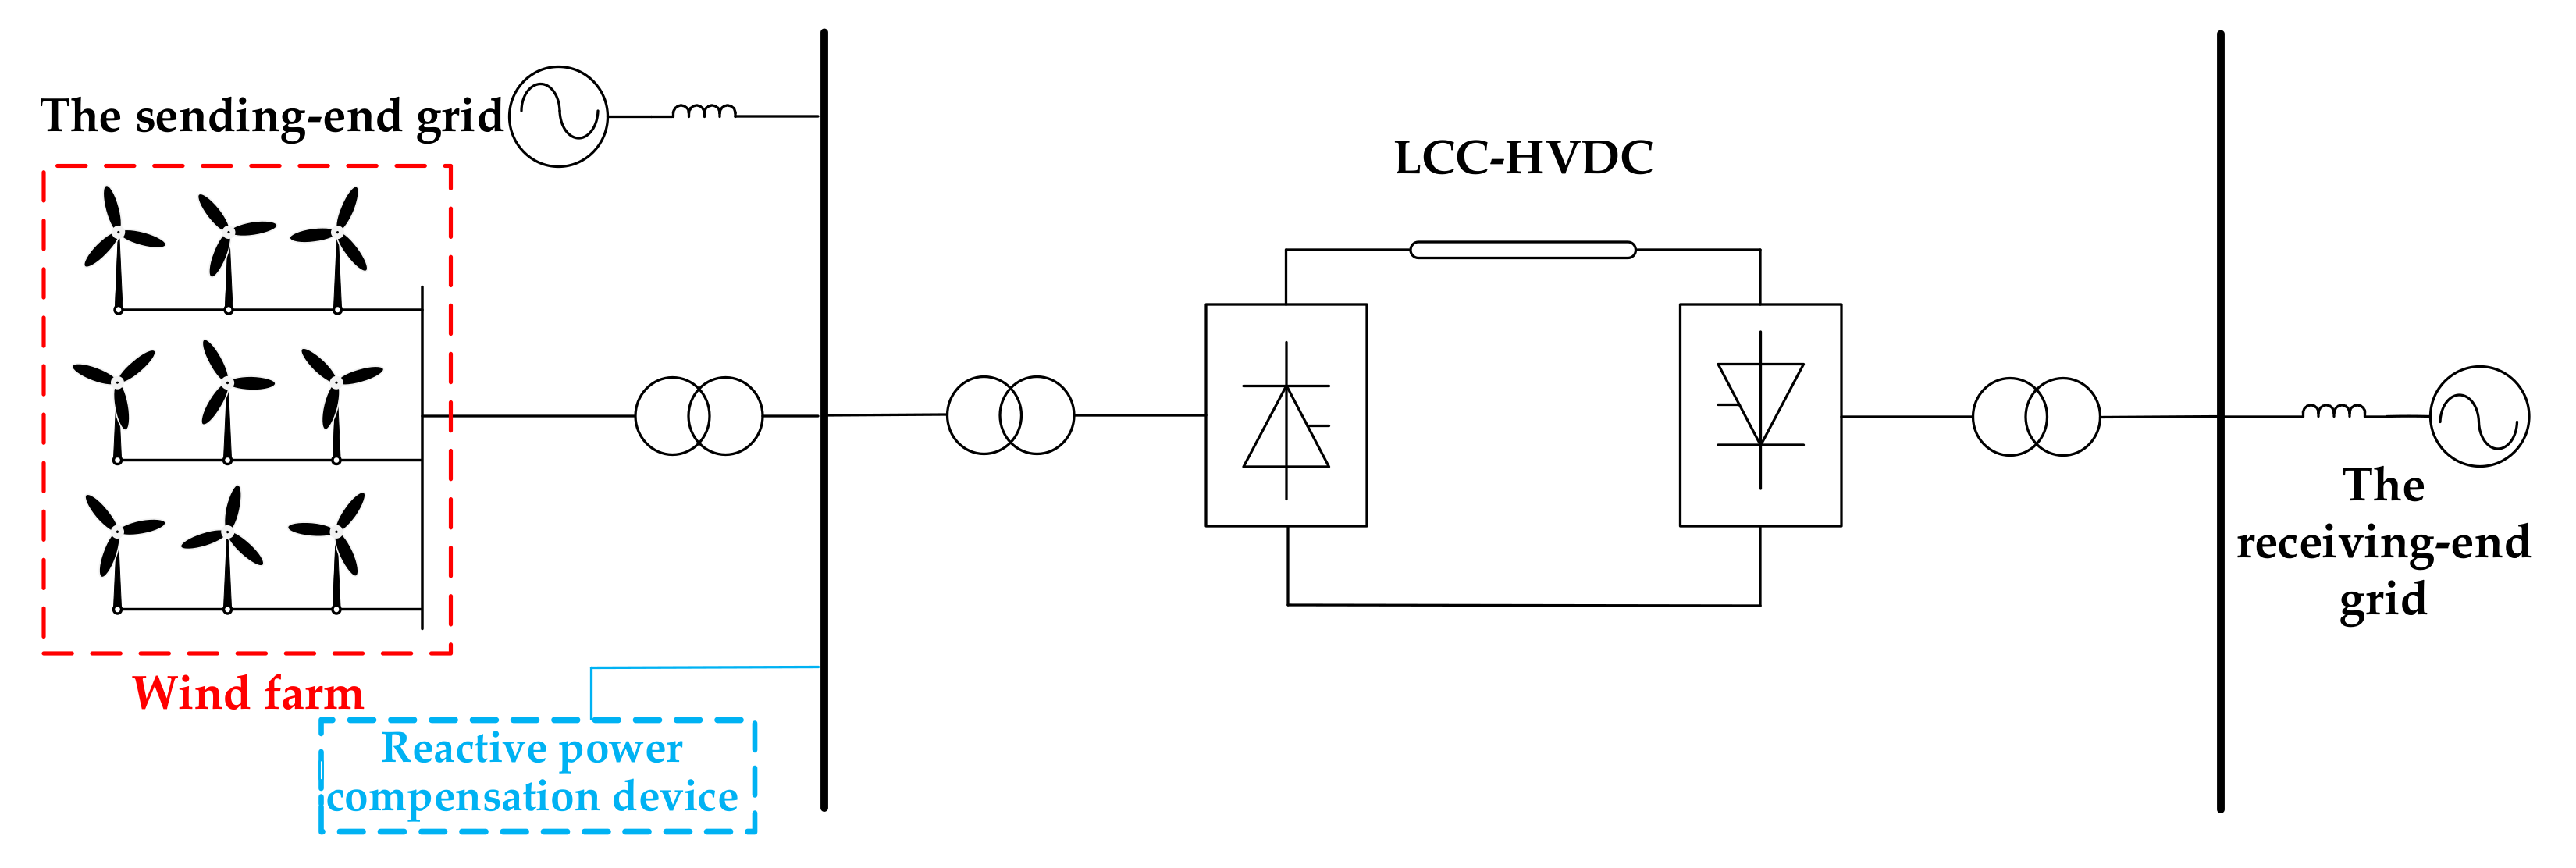
2. Voltage Distribution Characteristics under a Wind Power Transmission Fault

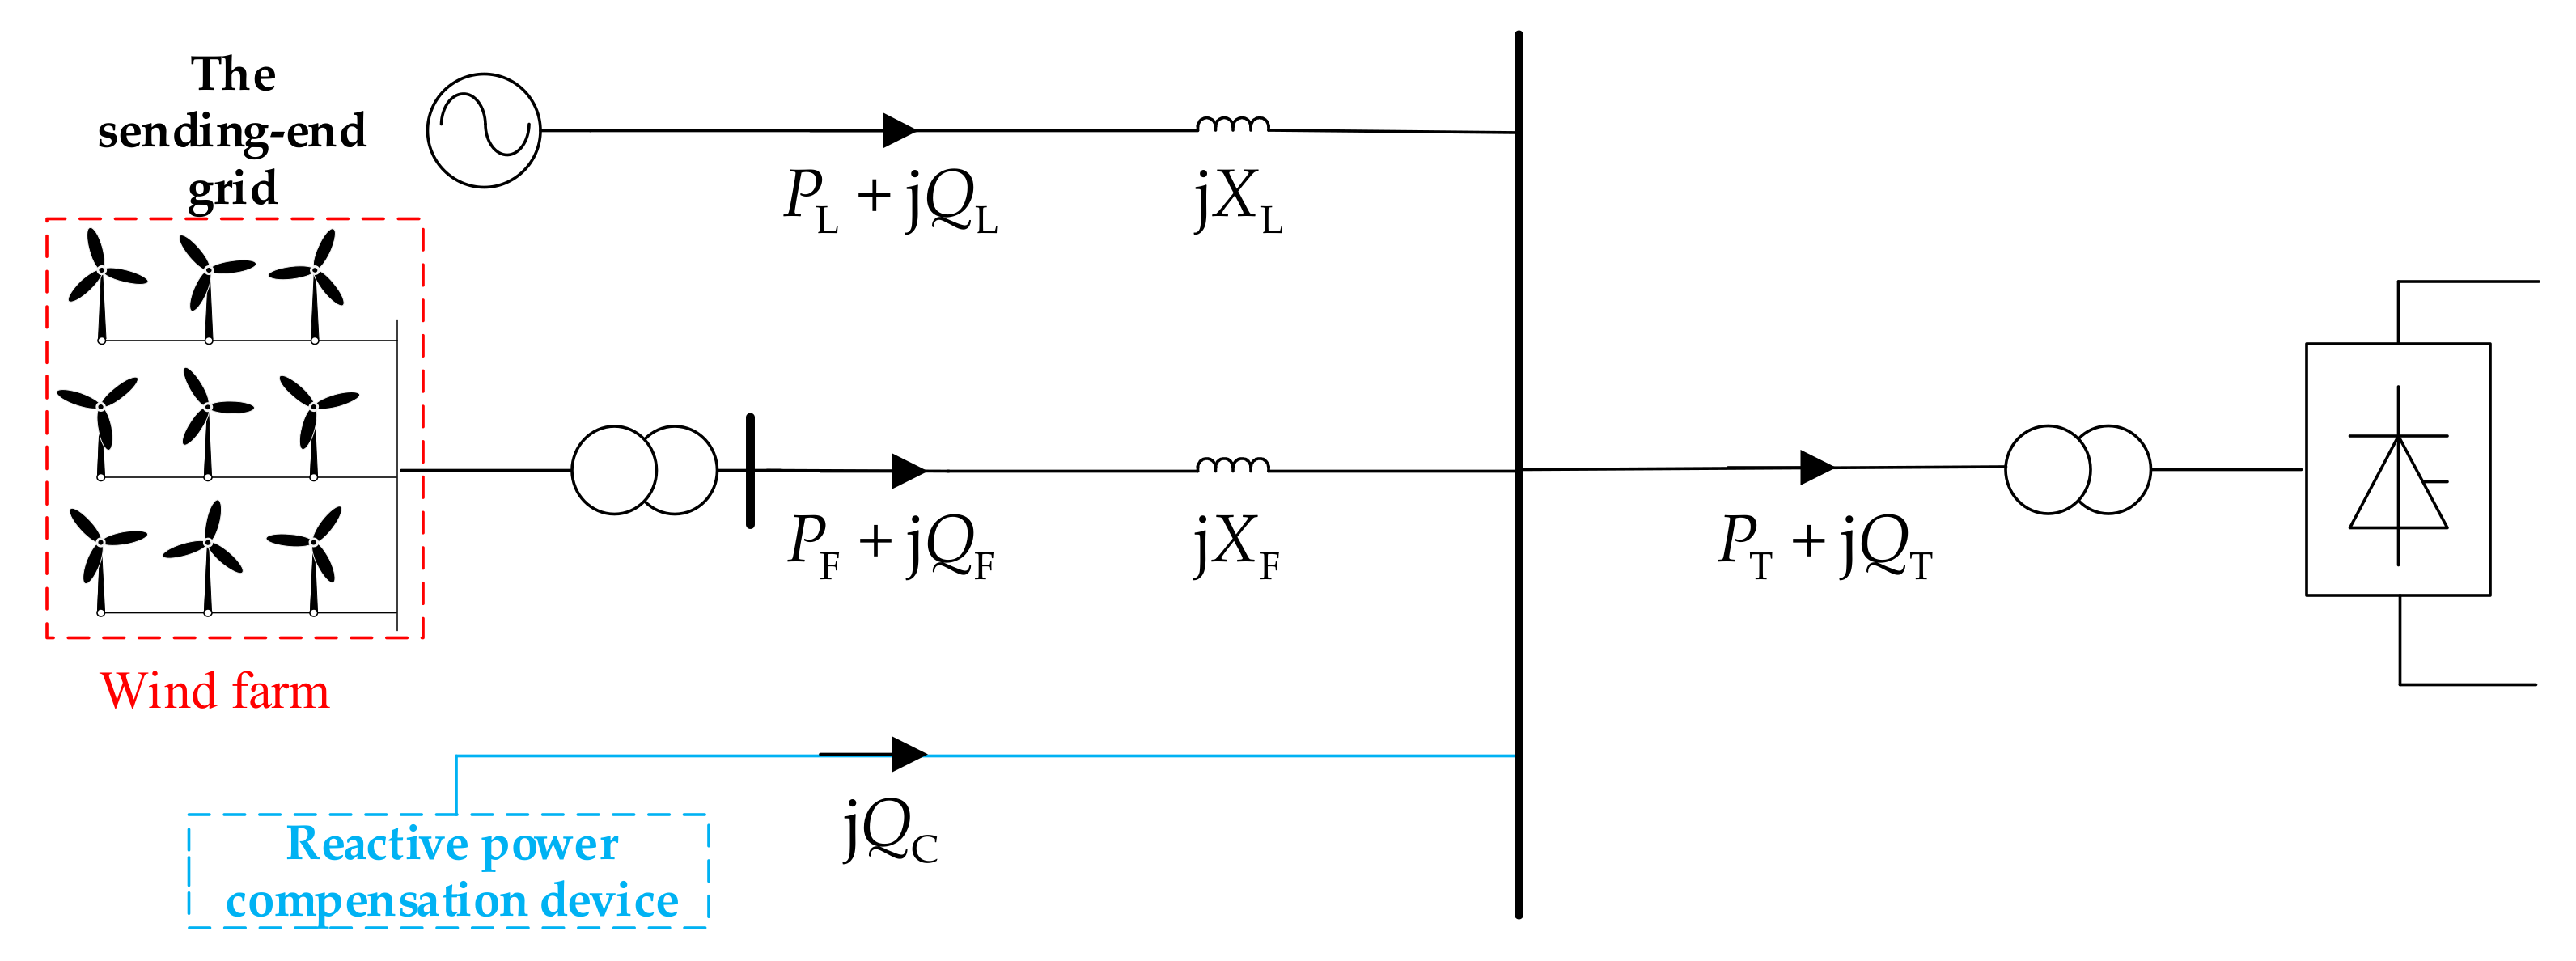
2.1. Analysis of Voltage Swell under DC Blocking

The topology of wind power transmission via HVDC is shown in Figure 1, and its equivalent circuit is shown in Figure 2. The basic structure of wind power transmission via HVDC includes the sending-end grid, wind farm, reactive power compensation device, HVDC transmission, and the receiving-end grid. In Figure 2, PL and QL are the active and reactive power output by the sending-end grid, respectively; XL is the equivalent reactance of the sending-end AC system; PF and QF are the active and reactive power, output by wind farm, respectively; XF is the equivalent reactance of the wind power system; QC is the reactive power output of the reactive power compensation equipment; PT and QT are the active and reactive power transmitted to the converter station at the sending-end grid, respectively.
In normal operation, reactive power should satisfy the follow equation:
Q T = Q L + Q F + Q C
The active and reactive power transmitted to the converter station at the sending-end grid satisfy the following equation [22]:
Q T = P T π / 180 μ sin μ cos 2 α + μ sin μ sin 2 α + μ
where α is the trigger angle of the rectifier, and μ is the commutation angle.
When a DC blocking fault occurs, the active power absorbed by the sending-end converter station drops rapidly, so that QT drops rapidly. The reactive power accumulates at the sending-end converter station, which forms a voltage swell at the grid-connection point. The magnitude of the voltage swell can be calculated as [22]:
Δ U r Δ Q dr / S sr
where ΔUr is the transient voltage swell of the sending-end converter station; Ssr is the short-circuit capacity of the sending-end converter station; ΔQdr is the surplus reactive power of the converter station after the DC blocking fault.
Therefore, in the scenario that wind power is transmitted via HVDC, the DC blocking fault will cause a voltage swell at the grid-connection point. To deal with the swell, wind turbines’ HVRT capability must be considered to avoid trip-off accidents.

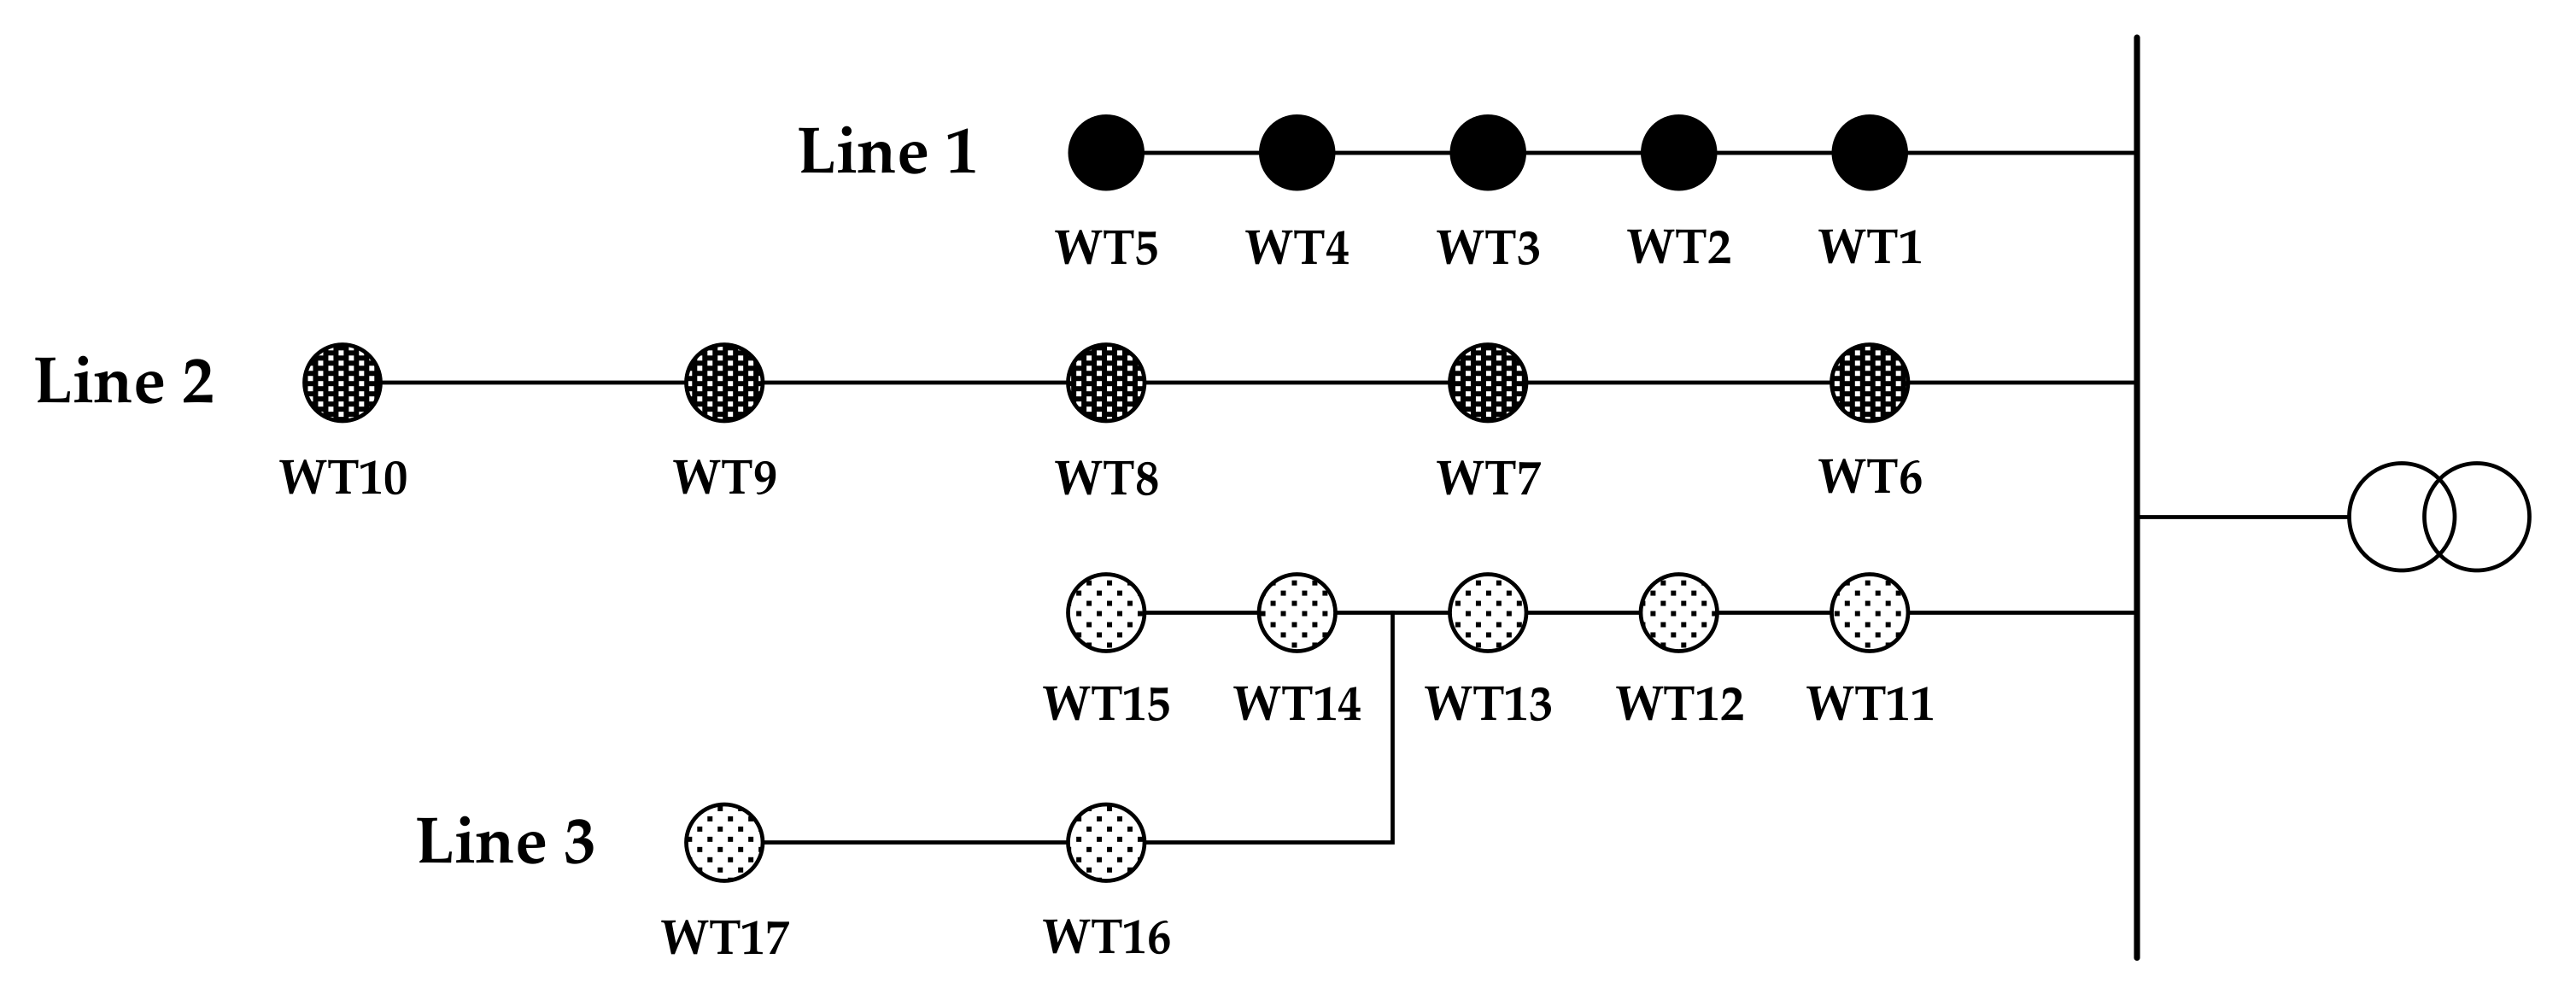
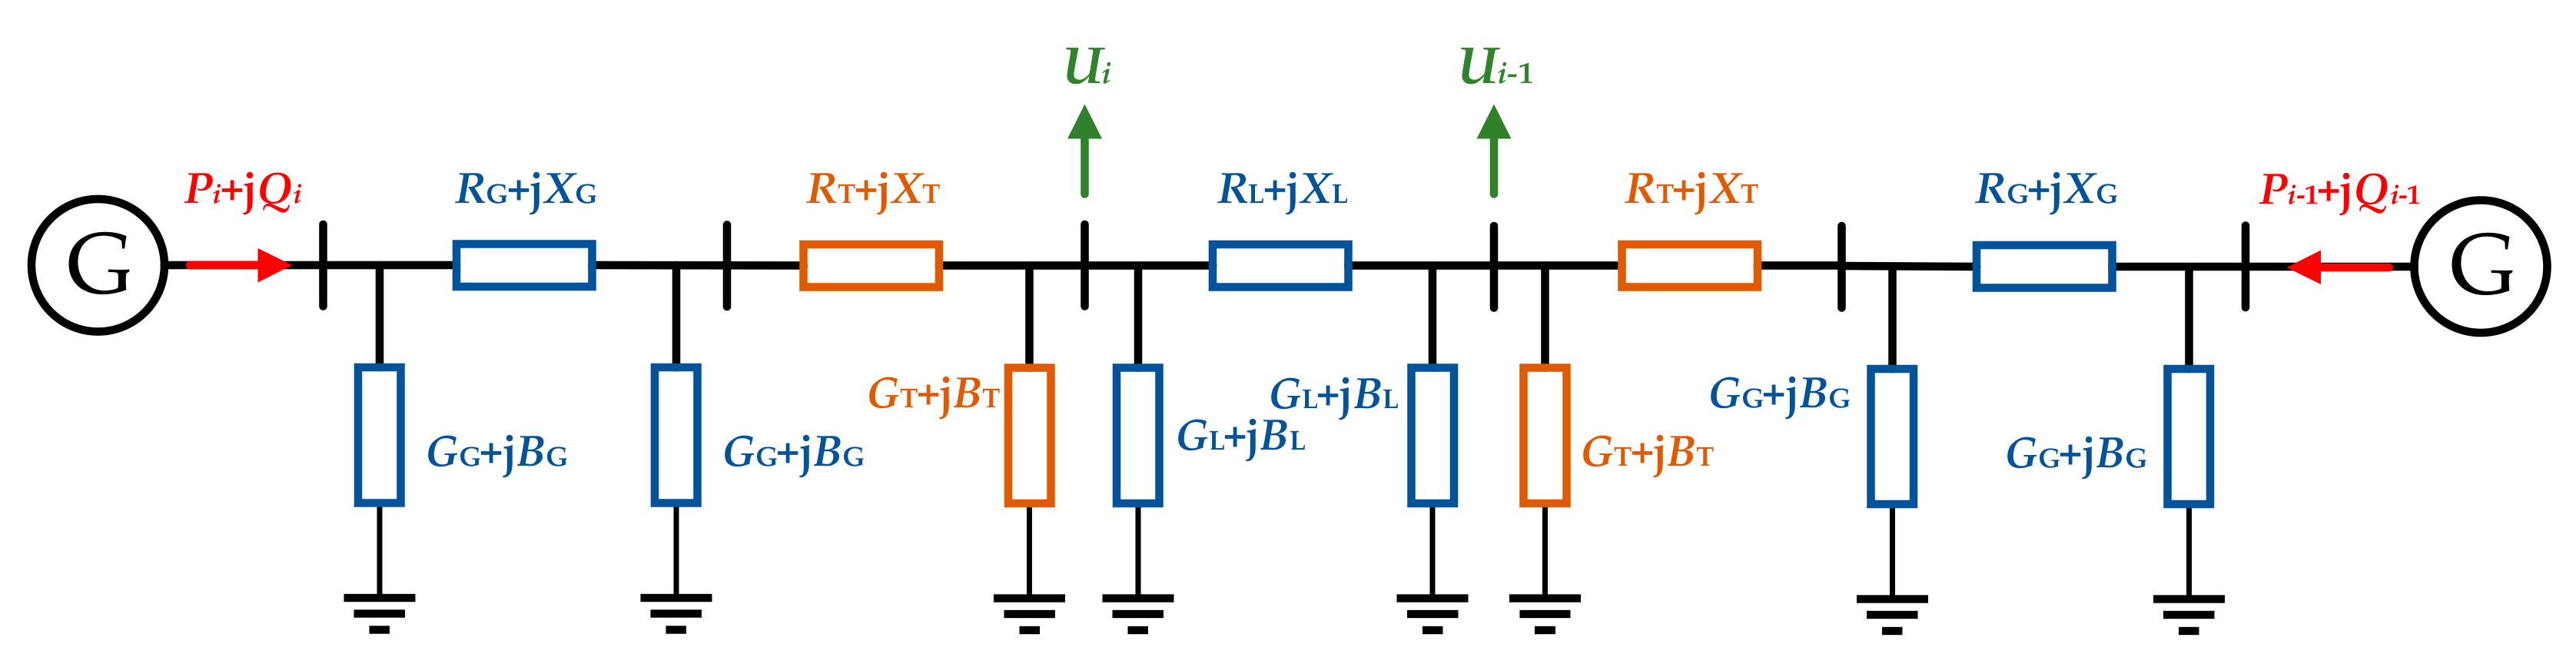
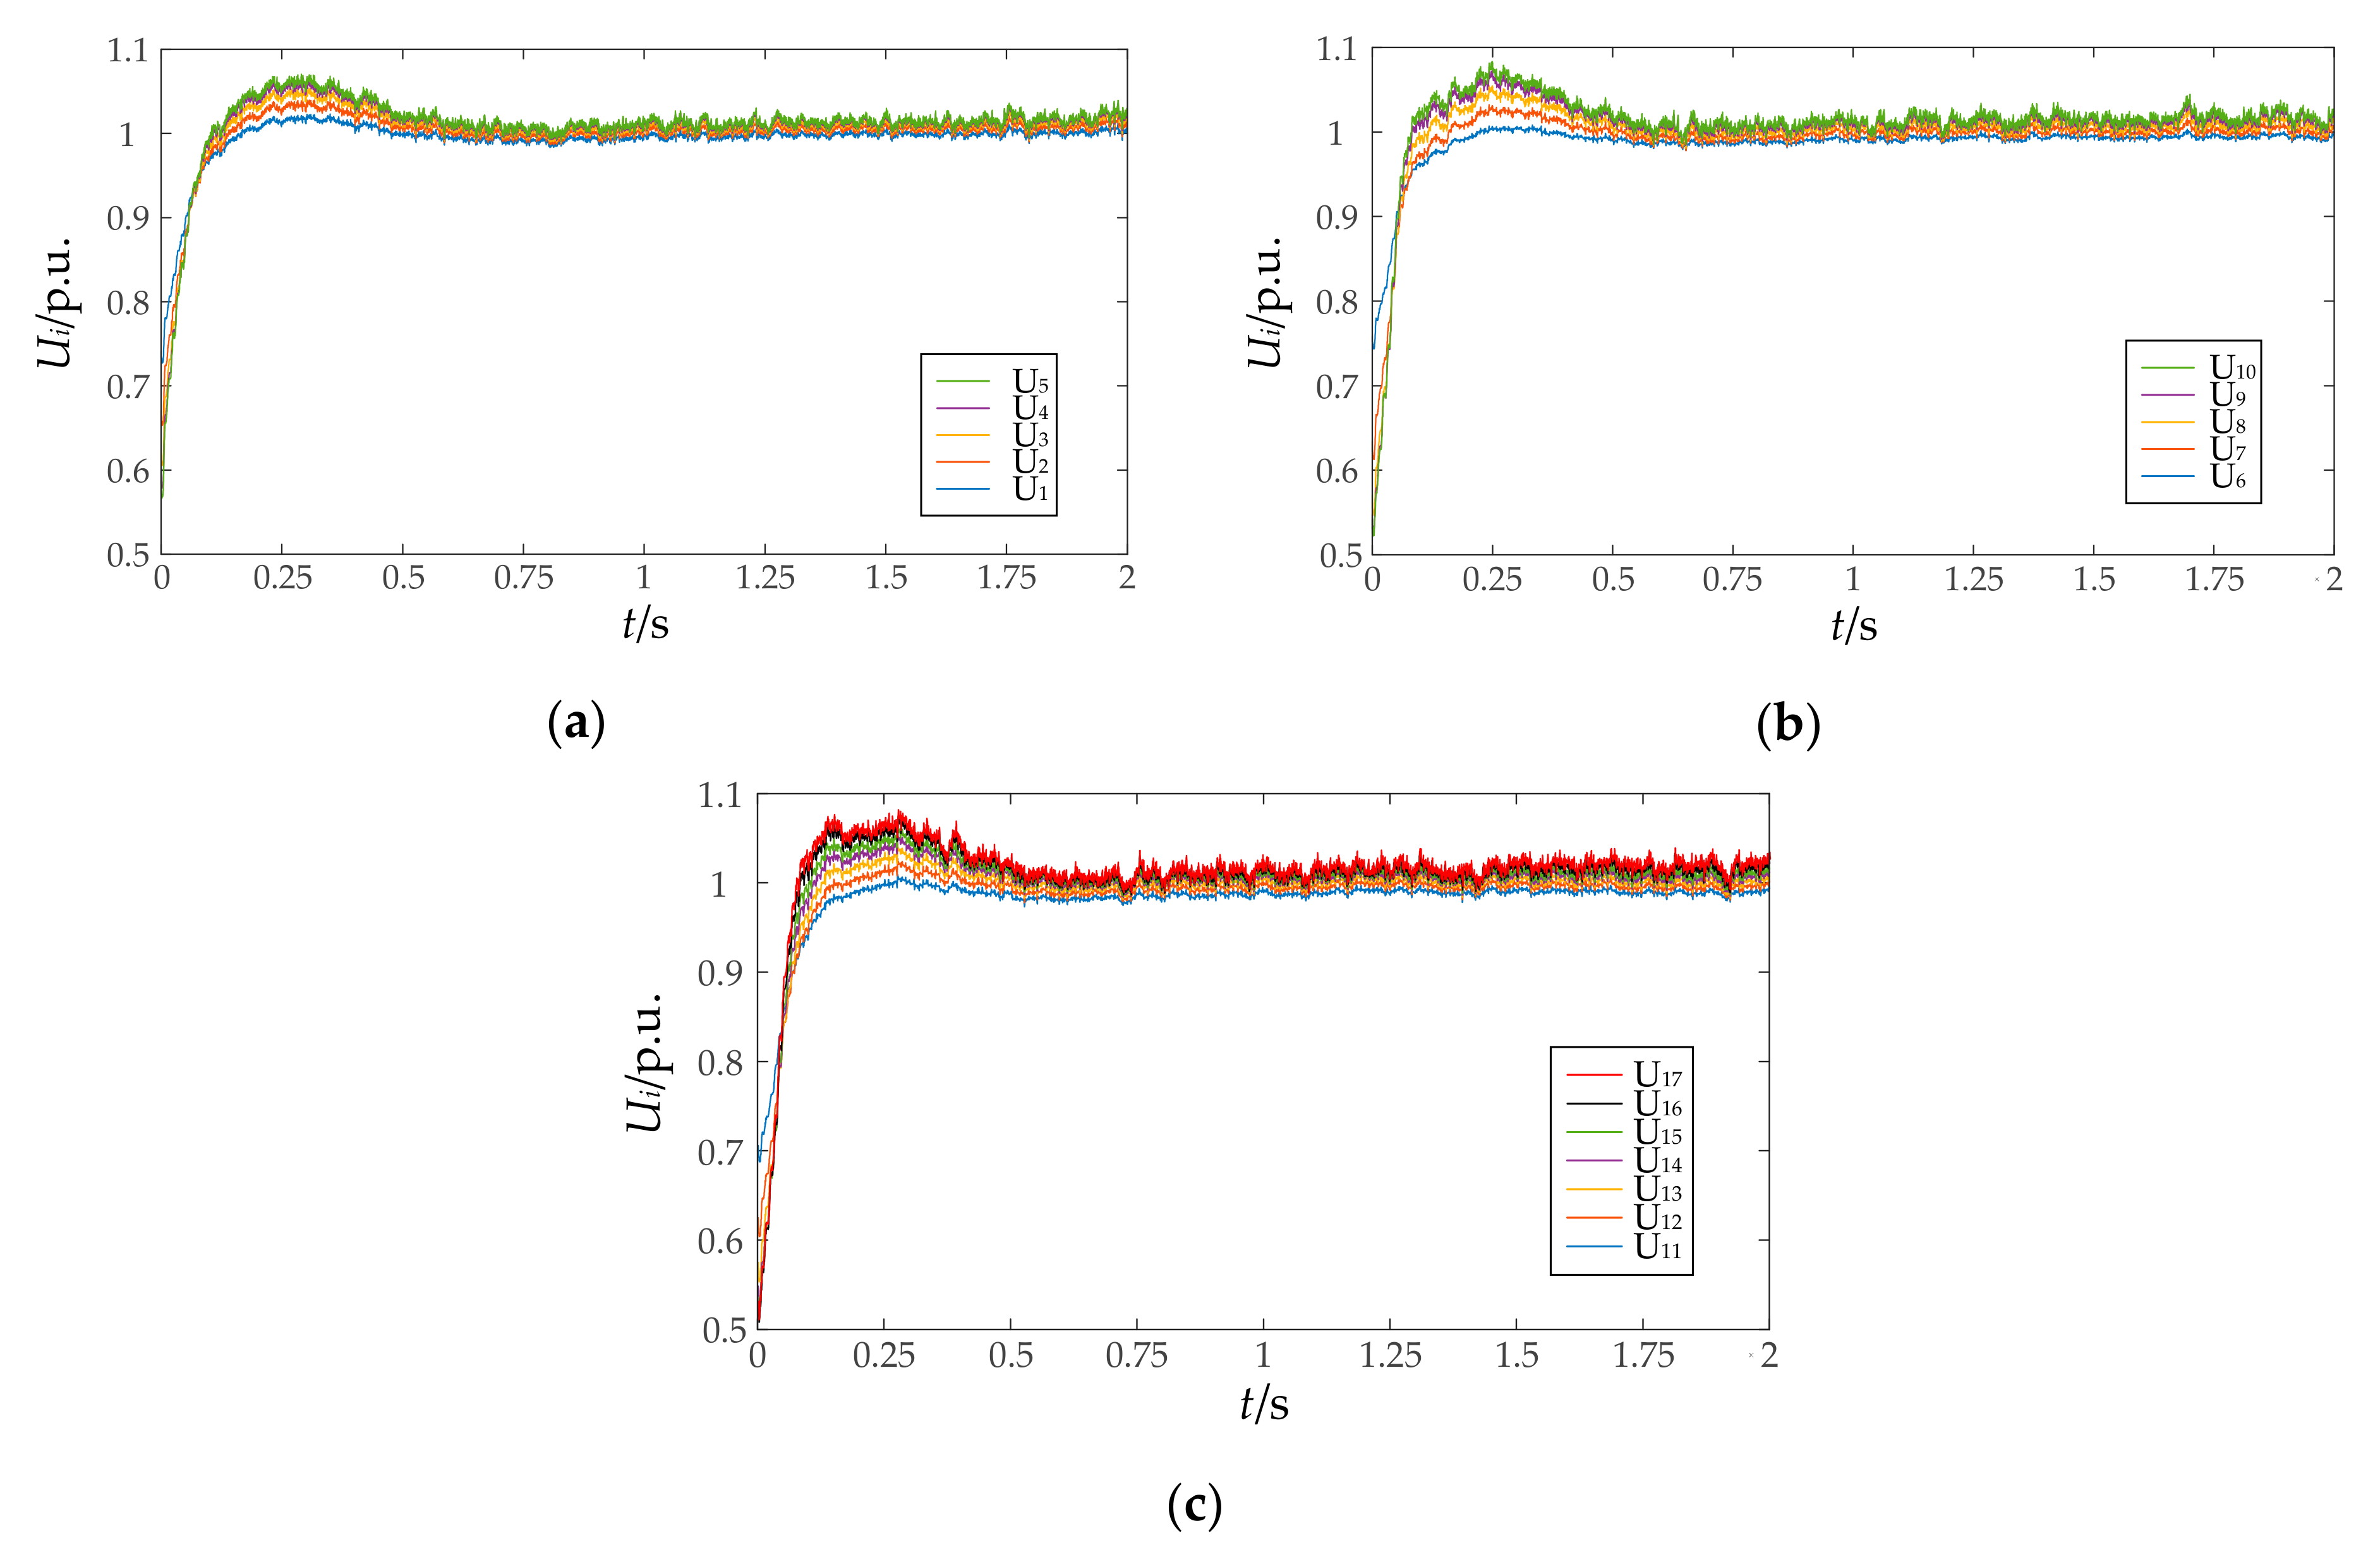
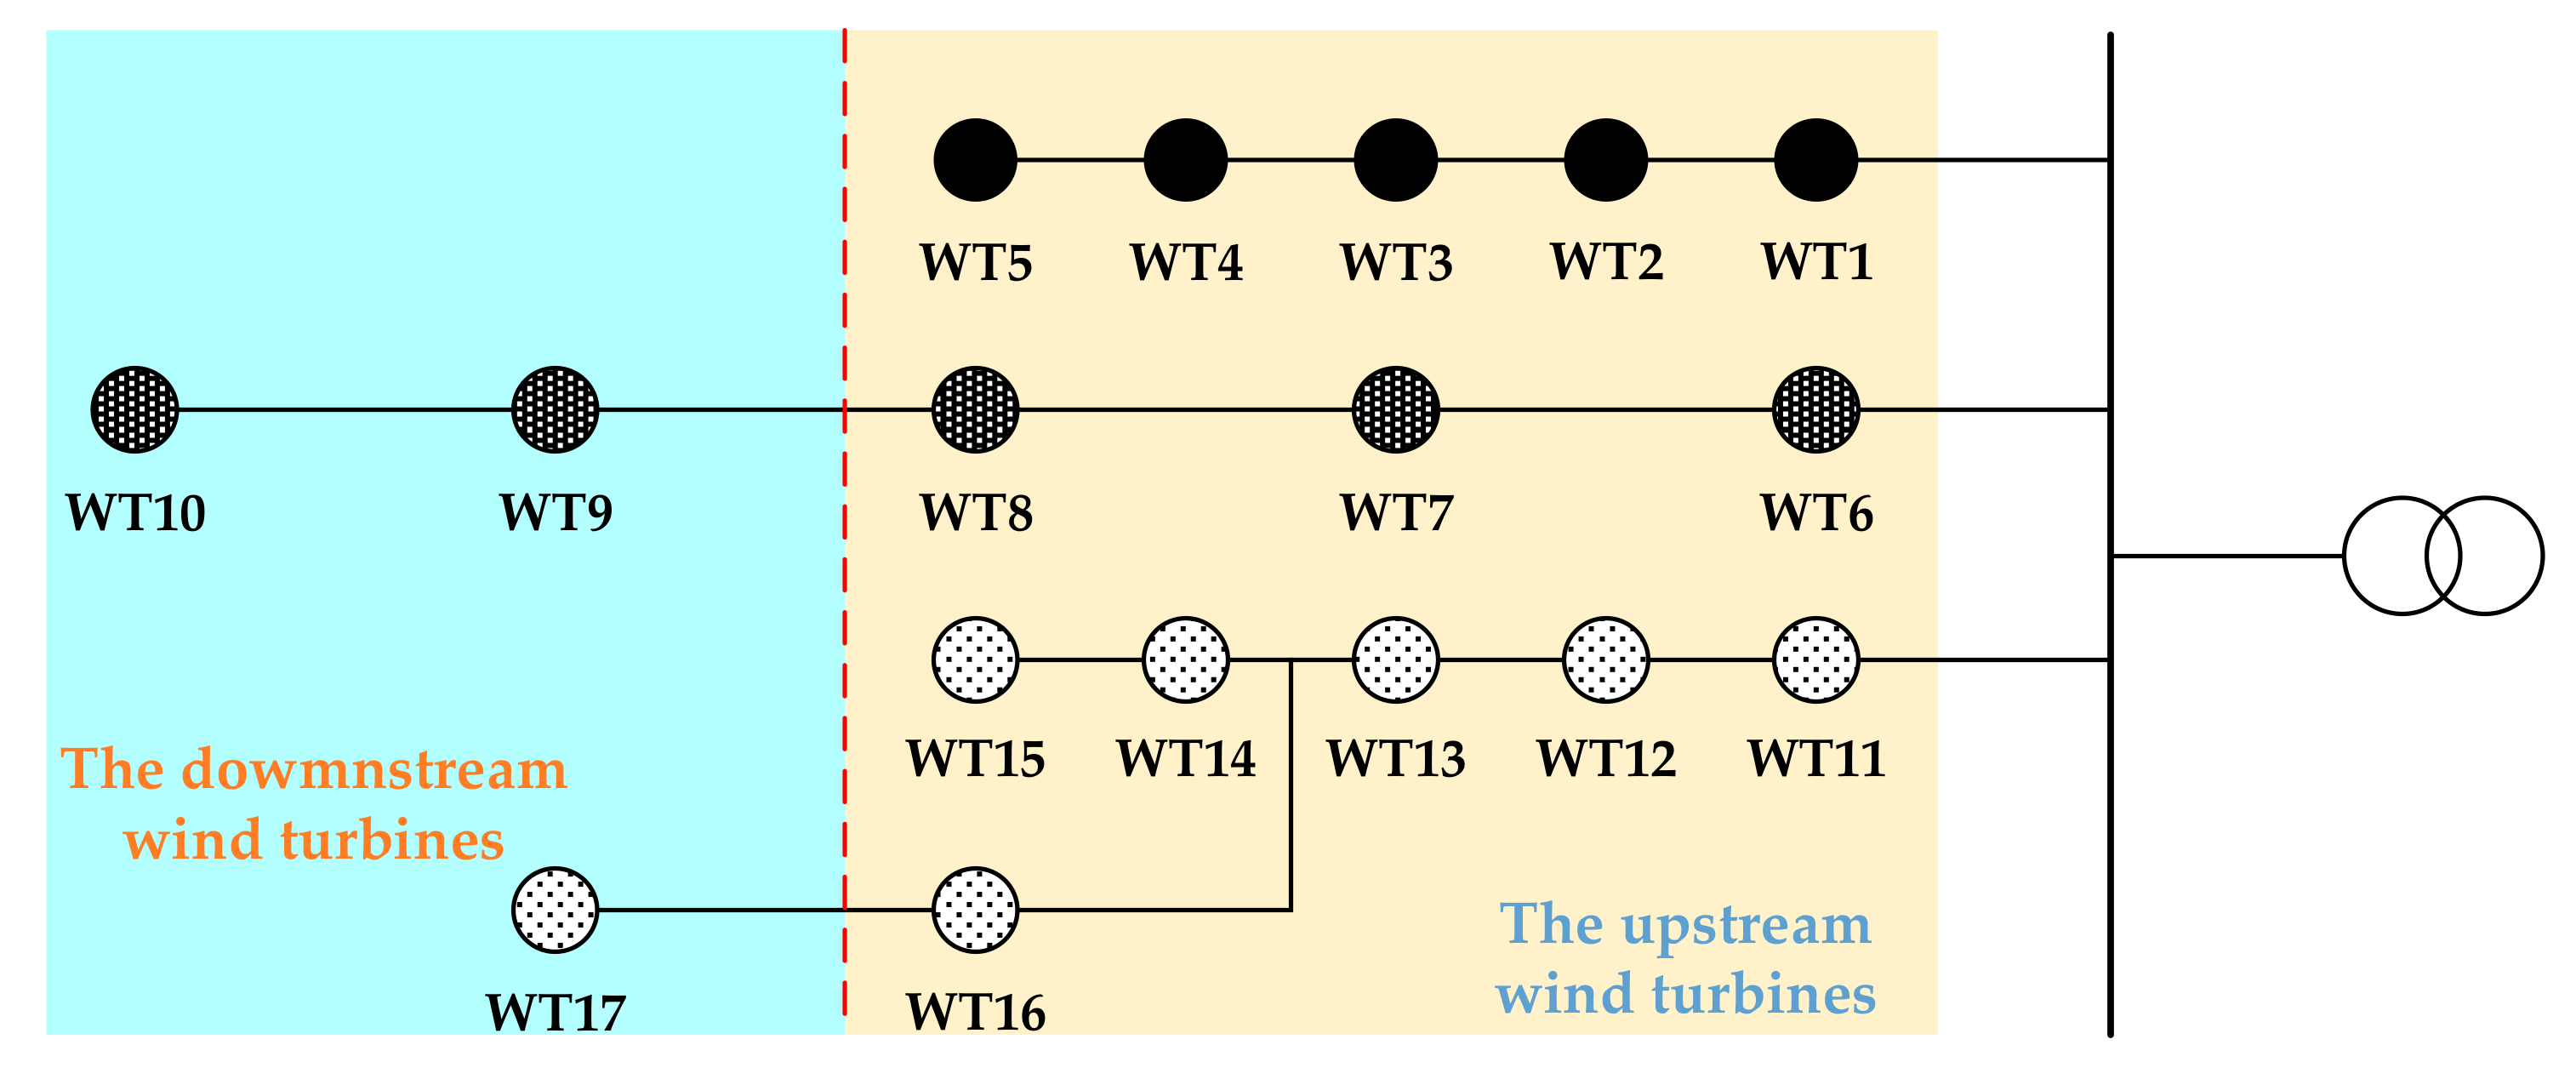
2.2. Analysis of Generator Terminal Voltage Distribution in a Wind Farm

The distribution of generators in a wind farm usually adopts a chain structure. Each busbar is normally with several collection lines, and each collection line is with multiple wind turbines. A typical large wind farm has more than one hundred wind turbines, and the number of wind turbines with each collection line is usually 10–12. Affected by geographical location, as the distance between each wind turbine ranges from hundreds of meters to thousands of meters, the distance between the beginning and end of the collection line is between thousands of meters and tens of kilometers. The topology of the typical wind farm studied in this article is shown in Figure 3.
By randomly selecting two adjacent wind turbines, their equivalent circuit can be modeled, as shown in Figure 4. In Figure 4, Ui and Ui−1 are the points connected to the main collection line; RG, XG, GG, and BG are the equivalent resistance, reactance, conductance, and susceptance of the line from the wind turbine to transformer, respectively; RL, XL, GL, and BL are the equivalent resistance, reactance, conductance, and susceptance of the collection line between two wind turbines, respectively; RT, XT, GT, and BT are the equivalent resistance, reactance, conductance, and susceptance of the transformer, respectively; Pi and Qi are the active and reactive power output of the left wind turbine, respectively; Pi−1 and Qi−1 are the active and reactive power output of the right wind turbine, respectively.
Assuming that the transformer equivalent circuit and the line equivalent circuit, between the left wind turbine to Ui point, and the right wind turbine to Ui−1, are replaced by quantitative active and reactive losses, ΔP and ΔQ, respectively, Figure 4 can be simplified as Figure 5. When wind turbines are operating in a non-constant power factor state, it can be calculated according to the voltage drop of the transmission line:
U ˙ i = U i 1 + P i + P i 1 2 Δ P R L + Q i + Q i 1 2 Δ Q X L U i 1 + j P i + P i 1 2 Δ P X L Q i + Q i 1 2 Δ Q R L U i 1
In general, the power angle in the transmission line is small, so Equation (4) can be approximated as:
U i = U i - 1 + P i + P i 1 2 Δ P R L + Q i + Q i 1 2 Δ Q X L U i - 1
Based on the above analysis, we can calculate the voltage difference relationship between any two adjacent wind turbines on the collection line as:
U k + 1 U k = i = 1 m k + 1 P i m Δ P R L + i = 1 m k + 1 Q i m Δ Q X L U k
where m is the number of wind turbines, from the selected wind turbines to the end of the collection line.
It can be seen from Equation (6) that: First, the voltage of the wind farm depends on the voltage of the grid-connection point, and the deviation of the grid-connection point voltage will cause the deviation of the generator terminal voltage of all wind turbines in the wind farm. Second, the generator terminal voltage distribution in the wind farm is also related to the active and reactive power output of the wind turbines, and the output of the wind turbines will also cause fluctuations in the generator terminal voltage distribution of the wind farm. After the grid-connection point voltage is controlled within a reasonable range and the output of the wind turbines is stabilized, the generator terminal voltage distribution in the wind farm will also have a certain difference due to the power flow distribution. The simulation results based on the topology in Figure 3 (simulation parameters are the same as provided in Section 5) of the voltage distribution in the wind farm are shown in Figure 6 and Table 1.
The simulation results show that the generator terminal voltage distribution of wind turbines on the same collection line has the following characteristics: the further the wind turbine is from the busbar, the higher the generator terminal voltage of the wind turbine is, and the smaller the voltage difference between two adjacent wind turbines is. In the case of a voltage swell fault caused by DC blocking, even if the voltage of the grid-connection point is stabilized within the normal operating range through the reactive power compensation, the generator terminal voltage of the wind turbine at the end of the collection line is very likely to exceed the normal operating range, which will cause trip-off accidents. Therefore, it is necessary to fully consider the generator terminal voltage of each wind turbine in the wind farm during the voltage swell period to avoid trip-off accidents happening at the end of the collection line.
It should be noted that during low-voltage ride-through (LVRT) periods, wind turbines at the head of the line have lower generator terminal voltages, which are more likely to trip-off from the grid. In a LVRT scenario, selecting the grid-connection point as the reactive power compensation reference point, and considering the recovery of the grid-connection point, can ensure the safety of all wind turbines. However, wind turbines at the end of the line have higher generator terminal voltages in the HVRT, which are more likely to trip-off from the grid. Therefore, selecting the grid-connection point as the reactive power compensation reference point cannot ensure the safety of all wind turbines during HVRT periods.

3. Reactive Power Output Characteristics of Wind Farm Transmission Systems

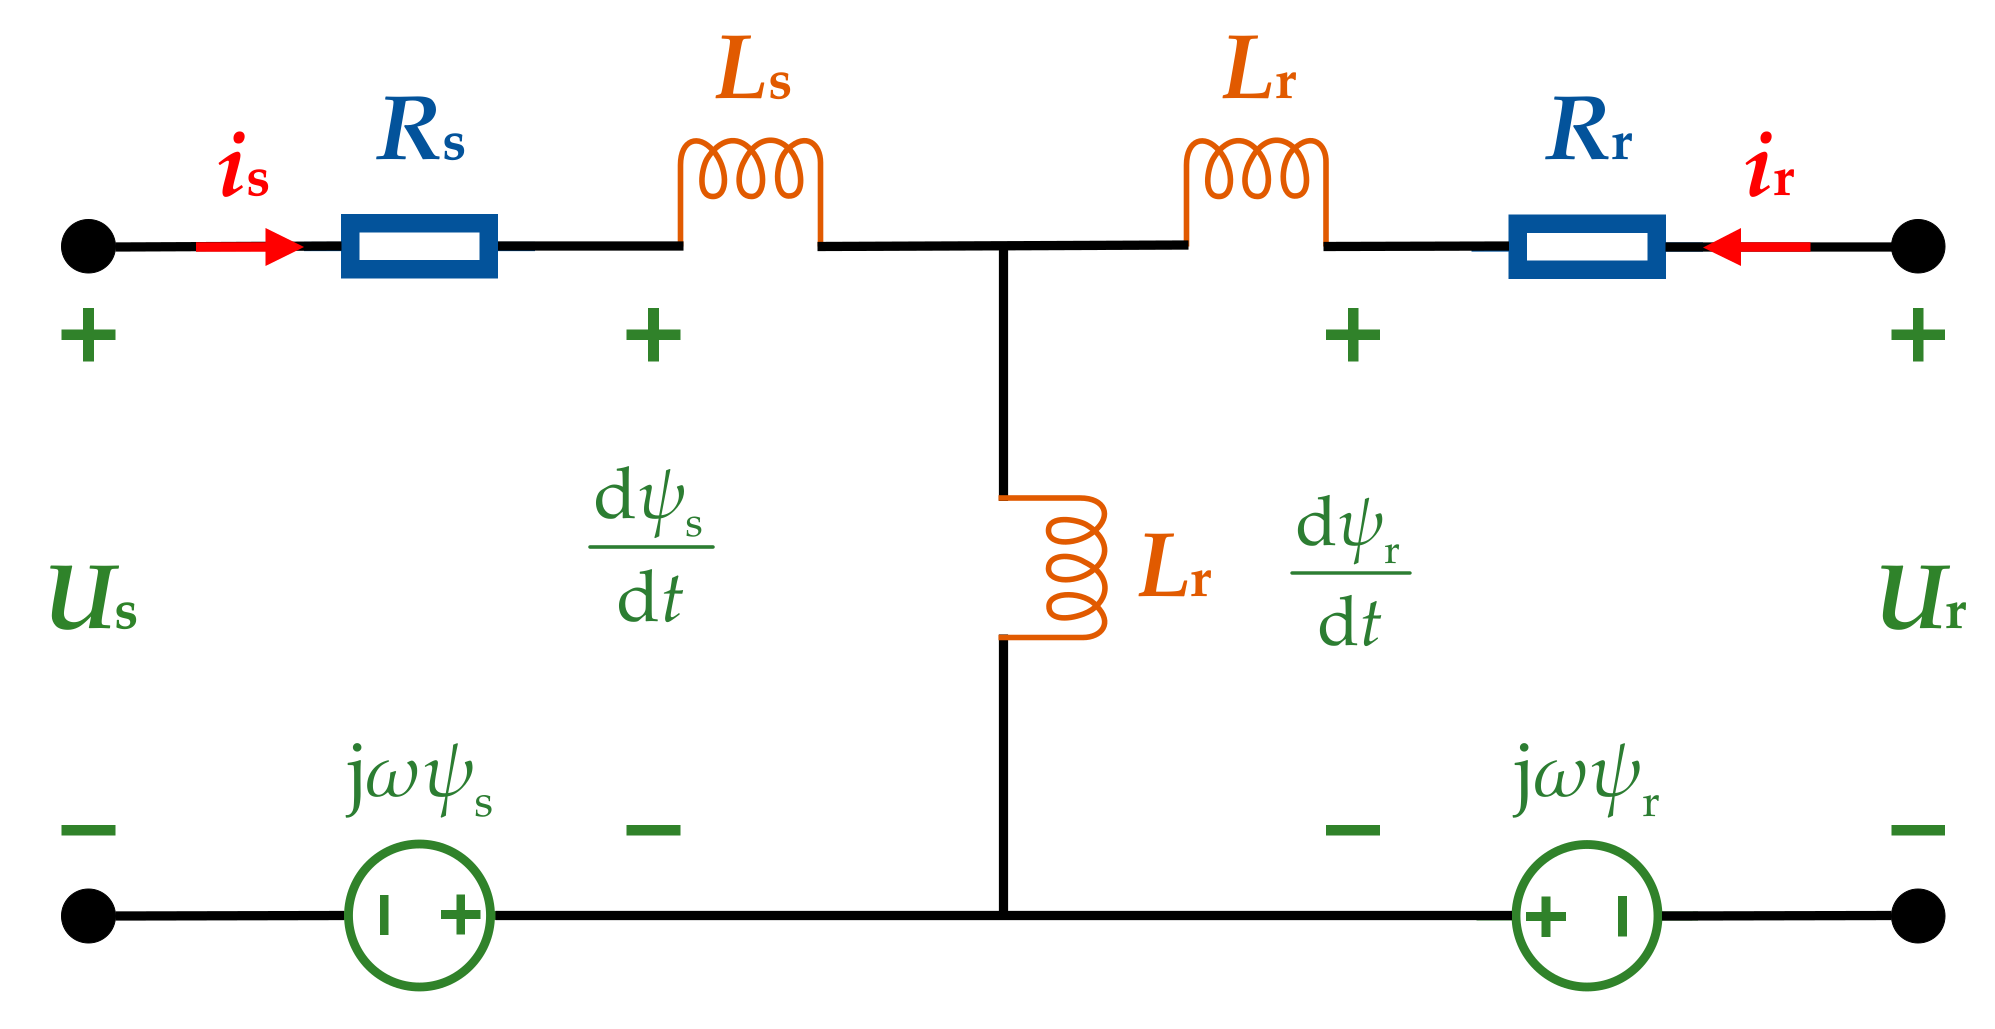
3.1. Reactive Power Output Characteristics of DFIG

The topology of DFIG is shown in Figure 7 and the equivalent circuit of DFIG is shown in Figure 8. It can be seen that the power output from DFIG to the grid comes from the stator of DFIG and the grid-side inverter. In Figure 8, Us and Ur are the voltage of rotor and stator, respectively; Rs and Rr are the equivalent resistance of rotor and stator, respectively; Ls and Lr are the equivalent inductance of rotor and stator, respectively; Lm is the mutual inductance between stator and rotor; ψs and ψr are the flux linkage of rotor and stator, respectively; ω is the angular velocity; is and ir are the current of rotor and stator, respectively.
According to Figure 8, the voltage equation, the flux equation, and the power equation of DFIG are as follows:
U s = R s i s + d ψ s d t + j ω 1 ψ s U r = R r i r + d ψ r d t + j ω 1 ψ r
ψ s = L s i s + L m i r ψ r = L r i r + L m i s
P s = 3 2 R e U dqs · i dqs * Q s = 3 2 I m U dqs · i dqs *
where Udqs and idqs are the voltage and current of stator in the DQ coordinate system.
Combining Equations (7)–(9), the range of the reactive power output, Qs, from the stator of DFIG is:
3 U s 2 2 ω 1 L s 3 L m U s 2 L s I r m a x 2 P s 2 Q s 3 U s 2 2 ω 1 L s + 3 L m U s 2 L s I r m a x 2 P s 2
According to the stator and rotor power coupling of DFIG, and the maximum power limit of the grid-side converter (Pgmax), the range of reactive power output, Qg, for grid-side commutation is:
P g m a x 2 s 2 P s 2 Q g P g m a x 2 s 2 P s 2
Therefore, the maximum and minimum reactive power output of the DFIG can be obtained as:
Q m a x = 3 U s 2 2 ω 1 L s + 3 L m U s 2 L s I r m a x 2 P s 2 + P g m a x 2 s 2 P s 2 Q m i n = 3 U s 2 2 ω 1 L s 3 L m U s 2 L s I r m a x 2 P s 2 P g m a x 2 s 2 P s 2
According to Equation (12), the inductive reactive power output capability of DFIG is not as good as its capacitive reactive power output capability. Therefore, it is necessary to install a certain reactive power compensation device on the busbar to improve the HVRT capability of the wind farm.

3.2. The Reactive Power Output Characteristics of Synchronous Condensers

Compared with traditional synchronous condensers, the state-of-art synchronous condenser is optimized in terms of transient response and overload capability. Compared with SVC and STATCOM, the synchronous condenser has the following advantages [16,17]:
(1)
When the power grid fault happens, the response speed of the synchronous condenser to output reactive current based on its own physical characteristics will be faster.
(2)
When the power grid voltage sags, the synchronous condenser can output more reactive power.
(3)
The lifetime of the synchronous condenser is longer.
When the grid voltage swells or sags, the reactive power response of the synchronous condenser is mainly divided into two parts. The first part is that the reactive power response comes from its physical characteristics. This reactive power is naturally generated when the power grid voltage changes and decays with time. The second part is the reactive power based on excitation control, and this reactive power is caused by controlling the excitation current, and requires a certain response time. The reactive current of the first part is shown as [17]:
i d = E q 0 U 0 + X d + E q 0 U 0 + X d E q 0 U 0 + X d e t T d + E q 0 U 0 + X d E q 0 U 0 + X d e t T d U 0 - U 0 + X d e t T a cos ω t + δ 0
where id is the d-axis current; Xd is the d-axis reactance; Xd is the d-axis transient reactance; X’’d is the d-axis sub-transient reactance; Eq0 is the transient potential; Eq[0] is the no-load potential; U0- is the generator terminal voltage before the fault occurs; U0+ is the generator terminal voltage after the fault occurs; Td is the d-axis transient short circuit time constant; Td is the d-axis sub-transient short circuit time constant; Ta is the stator winding time constant; ω is the angular velocity; and δ0 is the initial phase before the fault occurs.
It can be seen from Equation (13) that the instantaneous reactive power output after the fault occurs is mainly determined by the voltage change amplitude and the sub-transient reactance. The response time of reactive current output based on its physical characteristics is generally 30–40 ms, and the response time of reactive current output by excitation control is generally several hundred milliseconds. Therefore, the reactive power output characteristics of the two parts should be comprehensively considered when adopting the state-of-art synchronous condenser as a reactive power compensation device.

4. HVRT Strategy Considering Generator Terminal Voltage Distribution

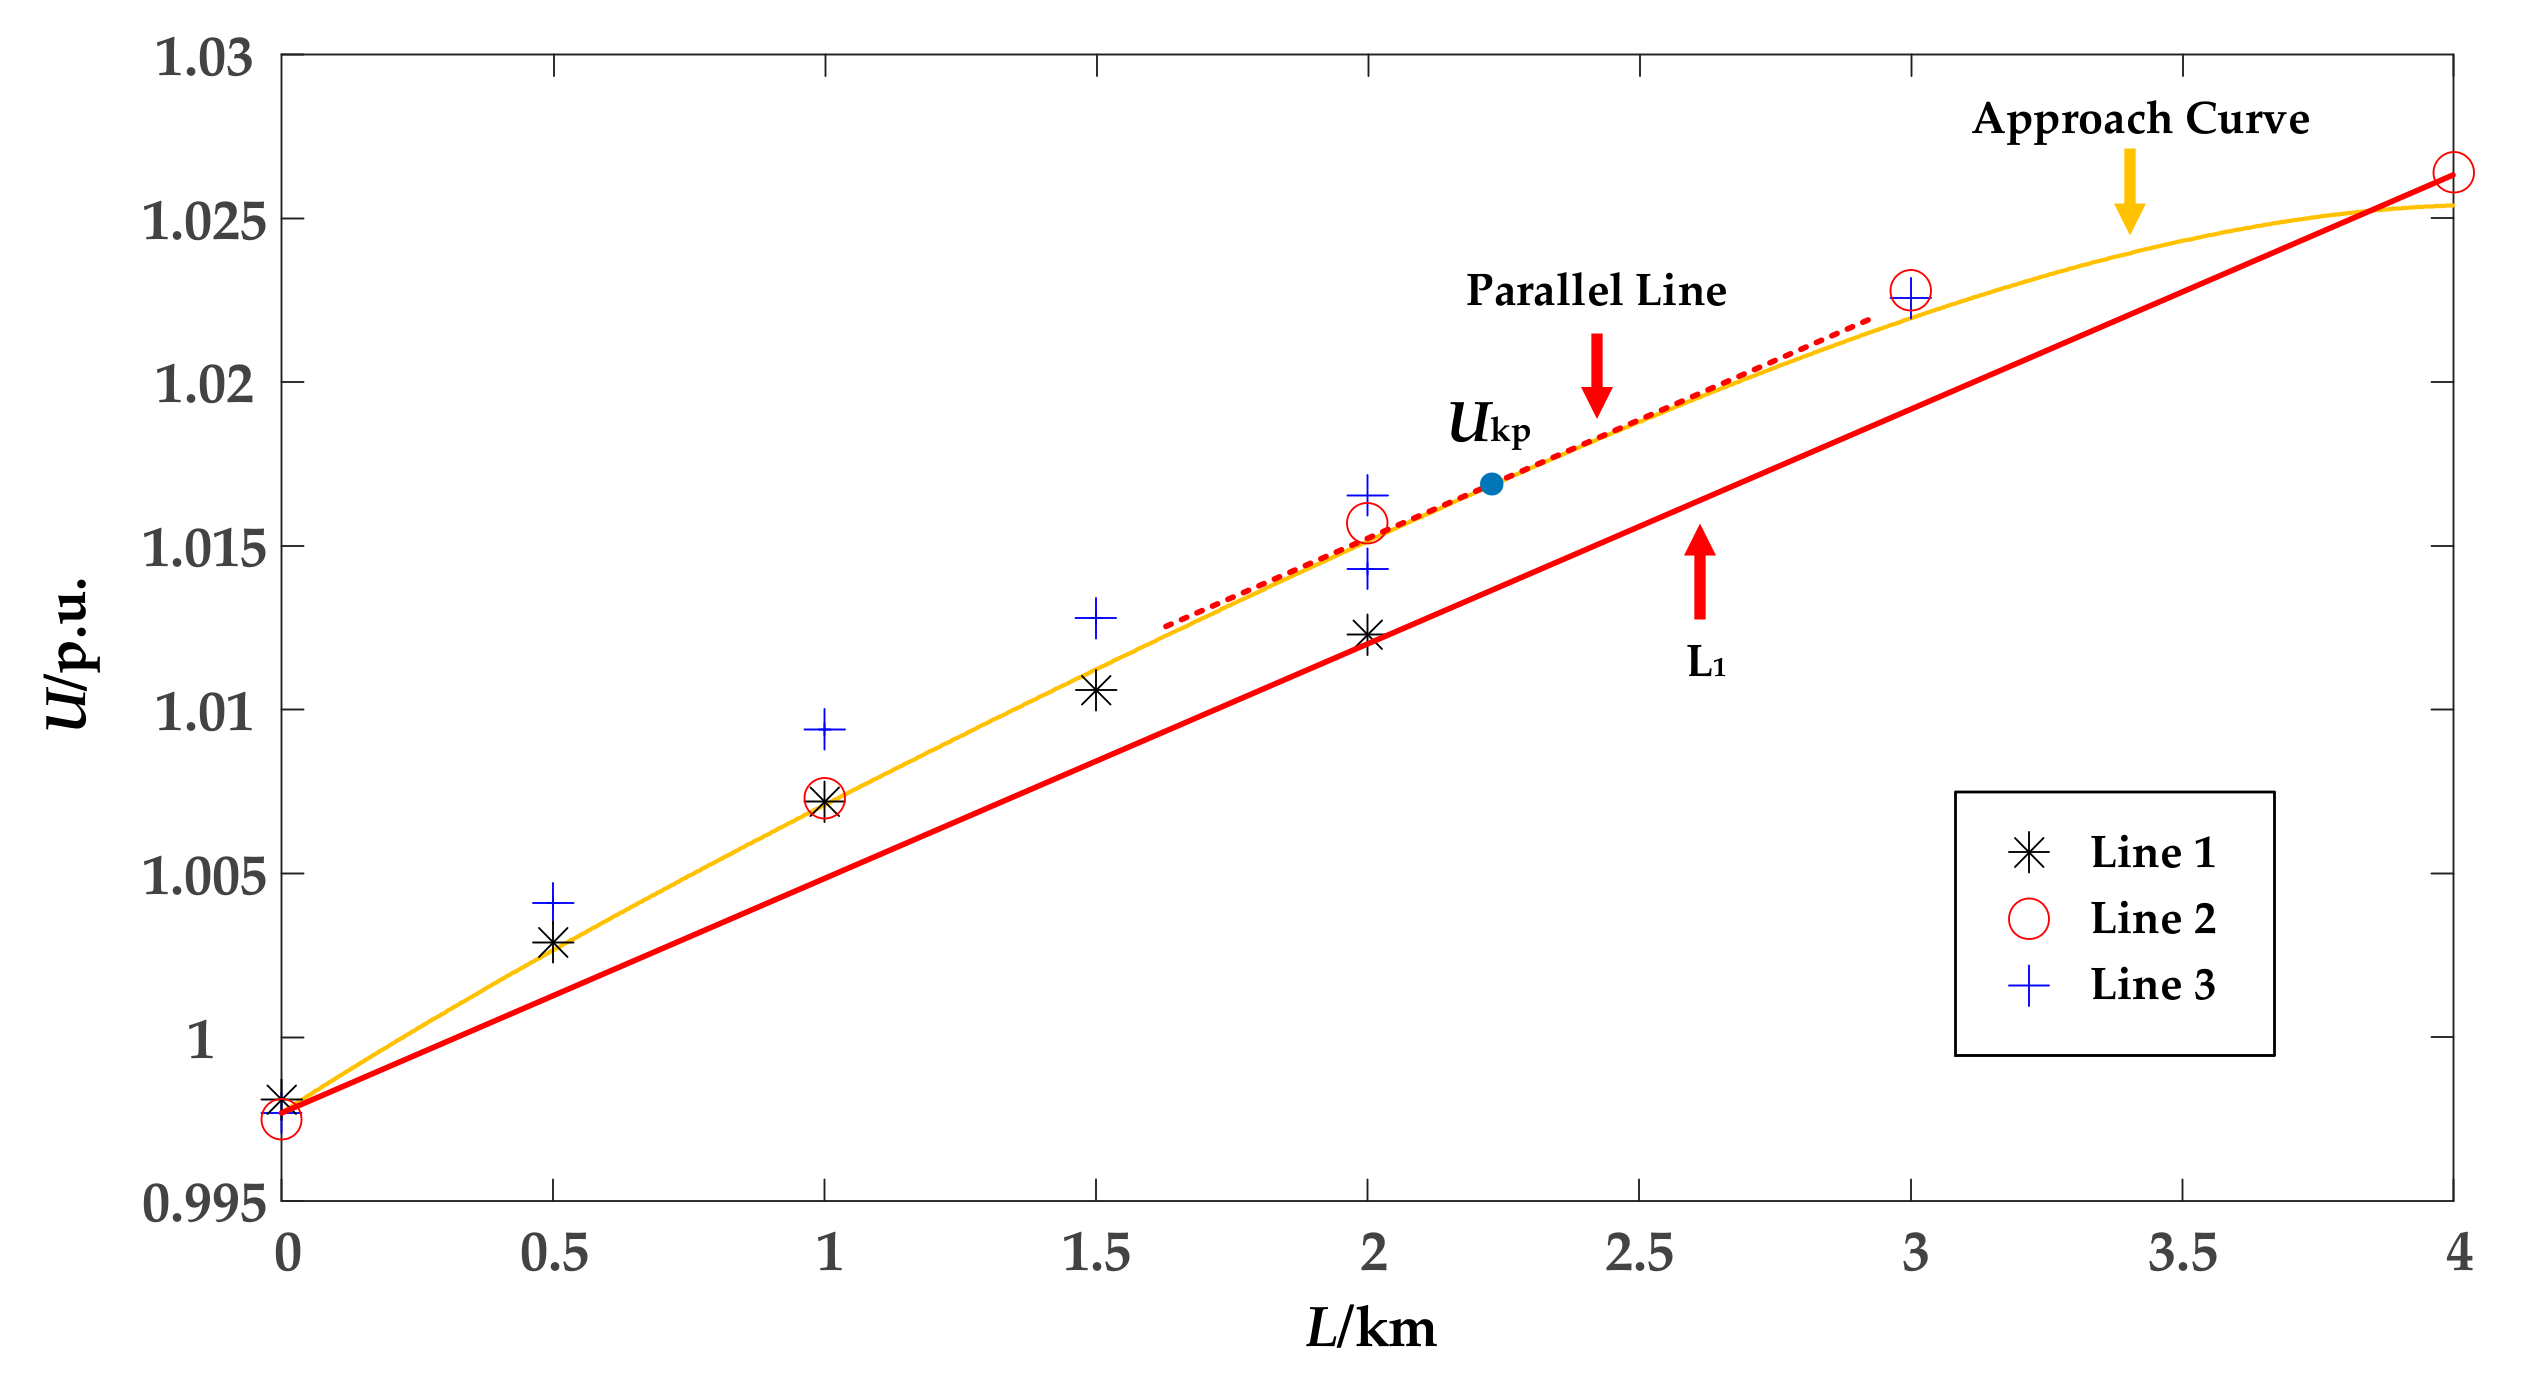
4.1. Extraction of Key Voltage Node
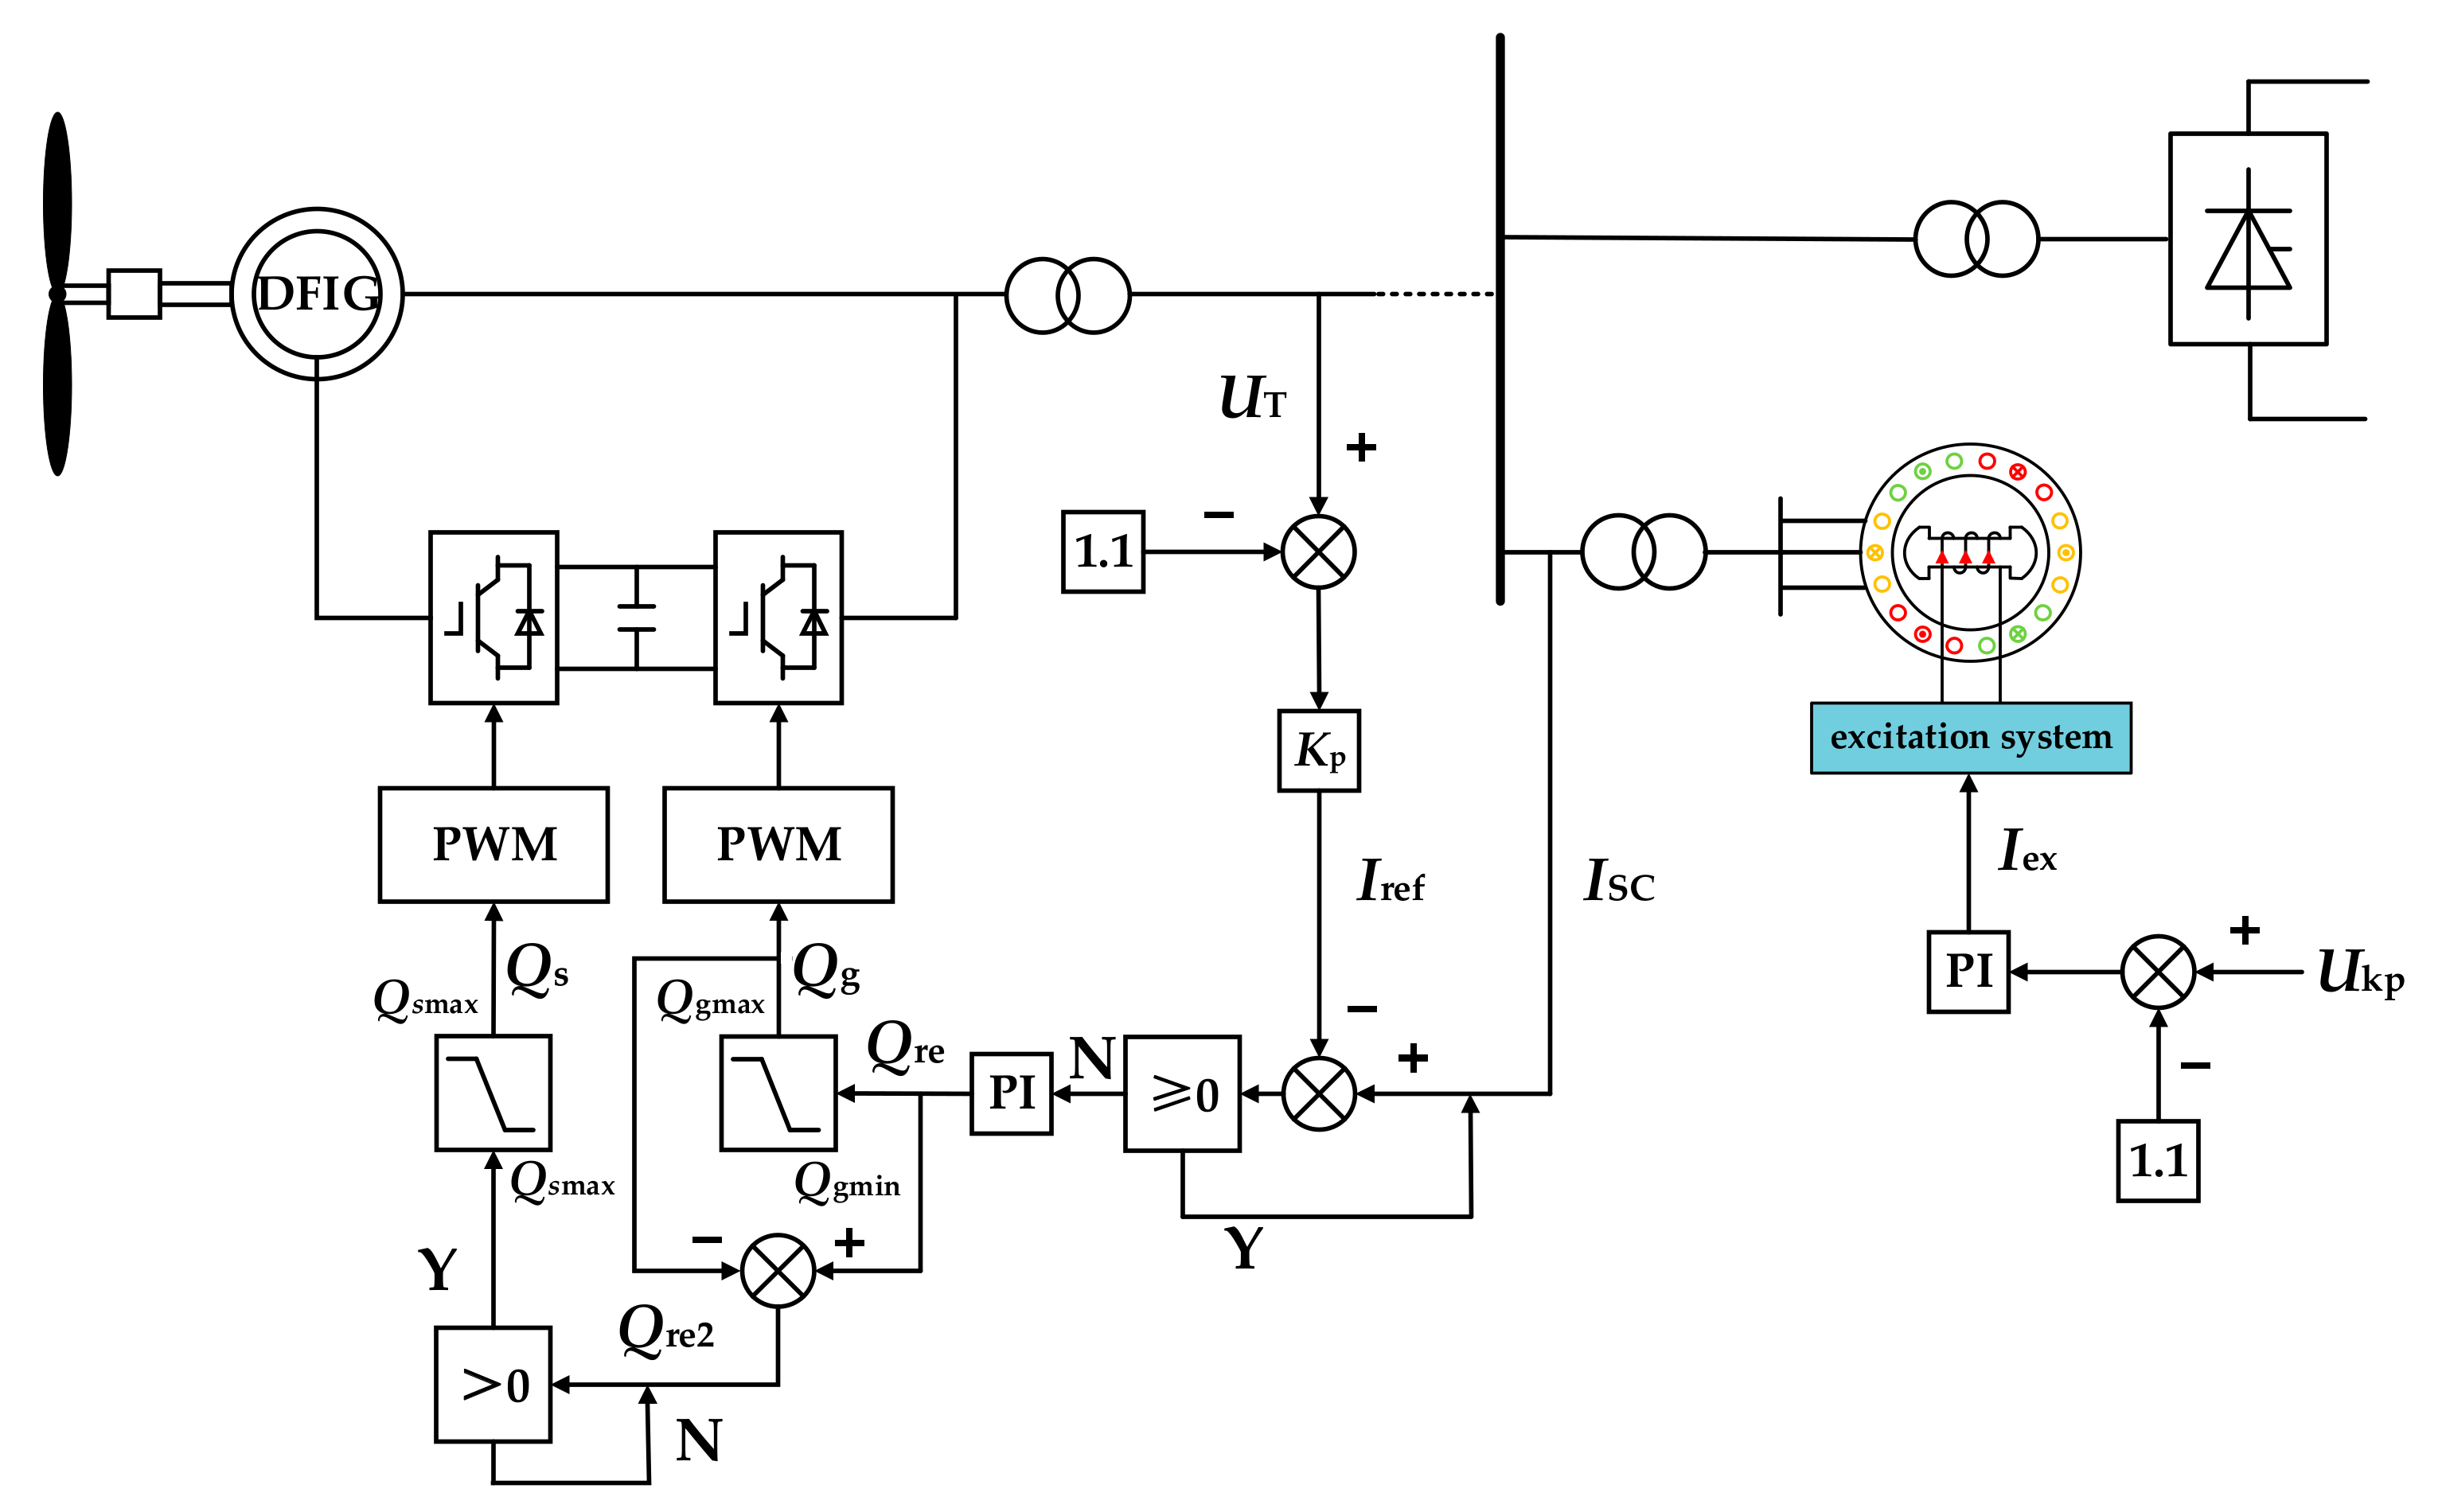
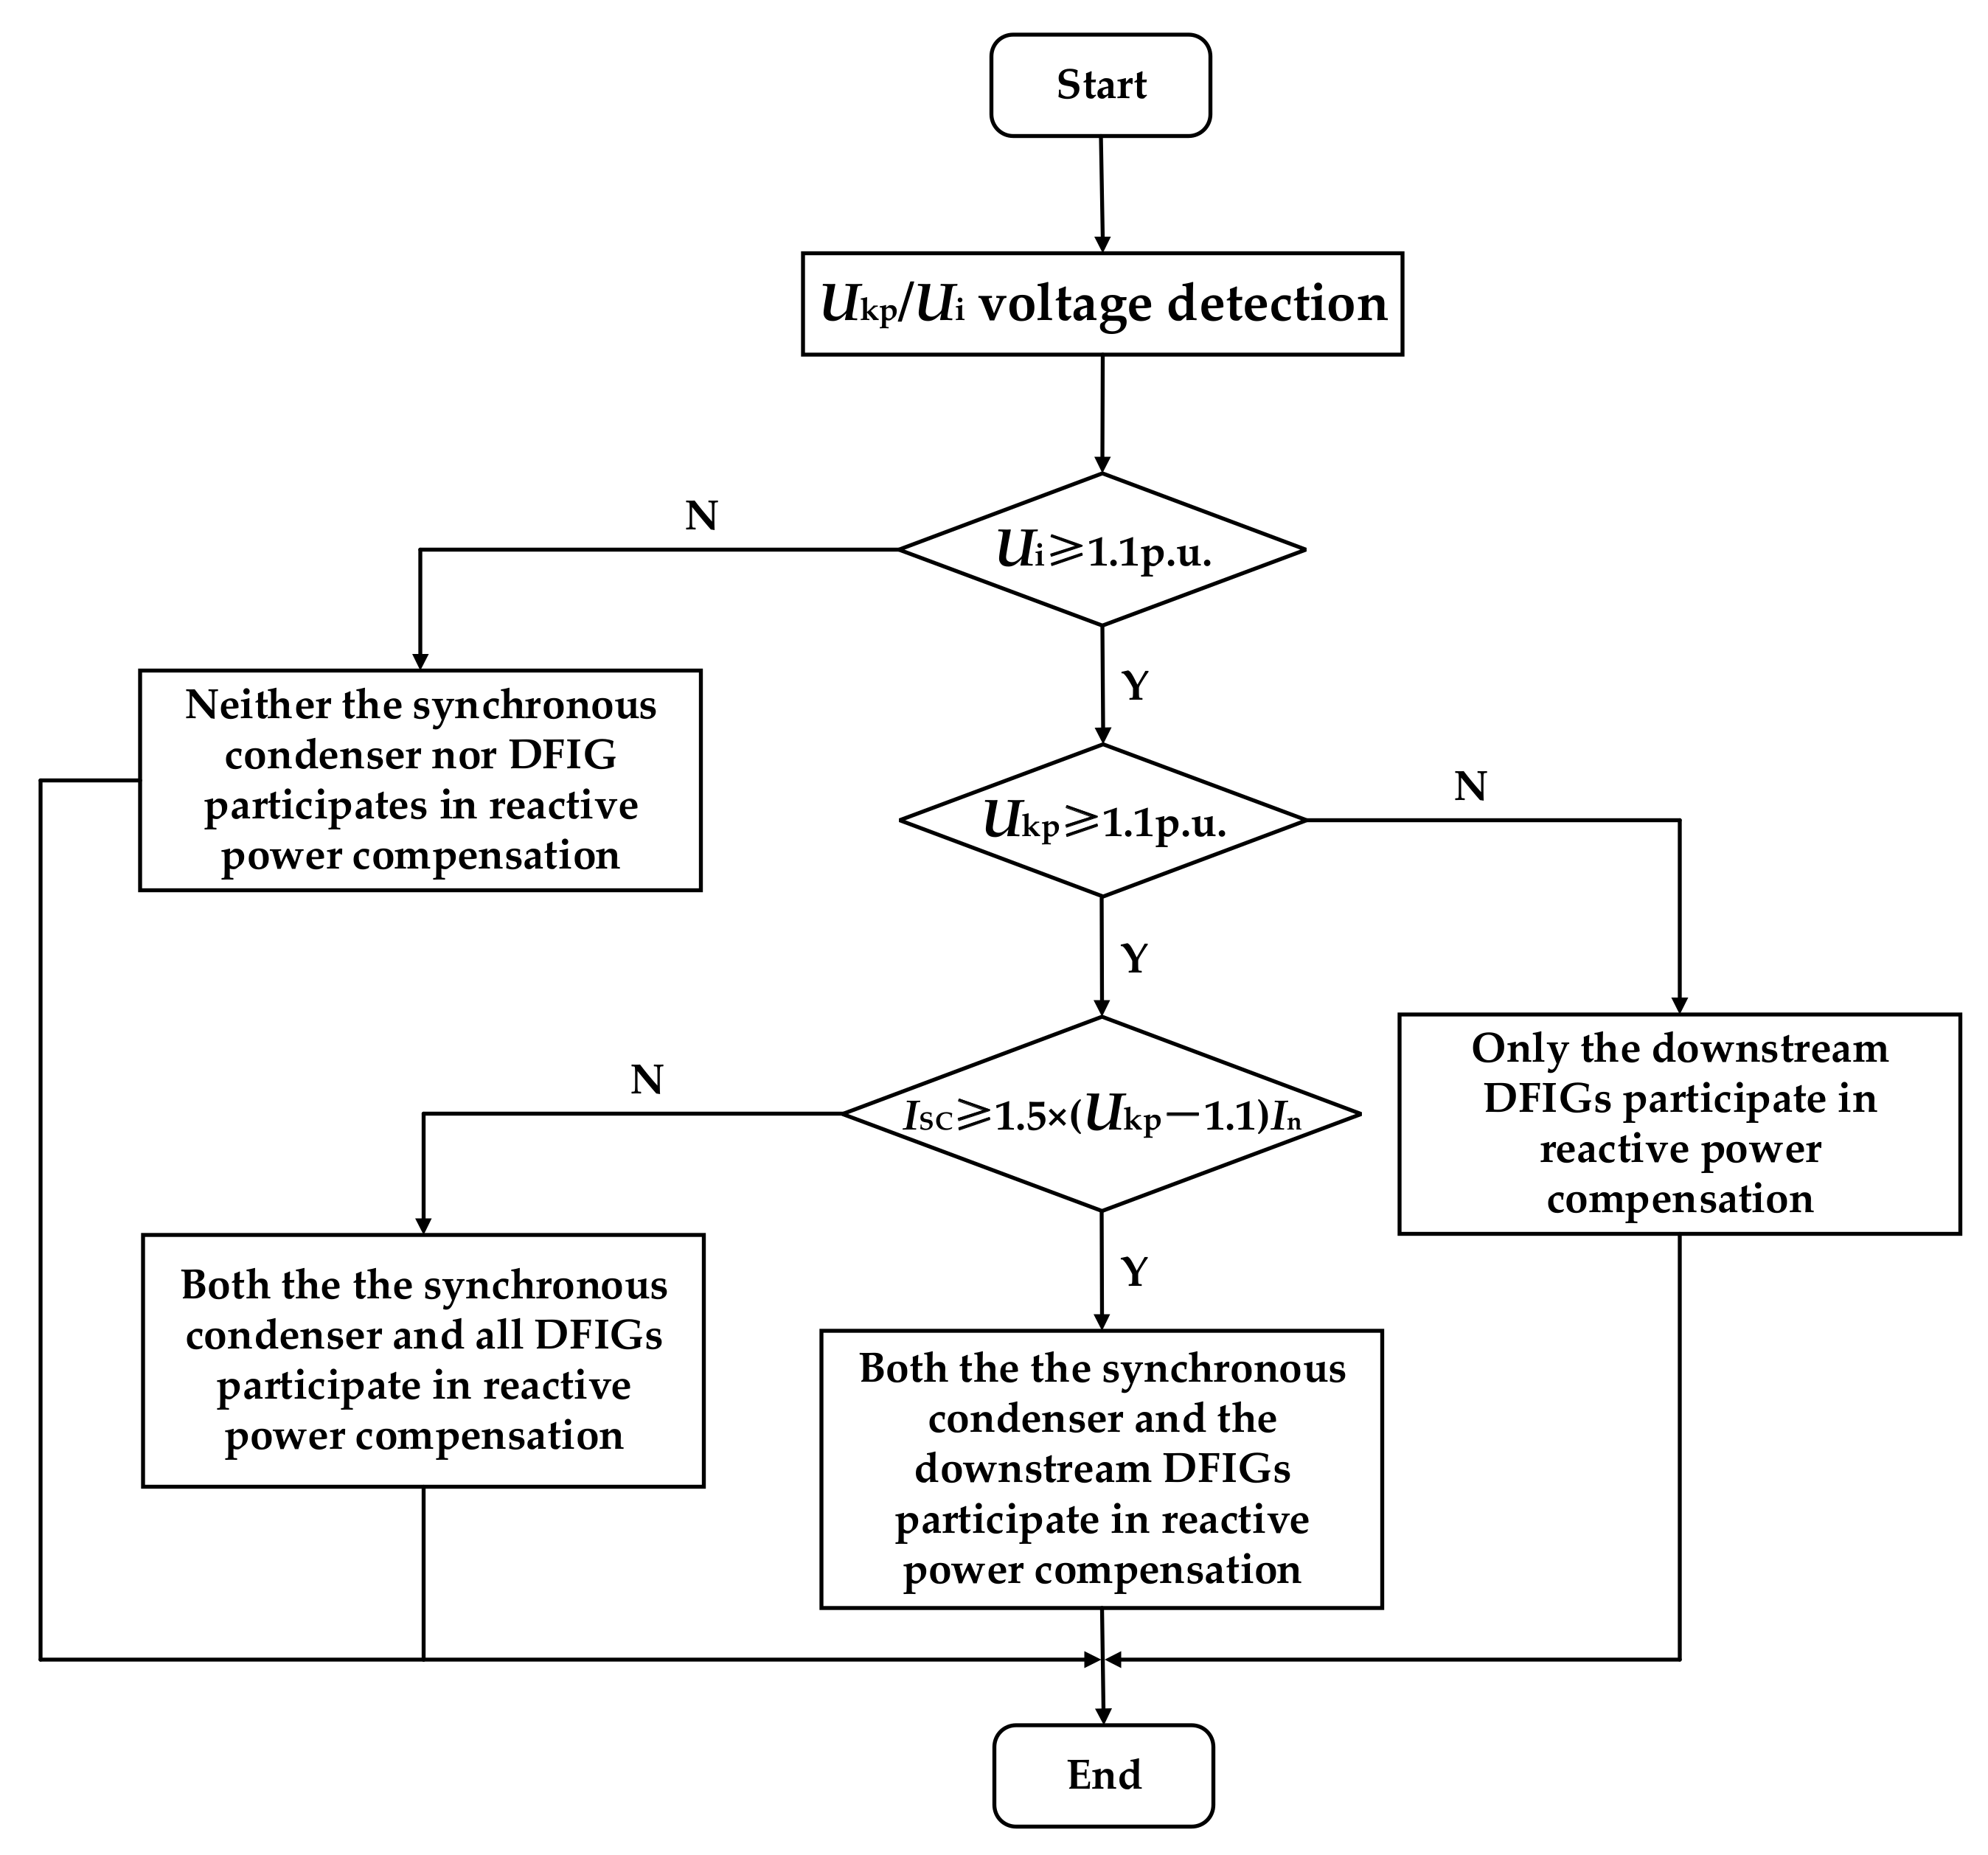
According to Section 2, the generator terminal voltage of each wind turbine in the wind farm must be considered during the HVRT period to avoid the trip-off accident happening at the end of the collection line. Therefore, the grid-connection node, the node with the lowest or highest generator terminal voltage in the wind farm cannot be selected as the reference point for reactive power compensation. Consequently, this article put forward a method for extracting key nodes.
According to the analysis result in Table 1, the voltage distribution of all wind turbines can be depicted as shown in Figure 9. The lowest voltage node in the wind farm is U1, and the highest voltage node is U10. According to the nonlinear least-squares approximation, the voltage distribution curve can be fit with
U ( L ) = - 0.000175 L 3 + 0.00007143 L 2 + 0.009739 L + 0.9975 U 1 ( L ) = 0.007075 L + 0.9975
According to Equation (14), when L varies in range (0–4), there is a unique tangent point between U(L) and U1(L). The unique tangent point is the key voltage node, Ukp, that we take. The key voltage node, Ukp, is not an actual wind turbine node, but a virtual node.
By extracting Ukp, the entire wind farm’s wind turbines can be divided into two regions. One is the set of wind turbines with a node voltage lower than Ukp, and the other is the set of wind turbines with node voltage higher than Ukp. According to Figure 9, by limiting the voltage of Ukp to within 1.1 p.u. during a HVRT period, the safe and stable operation of wind turbines with node voltages lower than Ukp can be realized. As shown in Figure 10, the key voltage node, Ukp, divides all wind turbines into two parts: the upstream wind turbines and the downstream wind turbines. The upstream wind turbines refer to the wind turbine set with node voltage lower than Ukp, and the downstream wind turbines refer to the wind turbine set with node voltage higher than Ukp. The number of downstream wind turbines is small, and further inductive reactive power output can be performed through the wind turbine’s own reactive power compensation capability.
It should be noticed that the generator terminal voltage detection and the extraction of key voltage point are updated in real time according to the variation of the wind farm. According to China’s national technical rule for connecting wind farms to power systems, promulgated in 2011, wind farms are required to be equipped with certain voltage/var management devices before being put into operation [23]. These voltage/var management devices have the characteristics of quick adjustment speed, high precision, simple installation, and being maintenance-free. As shown in Figure 11, each wind turbine is equipped with an independent distributed control device, which is able to detect the wind turbine information (including generator terminal voltage) and transmit to a centralized control device, receive control instructions from the centralized control device, and transmit to the wind turbine. The HVRT strategy proposed in this article is based on real-time voltage transmission. The centralized control device generates the voltage distribution curve of the wind farm, and calculates the reactive power compensation reference point (the key voltage node). During a HVRT period, the centralized control device generates the corresponding reactive power compensation instructions, and transmits to the synchronous condenser and wind turbines [24].

4.2. HVRT Strategy

As shown in Figure 12, this article put forward a HVRT coordinated control strategy between the DFIG and the synchronous condenser, based on the difference in reactive power output characteristics. Iex is the synchronous condenser reactive current command to maintain Ukp at 1.1 p.u.; Isc is the reactive current output of the synchronous condenser; UT is the generator terminal voltage of DFIG; Iref is the reactive current command to maintain UT at 1.1 p.u.; Qre is the additional reactive power compensation (if Isc < Iref) command; Qgmax and Qgmin are the upper and lower limits of reactive power compensation of the grid-side converter, respectively; Qg is the reactive power command, issued to the grid-side converter; Qre2 is the additional reactive power compensation (if Isc < Iref and Qre > Qgmax) command; Qsmax and Qsmin are the upper and lower limits of reactive power compensation of the stator, respectively; and Qs is the reactive power command issued to the rotor-side converter.
This strategy extracts Ukp as the voltage reference point. During a HVRT period, the excitation current target value is generated through stabilizing the voltage of Ukp, and transmitted to the excitation system of the synchronous condenser. At the same time, by detecting the reactive current output of the synchronous condenser, it is judged whether it meets the reactive current output requirement (as shown in Equation (15)). If it cannot meet the requirement, then a further reactive power compensation command will be issued to the DFIG. Since the stability of the busbar voltage is prerequisite to ensure that DFIG avoids trip-off accidents during a voltage swell period, priority is given to the reactive output capacity of the grid-side converter. When the maximum reactive power output of the grid-side converter cannot meet the reactive current compensation requirement, the reactive power compensation command will be issued to the generator-side converter, which controls the reactive current output from the stator of the DFIG.
According to the above strategy, a coordinated control flow chart is shown in Figure 13. Whether each reactive power source in the wind farm participates in reactive power compensation depends on the voltage swell amplitude of the generator terminal voltage. While generator terminal voltage of all DFIGs is lower than 1.1 p.u., no additional reactive power compensation is required. While the generator terminal voltage of a few wind turbines is higher than 1.1 p.u. and Ukp is lower than 1.1 p.u., only the downstream DFIGs participate in additional reactive power compensation. While generator terminal voltage of some wind turbines and Ukp are higher than 1.1 p.u., and synchronous condenser reactive current satisfies Equation (15), the synchronous condenser and the downstream DFIGs participate in additional reactive power compensation. While the generator terminal voltage of some wind turbines and Ukp are higher than 1.1 p.u., and synchronous condenser reactive current cannot satisfy Equation (15), the synchronous condenser and all DFIGs participate in additional reactive power compensation.
I SC 1.5 × U T 1.1 I n
The proposed HVRT strategy can be implemented based on the existing distributed control devices and centralized control device, without additional installations. When an AC failure, a commutation failure, or a DC blocking failure happens, it will cause a transient voltage swell at the grid-connection point of the wind farm. Therefore, the HVRT strategy can be applied to multiple failure scenarios.

5. Simulation and Analysis

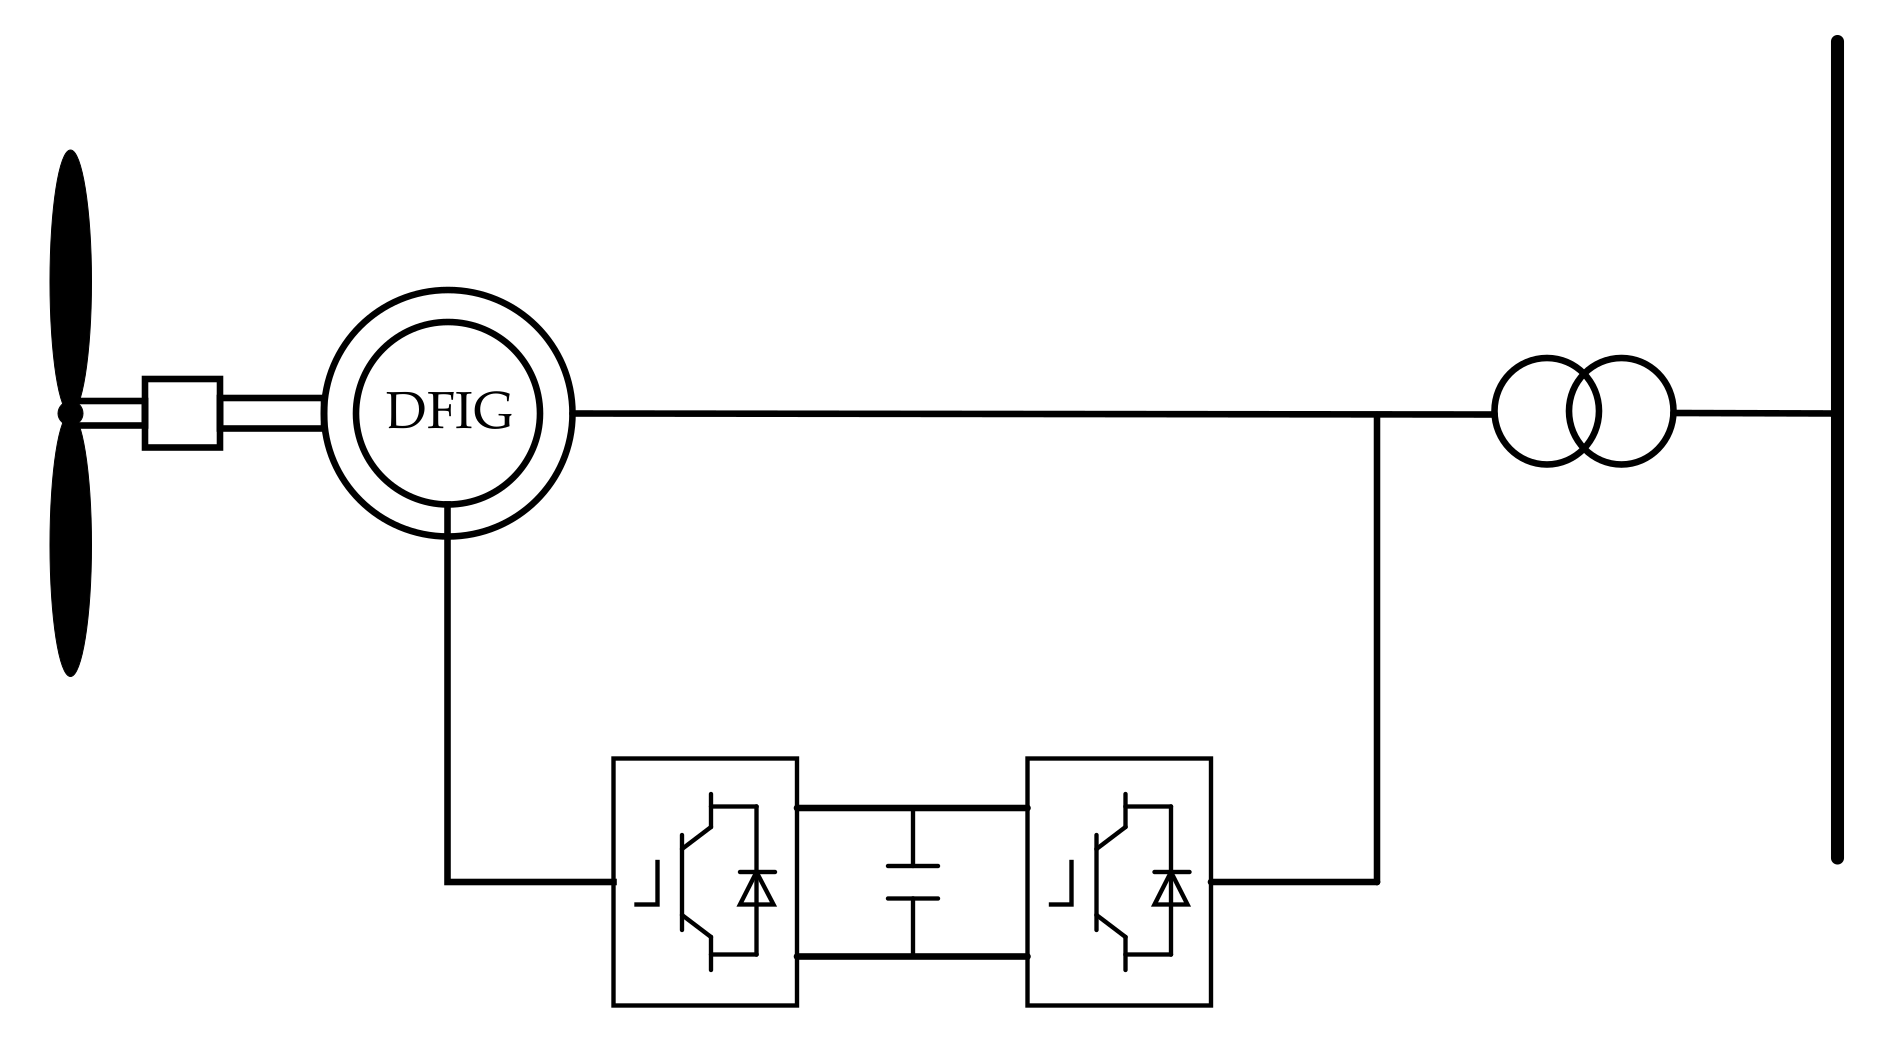
5.1. Simulation Model

In order to verify the effectiveness of the proposed strategy, the test model as shown in Figure 1 was built in the MATLAB/SIMULINK. The DC line voltage level was ±500 kV, and the rated transmission power was 1000 MW. In this test system, a synchronous condenser with a rated capacity of 100 Mvar was connected to the AC busbar at the sending-end grid. The control objective of the synchronous condenser is to maintain the stability of the Ukp voltage. Parameters of the synchronous condenser are shown in Table 2. The wind farm model was built according to the topology shown in Figure 3, and the parameters of the DFIG are shown in Table 3.

5.2. Simulation Result and Analysis

With a DC blocking fault occurring at 1 s, then the sending end AC busbar voltage swells rapidly, due to the surplus of reactive power, which exceeds the normal operating range allowed by the wind farm, and the wind turbines enter the HVRT process.
According to the specifications of HVRT technology in various countries, wind turbines are required to keep operation when the generator terminal voltage is lower than 1.1 p.u. [25]. Therefore, the value of the generator terminal voltage determines whether the wind turbine is able to ride-through successfully. Taking into account the operational safety of all wind turbines in the wind farm, the voltage swell index (VSI) is proposed to calculate the average ratio of each generator terminal voltage to 1.1 p.u., which is used to measure the performance of the HVRT strategy. The calculation formula of VSI is shown in Equation (16). Similarly, according to the specifications of HVRT technology in various countries, wind turbines are required to keep operation for a certain time when the generator terminal voltage is higher than 1.1 p.u. [24]. Ride-through time (RRT) index was also proposed to measure the performance of the HVRT strategy.
VSI = U i 1.1 n
Taking the grid-connection node as the control target of the synchronous condenser, the generator terminal voltage variation curves of the wind turbines on the three collection lines are shown in Figure 14, respectively, and the partial of generator terminal voltage variation curves during HVRT are shown in Figure 15, respectively. HVRT indicators are shown in Table 4.
Adopting the proposed strategy, the generator terminal voltage variation curves of the wind turbines on the three collection lines are shown in Figure 16, respectively, and the partial curves of generator terminal voltage variation during HVRT are shown in Figure 17, respectively. HVRT indicators are shown in Table 5.
Comparing the voltage generator terminal voltage variation curve of the wind turbines and the HVRT indicator data of the wind farms in the two cases, by adopting the proposed HVRT strategy in this article, the maximum generator terminal voltage of the wind turbines in the fault state is lower than 0.056 average VSI, and the ride-through time is shortened to about 33 ms average RTT.
Compared to the grid-connection point, the key voltage node, Ukp, extracted in this article has a faster response to the busbar voltage swell, thus improving the reactive power compensation response speed of the synchronous condenser, and shortening the HVRT duration of all wind turbines in the wind farm. In addition, the key voltage node has a higher voltage, which can increase the reactive power compensation output of the synchronous condenser, and effectively inhibit the voltage swell of the generator terminal voltage of wind turbines.

6. Conclusions

Based on the voltage distribution inside the wind farm, this article analyzes the HVRT problem of wind farms under a DC blocking fault in the HVDC transmission system. By extracting the key voltage node of the wind farm and taking the key voltage node as the control target of the reactive power compensation strategy, a HVRT strategy considering voltage distribution was proposed, which enhanced the HVRT capability of wind farms. The article draws the following conclusions:
(1)
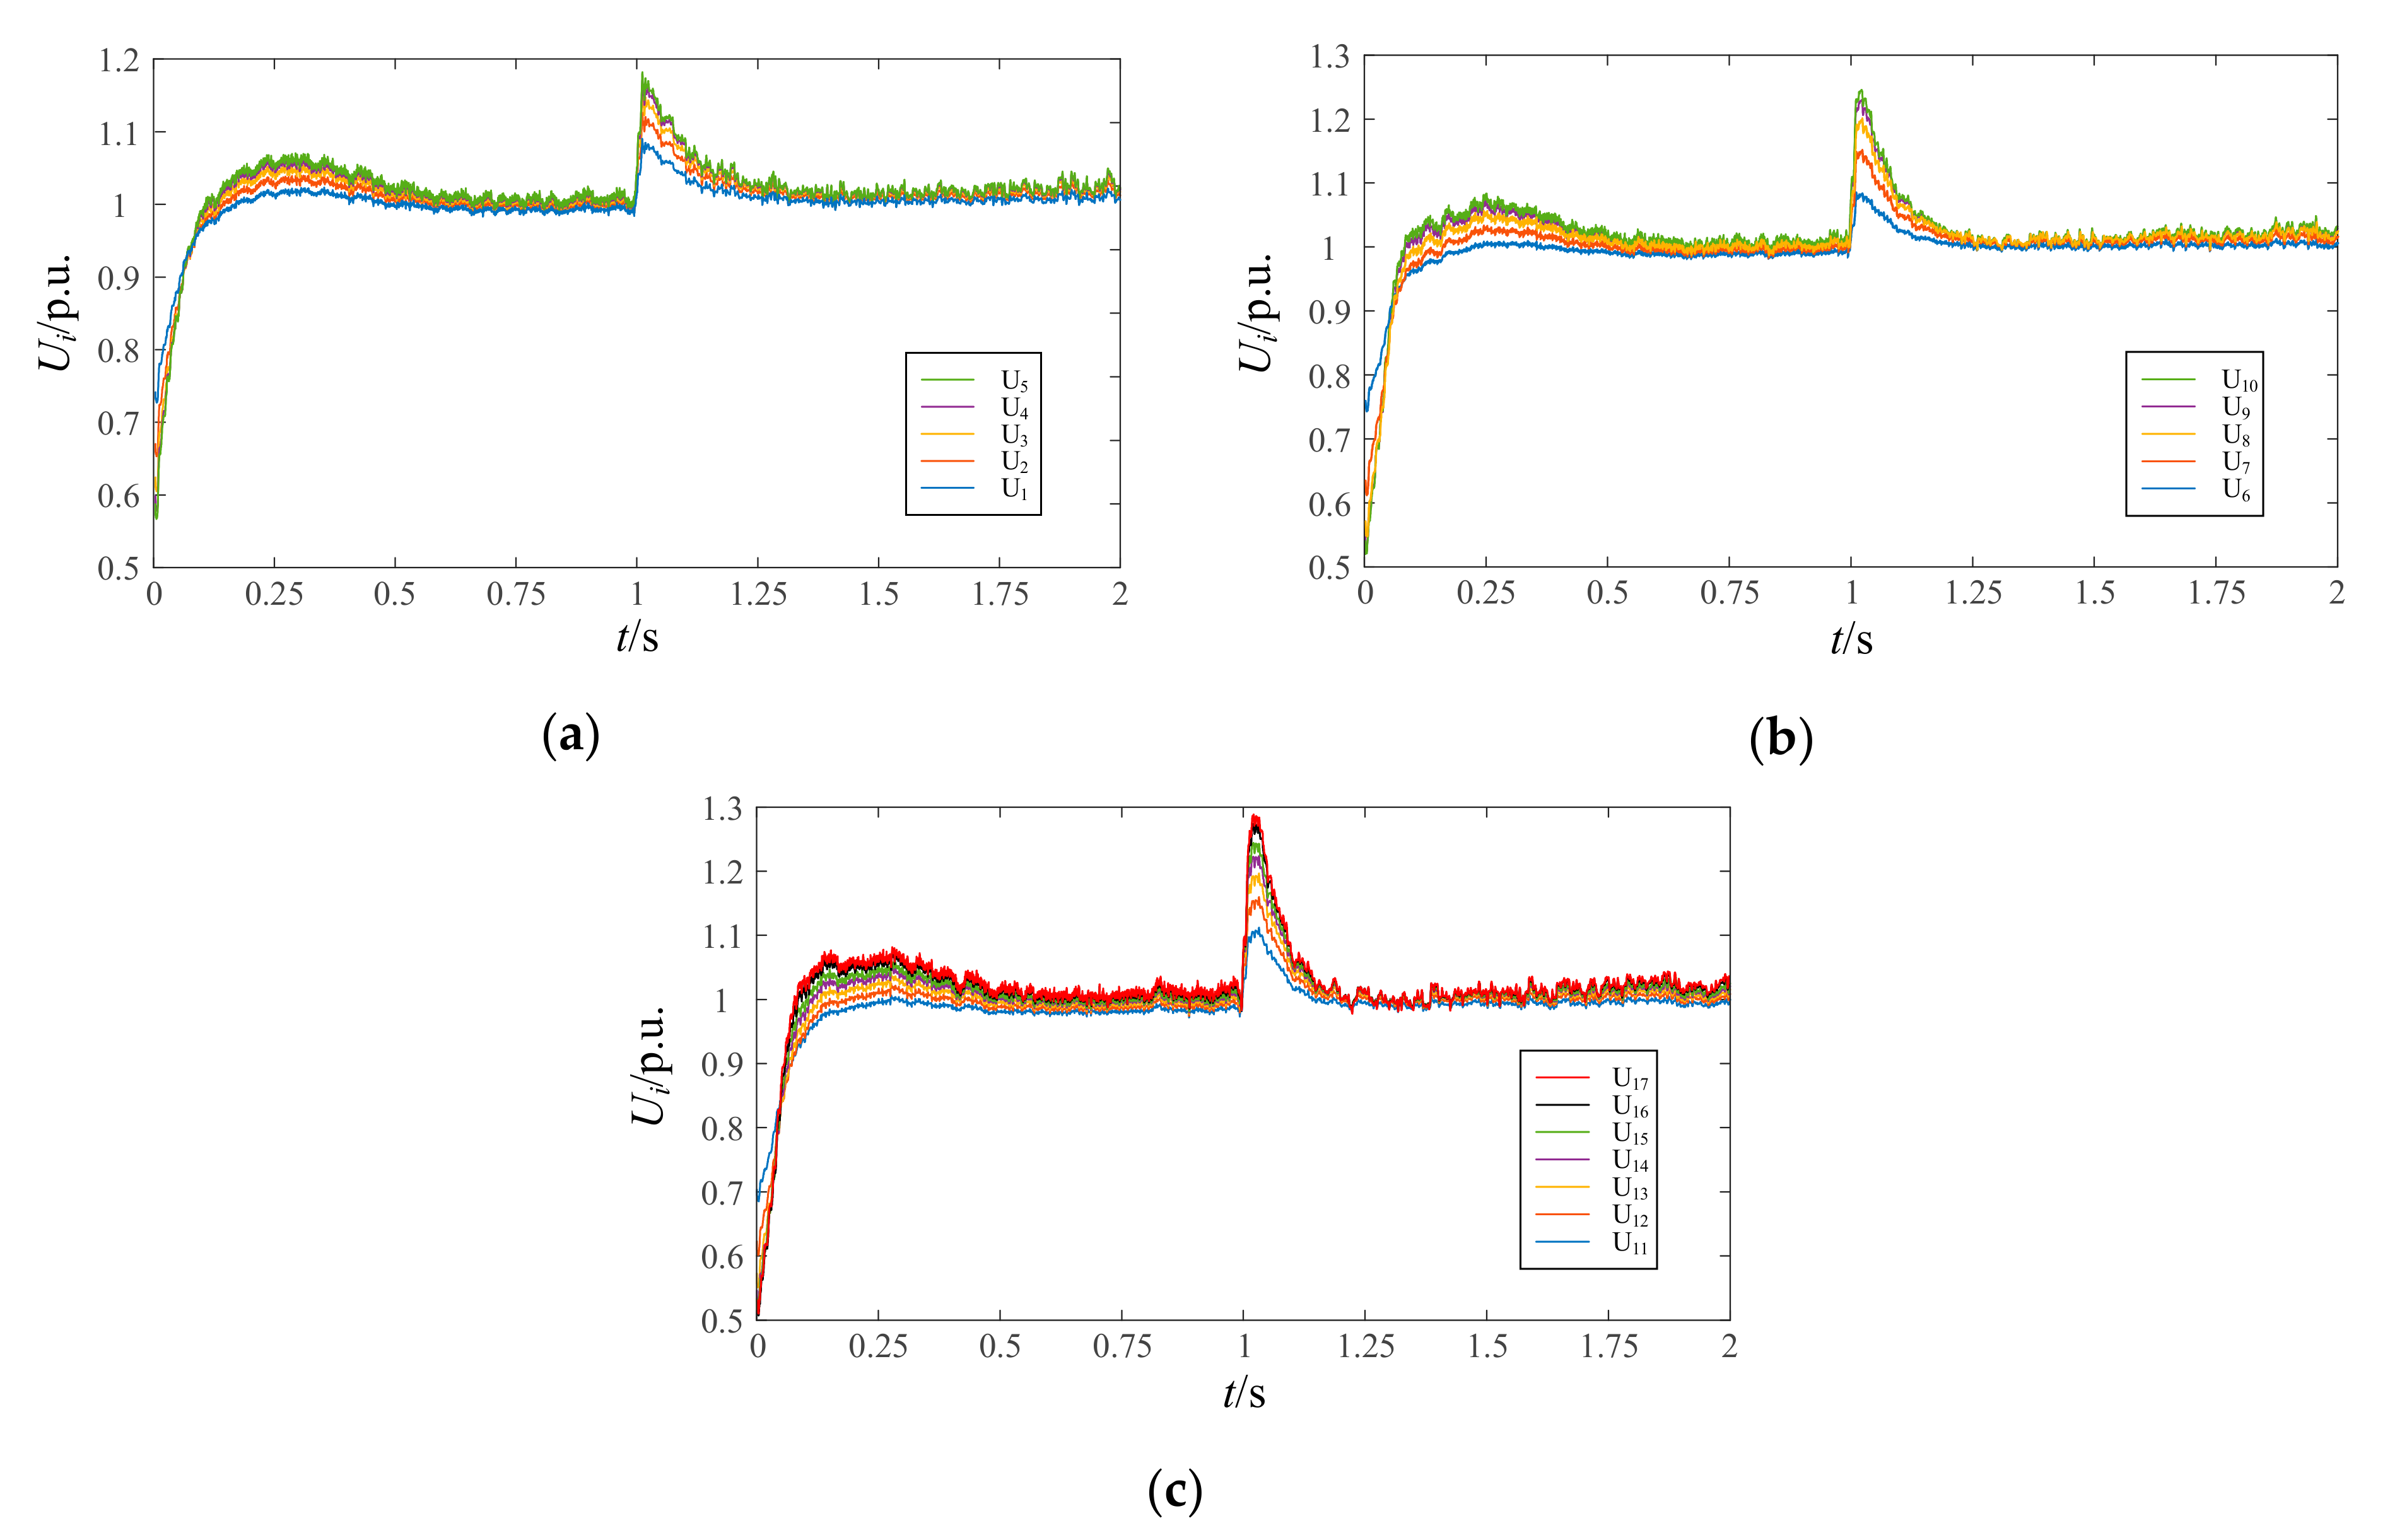
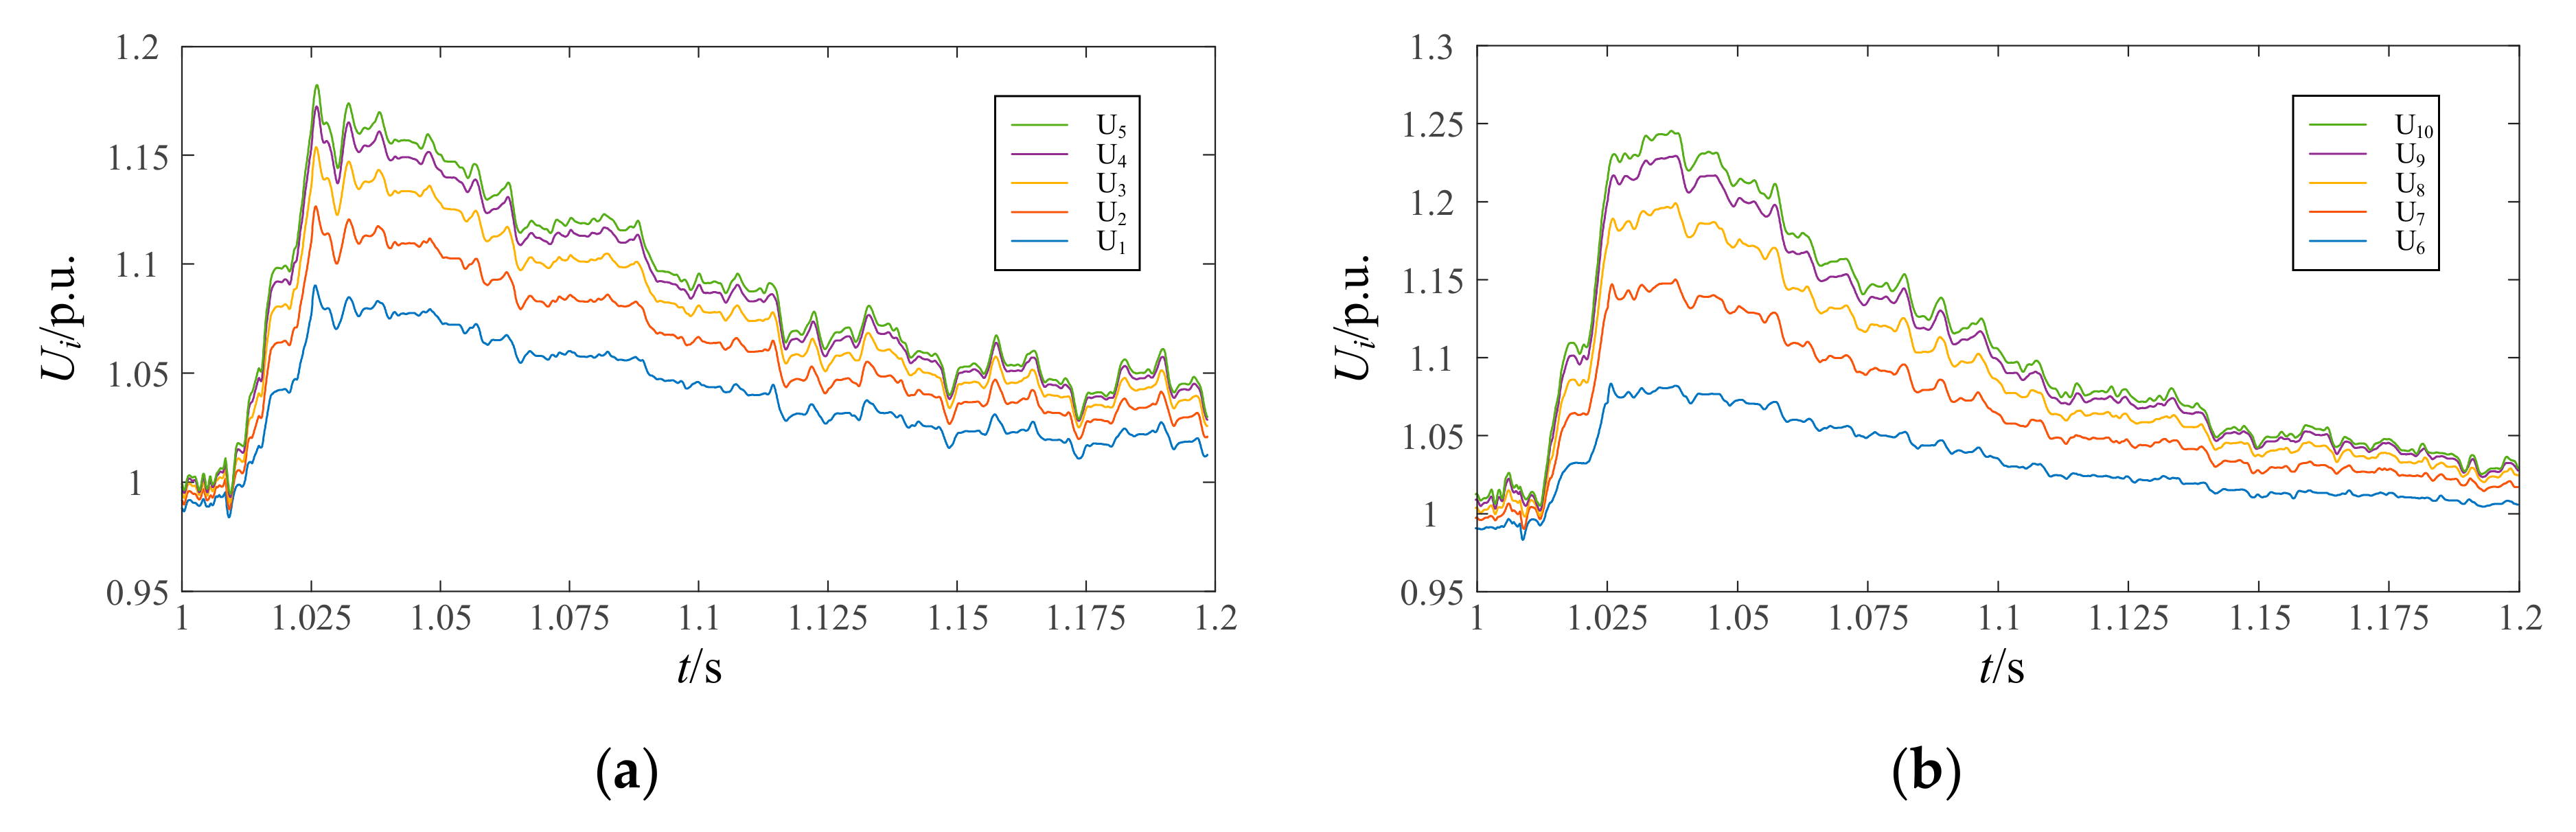
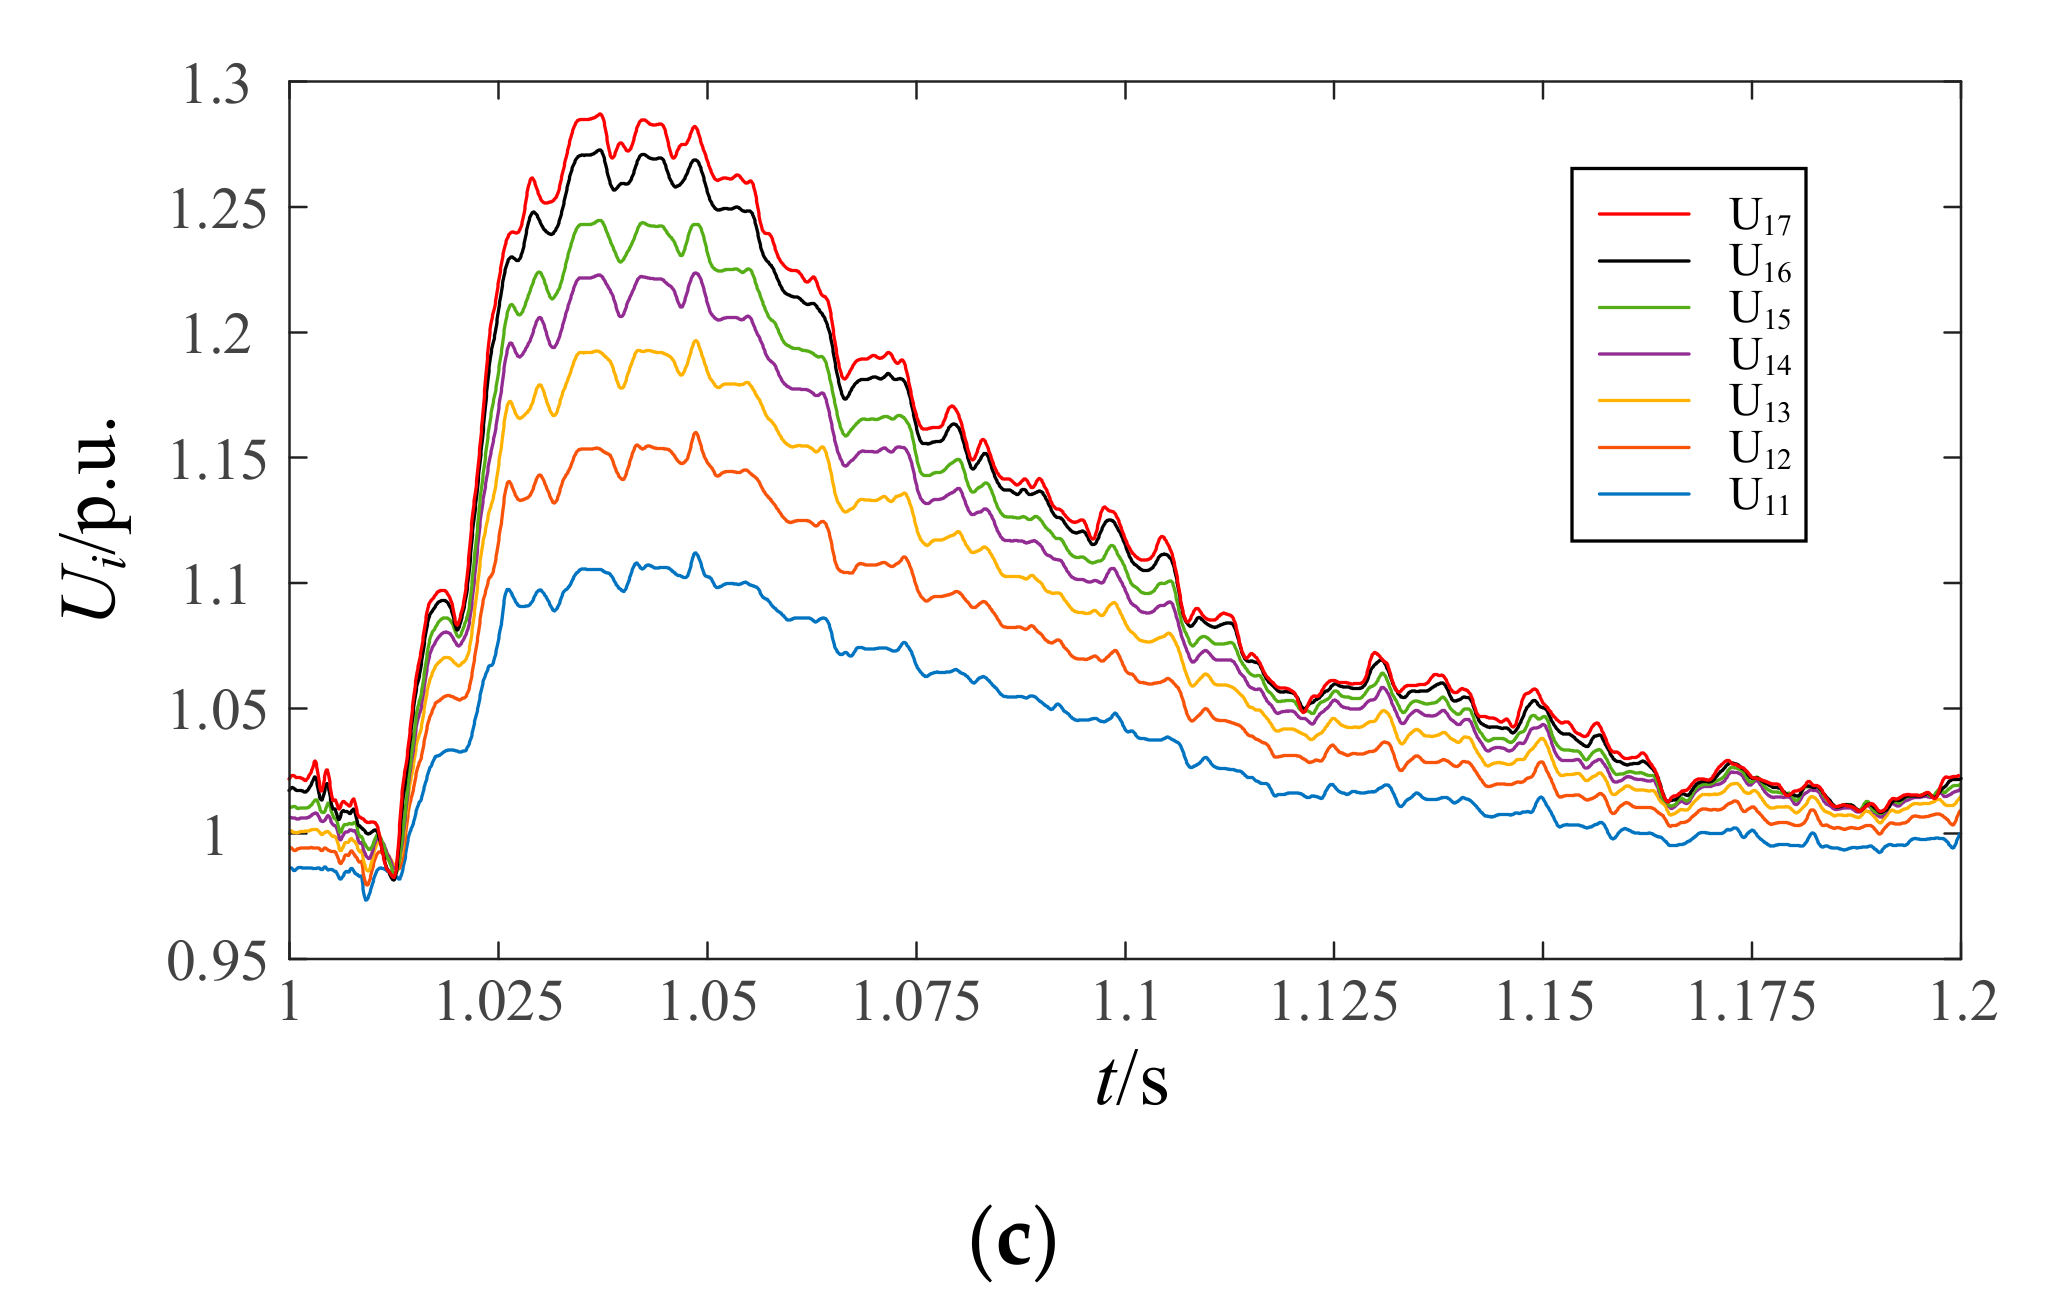
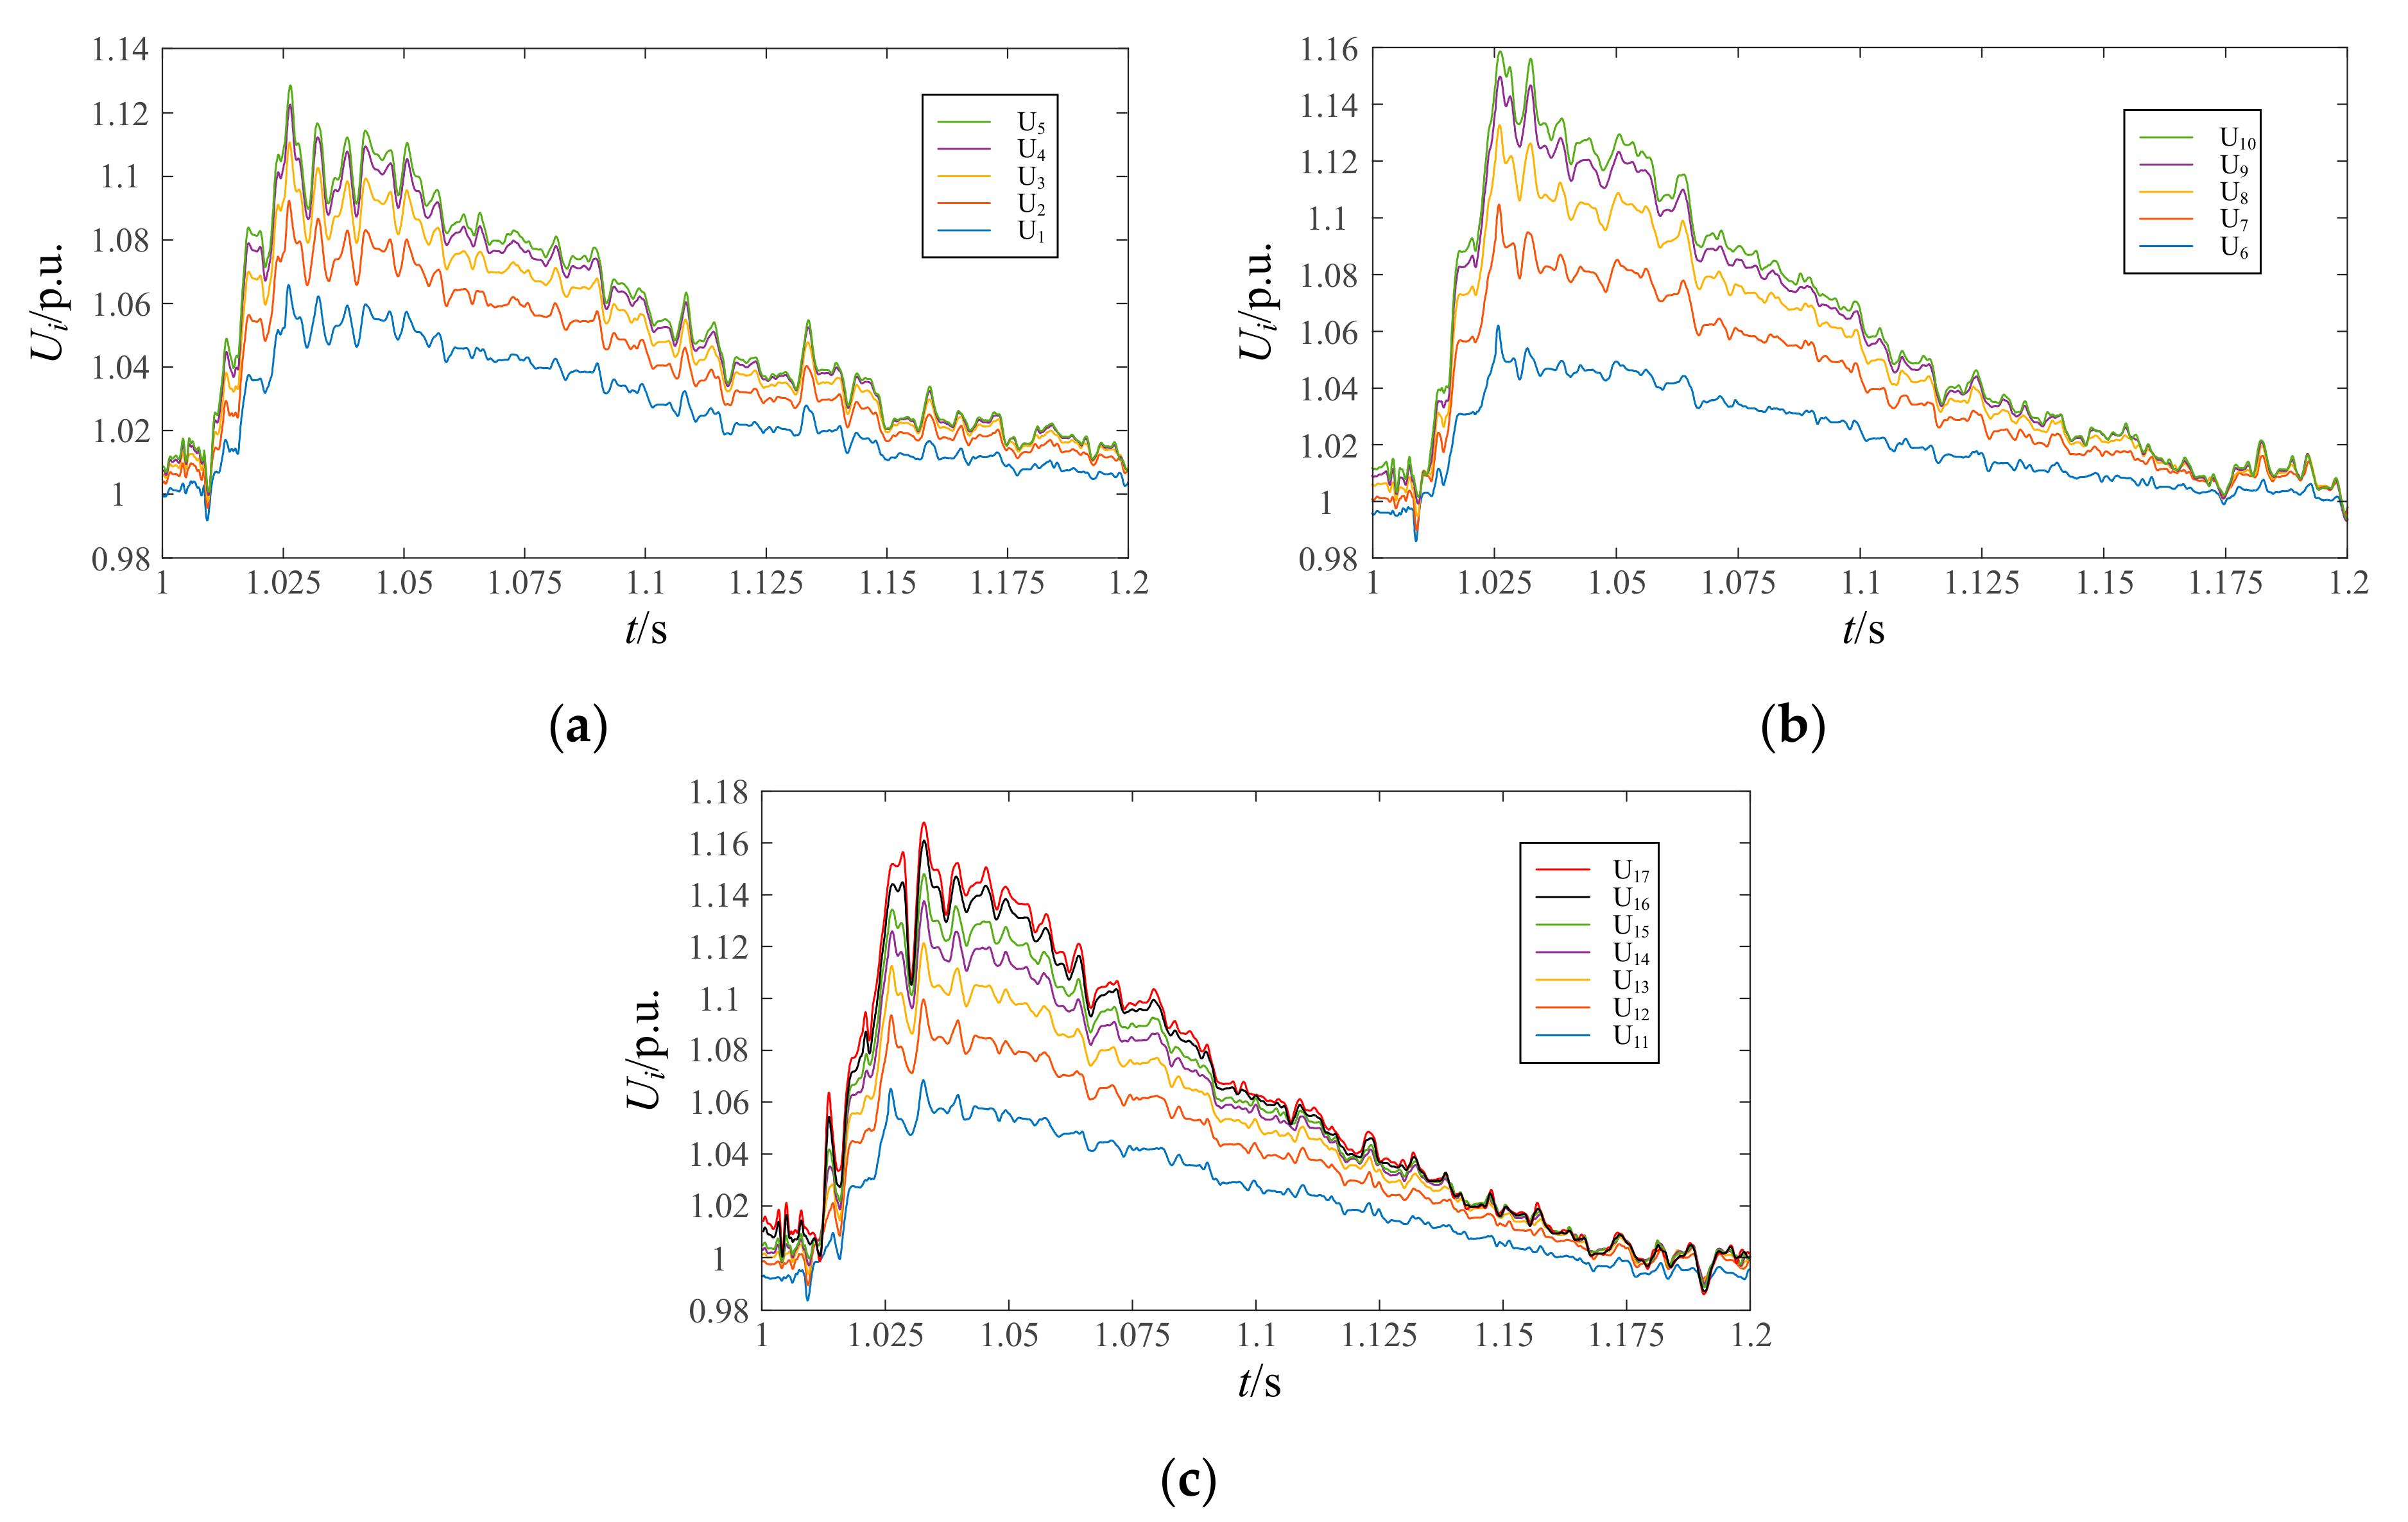
With the expansion of wind farms and the increase of collection line length, the generator terminal voltage of the wind turbines downstream of the collection line is higher than that of upstream wind turbines. The further away from the grid-connection point, the smaller the voltage difference between two adjacent wind turbines.
(2)
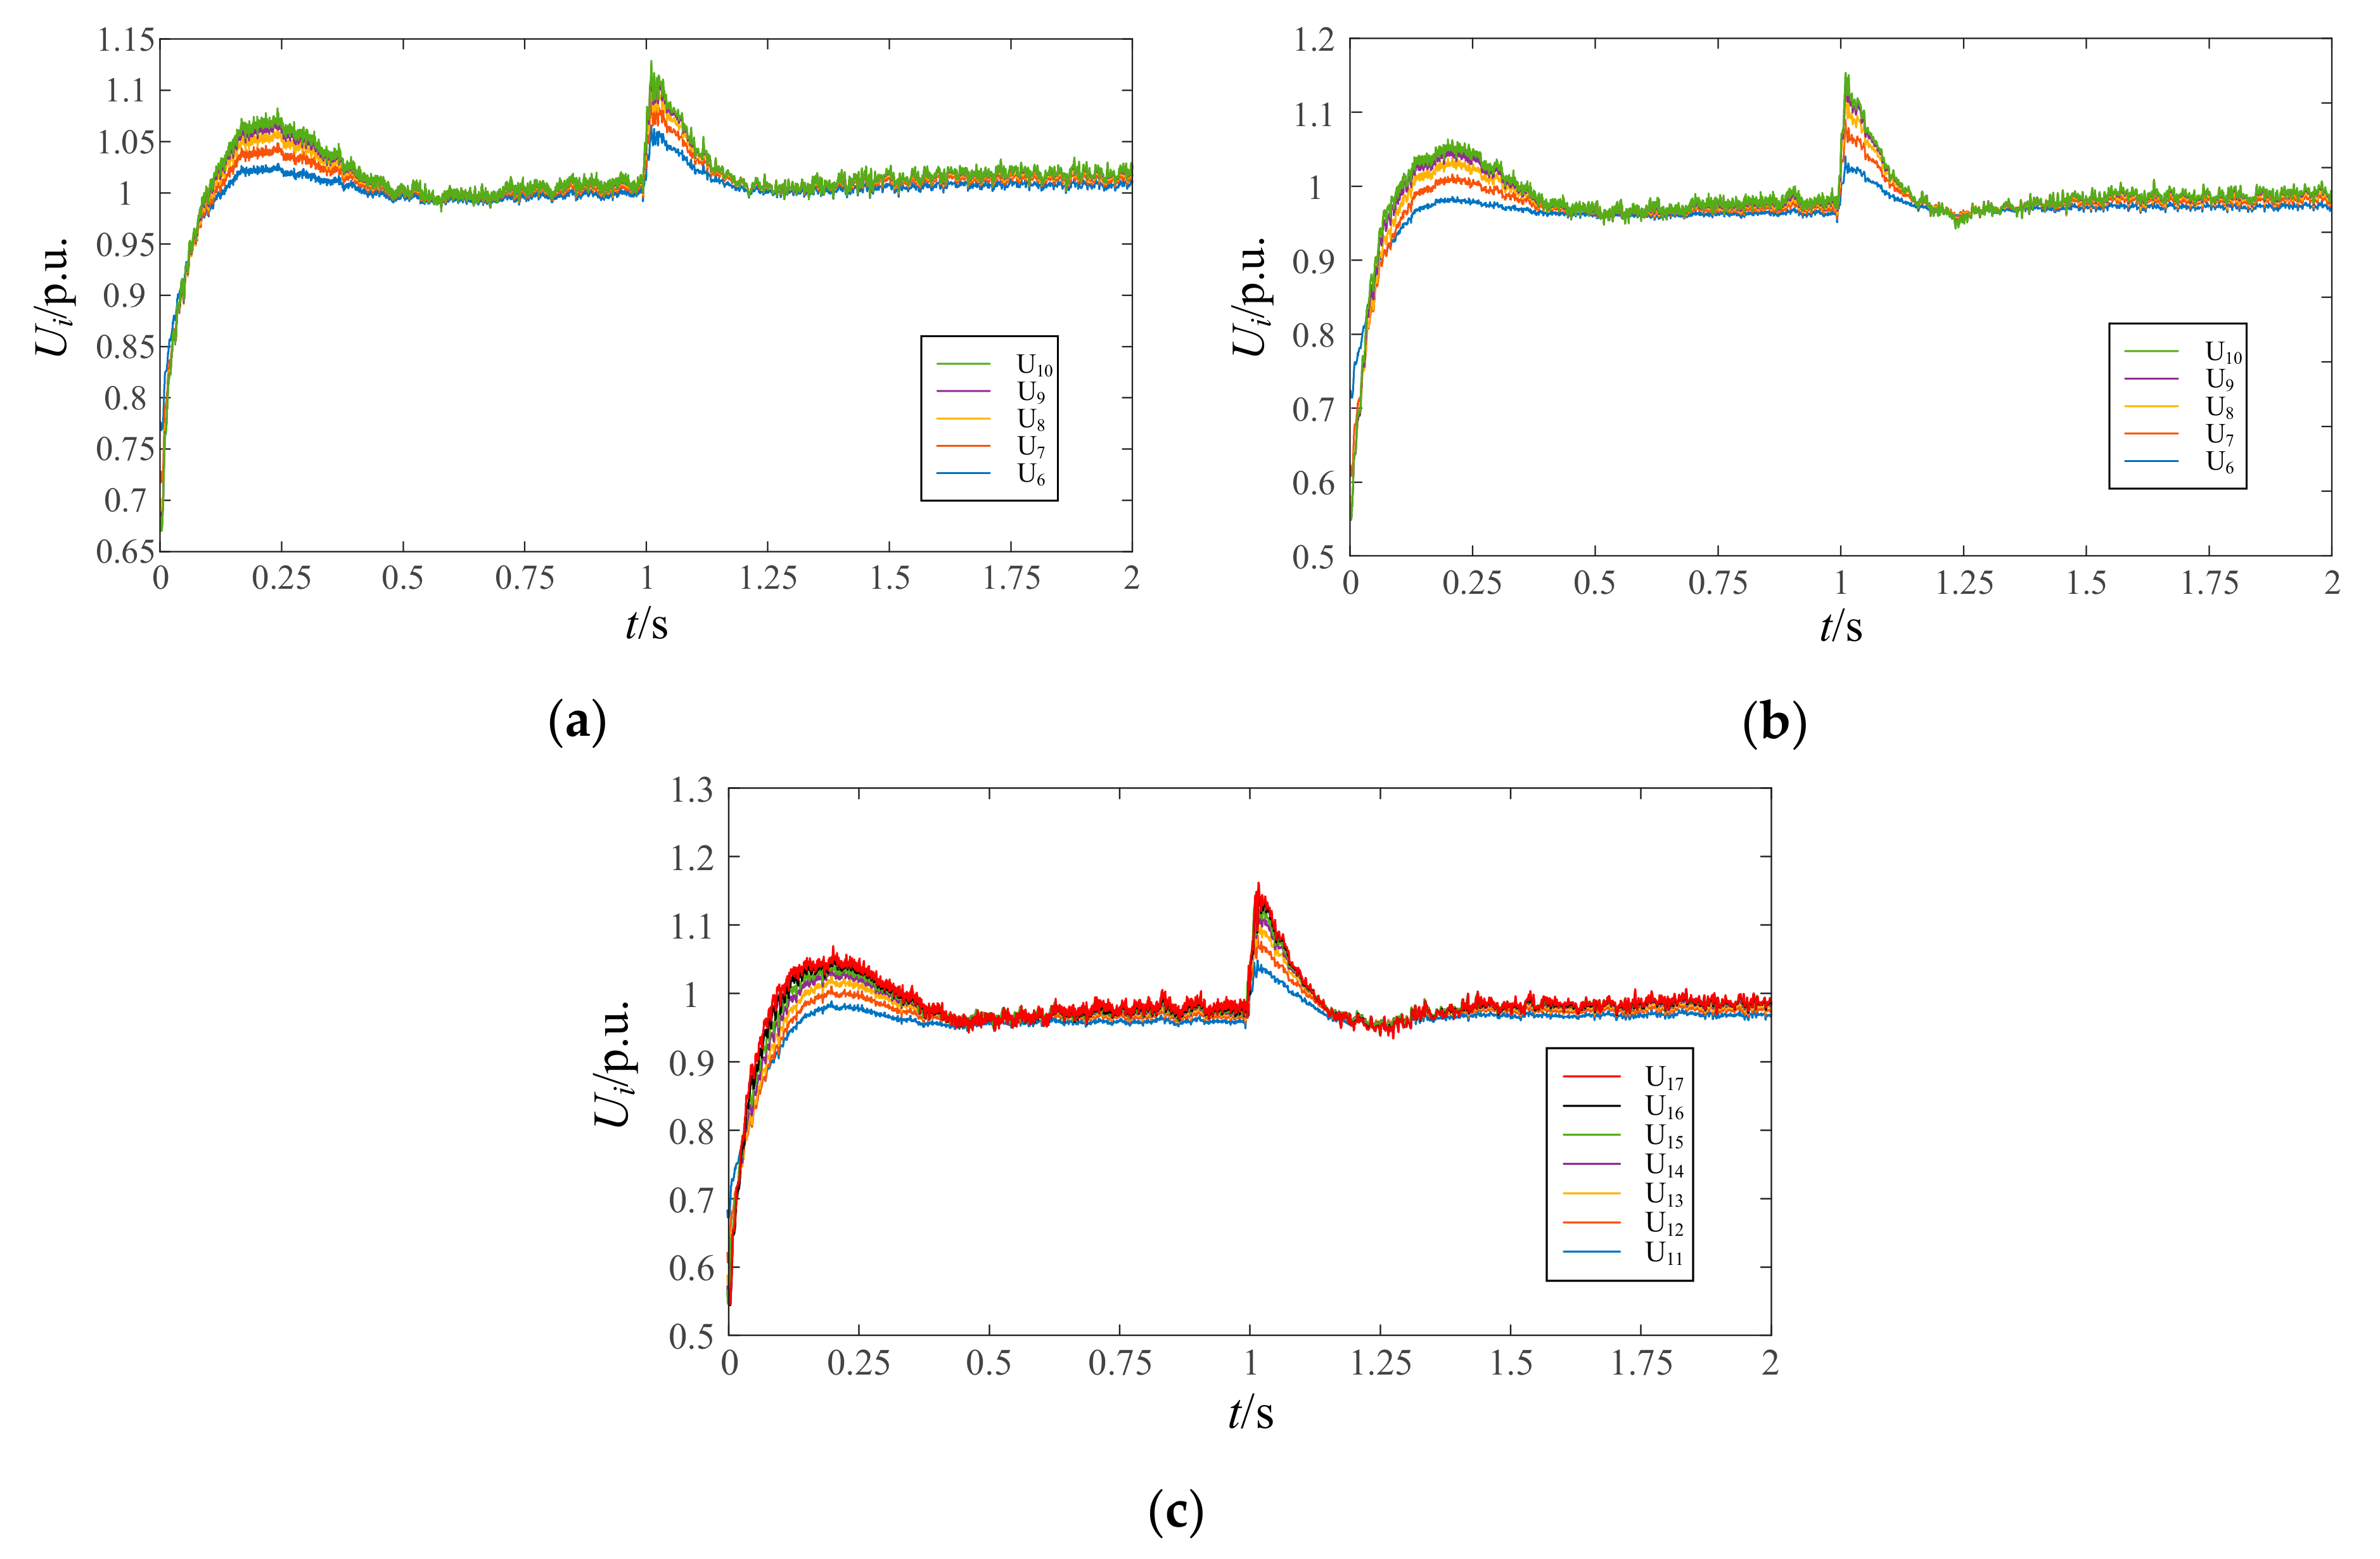
By considering the terminal voltage distribution of the wind turbines inside the wind farm, a key voltage node extraction method based HVRT strategy can guarantee the HVRT requirements are fulfilled by the wind turbines.
(3)
Simulation results showed that the VSI can effectively evaluate the HVRT capability of wind turbines in a wind farm. The proposed HVRT strategy reduced the wind farm’s ride-through index VSI, with an average of 0.056, and the average RRT was shortened to about 33 ms.

Author Contributions

Conceptualization: Y.Q., Z.C. and B.G.; Validation: Y.Q. and Z.Y.; Data curation: X.D.; Investigation: Y.Q. and X.D.; Methodology: Y.Q., Z.C. and Z.Y.; Original draft: Y.Q. and B.G.; Writing, Review and Editing: Y.Q. and Z.C. All authors have read and agreed to the published version of the manuscript.

Funding

This research is supported by State Grid Company Science and Technology Project (5230DK200009) “Fault Evolution and Ride through Technology of Wind Power Cluster via HVDC Transmission System”.

Institutional Review Board Statement

Not applicable.

Informed Consent Statement

Not applicable.

Data Availability Statement

The data presented in this study are available in article.

Conflicts of Interest

The authors declare no conflict of interest.

References

  1. Lee, J.; Yoo, Y.; Yoon, M.; Jang, G. Advanced Fault Ride-Through Strategy by an MMC HVDC Transmission for Off-Shore Wind Farm Interconnection. Appl. Sci. 2019, 9, 2522. [Google Scholar] [CrossRef] [Green Version]
  2. Yogarathinam, A.; Kaur, J.; Chaudhuri, N.R. Impact of Inertia and Effective Short Circuit Ratio on Control of Frequency in Weak Grids Interfacing LCC-HVDC and DFIG-Based Wind Farms. IEEE Trans. Power Del. 2017, 32, 2040–2051. [Google Scholar] [CrossRef]
  3. Raza, A.; Shakeel, A.; Altalbe, A.O.; Alassafi, M.; Yasin, A.R. Impacts of MT-HVDC Systems on Enhancing the Power Transmission Capability. Appl. Sci. 2020, 10, 242. [Google Scholar] [CrossRef]
  4. Zhang, Z.; Lee, J.; Jang, G. Improved Control Strategy of MMC–HVDC to Improve Frequency Support of AC System. Appl. Sci. 2020, 10, 7282. [Google Scholar] [CrossRef]
  5. Engelhardt, S.; Erlich, I.; Feltes, C.; Kretschmann, J.; Shewarega, F. Reactive Power Capability of Wind Turbines Based on Doubly Fed Induction Generators. IEEE Trans. Energy Convers. 2011, 26, 364–372. [Google Scholar] [CrossRef]
  6. Xu, H.; Ma, X.; Sun, D. Reactive Current Assignment and Control for DFIG Based Wind Turbines during Grid Voltage Sag and Swell Conditions. J. Power Electron. 2015, 15, 235–245. [Google Scholar] [CrossRef] [Green Version]
  7. Xie, Z.; Zhang, X.; Zhang, X.; Yang, S.; Wang, L. Improved Ride-Through Control of DFIG During Grid Voltage Swell. IEEE Trans. Ind. Electron. 2015, 62, 3584–3594. [Google Scholar] [CrossRef]
  8. Zhou, C.; Wang, Z.; Ju, P.; Gan, D. High-voltage Ride Through Strategy for DFIG Considering Converter Blocking of HVDC System. J. Mod. Power Syst. Clean Energy 2020, 8, 491–498. [Google Scholar] [CrossRef]
  9. Zhang, Y.; Li, Q.; Zhang, J.; Qin, S. Wind farm HVRT capability improvement based on coordinated reactive power control strategy. J. Eng. 2017, 2017, 756–761. [Google Scholar] [CrossRef]
  10. Qin, B.; Li, H.; Zhou, X.; Li, J.; Liu, W. Low-Voltage Ride-Through Techniques in DFIG-Based Wind Turbines: A Review. Appl. Sci. 2020, 10, 2154. [Google Scholar] [CrossRef] [Green Version]
  11. Monteiro Pereira, R.M.; Machado Ferreira, C.M.; Maciel Barbosa, F. Comparative study of STATCOM and SVC performance on Dynamic Voltage Collapse of an Electric Power System with Wind Generation. IEEE Latin Am. Trans. 2014, 12, 138–145. [Google Scholar] [CrossRef] [Green Version]
  12. Molinas, M.; Suul, J.A.; Undeland, T. Low Voltage Ride Through of Wind Farms with Cage Generators: STATCOM versus SVC. IEEE Trans. Power Electron. 2008, 23, 1104–1117. [Google Scholar] [CrossRef]
  13. Qi, J.; Zhao, W.; Bian, X. Comparative Study of SVC and STATCOM Reactive Power Compensation for Prosumer Microgrids with DFIG-Based Wind Farm Integration. IEEE Access 2020, 8, 209878–209885. [Google Scholar] [CrossRef]
  14. He, J.; Li, Q.; Zhang, W.; Zhao, Y. Research on capacity configuration method of concentrated reactive power compensator for wind farm LVRT capability. J. Eng. 2017, 2017, 2428–2432. [Google Scholar] [CrossRef]
  15. Cai, Y.; Li, Z.; Cai, X. Coordinated control of reactive power and voltage for wind farm aiming at voltage stability of PCC and generator terminal. Electr. Power Autom. Equip. 2018, 38, 166–173. [Google Scholar]
  16. Teleke, S.; Abdulahovic, T.; Thiringer, T.; Svensson, J. Dynamic Performance Comparison of Synchronous Condenser and SVC. IEEE Trans. Power Del. 2008, 23, 1606–1612. [Google Scholar] [CrossRef]
  17. Jin, Y.; Ding, Z.; Li, M.; Jiang, W. Comparison of New Generation Synchronous Condenser and Power Electronic Reactive-Power Compensation Devices in Application in UHV DC/AC Grid. Power Syst. Technol. 2018, 42, 2095–2102. [Google Scholar]
  18. Richard, L.; Al-Masood, N.; Saha, T.K.; Tushar, W.; Gu, H. Optimal Allocation of Synchronous Condensers in Wind Dominated Power Grids. IEEE Access. 2020, 8, 45400–45410. [Google Scholar] [CrossRef]
  19. Zhan, J.; Chen, B.; Xiong, B.; Cheng, S.; Yao, W.; Tao, X.; Wen, J. Coordinated control for improving the HVRT capability of a DFIG wind farm using a synchronous condenser. Power Syst. Prot. Control 2020, 48, 59–68. [Google Scholar]
  20. Jia, J.; Yang, G.; Nielsen, A.H.; Gevorgian, V. Investigation on the Combined Effect of VSC-Based Sources and Synchronous Condensers under Grid Unbalanced Faults. IEEE Trans. Power Del. 2019, 34, 1898–1908. [Google Scholar] [CrossRef]
  21. Jia, J.; Yang, G.; Nielsen, A.H.; Rønne-Hansen, P. Impact of VSC Control Strategies and Incorporation of Synchronous Condensers on Distance Protection under Unbalanced Faults. IEEE Trans. Ind. Electron. 2019, 66, 1108–1118. [Google Scholar] [CrossRef]
  22. Han, P.; Zhang, H.; Ding, M.; Zhang, Y.; Chen, L.; Li, B. A Coordinated HVRT Strategy of Large-Scale Wind Power Transmitted with HVDC System. Power Syst. Technol. 2018, 42, 1087–1095. [Google Scholar]
  23. Wang, W.; Chi, Y.; Zhang, Z.; Li, Y. GB/T 19963-2011 Technical Rule for Connecting Wind Farm to Power System. China Stand. 2016, 2, 86–89. [Google Scholar]
  24. Asadollah, S.; Zhu, R.; Liserre, M. Analysis of Voltage Control Strategies for Wind Farms. IEEE Trans. Sustain. Energy 2019, 11, 1002–1012. [Google Scholar] [CrossRef]
  25. Li, R.; Geng, H.; Yang, G. Fault ride-through of renewable energy conversion systems during voltage recovery. J. Mod. Power Syst. Clean Energy 2016, 4, 28–39. [Google Scholar] [CrossRef] [Green Version]
Figure 1. The topology of the wind power transmission.
Applsci 11 01248 g001
Figure 2. The equivalent circuit of the wind power transmission.
Applsci 11 01248 g002
Figure 3. Topology of a wind farm.
Applsci 11 01248 g003
Figure 4. Equivalent circuit of adjacent wind turbines.
Applsci 11 01248 g004
Figure 5. Simplified equivalent circuit of adjacent wind turbines.
Applsci 11 01248 g005
Figure 6. Generator terminal voltage distribution in the wind farm. (a) Line 1. (b) Line 2. (c) Line 3.
Applsci 11 01248 g006
Figure 7. The topology of DFIG.
Applsci 11 01248 g007
Figure 8. The equivalent circuit of doubly-fed induction generators (DFIG).
Applsci 11 01248 g008
Figure 9. The voltage distribution of all wind turbines.
Applsci 11 01248 g009
Figure 10. Division of wind turbines.
Applsci 11 01248 g010
Figure 11. Wind farm information transmission system.
Applsci 11 01248 g011
Figure 12. The coordinated control of the DFIG and synchronous condenser.
Applsci 11 01248 g012
Figure 13. The coordinated control flow chart.
Applsci 11 01248 g013
Figure 14. The generator terminal voltage variation curves, when taking the grid-connection node as the control target. (a) Line 1. (b) Line 2. (c) Line 3.
Applsci 11 01248 g014
Figure 15. The partial of generator terminal voltage variation curve, considering the grid-connection node as the control target. (a) Line 1. (b) Line 2. (c) Line 3.
Applsci 11 01248 g015aApplsci 11 01248 g015b
Figure 16. The generator terminal voltage variation curves, adopting the proposed strategy. (a) Line 1. (b) Line 2. (c) Line 3.
Applsci 11 01248 g016
Figure 17. The partial of generator terminal voltage variation curve, adopting the proposed strategy. (a) Line 1. (b) Line 2. (c) Line 3.
Applsci 11 01248 g017
Table 1. The generator terminal voltage distribution in the wind farm at 2 s.
Collection LineUi/p.u.
Line 10.99811.00291.00721.01061.0123————
Line 20.99751.00731.01571.02281.0264————
Line 30.99771.00411.00941.01281.01431.01651.0224
Table 2. Parameters of the new-type synchronous condenser.
DescriptionValue
Rated capacity300 Mvar
Rated voltage20 kV
D-axis reactance2.24 p.u.
D-axis transient reactance0.17 p.u.
D-axis sub-transient reactance0.12 p.u.
Q-axis reactance1.02 p.u.
Q-axis sub-transient reactance0.13 p.u.
D-axis open circuit transient time constant4.4849 s
D-axis open circuit sub-transient time constant0.0681 s
Q-axis open circuit transient time constant0.1 s
Table 3. Parameters of DFIG.
DescriptionValue
Rated capacity3 MW
Stator impedance0.023 p.u.
Stator inductance0.18 p.u.
Rotor impedance0.016 p.u.
Rotor inductance0.16 p.u.
Magnetizing inductance2.9 p.u.
Wind speed (constant)11 m/s
Table 4. HVRT indicators, considering the grid-connection node as the control target.
Collection LineVSIRTT/ms
Line 11.04159.838
Line 21.07483.855
Line 31.10484.450
Table 5. HVRT indicators considering the proposed key node as the control target.
Collection LineVSIRTT/ms
Line 11.00429.712
Line 21.01942.854
Line 31.02757.241
Publisher’s Note: MDPI stays neutral with regard to jurisdictional claims in published maps and institutional affiliations.

